Pittsford, NY Map & Demographics
Pittsford Map
Pittsford Overview
$64,365
PER CAPITA INCOME
$150,250
AVG FAMILY INCOME
$116,250
AVG HOUSEHOLD INCOME
23.7%
WAGE / INCOME GAP [ % ]
76.3¢/ $1
WAGE / INCOME GAP [ $ ]
0.41
INEQUALITY / GINI INDEX
1,644
TOTAL POPULATION
777
MALE POPULATION
867
FEMALE POPULATION
89.62
MALES / 100 FEMALES
111.58
FEMALES / 100 MALES
40.4
MEDIAN AGE
3.1
AVG FAMILY SIZE
2.4
AVG HOUSEHOLD SIZE
930
LABOR FORCE [ PEOPLE ]
73.2%
PERCENT IN LABOR FORCE
1.9%
UNEMPLOYMENT RATE
Pittsford Zip Codes
Pittsford Area Codes
Income in Pittsford
Income Overview in Pittsford
Per Capita Income in Pittsford is $64,365, while median incomes of families and households are $150,250 and $116,250 respectively.
| Characteristic | Number | Measure |
| Per Capita Income | 1,644 | $64,365 |
| Median Family Income | 429 | $150,250 |
| Mean Family Income | 429 | $178,826 |
| Median Household Income | 684 | $116,250 |
| Mean Household Income | 684 | $153,774 |
| Income Deficit | 429 | $0 |
| Wage / Income Gap (%) | 1,644 | 23.69% |
| Wage / Income Gap ($) | 1,644 | 76.31¢ per $1 |
| Gini / Inequality Index | 1,644 | 0.41 |
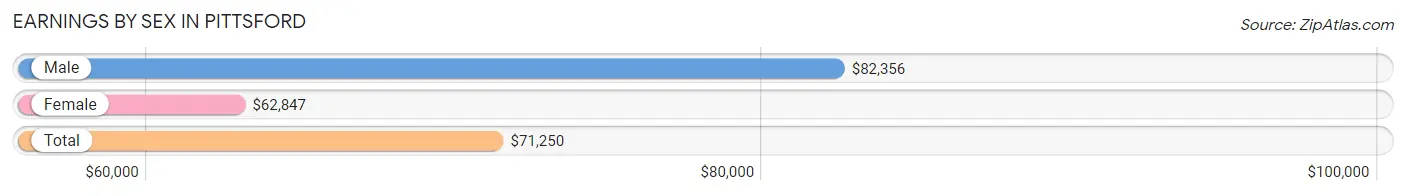
Earnings by Sex in Pittsford
Average Earnings in Pittsford are $71,250, $82,356 for men and $62,847 for women, a difference of 23.7%.
| Sex | Number | Average Earnings |
| Male | 477 (48.7%) | $82,356 |
| Female | 503 (51.3%) | $62,847 |
| Total | 980 (100.0%) | $71,250 |
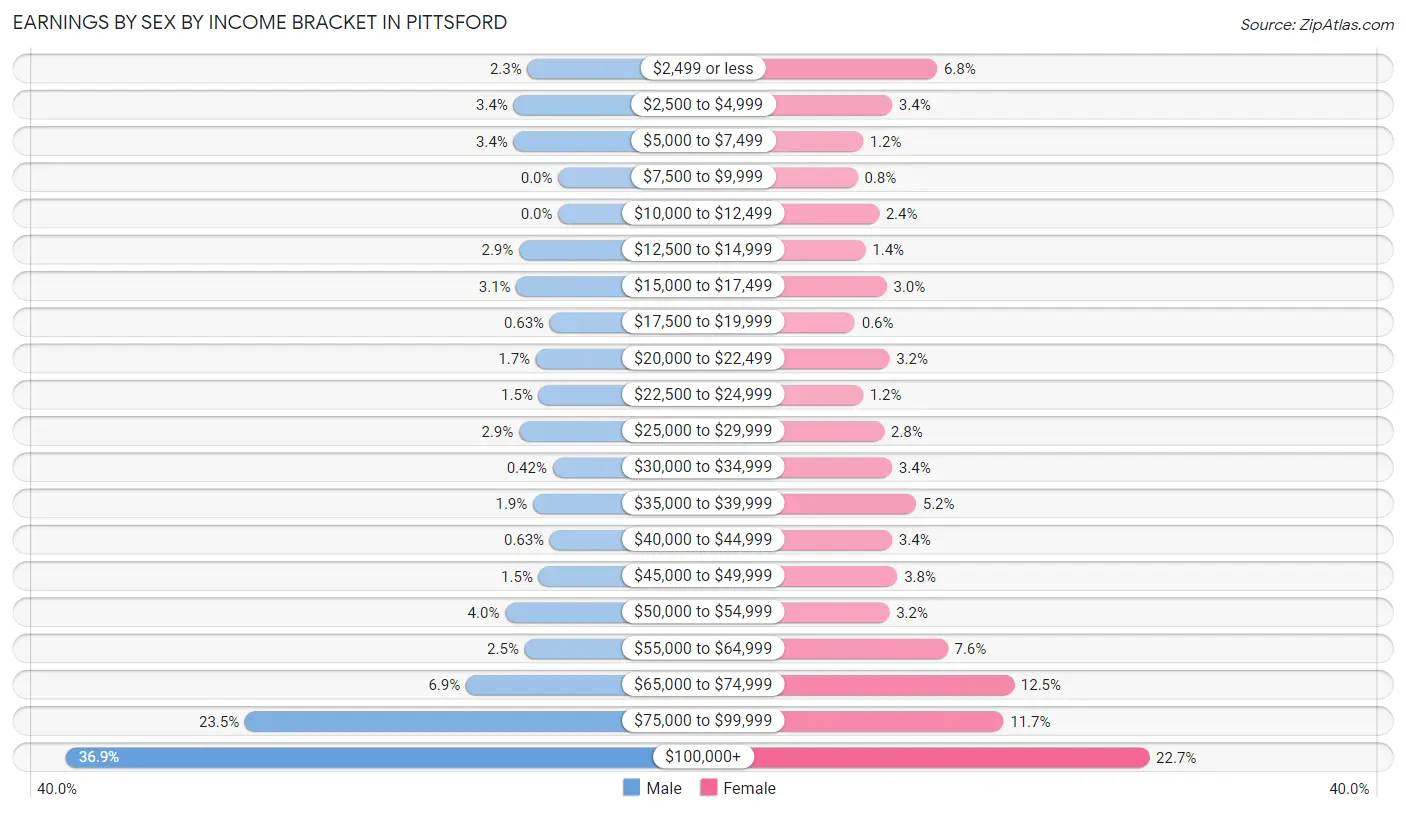
Earnings by Sex by Income Bracket in Pittsford
The most common earnings brackets in Pittsford are $100,000+ for men (176 | 36.9%) and $100,000+ for women (114 | 22.7%).
| Income | Male | Female |
| $2,499 or less | 11 (2.3%) | 34 (6.8%) |
| $2,500 to $4,999 | 16 (3.4%) | 17 (3.4%) |
| $5,000 to $7,499 | 16 (3.4%) | 6 (1.2%) |
| $7,500 to $9,999 | 0 (0.0%) | 4 (0.8%) |
| $10,000 to $12,499 | 0 (0.0%) | 12 (2.4%) |
| $12,500 to $14,999 | 14 (2.9%) | 7 (1.4%) |
| $15,000 to $17,499 | 15 (3.1%) | 15 (3.0%) |
| $17,500 to $19,999 | 3 (0.6%) | 3 (0.6%) |
| $20,000 to $22,499 | 8 (1.7%) | 16 (3.2%) |
| $22,500 to $24,999 | 7 (1.5%) | 6 (1.2%) |
| $25,000 to $29,999 | 14 (2.9%) | 14 (2.8%) |
| $30,000 to $34,999 | 2 (0.4%) | 17 (3.4%) |
| $35,000 to $39,999 | 9 (1.9%) | 26 (5.2%) |
| $40,000 to $44,999 | 3 (0.6%) | 17 (3.4%) |
| $45,000 to $49,999 | 7 (1.5%) | 19 (3.8%) |
| $50,000 to $54,999 | 19 (4.0%) | 16 (3.2%) |
| $55,000 to $64,999 | 12 (2.5%) | 38 (7.5%) |
| $65,000 to $74,999 | 33 (6.9%) | 63 (12.5%) |
| $75,000 to $99,999 | 112 (23.5%) | 59 (11.7%) |
| $100,000+ | 176 (36.9%) | 114 (22.7%) |
| Total | 477 (100.0%) | 503 (100.0%) |
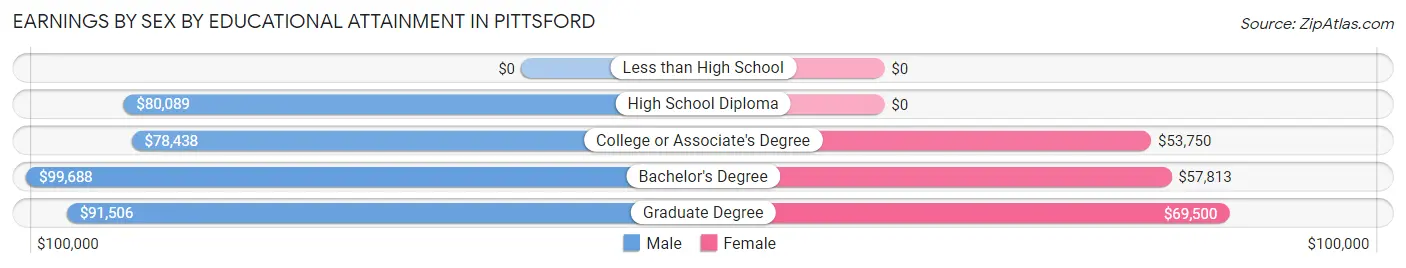
Earnings by Sex by Educational Attainment in Pittsford
Average earnings in Pittsford are $90,513 for men and $65,721 for women, a difference of 27.4%. Men with an educational attainment of bachelor's degree enjoy the highest average annual earnings of $99,688, while those with college or associate's degree education earn the least with $78,438. Women with an educational attainment of graduate degree earn the most with the average annual earnings of $69,500, while those with college or associate's degree education have the smallest earnings of $53,750.
| Educational Attainment | Male Income | Female Income |
| Less than High School | - | - |
| High School Diploma | $80,089 | $0 |
| College or Associate's Degree | $78,438 | $53,750 |
| Bachelor's Degree | $99,688 | $57,813 |
| Graduate Degree | $91,506 | $69,500 |
| Total | $90,513 | $65,721 |
Family Income in Pittsford
Family Income Brackets in Pittsford
According to the Pittsford family income data, there are 119 families falling into the $200,000+ income range, which is the most common income bracket and makes up 27.7% of all families.
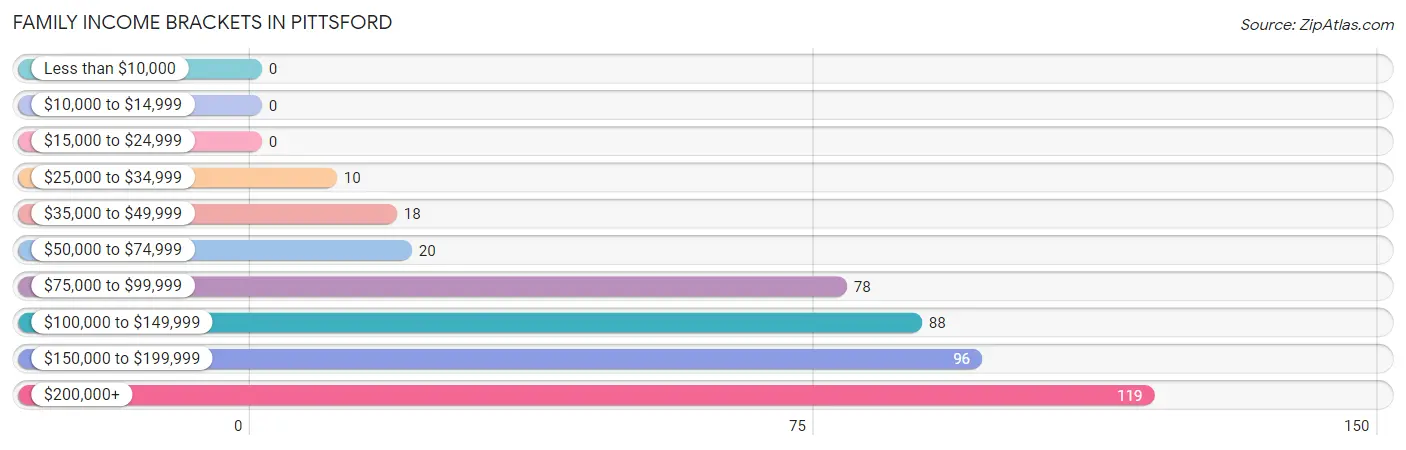
| Income Bracket | # Families | % Families |
| Less than $10,000 | 0 | 0.0% |
| $10,000 to $14,999 | 0 | 0.0% |
| $15,000 to $24,999 | 0 | 0.0% |
| $25,000 to $34,999 | 10 | 2.3% |
| $35,000 to $49,999 | 18 | 4.2% |
| $50,000 to $74,999 | 20 | 4.7% |
| $75,000 to $99,999 | 78 | 18.2% |
| $100,000 to $149,999 | 88 | 20.5% |
| $150,000 to $199,999 | 96 | 22.4% |
| $200,000+ | 119 | 27.7% |
Family Income by Famaliy Size in Pittsford
4-person families (107 | 24.9%) account for the highest median family income in Pittsford with $195,493 per family, while 2-person families (205 | 47.8%) have the highest median income of $72,188 per family member.
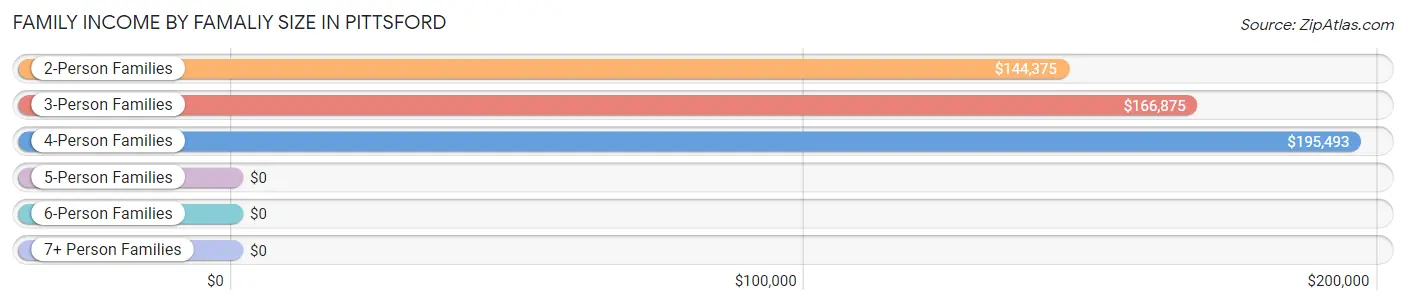
| Income Bracket | # Families | Median Income |
| 2-Person Families | 205 (47.8%) | $144,375 |
| 3-Person Families | 64 (14.9%) | $166,875 |
| 4-Person Families | 107 (24.9%) | $195,493 |
| 5-Person Families | 46 (10.7%) | $0 |
| 6-Person Families | 4 (0.9%) | $0 |
| 7+ Person Families | 3 (0.7%) | $0 |
| Total | 429 (100.0%) | $150,250 |
Family Income by Number of Earners in Pittsford
The median family income in Pittsford is $150,250, with families comprising 3+ earners (40) having the highest median family income of $250,001, while families with no earners (41) have the lowest median family income of $86,458, accounting for 9.3% and 9.6% of families, respectively.
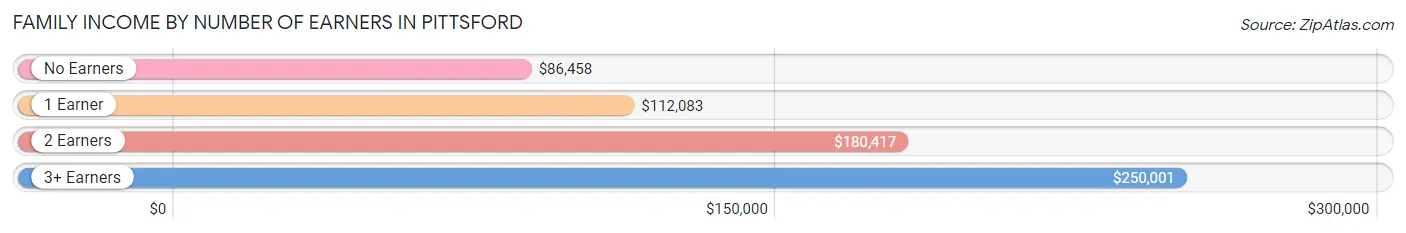
| Number of Earners | # Families | Median Income |
| No Earners | 41 (9.6%) | $86,458 |
| 1 Earner | 93 (21.7%) | $112,083 |
| 2 Earners | 255 (59.4%) | $180,417 |
| 3+ Earners | 40 (9.3%) | $250,001 |
| Total | 429 (100.0%) | $150,250 |
Household Income in Pittsford
Household Income Brackets in Pittsford
With 158 households falling in the category, the $200,000+ income range is the most frequent in Pittsford, accounting for 23.1% of all households. In contrast, only 7 households (1.0%) fall into the $10,000 to $14,999 income bracket, making it the least populous group.
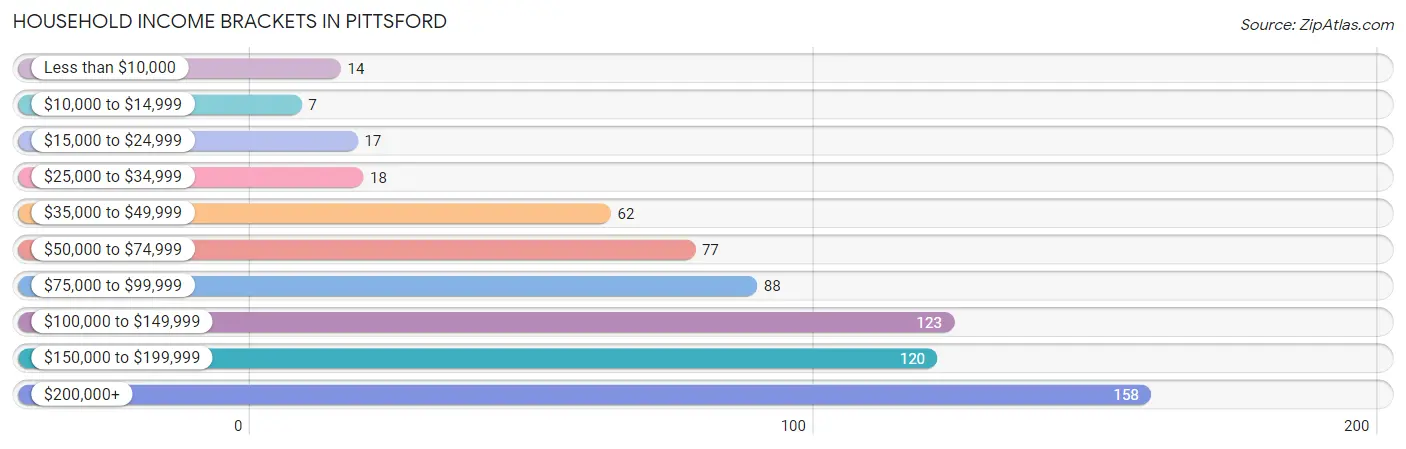
| Income Bracket | # Households | % Households |
| Less than $10,000 | 14 | 2.0% |
| $10,000 to $14,999 | 7 | 1.0% |
| $15,000 to $24,999 | 17 | 2.5% |
| $25,000 to $34,999 | 18 | 2.6% |
| $35,000 to $49,999 | 62 | 9.1% |
| $50,000 to $74,999 | 77 | 11.3% |
| $75,000 to $99,999 | 88 | 12.9% |
| $100,000 to $149,999 | 123 | 18.0% |
| $150,000 to $199,999 | 120 | 17.5% |
| $200,000+ | 158 | 23.1% |
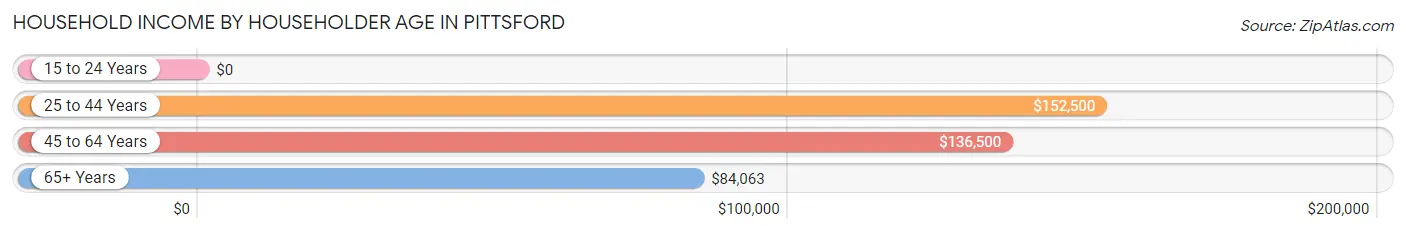
Household Income by Householder Age in Pittsford
The median household income in Pittsford is $116,250, with the highest median household income of $152,500 found in the 25 to 44 years age bracket for the primary householder. A total of 240 households (35.1%) fall into this category. Meanwhile, the 15 to 24 years age bracket for the primary householder has the lowest median household income of $0, with 7 households (1.0%) in this group.
| Income Bracket | # Households | Median Income |
| 15 to 24 Years | 7 (1.0%) | $0 |
| 25 to 44 Years | 240 (35.1%) | $152,500 |
| 45 to 64 Years | 264 (38.6%) | $136,500 |
| 65+ Years | 173 (25.3%) | $84,063 |
| Total | 684 (100.0%) | $116,250 |
Poverty in Pittsford
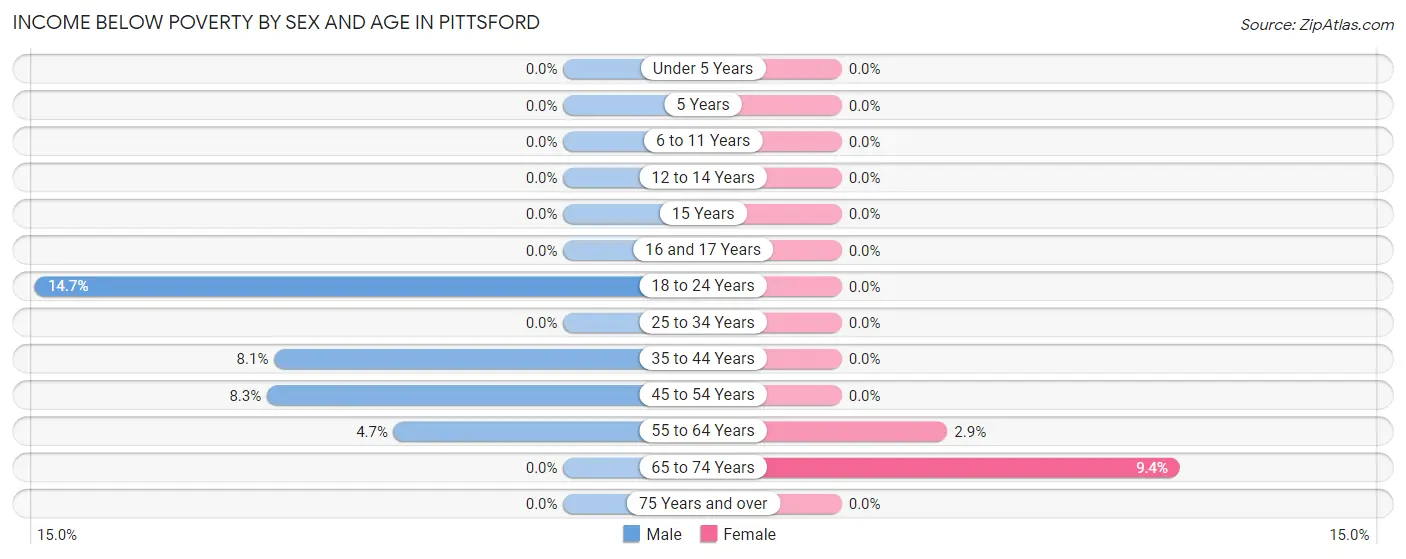
Income Below Poverty by Sex and Age in Pittsford
With 3.9% poverty level for males and 1.5% for females among the residents of Pittsford, 18 to 24 year old males and 65 to 74 year old females are the most vulnerable to poverty, with 5 males (14.7%) and 8 females (9.4%) in their respective age groups living below the poverty level.
| Age Bracket | Male | Female |
| Under 5 Years | 0 (0.0%) | 0 (0.0%) |
| 5 Years | 0 (0.0%) | 0 (0.0%) |
| 6 to 11 Years | 0 (0.0%) | 0 (0.0%) |
| 12 to 14 Years | 0 (0.0%) | 0 (0.0%) |
| 15 Years | 0 (0.0%) | 0 (0.0%) |
| 16 and 17 Years | 0 (0.0%) | 0 (0.0%) |
| 18 to 24 Years | 5 (14.7%) | 0 (0.0%) |
| 25 to 34 Years | 0 (0.0%) | 0 (0.0%) |
| 35 to 44 Years | 12 (8.1%) | 0 (0.0%) |
| 45 to 54 Years | 8 (8.3%) | 0 (0.0%) |
| 55 to 64 Years | 5 (4.7%) | 5 (2.9%) |
| 65 to 74 Years | 0 (0.0%) | 8 (9.4%) |
| 75 Years and over | 0 (0.0%) | 0 (0.0%) |
| Total | 30 (3.9%) | 13 (1.5%) |
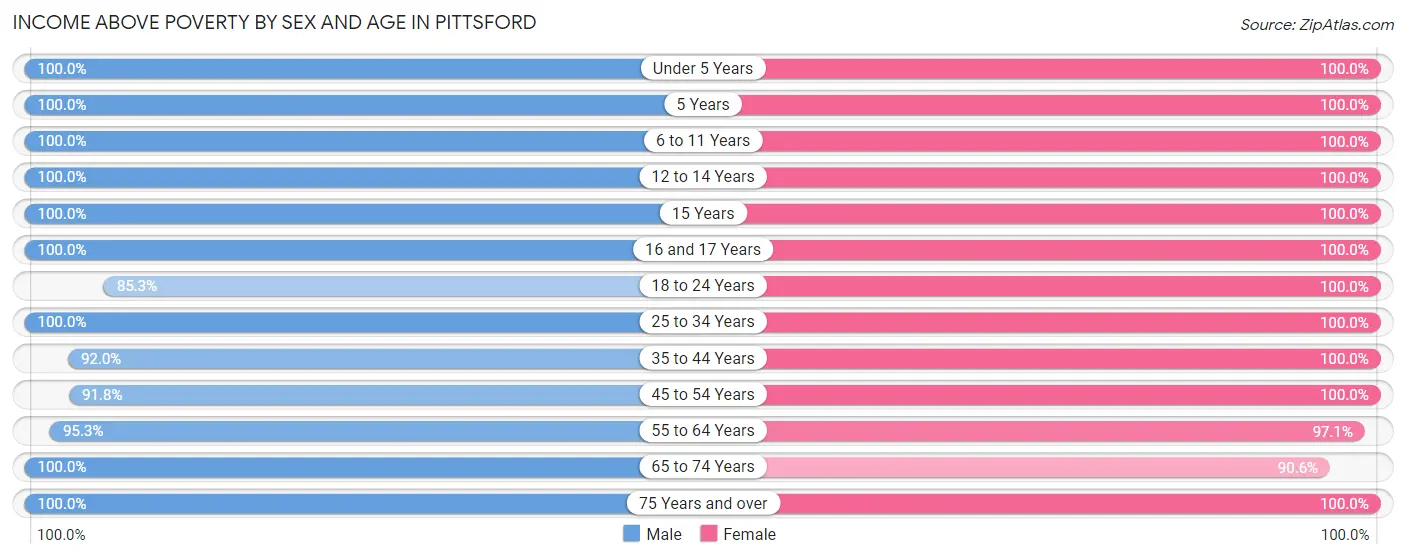
Income Above Poverty by Sex and Age in Pittsford
According to the poverty statistics in Pittsford, males aged under 5 years and females aged under 5 years are the age groups that are most secure financially, with 100.0% of males and 100.0% of females in these age groups living above the poverty line.
| Age Bracket | Male | Female |
| Under 5 Years | 89 (100.0%) | 61 (100.0%) |
| 5 Years | 8 (100.0%) | 5 (100.0%) |
| 6 to 11 Years | 51 (100.0%) | 60 (100.0%) |
| 12 to 14 Years | 38 (100.0%) | 39 (100.0%) |
| 15 Years | 11 (100.0%) | 5 (100.0%) |
| 16 and 17 Years | 21 (100.0%) | 21 (100.0%) |
| 18 to 24 Years | 29 (85.3%) | 45 (100.0%) |
| 25 to 34 Years | 62 (100.0%) | 81 (100.0%) |
| 35 to 44 Years | 137 (91.9%) | 142 (100.0%) |
| 45 to 54 Years | 89 (91.7%) | 89 (100.0%) |
| 55 to 64 Years | 101 (95.3%) | 165 (97.1%) |
| 65 to 74 Years | 67 (100.0%) | 77 (90.6%) |
| 75 Years and over | 37 (100.0%) | 64 (100.0%) |
| Total | 740 (96.1%) | 854 (98.5%) |
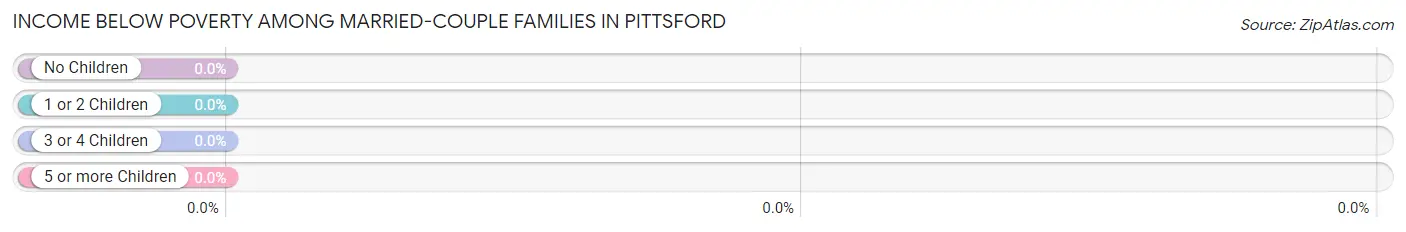
Income Below Poverty Among Married-Couple Families in Pittsford
| Children | Above Poverty | Below Poverty |
| No Children | 207 (100.0%) | 0 (0.0%) |
| 1 or 2 Children | 151 (100.0%) | 0 (0.0%) |
| 3 or 4 Children | 34 (100.0%) | 0 (0.0%) |
| 5 or more Children | 3 (100.0%) | 0 (0.0%) |
| Total | 395 (100.0%) | 0 (0.0%) |
Income Below Poverty Among Single-Parent Households in Pittsford
| Children | Single Father | Single Mother |
| No Children | 0 (0.0%) | 0 (0.0%) |
| 1 or 2 Children | 0 (0.0%) | 0 (0.0%) |
| 3 or 4 Children | 0 (0.0%) | 0 (0.0%) |
| 5 or more Children | 0 (0.0%) | 0 (0.0%) |
| Total | 0 (0.0%) | 0 (0.0%) |
Income Below Poverty Among Married-Couple vs Single-Parent Households in Pittsford
| Children | Married-Couple Families | Single-Parent Households |
| No Children | 0 (0.0%) | 0 (0.0%) |
| 1 or 2 Children | 0 (0.0%) | 0 (0.0%) |
| 3 or 4 Children | 0 (0.0%) | 0 (0.0%) |
| 5 or more Children | 0 (0.0%) | 0 (0.0%) |
| Total | 0 (0.0%) | 0 (0.0%) |
Race in Pittsford
The most populous races in Pittsford are White / Caucasian (1,512 | 92.0%), Hispanic or Latino (197 | 12.0%), and Two or more Races (75 | 4.6%).
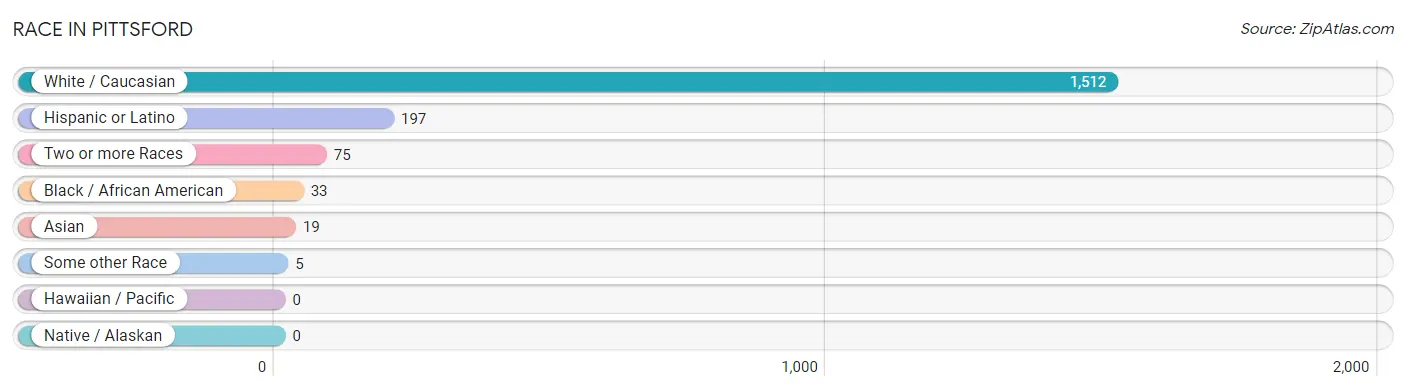
| Race | # Population | % Population |
| Asian | 19 | 1.2% |
| Black / African American | 33 | 2.0% |
| Hawaiian / Pacific | 0 | 0.0% |
| Hispanic or Latino | 197 | 12.0% |
| Native / Alaskan | 0 | 0.0% |
| White / Caucasian | 1,512 | 92.0% |
| Two or more Races | 75 | 4.6% |
| Some other Race | 5 | 0.3% |
| Total | 1,644 | 100.0% |
Ancestry in Pittsford
The most populous ancestries reported in Pittsford are German (470 | 28.6%), Irish (407 | 24.8%), English (216 | 13.1%), Italian (209 | 12.7%), and Polish (204 | 12.4%), together accounting for 91.6% of all Pittsford residents.
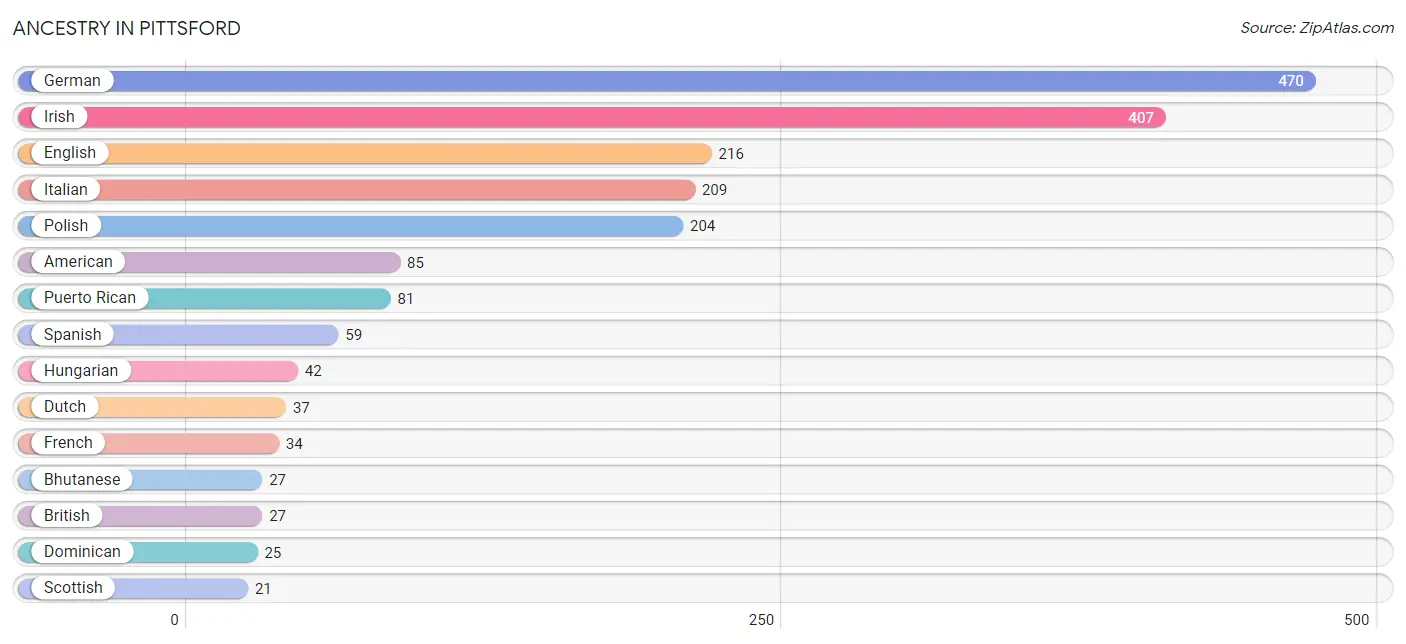
| Ancestry | # Population | % Population |
| American | 85 | 5.2% |
| Arab | 10 | 0.6% |
| Australian | 15 | 0.9% |
| Austrian | 8 | 0.5% |
| Belgian | 4 | 0.2% |
| Bhutanese | 27 | 1.6% |
| Bolivian | 14 | 0.9% |
| Brazilian | 12 | 0.7% |
| British | 27 | 1.6% |
| Burmese | 11 | 0.7% |
| Canadian | 2 | 0.1% |
| Celtic | 4 | 0.2% |
| Colombian | 5 | 0.3% |
| Czech | 7 | 0.4% |
| Dominican | 25 | 1.5% |
| Dutch | 37 | 2.2% |
| Eastern European | 4 | 0.2% |
| English | 216 | 13.1% |
| European | 9 | 0.5% |
| French | 34 | 2.1% |
| German | 470 | 28.6% |
| Greek | 6 | 0.4% |
| Haitian | 7 | 0.4% |
| Hungarian | 42 | 2.5% |
| Indian (Asian) | 6 | 0.4% |
| Irish | 407 | 24.8% |
| Italian | 209 | 12.7% |
| Lebanese | 10 | 0.6% |
| Liberian | 14 | 0.9% |
| Lithuanian | 11 | 0.7% |
| Mexican | 3 | 0.2% |
| Norwegian | 5 | 0.3% |
| Polish | 204 | 12.4% |
| Portuguese | 6 | 0.4% |
| Puerto Rican | 81 | 4.9% |
| Russian | 18 | 1.1% |
| Scottish | 21 | 1.3% |
| Slovak | 12 | 0.7% |
| South African | 2 | 0.1% |
| South American | 19 | 1.2% |
| Spaniard | 10 | 0.6% |
| Spanish | 59 | 3.6% |
| Subsaharan African | 16 | 1.0% |
| Swedish | 14 | 0.9% |
| Swiss | 5 | 0.3% |
| Ukrainian | 19 | 1.2% |
| Welsh | 19 | 1.2% | View All 47 Rows |
Immigrants in Pittsford
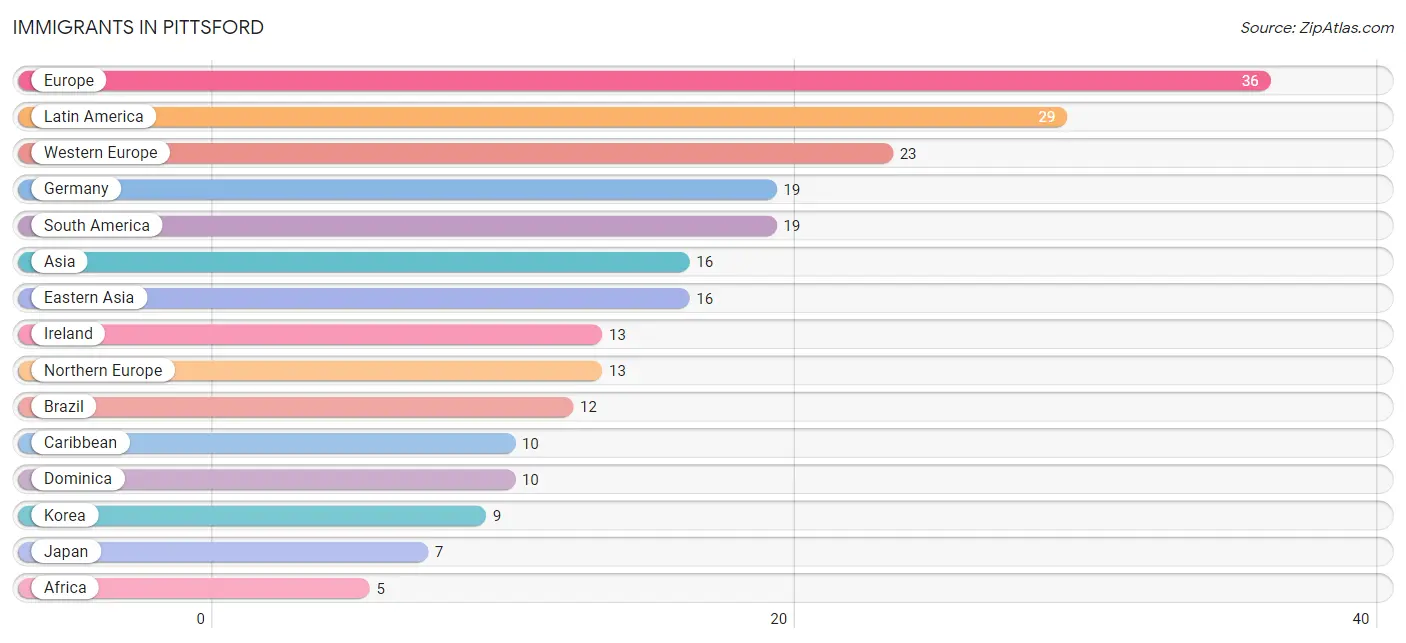
The most numerous immigrant groups reported in Pittsford came from Europe (36 | 2.2%), Latin America (29 | 1.8%), Western Europe (23 | 1.4%), Germany (19 | 1.2%), and South America (19 | 1.2%), together accounting for 7.7% of all Pittsford residents.
| Immigration Origin | # Population | % Population |
| Africa | 5 | 0.3% |
| Asia | 16 | 1.0% |
| Australia | 5 | 0.3% |
| Bolivia | 2 | 0.1% |
| Brazil | 12 | 0.7% |
| Canada | 2 | 0.1% |
| Caribbean | 10 | 0.6% |
| Colombia | 5 | 0.3% |
| Dominica | 10 | 0.6% |
| Eastern Asia | 16 | 1.0% |
| Europe | 36 | 2.2% |
| Germany | 19 | 1.2% |
| Ireland | 13 | 0.8% |
| Japan | 7 | 0.4% |
| Korea | 9 | 0.5% |
| Latin America | 29 | 1.8% |
| Netherlands | 4 | 0.2% |
| Northern Africa | 3 | 0.2% |
| Northern Europe | 13 | 0.8% |
| Oceania | 5 | 0.3% |
| South Africa | 2 | 0.1% |
| South America | 19 | 1.2% |
| Sudan | 3 | 0.2% |
| Western Europe | 23 | 1.4% | View All 24 Rows |
Sex and Age in Pittsford
Sex and Age in Pittsford
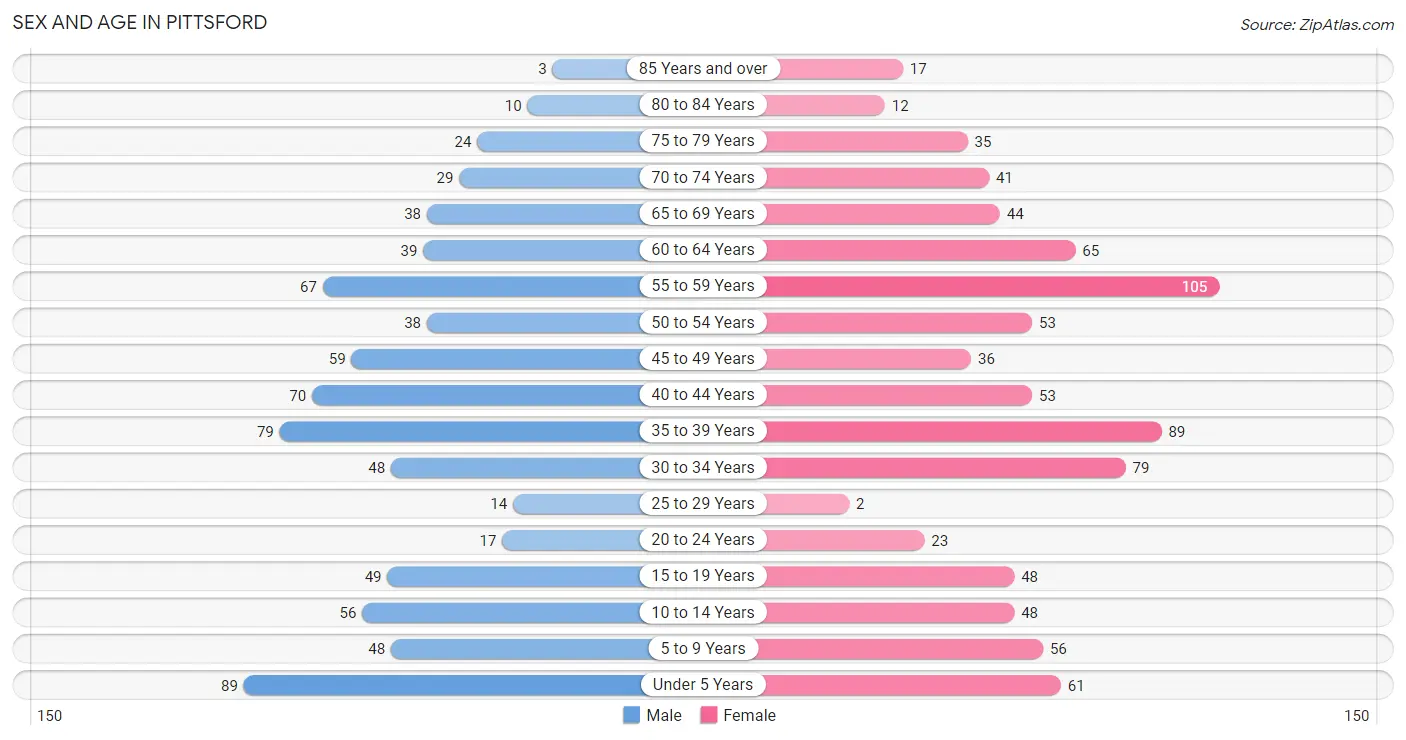
The most populous age groups in Pittsford are Under 5 Years (89 | 11.5%) for men and 55 to 59 Years (105 | 12.1%) for women.
| Age Bracket | Male | Female |
| Under 5 Years | 89 (11.5%) | 61 (7.0%) |
| 5 to 9 Years | 48 (6.2%) | 56 (6.5%) |
| 10 to 14 Years | 56 (7.2%) | 48 (5.5%) |
| 15 to 19 Years | 49 (6.3%) | 48 (5.5%) |
| 20 to 24 Years | 17 (2.2%) | 23 (2.6%) |
| 25 to 29 Years | 14 (1.8%) | 2 (0.2%) |
| 30 to 34 Years | 48 (6.2%) | 79 (9.1%) |
| 35 to 39 Years | 79 (10.2%) | 89 (10.3%) |
| 40 to 44 Years | 70 (9.0%) | 53 (6.1%) |
| 45 to 49 Years | 59 (7.6%) | 36 (4.2%) |
| 50 to 54 Years | 38 (4.9%) | 53 (6.1%) |
| 55 to 59 Years | 67 (8.6%) | 105 (12.1%) |
| 60 to 64 Years | 39 (5.0%) | 65 (7.5%) |
| 65 to 69 Years | 38 (4.9%) | 44 (5.1%) |
| 70 to 74 Years | 29 (3.7%) | 41 (4.7%) |
| 75 to 79 Years | 24 (3.1%) | 35 (4.0%) |
| 80 to 84 Years | 10 (1.3%) | 12 (1.4%) |
| 85 Years and over | 3 (0.4%) | 17 (2.0%) |
| Total | 777 (100.0%) | 867 (100.0%) |
Families and Households in Pittsford
Median Family Size in Pittsford
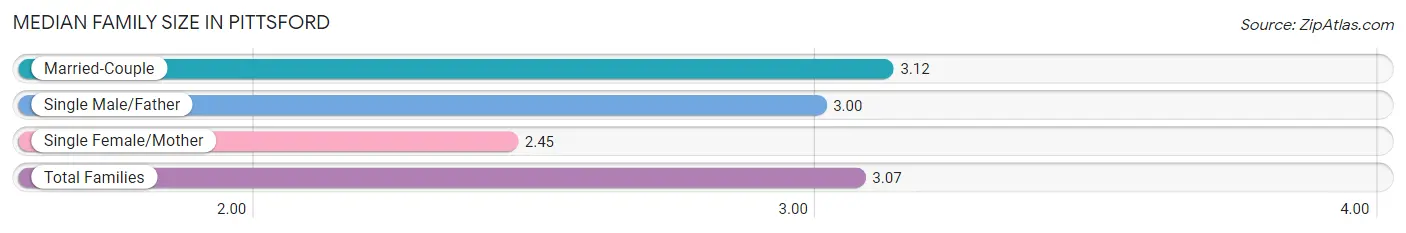
The median family size in Pittsford is 3.07 persons per family, with married-couple families (395 | 92.1%) accounting for the largest median family size of 3.12 persons per family. On the other hand, single female/mother families (31 | 7.2%) represent the smallest median family size with 2.45 persons per family.
| Family Type | # Families | Family Size |
| Married-Couple | 395 (92.1%) | 3.12 |
| Single Male/Father | 3 (0.7%) | 3.00 |
| Single Female/Mother | 31 (7.2%) | 2.45 |
| Total Families | 429 (100.0%) | 3.07 |
Median Household Size in Pittsford
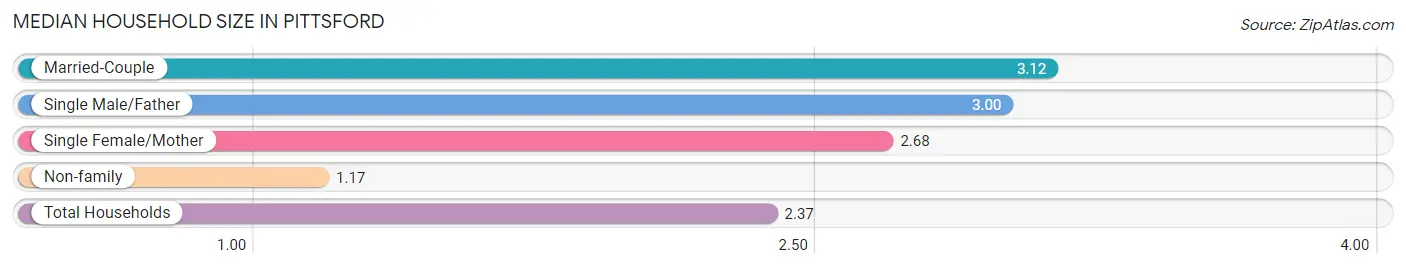
The median household size in Pittsford is 2.37 persons per household, with married-couple households (395 | 57.8%) accounting for the largest median household size of 3.12 persons per household. non-family households (255 | 37.3%) represent the smallest median household size with 1.17 persons per household.
| Household Type | # Households | Household Size |
| Married-Couple | 395 (57.8%) | 3.12 |
| Single Male/Father | 3 (0.4%) | 3.00 |
| Single Female/Mother | 31 (4.5%) | 2.68 |
| Non-family | 255 (37.3%) | 1.17 |
| Total Households | 684 (100.0%) | 2.37 |
Household Size by Marriage Status in Pittsford
Out of a total of 684 households in Pittsford, 429 (62.7%) are family households, while 255 (37.3%) are nonfamily households. The most numerous type of family households are 2-person households, comprising 205, and the most common type of nonfamily households are 1-person households, comprising 209.
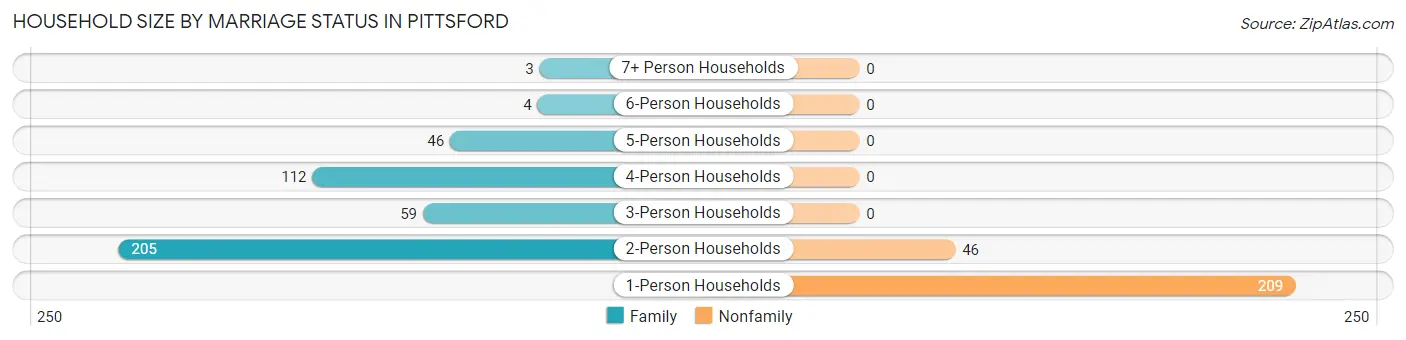
| Household Size | Family Households | Nonfamily Households |
| 1-Person Households | - | 209 (30.6%) |
| 2-Person Households | 205 (30.0%) | 46 (6.7%) |
| 3-Person Households | 59 (8.6%) | 0 (0.0%) |
| 4-Person Households | 112 (16.4%) | 0 (0.0%) |
| 5-Person Households | 46 (6.7%) | 0 (0.0%) |
| 6-Person Households | 4 (0.6%) | 0 (0.0%) |
| 7+ Person Households | 3 (0.4%) | 0 (0.0%) |
| Total | 429 (62.7%) | 255 (37.3%) |
Female Fertility in Pittsford
Fertility by Age in Pittsford
Average fertility rate in Pittsford is 74.0 births per 1,000 women. Women in the age bracket of 20 to 34 years have the highest fertility rate with 87.0 births per 1,000 women. Women in the age bracket of 35 to 50 years acount for 64.0% of all women with births.
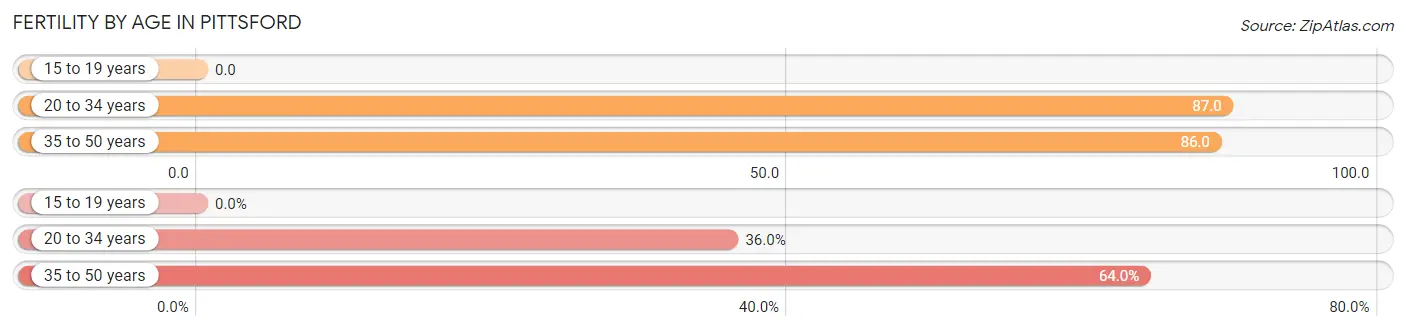
| Age Bracket | Women with Births | Births / 1,000 Women |
| 15 to 19 years | 0 (0.0%) | 0.0 |
| 20 to 34 years | 9 (36.0%) | 87.0 |
| 35 to 50 years | 16 (64.0%) | 86.0 |
| Total | 25 (100.0%) | 74.0 |
Fertility by Age by Marriage Status in Pittsford
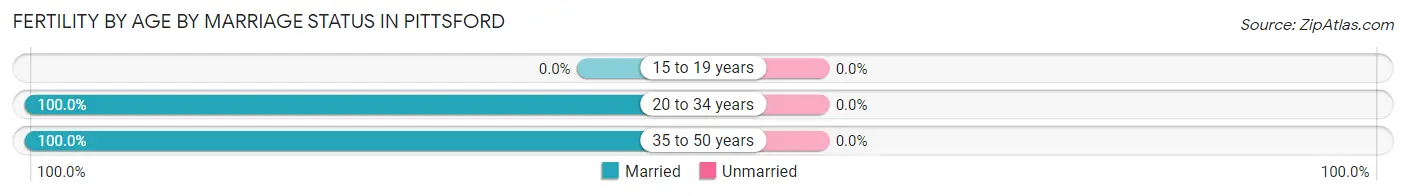
| Age Bracket | Married | Unmarried |
| 15 to 19 years | 0 (0.0%) | 0 (0.0%) |
| 20 to 34 years | 9 (100.0%) | 0 (0.0%) |
| 35 to 50 years | 16 (100.0%) | 0 (0.0%) |
| Total | 25 (100.0%) | 0 (0.0%) |
Fertility by Education in Pittsford
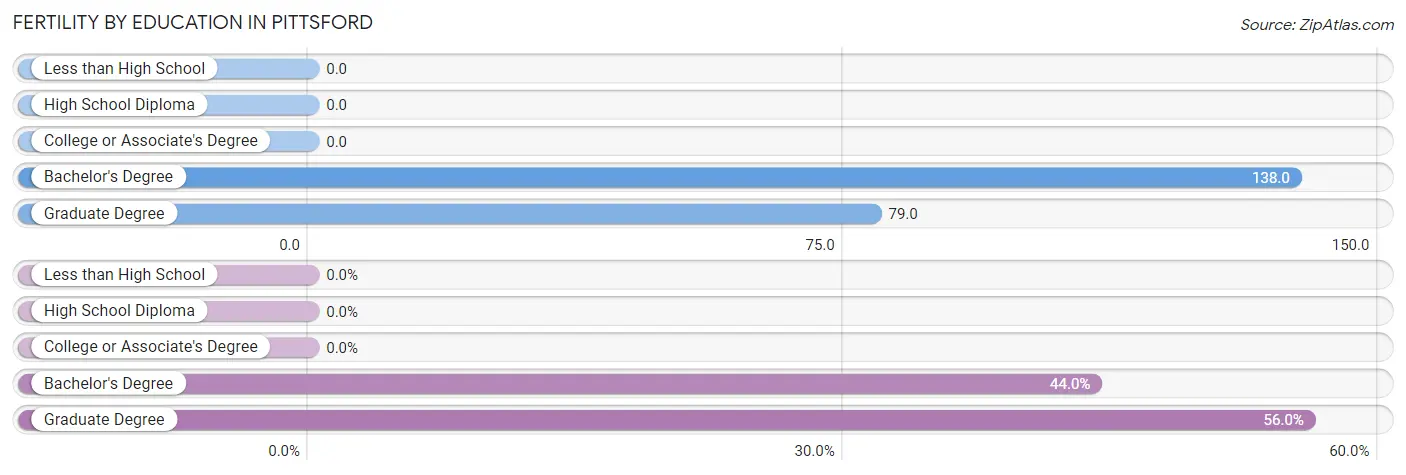
| Educational Attainment | Women with Births | Births / 1,000 Women |
| Less than High School | 0 (0.0%) | 0.0 |
| High School Diploma | 0 (0.0%) | 0.0 |
| College or Associate's Degree | 0 (0.0%) | 0.0 |
| Bachelor's Degree | 11 (44.0%) | 138.0 |
| Graduate Degree | 14 (56.0%) | 79.0 |
| Total | 25 (100.0%) | 74.0 |
Fertility by Education by Marriage Status in Pittsford
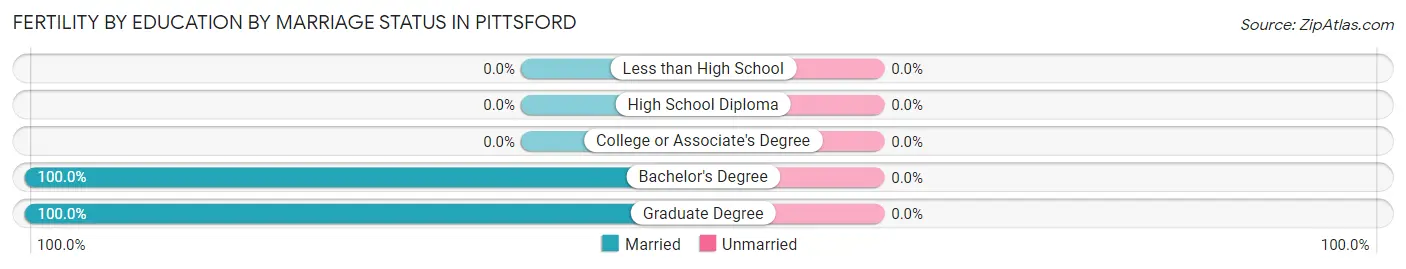
| Educational Attainment | Married | Unmarried |
| Less than High School | 0 (0.0%) | 0 (0.0%) |
| High School Diploma | 0 (0.0%) | 0 (0.0%) |
| College or Associate's Degree | 0 (0.0%) | 0 (0.0%) |
| Bachelor's Degree | 11 (100.0%) | 0 (0.0%) |
| Graduate Degree | 14 (100.0%) | 0 (0.0%) |
| Total | 25 (100.0%) | 0 (0.0%) |
Employment Characteristics in Pittsford
Employment by Class of Employer in Pittsford
Among the 903 employed individuals in Pittsford, private company employees (442 | 48.9%), not-for-profit organizations (211 | 23.4%), and local government employees (88 | 9.8%) make up the most common classes of employment.
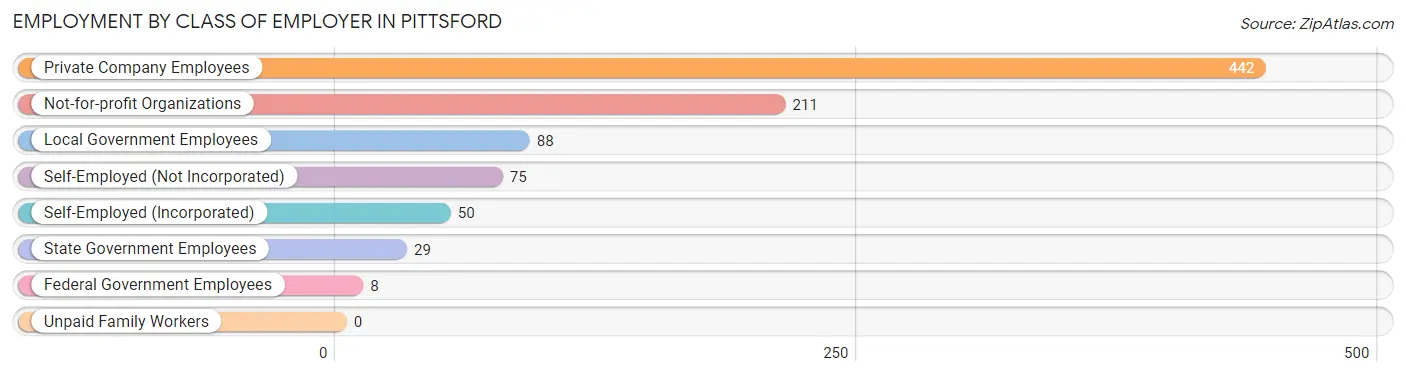
| Employer Class | # Employees | % Employees |
| Private Company Employees | 442 | 48.9% |
| Self-Employed (Incorporated) | 50 | 5.5% |
| Self-Employed (Not Incorporated) | 75 | 8.3% |
| Not-for-profit Organizations | 211 | 23.4% |
| Local Government Employees | 88 | 9.8% |
| State Government Employees | 29 | 3.2% |
| Federal Government Employees | 8 | 0.9% |
| Unpaid Family Workers | 0 | 0.0% |
| Total | 903 | 100.0% |
Employment Status by Age in Pittsford
According to the labor force statistics for Pittsford, out of the total population over 16 years of age (1,270), 73.2% or 930 individuals are in the labor force, with 1.9% or 18 of them unemployed. The age group with the highest labor force participation rate is 25 to 29 years, with 100.0% or 16 individuals in the labor force. Within the labor force, the 30 to 34 years age range has the highest percentage of unemployed individuals, with 14.8% or 18 of them being unemployed.
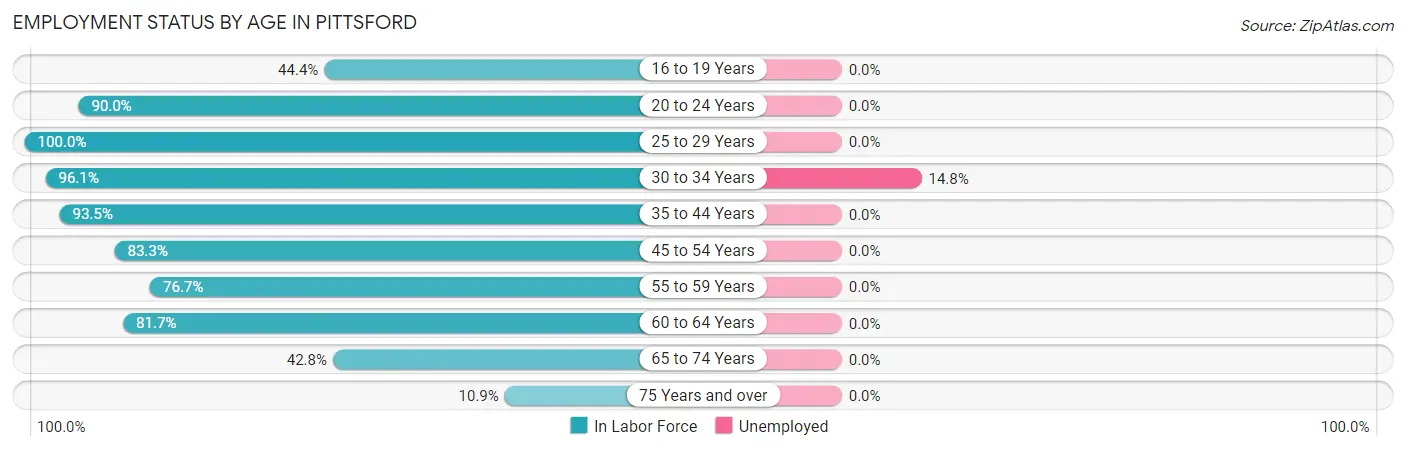
| Age Bracket | In Labor Force | Unemployed |
| 16 to 19 Years | 36 (44.4%) | 0 (0.0%) |
| 20 to 24 Years | 36 (90.0%) | 0 (0.0%) |
| 25 to 29 Years | 16 (100.0%) | 0 (0.0%) |
| 30 to 34 Years | 122 (96.1%) | 18 (14.8%) |
| 35 to 44 Years | 272 (93.5%) | 0 (0.0%) |
| 45 to 54 Years | 155 (83.3%) | 0 (0.0%) |
| 55 to 59 Years | 132 (76.7%) | 0 (0.0%) |
| 60 to 64 Years | 85 (81.7%) | 0 (0.0%) |
| 65 to 74 Years | 65 (42.8%) | 0 (0.0%) |
| 75 Years and over | 11 (10.9%) | 0 (0.0%) |
| Total | 930 (73.2%) | 18 (1.9%) |
Employment Status by Educational Attainment in Pittsford
According to labor force statistics for Pittsford, 87.3% of individuals (782) out of the total population between 25 and 64 years of age (896) are in the labor force, with 2.3% or 18 of them being unemployed. The group with the highest labor force participation rate are those with the educational attainment of less than high school, with 100.0% or 4 individuals in the labor force. Within the labor force, individuals with bachelor's degree or higher education have the highest percentage of unemployment, with 2.8% or 18 of them being unemployed.
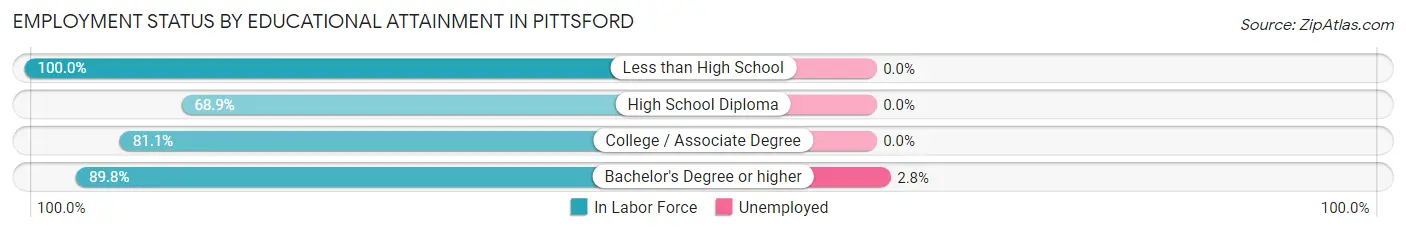
| Educational Attainment | In Labor Force | Unemployed |
| Less than High School | 4 (100.0%) | 0 (0.0%) |
| High School Diploma | 42 (68.9%) | 0 (0.0%) |
| College / Associate Degree | 99 (81.1%) | 0 (0.0%) |
| Bachelor's Degree or higher | 637 (89.8%) | 20 (2.8%) |
| Total | 782 (87.3%) | 21 (2.3%) |
Employment Occupations by Sex in Pittsford
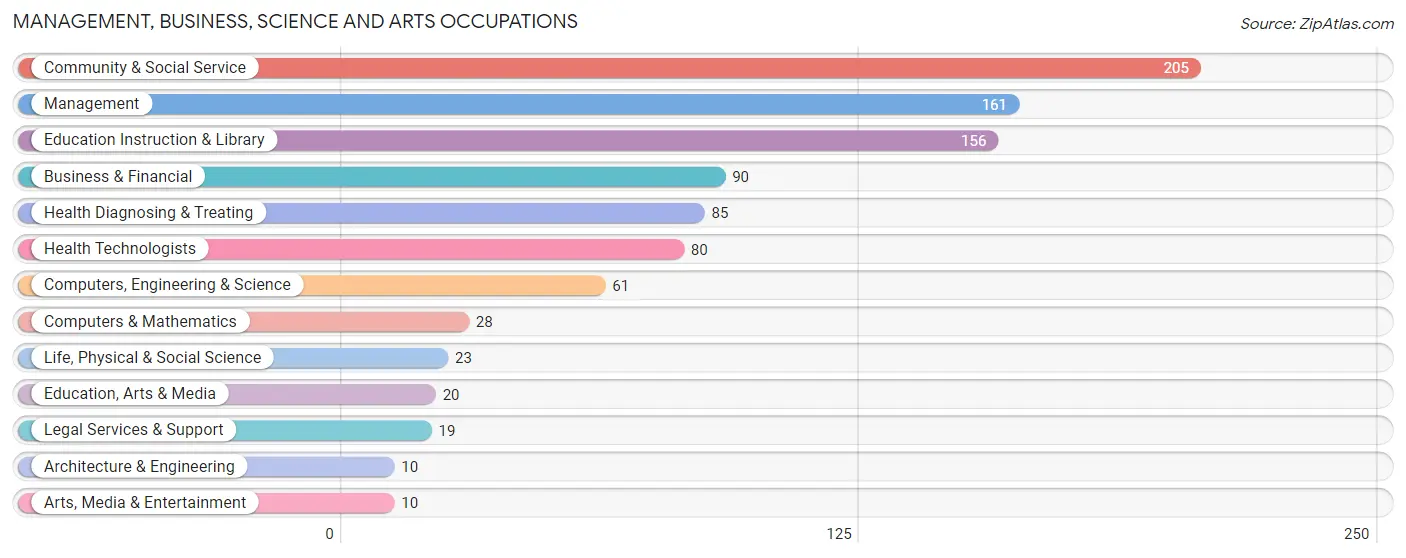
Management, Business, Science and Arts Occupations
The most common Management, Business, Science and Arts occupations in Pittsford are Community & Social Service (205 | 22.6%), Management (161 | 17.7%), Education Instruction & Library (156 | 17.2%), Business & Financial (90 | 9.9%), and Health Diagnosing & Treating (85 | 9.4%).
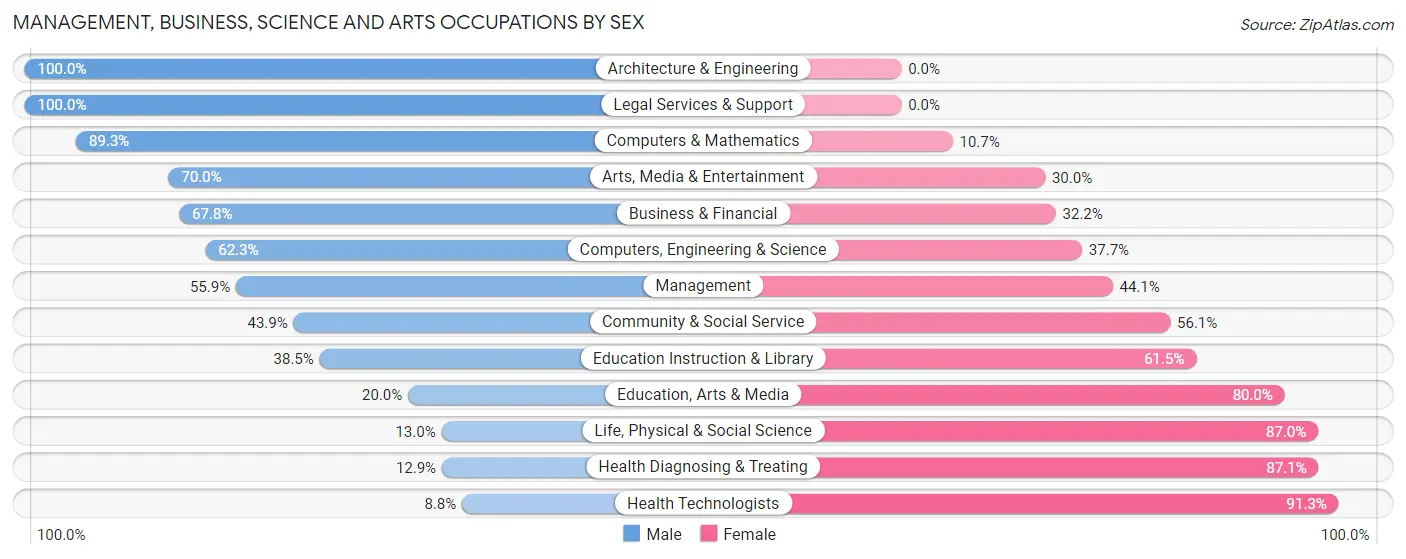
Management, Business, Science and Arts Occupations by Sex
Within the Management, Business, Science and Arts occupations in Pittsford, the most male-oriented occupations are Architecture & Engineering (100.0%), Legal Services & Support (100.0%), and Computers & Mathematics (89.3%), while the most female-oriented occupations are Health Technologists (91.2%), Health Diagnosing & Treating (87.1%), and Life, Physical & Social Science (87.0%).
| Occupation | Male | Female |
| Management | 90 (55.9%) | 71 (44.1%) |
| Business & Financial | 61 (67.8%) | 29 (32.2%) |
| Computers, Engineering & Science | 38 (62.3%) | 23 (37.7%) |
| Computers & Mathematics | 25 (89.3%) | 3 (10.7%) |
| Architecture & Engineering | 10 (100.0%) | 0 (0.0%) |
| Life, Physical & Social Science | 3 (13.0%) | 20 (87.0%) |
| Community & Social Service | 90 (43.9%) | 115 (56.1%) |
| Education, Arts & Media | 4 (20.0%) | 16 (80.0%) |
| Legal Services & Support | 19 (100.0%) | 0 (0.0%) |
| Education Instruction & Library | 60 (38.5%) | 96 (61.5%) |
| Arts, Media & Entertainment | 7 (70.0%) | 3 (30.0%) |
| Health Diagnosing & Treating | 11 (12.9%) | 74 (87.1%) |
| Health Technologists | 7 (8.7%) | 73 (91.2%) |
| Total (Category) | 290 (48.2%) | 312 (51.8%) |
| Total (Overall) | 448 (49.3%) | 460 (50.7%) |
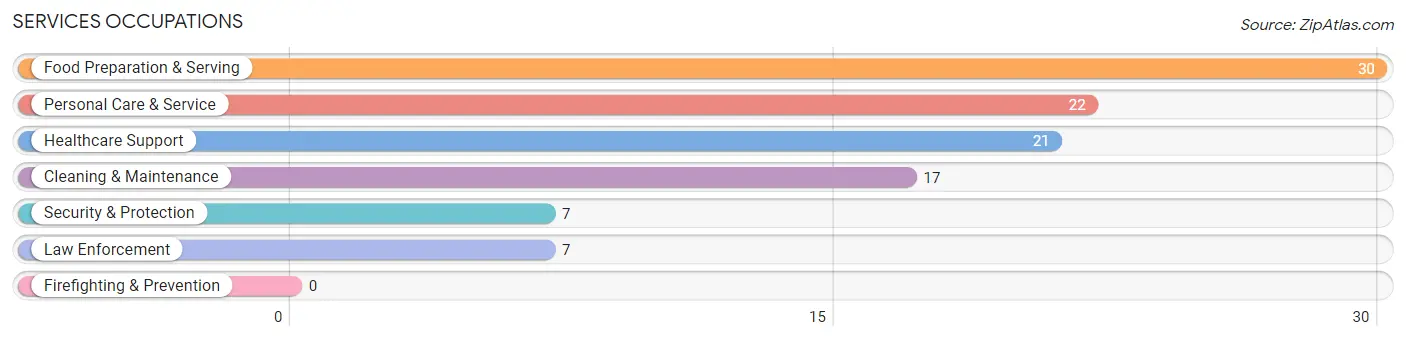
Services Occupations
The most common Services occupations in Pittsford are Food Preparation & Serving (30 | 3.3%), Personal Care & Service (22 | 2.4%), Healthcare Support (21 | 2.3%), Cleaning & Maintenance (17 | 1.9%), and Security & Protection (7 | 0.8%).
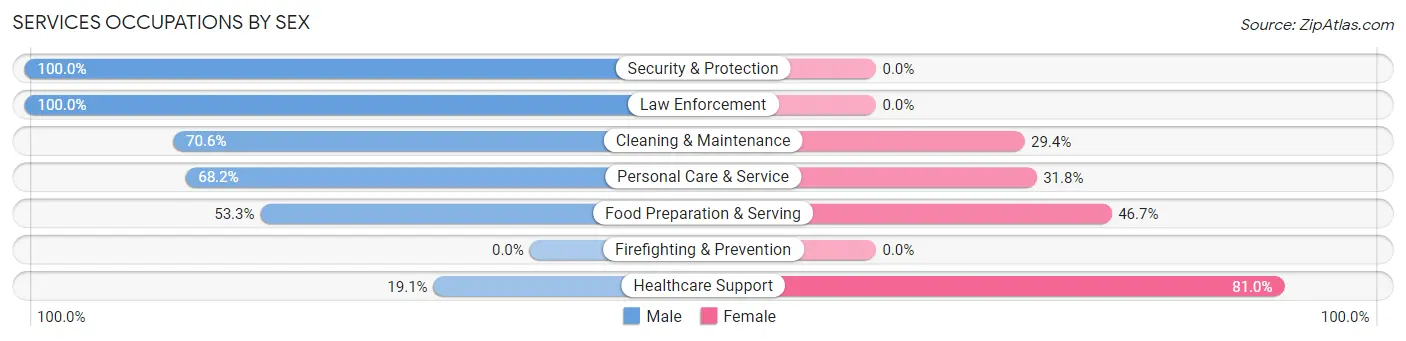
Services Occupations by Sex
Within the Services occupations in Pittsford, the most male-oriented occupations are Security & Protection (100.0%), Law Enforcement (100.0%), and Cleaning & Maintenance (70.6%), while the most female-oriented occupations are Healthcare Support (80.9%), Food Preparation & Serving (46.7%), and Personal Care & Service (31.8%).
| Occupation | Male | Female |
| Healthcare Support | 4 (19.1%) | 17 (80.9%) |
| Security & Protection | 7 (100.0%) | 0 (0.0%) |
| Firefighting & Prevention | 0 (0.0%) | 0 (0.0%) |
| Law Enforcement | 7 (100.0%) | 0 (0.0%) |
| Food Preparation & Serving | 16 (53.3%) | 14 (46.7%) |
| Cleaning & Maintenance | 12 (70.6%) | 5 (29.4%) |
| Personal Care & Service | 15 (68.2%) | 7 (31.8%) |
| Total (Category) | 54 (55.7%) | 43 (44.3%) |
| Total (Overall) | 448 (49.3%) | 460 (50.7%) |
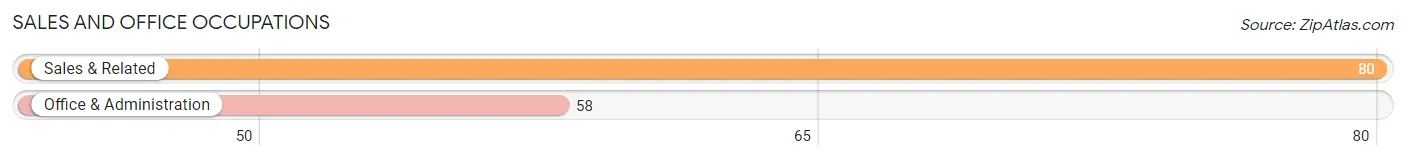
Sales and Office Occupations
The most common Sales and Office occupations in Pittsford are Sales & Related (80 | 8.8%), and Office & Administration (58 | 6.4%).
Sales and Office Occupations by Sex
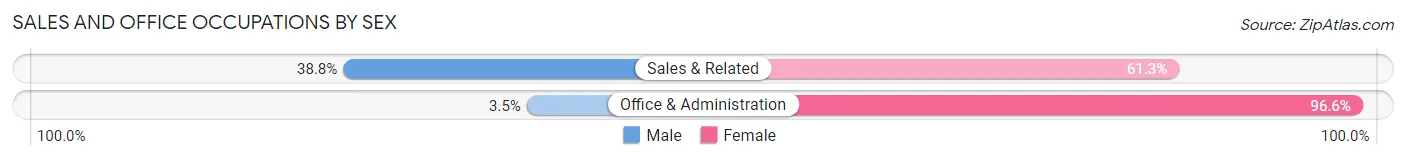
| Occupation | Male | Female |
| Sales & Related | 31 (38.8%) | 49 (61.3%) |
| Office & Administration | 2 (3.5%) | 56 (96.6%) |
| Total (Category) | 33 (23.9%) | 105 (76.1%) |
| Total (Overall) | 448 (49.3%) | 460 (50.7%) |
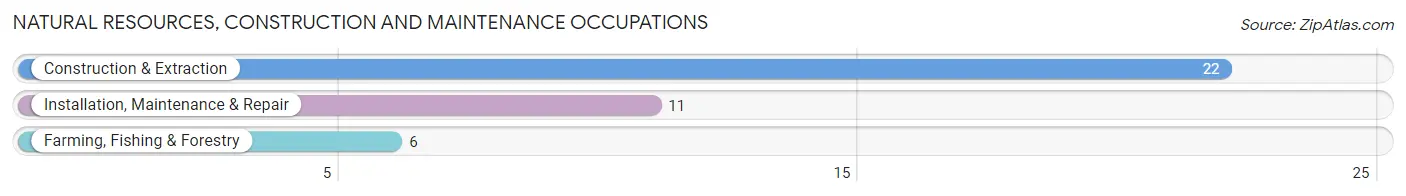
Natural Resources, Construction and Maintenance Occupations
The most common Natural Resources, Construction and Maintenance occupations in Pittsford are Construction & Extraction (22 | 2.4%), Installation, Maintenance & Repair (11 | 1.2%), and Farming, Fishing & Forestry (6 | 0.7%).
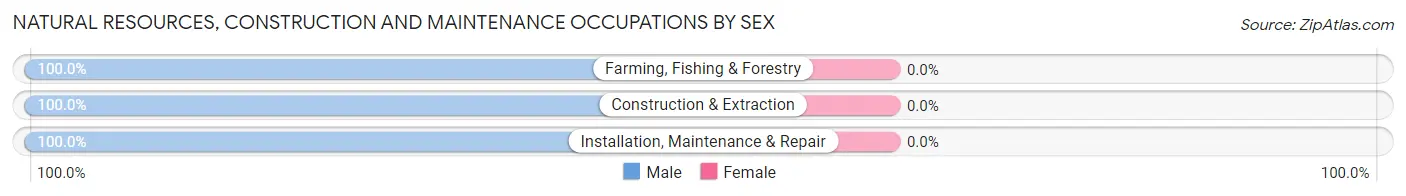
Natural Resources, Construction and Maintenance Occupations by Sex
| Occupation | Male | Female |
| Farming, Fishing & Forestry | 6 (100.0%) | 0 (0.0%) |
| Construction & Extraction | 22 (100.0%) | 0 (0.0%) |
| Installation, Maintenance & Repair | 11 (100.0%) | 0 (0.0%) |
| Total (Category) | 39 (100.0%) | 0 (0.0%) |
| Total (Overall) | 448 (49.3%) | 460 (50.7%) |
Production, Transportation and Moving Occupations
The most common Production, Transportation and Moving occupations in Pittsford are Production (29 | 3.2%), and Transportation (3 | 0.3%).
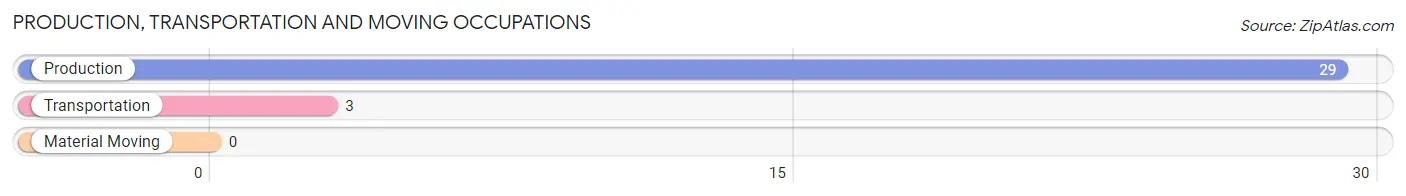
Production, Transportation and Moving Occupations by Sex
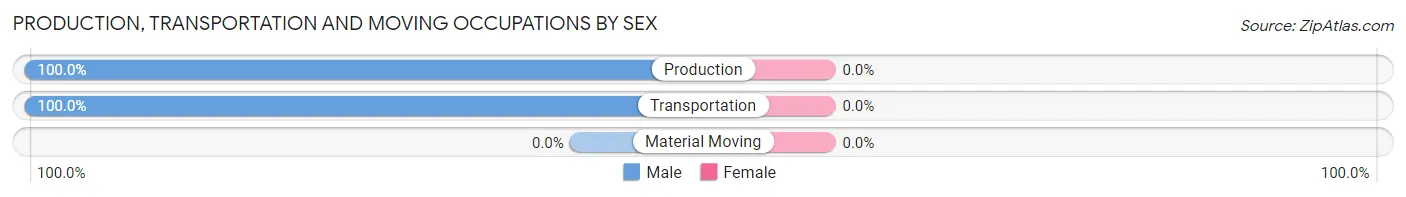
| Occupation | Male | Female |
| Production | 29 (100.0%) | 0 (0.0%) |
| Transportation | 3 (100.0%) | 0 (0.0%) |
| Material Moving | 0 (0.0%) | 0 (0.0%) |
| Total (Category) | 32 (100.0%) | 0 (0.0%) |
| Total (Overall) | 448 (49.3%) | 460 (50.7%) |
Employment Industries by Sex in Pittsford
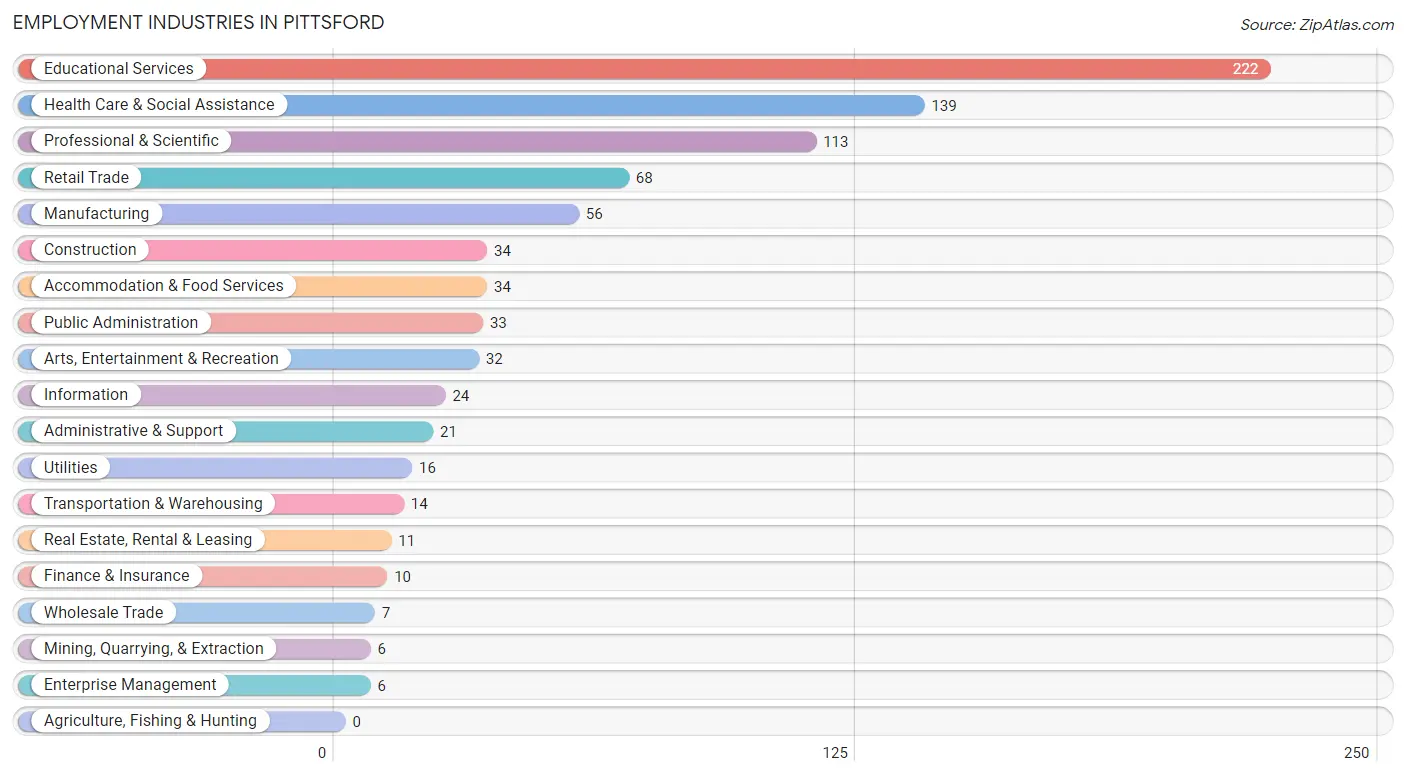
Employment Industries in Pittsford
The major employment industries in Pittsford include Educational Services (222 | 24.4%), Health Care & Social Assistance (139 | 15.3%), Professional & Scientific (113 | 12.4%), Retail Trade (68 | 7.5%), and Manufacturing (56 | 6.2%).
Employment Industries by Sex in Pittsford
The Pittsford industries that see more men than women are Construction (100.0%), Wholesale Trade (100.0%), and Transportation & Warehousing (100.0%), whereas the industries that tend to have a higher number of women are Mining, Quarrying, & Extraction (100.0%), Health Care & Social Assistance (79.9%), and Educational Services (67.1%).
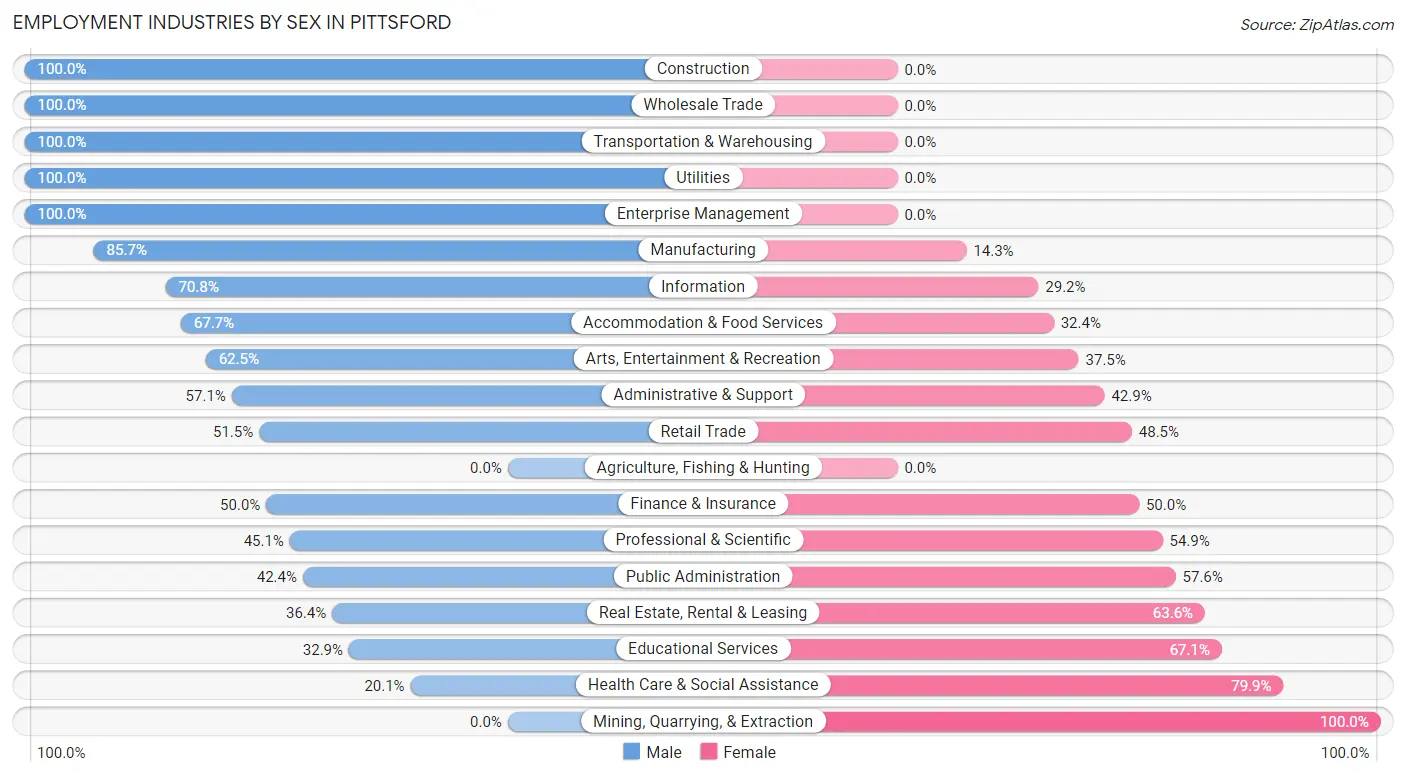
| Industry | Male | Female |
| Agriculture, Fishing & Hunting | 0 (0.0%) | 0 (0.0%) |
| Mining, Quarrying, & Extraction | 0 (0.0%) | 6 (100.0%) |
| Construction | 34 (100.0%) | 0 (0.0%) |
| Manufacturing | 48 (85.7%) | 8 (14.3%) |
| Wholesale Trade | 7 (100.0%) | 0 (0.0%) |
| Retail Trade | 35 (51.5%) | 33 (48.5%) |
| Transportation & Warehousing | 14 (100.0%) | 0 (0.0%) |
| Utilities | 16 (100.0%) | 0 (0.0%) |
| Information | 17 (70.8%) | 7 (29.2%) |
| Finance & Insurance | 5 (50.0%) | 5 (50.0%) |
| Real Estate, Rental & Leasing | 4 (36.4%) | 7 (63.6%) |
| Professional & Scientific | 51 (45.1%) | 62 (54.9%) |
| Enterprise Management | 6 (100.0%) | 0 (0.0%) |
| Administrative & Support | 12 (57.1%) | 9 (42.9%) |
| Educational Services | 73 (32.9%) | 149 (67.1%) |
| Health Care & Social Assistance | 28 (20.1%) | 111 (79.9%) |
| Arts, Entertainment & Recreation | 20 (62.5%) | 12 (37.5%) |
| Accommodation & Food Services | 23 (67.6%) | 11 (32.4%) |
| Public Administration | 14 (42.4%) | 19 (57.6%) |
| Total | 448 (49.3%) | 460 (50.7%) |
Education in Pittsford
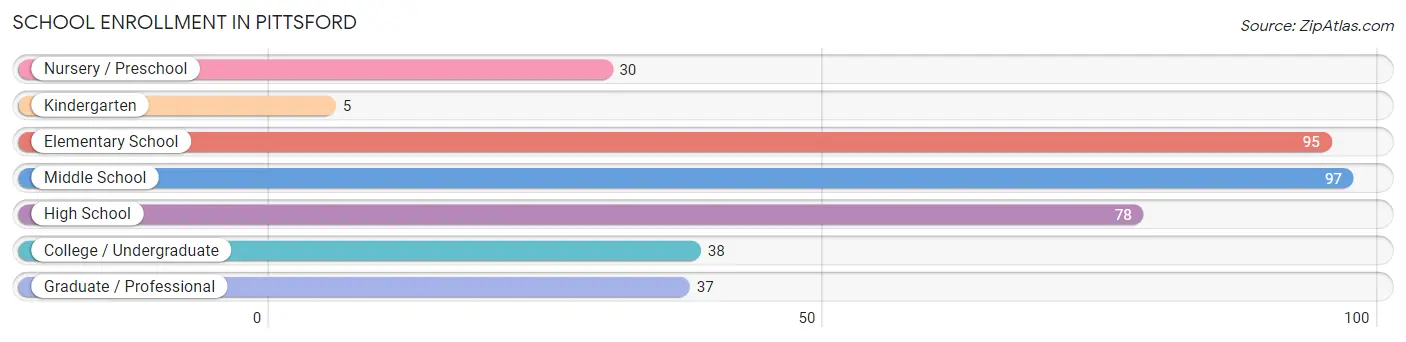
School Enrollment in Pittsford
The most common levels of schooling among the 380 students in Pittsford are middle school (97 | 25.5%), elementary school (95 | 25.0%), and high school (78 | 20.5%).
| School Level | # Students | % Students |
| Nursery / Preschool | 30 | 7.9% |
| Kindergarten | 5 | 1.3% |
| Elementary School | 95 | 25.0% |
| Middle School | 97 | 25.5% |
| High School | 78 | 20.5% |
| College / Undergraduate | 38 | 10.0% |
| Graduate / Professional | 37 | 9.7% |
| Total | 380 | 100.0% |
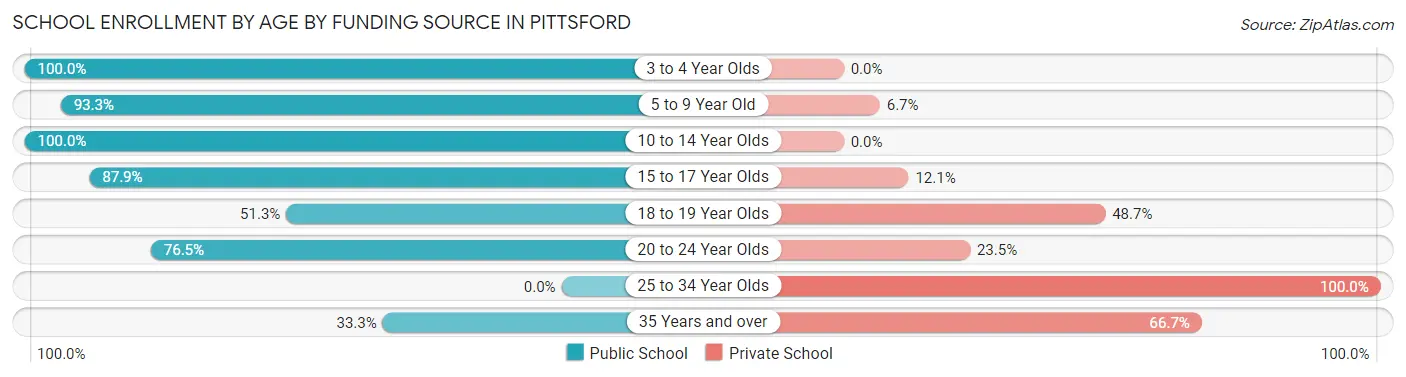
School Enrollment by Age by Funding Source in Pittsford
Out of a total of 380 students who are enrolled in schools in Pittsford, 63 (16.6%) attend a private institution, while the remaining 317 (83.4%) are enrolled in public schools. The age group of 25 to 34 year olds has the highest likelihood of being enrolled in private schools, with 6 (100.0% in the age bracket) enrolled. Conversely, the age group of 3 to 4 year olds has the lowest likelihood of being enrolled in a private school, with 22 (100.0% in the age bracket) attending a public institution.
| Age Bracket | Public School | Private School |
| 3 to 4 Year Olds | 22 (100.0%) | 0 (0.0%) |
| 5 to 9 Year Old | 97 (93.3%) | 7 (6.7%) |
| 10 to 14 Year Olds | 104 (100.0%) | 0 (0.0%) |
| 15 to 17 Year Olds | 51 (87.9%) | 7 (12.1%) |
| 18 to 19 Year Olds | 20 (51.3%) | 19 (48.7%) |
| 20 to 24 Year Olds | 13 (76.5%) | 4 (23.5%) |
| 25 to 34 Year Olds | 0 (0.0%) | 6 (100.0%) |
| 35 Years and over | 10 (33.3%) | 20 (66.7%) |
| Total | 317 (83.4%) | 63 (16.6%) |
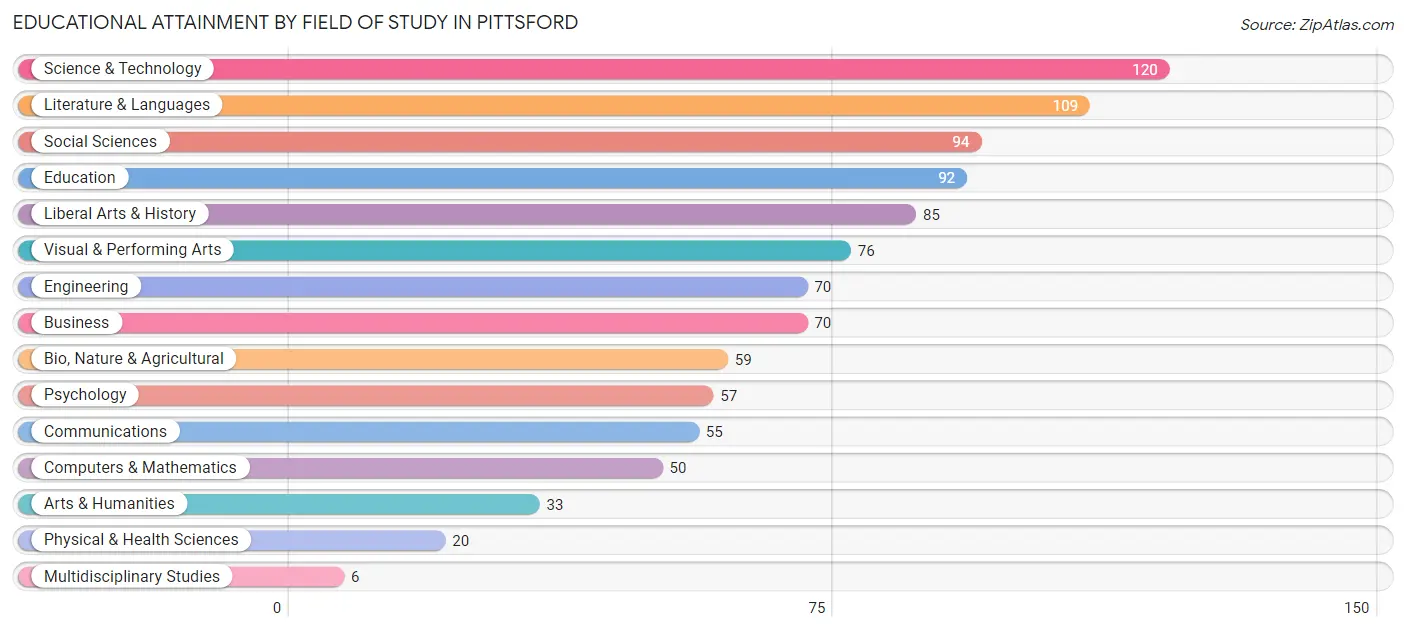
Educational Attainment by Field of Study in Pittsford
Science & technology (120 | 12.0%), literature & languages (109 | 10.9%), social sciences (94 | 9.4%), education (92 | 9.2%), and liberal arts & history (85 | 8.5%) are the most common fields of study among 996 individuals in Pittsford who have obtained a bachelor's degree or higher.
| Field of Study | # Graduates | % Graduates |
| Computers & Mathematics | 50 | 5.0% |
| Bio, Nature & Agricultural | 59 | 5.9% |
| Physical & Health Sciences | 20 | 2.0% |
| Psychology | 57 | 5.7% |
| Social Sciences | 94 | 9.4% |
| Engineering | 70 | 7.0% |
| Multidisciplinary Studies | 6 | 0.6% |
| Science & Technology | 120 | 12.0% |
| Business | 70 | 7.0% |
| Education | 92 | 9.2% |
| Literature & Languages | 109 | 10.9% |
| Liberal Arts & History | 85 | 8.5% |
| Visual & Performing Arts | 76 | 7.6% |
| Communications | 55 | 5.5% |
| Arts & Humanities | 33 | 3.3% |
| Total | 996 | 100.0% |
Transportation & Commute in Pittsford
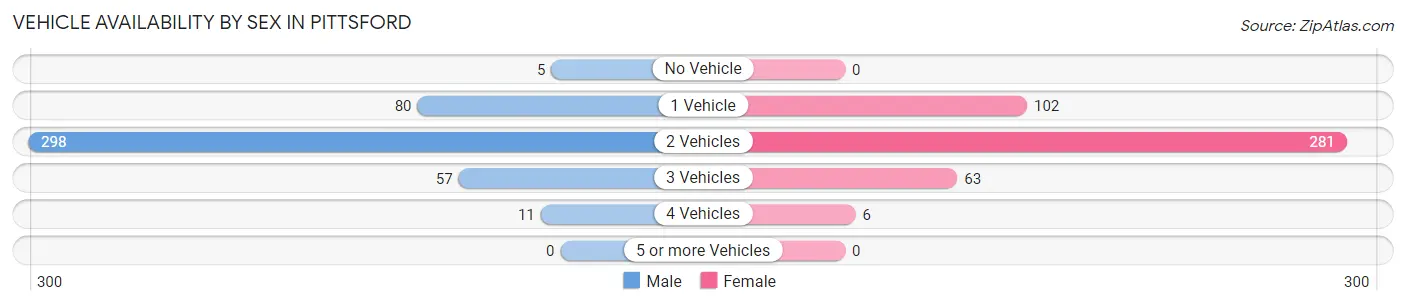
Vehicle Availability by Sex in Pittsford
The most prevalent vehicle ownership categories in Pittsford are males with 2 vehicles (298, accounting for 66.1%) and females with 2 vehicles (281, making up 65.9%).
| Vehicles Available | Male | Female |
| No Vehicle | 5 (1.1%) | 0 (0.0%) |
| 1 Vehicle | 80 (17.7%) | 102 (22.6%) |
| 2 Vehicles | 298 (66.1%) | 281 (62.2%) |
| 3 Vehicles | 57 (12.6%) | 63 (13.9%) |
| 4 Vehicles | 11 (2.4%) | 6 (1.3%) |
| 5 or more Vehicles | 0 (0.0%) | 0 (0.0%) |
| Total | 451 (100.0%) | 452 (100.0%) |
Commute Time in Pittsford
The most frequently occuring commute durations in Pittsford are 15 to 19 minutes (194 commuters, 29.3%), 20 to 24 minutes (138 commuters, 20.8%), and 10 to 14 minutes (115 commuters, 17.3%).
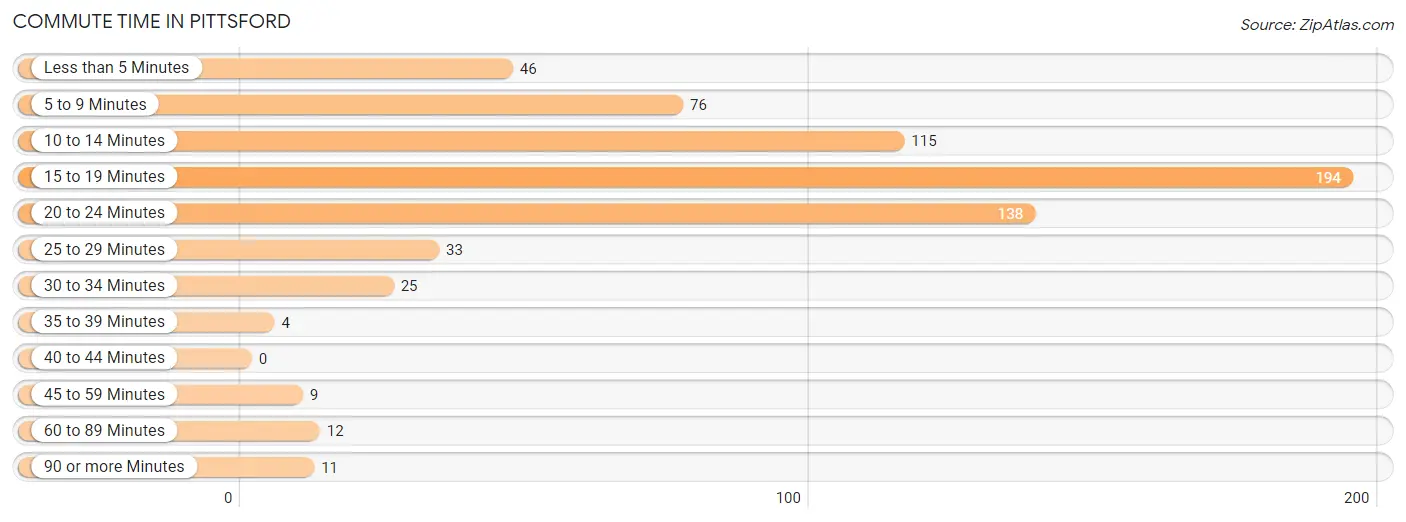
| Commute Time | # Commuters | % Commuters |
| Less than 5 Minutes | 46 | 6.9% |
| 5 to 9 Minutes | 76 | 11.5% |
| 10 to 14 Minutes | 115 | 17.3% |
| 15 to 19 Minutes | 194 | 29.3% |
| 20 to 24 Minutes | 138 | 20.8% |
| 25 to 29 Minutes | 33 | 5.0% |
| 30 to 34 Minutes | 25 | 3.8% |
| 35 to 39 Minutes | 4 | 0.6% |
| 40 to 44 Minutes | 0 | 0.0% |
| 45 to 59 Minutes | 9 | 1.4% |
| 60 to 89 Minutes | 12 | 1.8% |
| 90 or more Minutes | 11 | 1.7% |
Commute Time by Sex in Pittsford
The most common commute times in Pittsford are 20 to 24 minutes (87 commuters, 26.3%) for males and 15 to 19 minutes (116 commuters, 34.9%) for females.
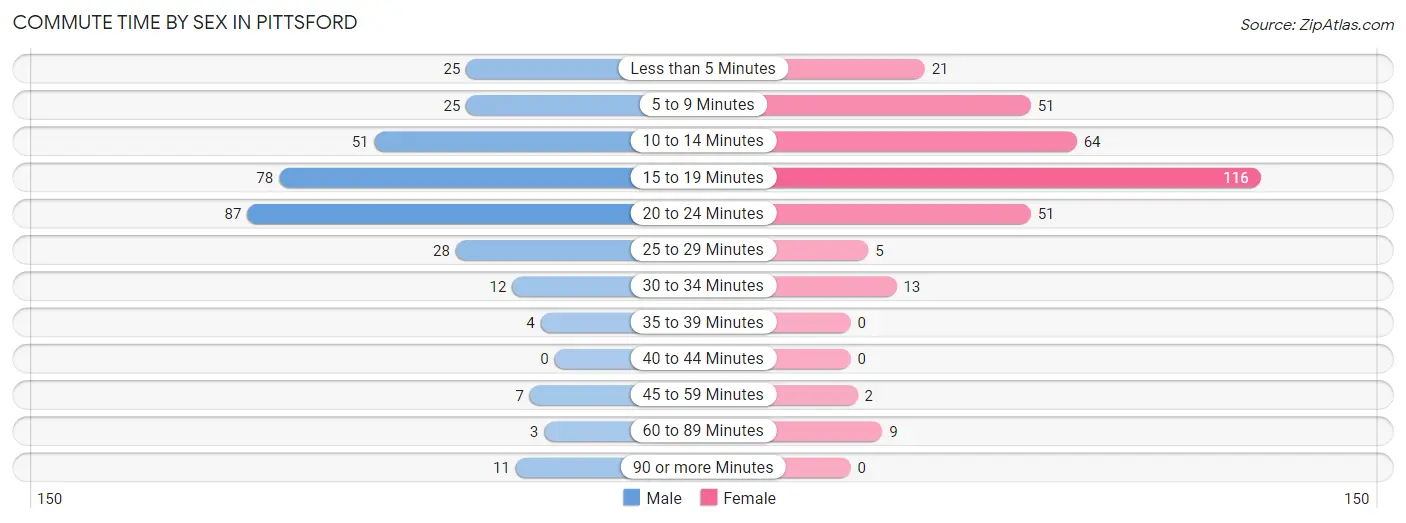
| Commute Time | Male | Female |
| Less than 5 Minutes | 25 (7.5%) | 21 (6.3%) |
| 5 to 9 Minutes | 25 (7.5%) | 51 (15.4%) |
| 10 to 14 Minutes | 51 (15.4%) | 64 (19.3%) |
| 15 to 19 Minutes | 78 (23.6%) | 116 (34.9%) |
| 20 to 24 Minutes | 87 (26.3%) | 51 (15.4%) |
| 25 to 29 Minutes | 28 (8.5%) | 5 (1.5%) |
| 30 to 34 Minutes | 12 (3.6%) | 13 (3.9%) |
| 35 to 39 Minutes | 4 (1.2%) | 0 (0.0%) |
| 40 to 44 Minutes | 0 (0.0%) | 0 (0.0%) |
| 45 to 59 Minutes | 7 (2.1%) | 2 (0.6%) |
| 60 to 89 Minutes | 3 (0.9%) | 9 (2.7%) |
| 90 or more Minutes | 11 (3.3%) | 0 (0.0%) |
Time of Departure to Work by Sex in Pittsford
The most frequent times of departure to work in Pittsford are 7:00 AM to 7:29 AM (73, 22.1%) for males and 7:00 AM to 7:29 AM (71, 21.4%) for females.
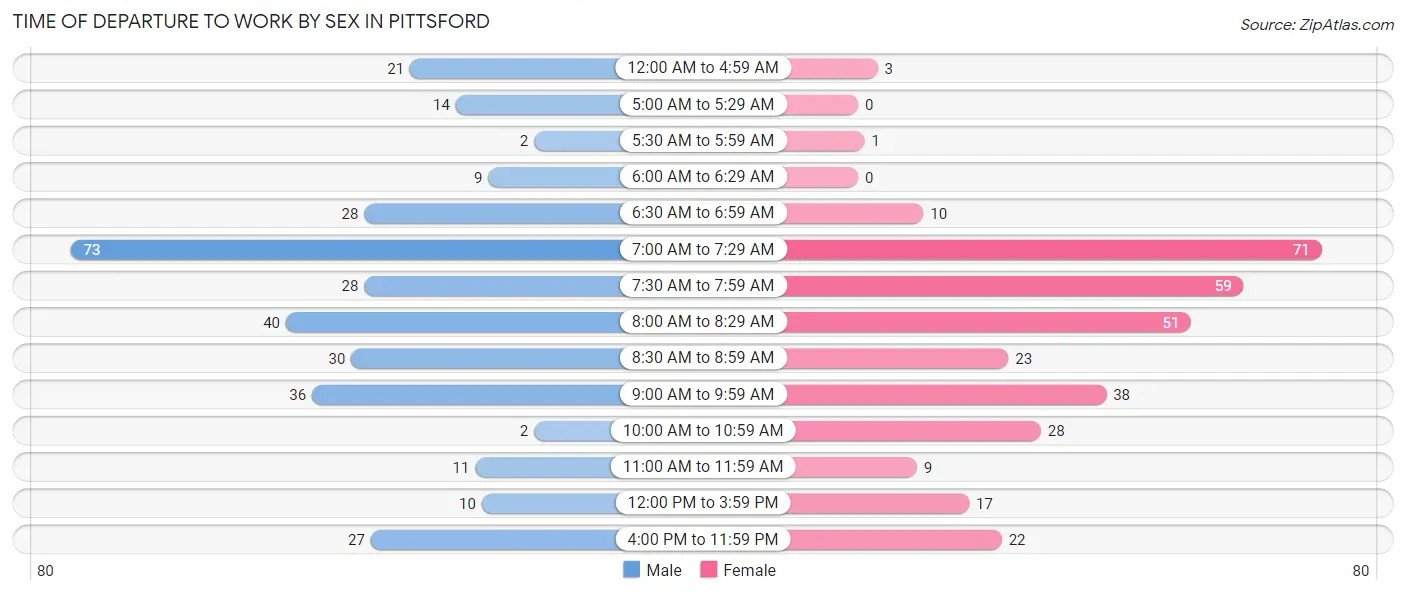
| Time of Departure | Male | Female |
| 12:00 AM to 4:59 AM | 21 (6.3%) | 3 (0.9%) |
| 5:00 AM to 5:29 AM | 14 (4.2%) | 0 (0.0%) |
| 5:30 AM to 5:59 AM | 2 (0.6%) | 1 (0.3%) |
| 6:00 AM to 6:29 AM | 9 (2.7%) | 0 (0.0%) |
| 6:30 AM to 6:59 AM | 28 (8.5%) | 10 (3.0%) |
| 7:00 AM to 7:29 AM | 73 (22.1%) | 71 (21.4%) |
| 7:30 AM to 7:59 AM | 28 (8.5%) | 59 (17.8%) |
| 8:00 AM to 8:29 AM | 40 (12.1%) | 51 (15.4%) |
| 8:30 AM to 8:59 AM | 30 (9.1%) | 23 (6.9%) |
| 9:00 AM to 9:59 AM | 36 (10.9%) | 38 (11.5%) |
| 10:00 AM to 10:59 AM | 2 (0.6%) | 28 (8.4%) |
| 11:00 AM to 11:59 AM | 11 (3.3%) | 9 (2.7%) |
| 12:00 PM to 3:59 PM | 10 (3.0%) | 17 (5.1%) |
| 4:00 PM to 11:59 PM | 27 (8.2%) | 22 (6.6%) |
| Total | 331 (100.0%) | 332 (100.0%) |
Housing Occupancy in Pittsford
Occupancy by Ownership in Pittsford
Of the total 684 dwellings in Pittsford, owner-occupied units account for 487 (71.2%), while renter-occupied units make up 197 (28.8%).
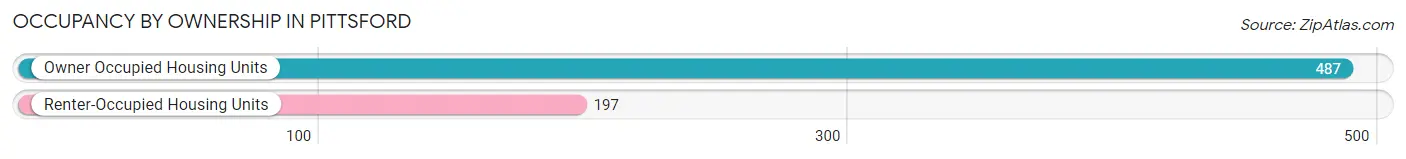
| Occupancy | # Housing Units | % Housing Units |
| Owner Occupied Housing Units | 487 | 71.2% |
| Renter-Occupied Housing Units | 197 | 28.8% |
| Total Occupied Housing Units | 684 | 100.0% |
Occupancy by Household Size in Pittsford
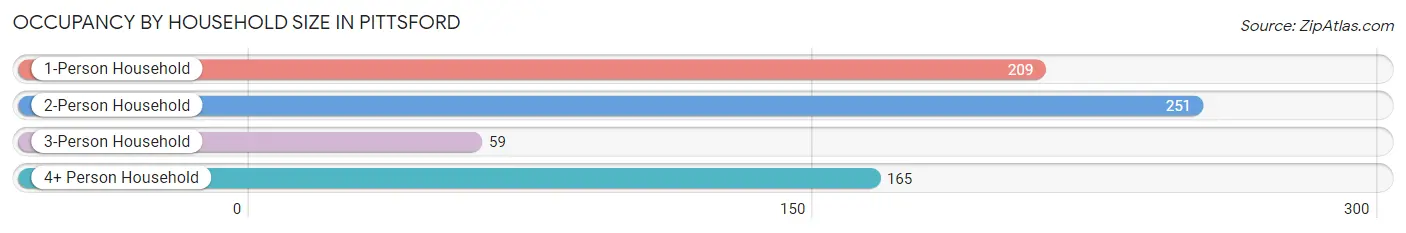
| Household Size | # Housing Units | % Housing Units |
| 1-Person Household | 209 | 30.6% |
| 2-Person Household | 251 | 36.7% |
| 3-Person Household | 59 | 8.6% |
| 4+ Person Household | 165 | 24.1% |
| Total Housing Units | 684 | 100.0% |
Occupancy by Ownership by Household Size in Pittsford
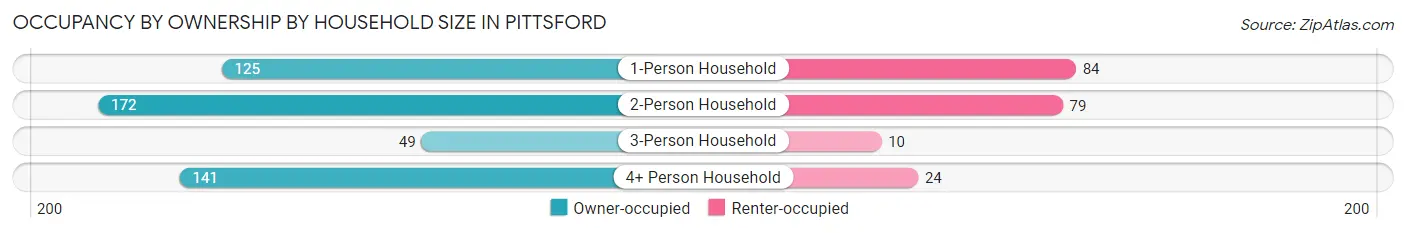
| Household Size | Owner-occupied | Renter-occupied |
| 1-Person Household | 125 (59.8%) | 84 (40.2%) |
| 2-Person Household | 172 (68.5%) | 79 (31.5%) |
| 3-Person Household | 49 (83.1%) | 10 (17.0%) |
| 4+ Person Household | 141 (85.5%) | 24 (14.5%) |
| Total Housing Units | 487 (71.2%) | 197 (28.8%) |
Occupancy by Educational Attainment in Pittsford
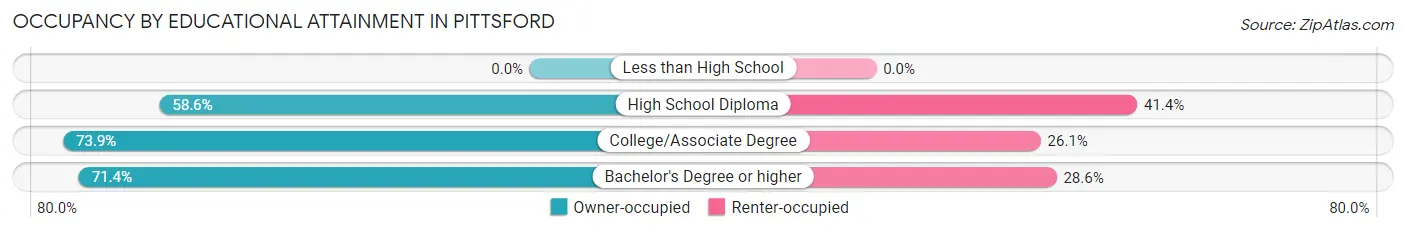
| Household Size | Owner-occupied | Renter-occupied |
| Less than High School | 0 (0.0%) | 0 (0.0%) |
| High School Diploma | 17 (58.6%) | 12 (41.4%) |
| College/Associate Degree | 68 (73.9%) | 24 (26.1%) |
| Bachelor's Degree or higher | 402 (71.4%) | 161 (28.6%) |
Occupancy by Age of Householder in Pittsford
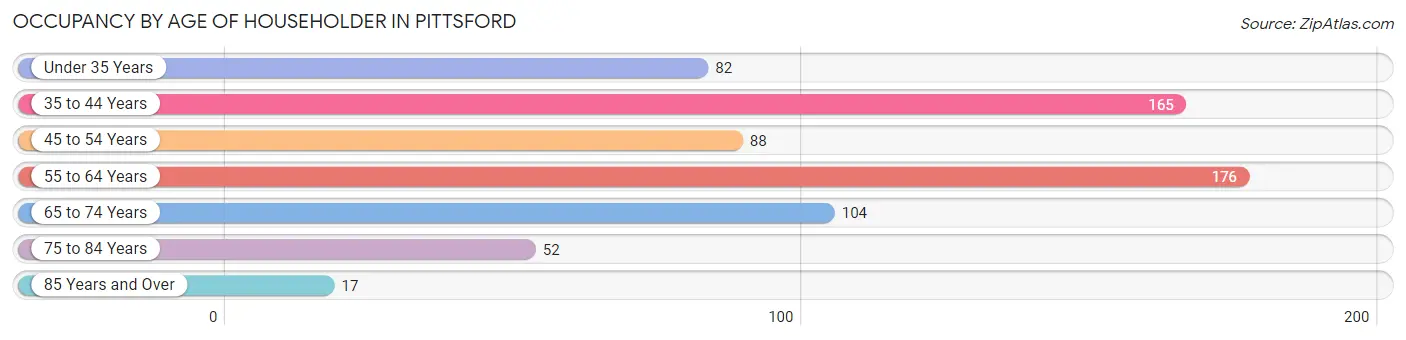
| Age Bracket | # Households | % Households |
| Under 35 Years | 82 | 12.0% |
| 35 to 44 Years | 165 | 24.1% |
| 45 to 54 Years | 88 | 12.9% |
| 55 to 64 Years | 176 | 25.7% |
| 65 to 74 Years | 104 | 15.2% |
| 75 to 84 Years | 52 | 7.6% |
| 85 Years and Over | 17 | 2.5% |
| Total | 684 | 100.0% |
Housing Finances in Pittsford
Median Income by Occupancy in Pittsford
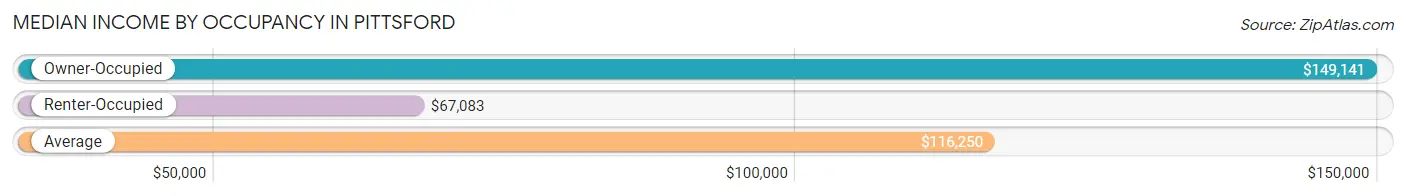
| Occupancy Type | # Households | Median Income |
| Owner-Occupied | 487 (71.2%) | $149,141 |
| Renter-Occupied | 197 (28.8%) | $67,083 |
| Average | 684 (100.0%) | $116,250 |
Occupancy by Householder Income Bracket in Pittsford
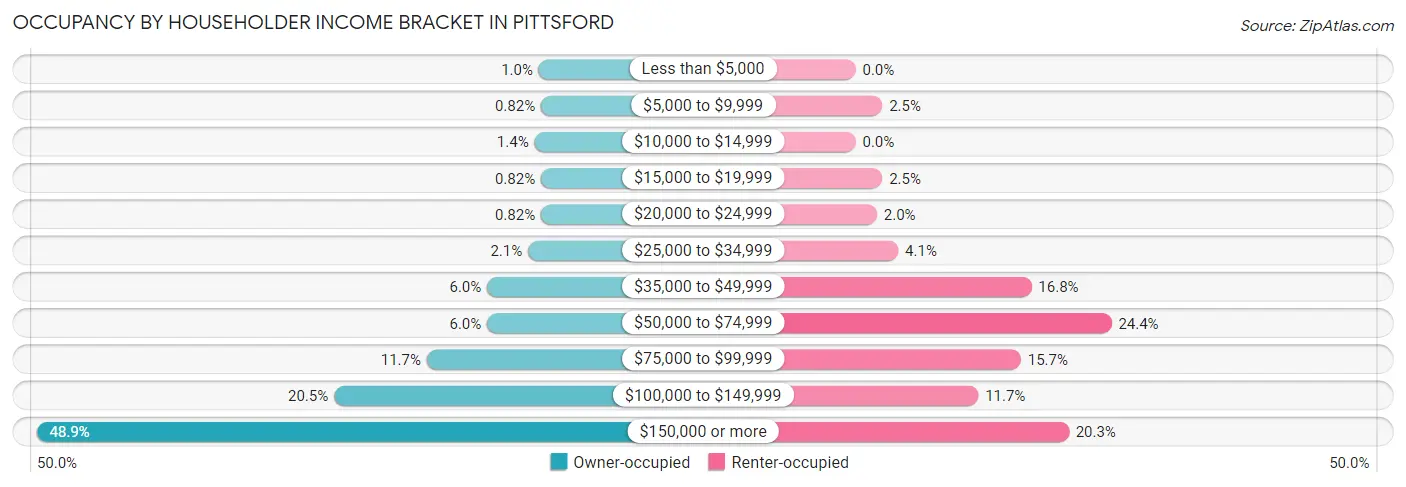
| Income Bracket | Owner-occupied | Renter-occupied |
| Less than $5,000 | 5 (1.0%) | 0 (0.0%) |
| $5,000 to $9,999 | 4 (0.8%) | 5 (2.5%) |
| $10,000 to $14,999 | 7 (1.4%) | 0 (0.0%) |
| $15,000 to $19,999 | 4 (0.8%) | 5 (2.5%) |
| $20,000 to $24,999 | 4 (0.8%) | 4 (2.0%) |
| $25,000 to $34,999 | 10 (2.1%) | 8 (4.1%) |
| $35,000 to $49,999 | 29 (5.9%) | 33 (16.8%) |
| $50,000 to $74,999 | 29 (5.9%) | 48 (24.4%) |
| $75,000 to $99,999 | 57 (11.7%) | 31 (15.7%) |
| $100,000 to $149,999 | 100 (20.5%) | 23 (11.7%) |
| $150,000 or more | 238 (48.9%) | 40 (20.3%) |
| Total | 487 (100.0%) | 197 (100.0%) |
Monthly Housing Cost Tiers in Pittsford
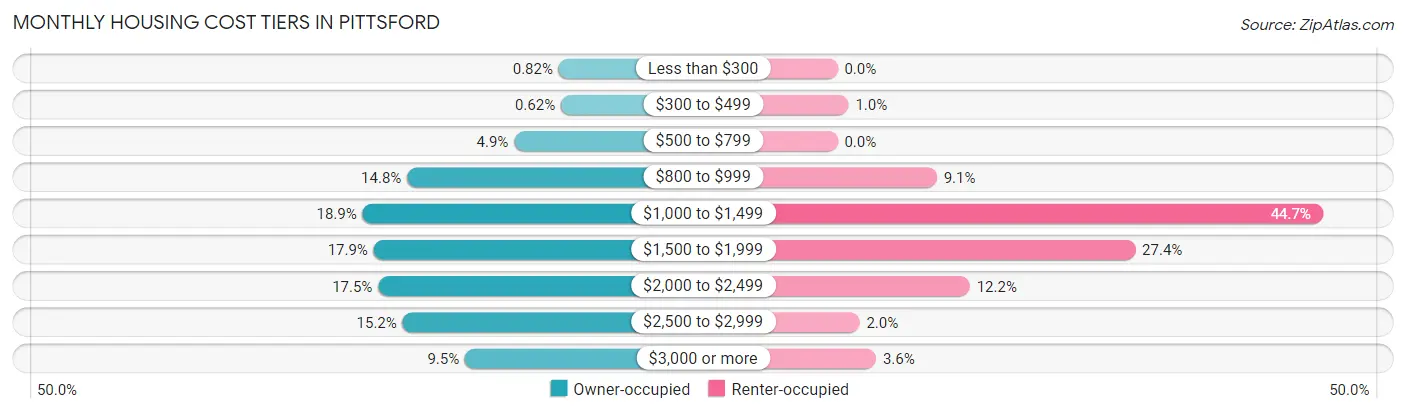
| Monthly Cost | Owner-occupied | Renter-occupied |
| Less than $300 | 4 (0.8%) | 0 (0.0%) |
| $300 to $499 | 3 (0.6%) | 2 (1.0%) |
| $500 to $799 | 24 (4.9%) | 0 (0.0%) |
| $800 to $999 | 72 (14.8%) | 18 (9.1%) |
| $1,000 to $1,499 | 92 (18.9%) | 88 (44.7%) |
| $1,500 to $1,999 | 87 (17.9%) | 54 (27.4%) |
| $2,000 to $2,499 | 85 (17.4%) | 24 (12.2%) |
| $2,500 to $2,999 | 74 (15.2%) | 4 (2.0%) |
| $3,000 or more | 46 (9.5%) | 7 (3.5%) |
| Total | 487 (100.0%) | 197 (100.0%) |
Physical Housing Characteristics in Pittsford
Housing Structures in Pittsford
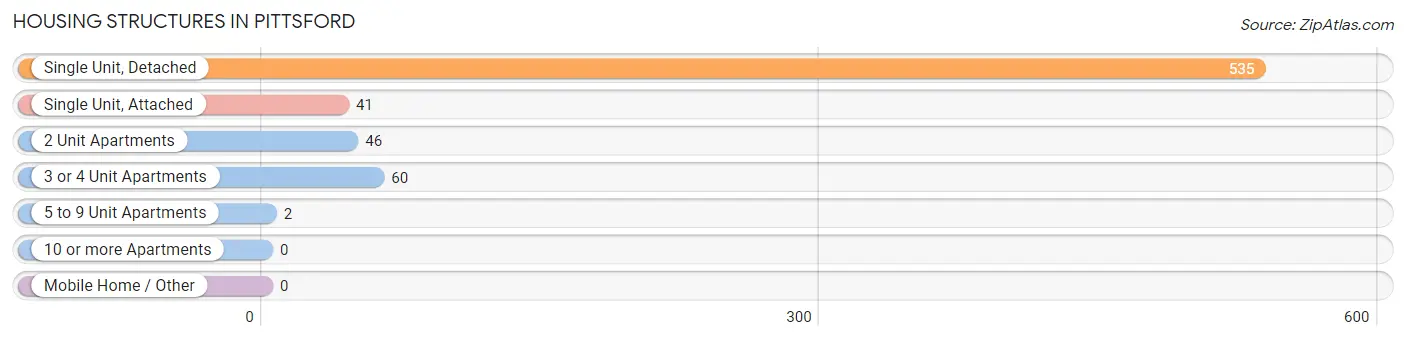
| Structure Type | # Housing Units | % Housing Units |
| Single Unit, Detached | 535 | 78.2% |
| Single Unit, Attached | 41 | 6.0% |
| 2 Unit Apartments | 46 | 6.7% |
| 3 or 4 Unit Apartments | 60 | 8.8% |
| 5 to 9 Unit Apartments | 2 | 0.3% |
| 10 or more Apartments | 0 | 0.0% |
| Mobile Home / Other | 0 | 0.0% |
| Total | 684 | 100.0% |
Housing Structures by Occupancy in Pittsford
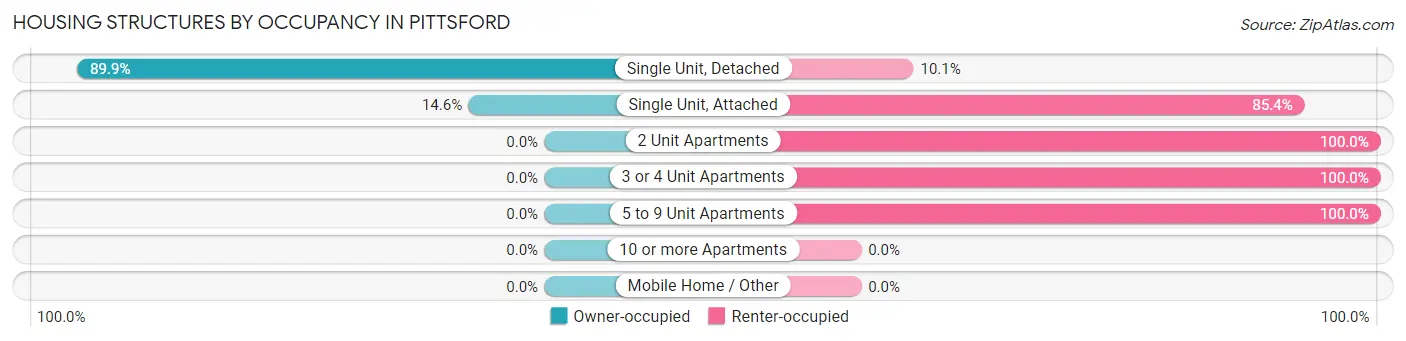
| Structure Type | Owner-occupied | Renter-occupied |
| Single Unit, Detached | 481 (89.9%) | 54 (10.1%) |
| Single Unit, Attached | 6 (14.6%) | 35 (85.4%) |
| 2 Unit Apartments | 0 (0.0%) | 46 (100.0%) |
| 3 or 4 Unit Apartments | 0 (0.0%) | 60 (100.0%) |
| 5 to 9 Unit Apartments | 0 (0.0%) | 2 (100.0%) |
| 10 or more Apartments | 0 (0.0%) | 0 (0.0%) |
| Mobile Home / Other | 0 (0.0%) | 0 (0.0%) |
| Total | 487 (71.2%) | 197 (28.8%) |
Housing Structures by Number of Rooms in Pittsford
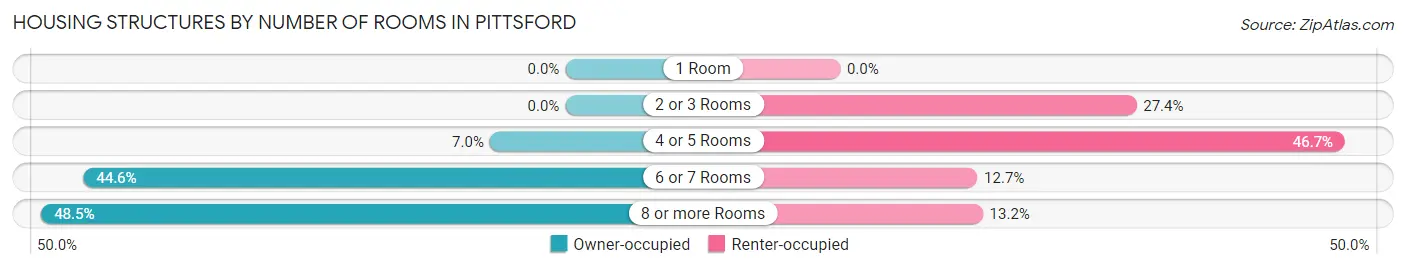
| Number of Rooms | Owner-occupied | Renter-occupied |
| 1 Room | 0 (0.0%) | 0 (0.0%) |
| 2 or 3 Rooms | 0 (0.0%) | 54 (27.4%) |
| 4 or 5 Rooms | 34 (7.0%) | 92 (46.7%) |
| 6 or 7 Rooms | 217 (44.6%) | 25 (12.7%) |
| 8 or more Rooms | 236 (48.5%) | 26 (13.2%) |
| Total | 487 (100.0%) | 197 (100.0%) |
Housing Structure by Heating Type in Pittsford
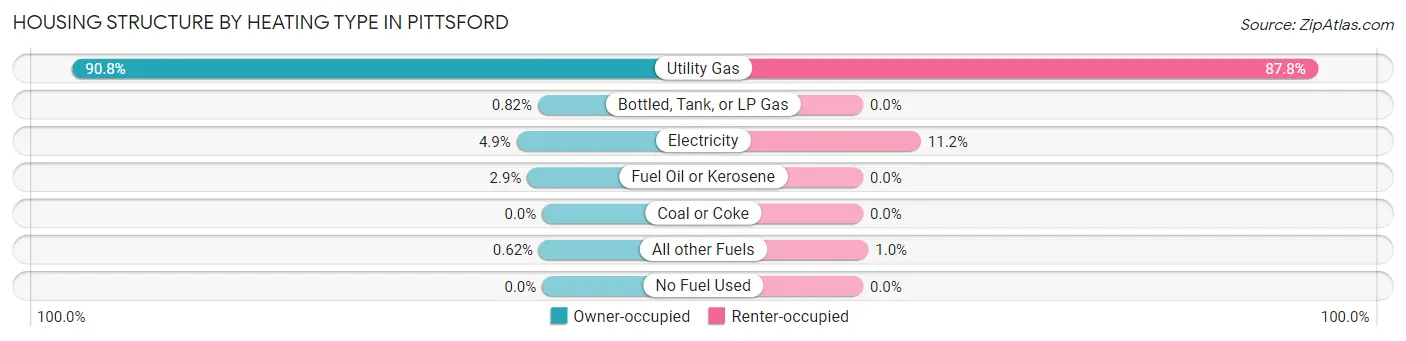
| Heating Type | Owner-occupied | Renter-occupied |
| Utility Gas | 442 (90.8%) | 173 (87.8%) |
| Bottled, Tank, or LP Gas | 4 (0.8%) | 0 (0.0%) |
| Electricity | 24 (4.9%) | 22 (11.2%) |
| Fuel Oil or Kerosene | 14 (2.9%) | 0 (0.0%) |
| Coal or Coke | 0 (0.0%) | 0 (0.0%) |
| All other Fuels | 3 (0.6%) | 2 (1.0%) |
| No Fuel Used | 0 (0.0%) | 0 (0.0%) |
| Total | 487 (100.0%) | 197 (100.0%) |
Household Vehicle Usage in Pittsford
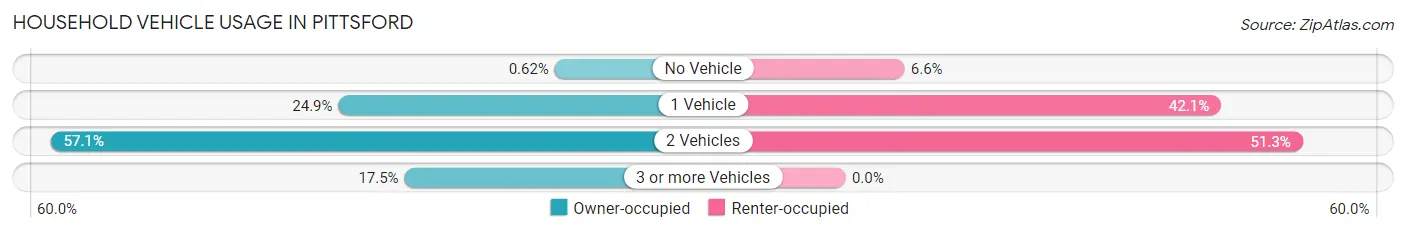
| Vehicles per Household | Owner-occupied | Renter-occupied |
| No Vehicle | 3 (0.6%) | 13 (6.6%) |
| 1 Vehicle | 121 (24.8%) | 83 (42.1%) |
| 2 Vehicles | 278 (57.1%) | 101 (51.3%) |
| 3 or more Vehicles | 85 (17.4%) | 0 (0.0%) |
| Total | 487 (100.0%) | 197 (100.0%) |
Real Estate & Mortgages in Pittsford
Real Estate and Mortgage Overview in Pittsford
| Characteristic | Without Mortgage | With Mortgage |
| Housing Units | 229 | 258 |
| Median Property Value | $288,900 | $317,000 |
| Median Household Income | $125,625 | $125 |
| Monthly Housing Costs | $1,055 | $42 |
| Real Estate Taxes | $9,109 | $4 |
Property Value by Mortgage Status in Pittsford
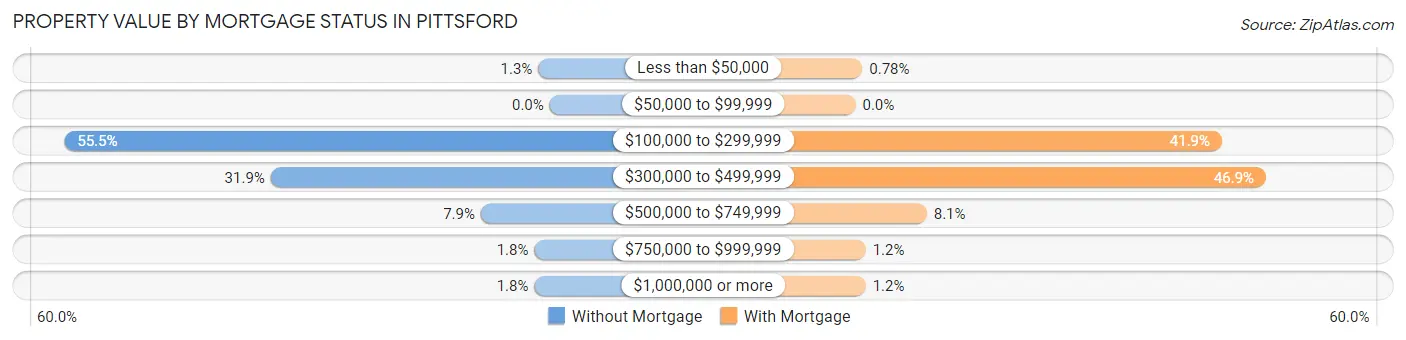
| Property Value | Without Mortgage | With Mortgage |
| Less than $50,000 | 3 (1.3%) | 2 (0.8%) |
| $50,000 to $99,999 | 0 (0.0%) | 0 (0.0%) |
| $100,000 to $299,999 | 127 (55.5%) | 108 (41.9%) |
| $300,000 to $499,999 | 73 (31.9%) | 121 (46.9%) |
| $500,000 to $749,999 | 18 (7.9%) | 21 (8.1%) |
| $750,000 to $999,999 | 4 (1.8%) | 3 (1.2%) |
| $1,000,000 or more | 4 (1.8%) | 3 (1.2%) |
| Total | 229 (100.0%) | 258 (100.0%) |
Household Income by Mortgage Status in Pittsford
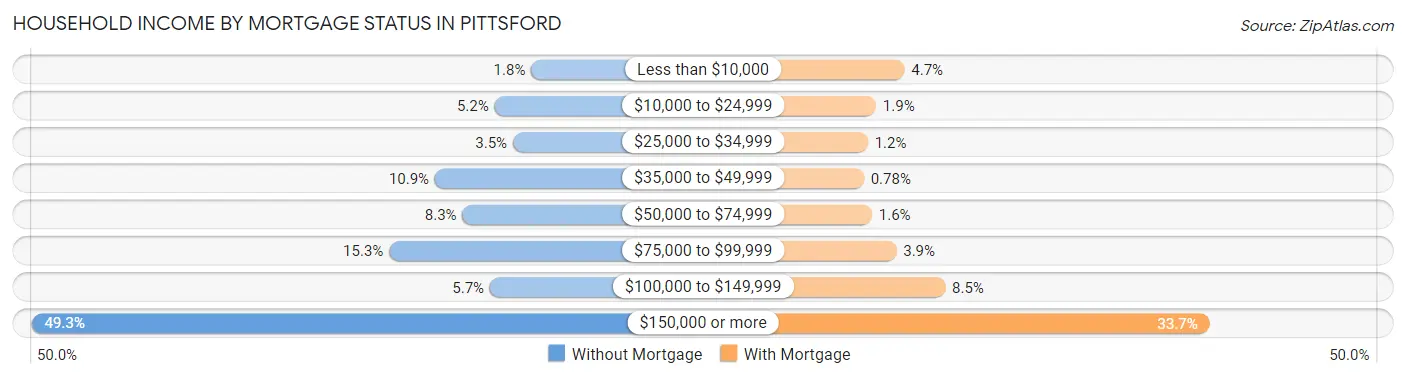
| Household Income | Without Mortgage | With Mortgage |
| Less than $10,000 | 4 (1.8%) | 12 (4.6%) |
| $10,000 to $24,999 | 12 (5.2%) | 5 (1.9%) |
| $25,000 to $34,999 | 8 (3.5%) | 3 (1.2%) |
| $35,000 to $49,999 | 25 (10.9%) | 2 (0.8%) |
| $50,000 to $74,999 | 19 (8.3%) | 4 (1.5%) |
| $75,000 to $99,999 | 35 (15.3%) | 10 (3.9%) |
| $100,000 to $149,999 | 13 (5.7%) | 22 (8.5%) |
| $150,000 or more | 113 (49.3%) | 87 (33.7%) |
| Total | 229 (100.0%) | 258 (100.0%) |
Property Value to Household Income Ratio in Pittsford
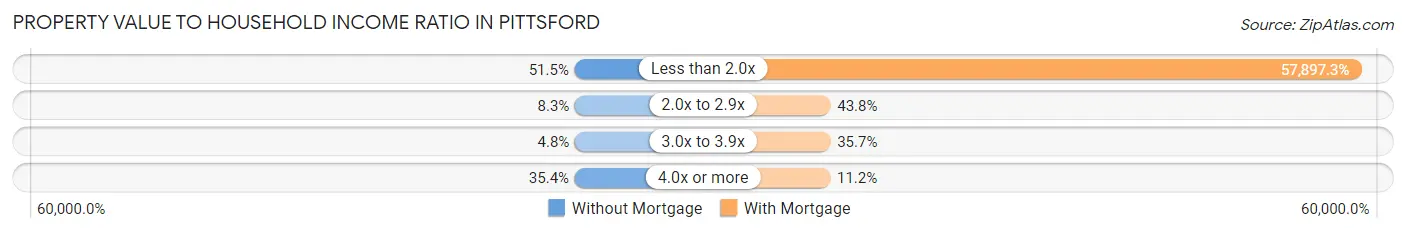
| Value-to-Income Ratio | Without Mortgage | With Mortgage |
| Less than 2.0x | 118 (51.5%) | 149,375 (57,897.3%) |
| 2.0x to 2.9x | 19 (8.3%) | 113 (43.8%) |
| 3.0x to 3.9x | 11 (4.8%) | 92 (35.7%) |
| 4.0x or more | 81 (35.4%) | 29 (11.2%) |
| Total | 229 (100.0%) | 258 (100.0%) |
Real Estate Taxes by Mortgage Status in Pittsford
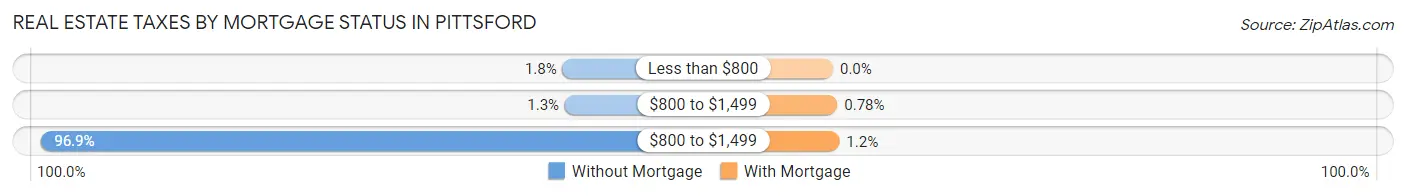
| Property Taxes | Without Mortgage | With Mortgage |
| Less than $800 | 4 (1.8%) | 0 (0.0%) |
| $800 to $1,499 | 3 (1.3%) | 2 (0.8%) |
| $800 to $1,499 | 222 (96.9%) | 3 (1.2%) |
| Total | 229 (100.0%) | 258 (100.0%) |
Health & Disability in Pittsford
Health Insurance Coverage by Age in Pittsford
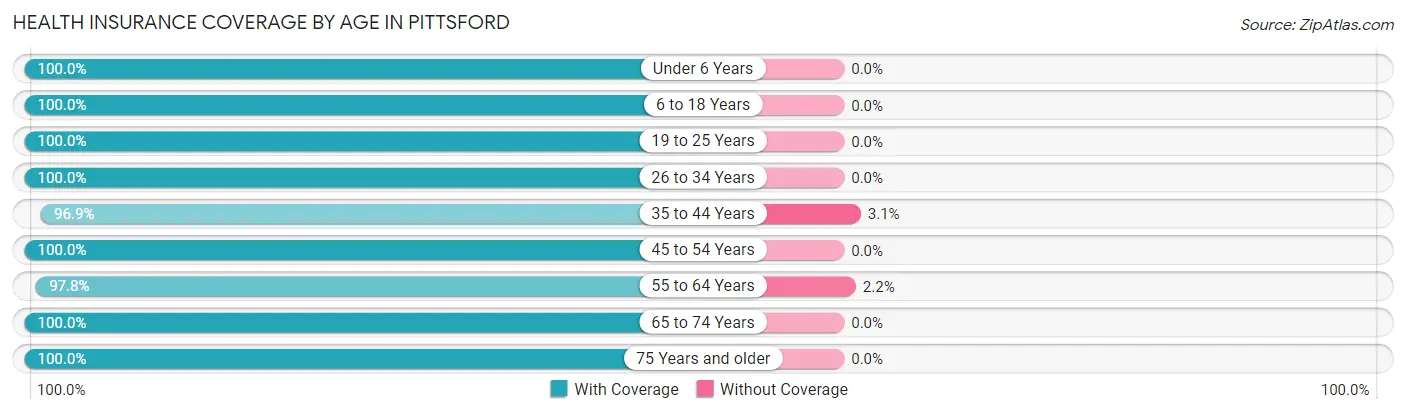
| Age Bracket | With Coverage | Without Coverage |
| Under 6 Years | 163 (100.0%) | 0 (0.0%) |
| 6 to 18 Years | 282 (100.0%) | 0 (0.0%) |
| 19 to 25 Years | 50 (100.0%) | 0 (0.0%) |
| 26 to 34 Years | 139 (100.0%) | 0 (0.0%) |
| 35 to 44 Years | 282 (96.9%) | 9 (3.1%) |
| 45 to 54 Years | 186 (100.0%) | 0 (0.0%) |
| 55 to 64 Years | 270 (97.8%) | 6 (2.2%) |
| 65 to 74 Years | 152 (100.0%) | 0 (0.0%) |
| 75 Years and older | 101 (100.0%) | 0 (0.0%) |
| Total | 1,625 (99.1%) | 15 (0.9%) |
Health Insurance Coverage by Citizenship Status in Pittsford
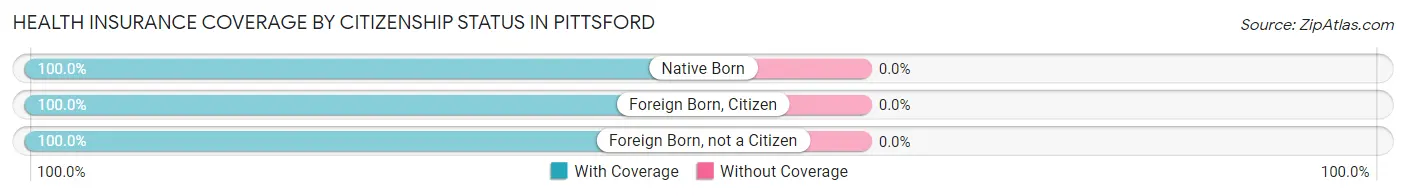
| Citizenship Status | With Coverage | Without Coverage |
| Native Born | 163 (100.0%) | 0 (0.0%) |
| Foreign Born, Citizen | 282 (100.0%) | 0 (0.0%) |
| Foreign Born, not a Citizen | 50 (100.0%) | 0 (0.0%) |
Health Insurance Coverage by Household Income in Pittsford

| Household Income | With Coverage | Without Coverage |
| Under $25,000 | 38 (100.0%) | 0 (0.0%) |
| $25,000 to $49,999 | 121 (100.0%) | 0 (0.0%) |
| $50,000 to $74,999 | 111 (92.5%) | 9 (7.5%) |
| $75,000 to $99,999 | 262 (100.0%) | 0 (0.0%) |
| $100,000 and over | 1,073 (99.4%) | 6 (0.6%) |
Public vs Private Health Insurance Coverage by Age in Pittsford
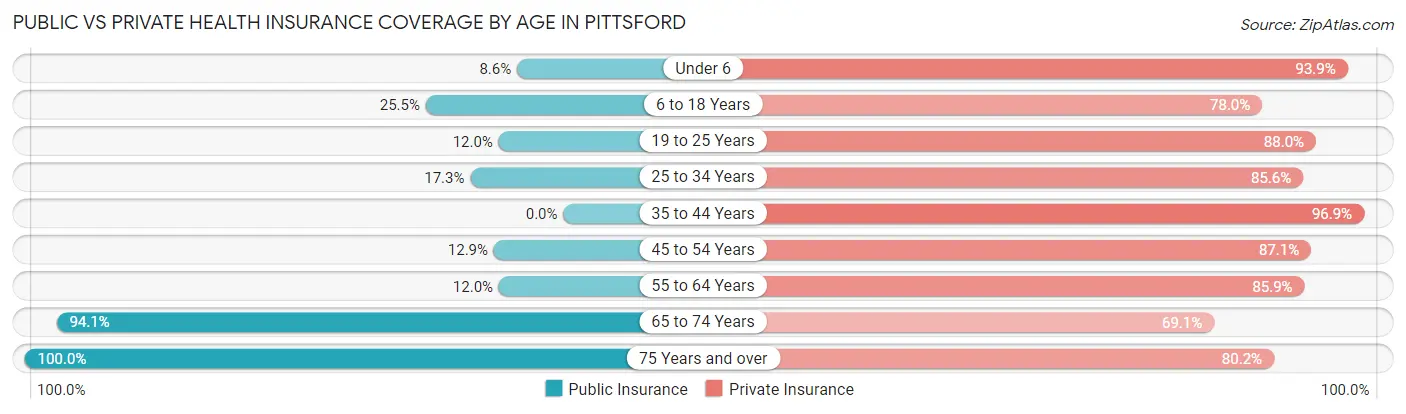
| Age Bracket | Public Insurance | Private Insurance |
| Under 6 | 14 (8.6%) | 153 (93.9%) |
| 6 to 18 Years | 72 (25.5%) | 220 (78.0%) |
| 19 to 25 Years | 6 (12.0%) | 44 (88.0%) |
| 25 to 34 Years | 24 (17.3%) | 119 (85.6%) |
| 35 to 44 Years | 0 (0.0%) | 282 (96.9%) |
| 45 to 54 Years | 24 (12.9%) | 162 (87.1%) |
| 55 to 64 Years | 33 (12.0%) | 237 (85.9%) |
| 65 to 74 Years | 143 (94.1%) | 105 (69.1%) |
| 75 Years and over | 101 (100.0%) | 81 (80.2%) |
| Total | 417 (25.4%) | 1,403 (85.6%) |
Disability Status by Sex by Age in Pittsford
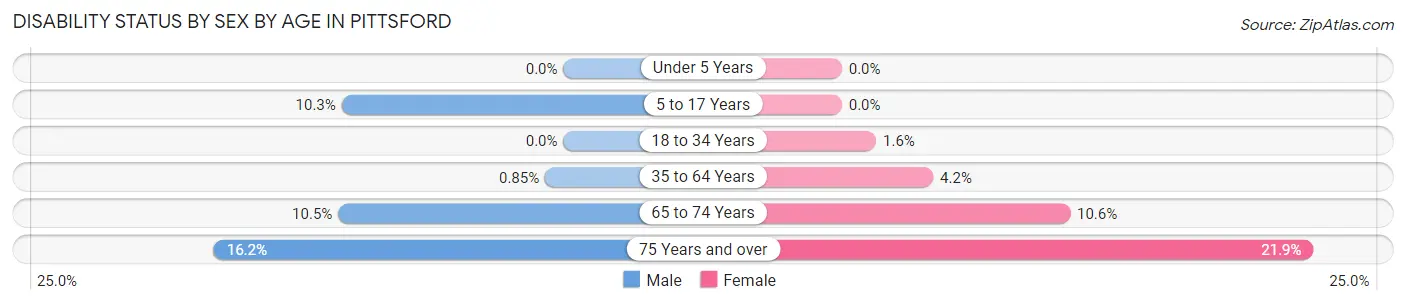
| Age Bracket | Male | Female |
| Under 5 Years | 0 (0.0%) | 0 (0.0%) |
| 5 to 17 Years | 14 (10.3%) | 0 (0.0%) |
| 18 to 34 Years | 0 (0.0%) | 2 (1.6%) |
| 35 to 64 Years | 3 (0.9%) | 17 (4.2%) |
| 65 to 74 Years | 7 (10.4%) | 9 (10.6%) |
| 75 Years and over | 6 (16.2%) | 14 (21.9%) |
Disability Class by Sex by Age in Pittsford
Disability Class: Hearing Difficulty
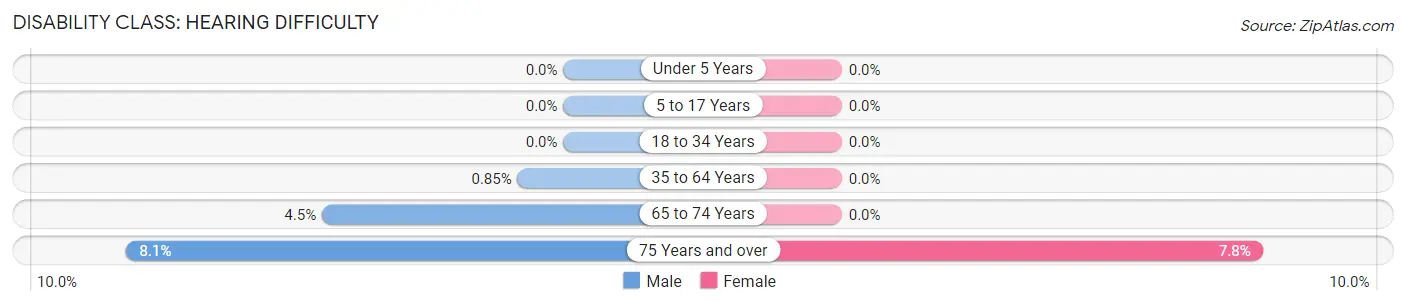
| Age Bracket | Male | Female |
| Under 5 Years | 0 (0.0%) | 0 (0.0%) |
| 5 to 17 Years | 0 (0.0%) | 0 (0.0%) |
| 18 to 34 Years | 0 (0.0%) | 0 (0.0%) |
| 35 to 64 Years | 3 (0.9%) | 0 (0.0%) |
| 65 to 74 Years | 3 (4.5%) | 0 (0.0%) |
| 75 Years and over | 3 (8.1%) | 5 (7.8%) |
Disability Class: Vision Difficulty
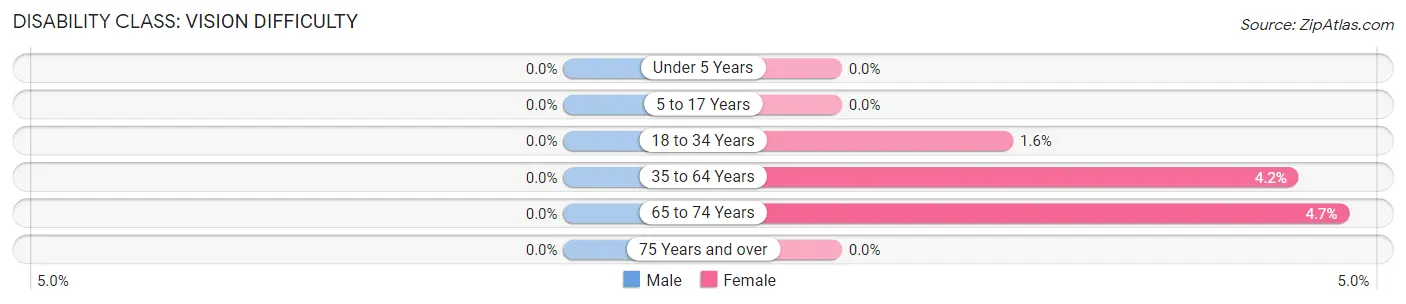
| Age Bracket | Male | Female |
| Under 5 Years | 0 (0.0%) | 0 (0.0%) |
| 5 to 17 Years | 0 (0.0%) | 0 (0.0%) |
| 18 to 34 Years | 0 (0.0%) | 2 (1.6%) |
| 35 to 64 Years | 0 (0.0%) | 17 (4.2%) |
| 65 to 74 Years | 0 (0.0%) | 4 (4.7%) |
| 75 Years and over | 0 (0.0%) | 0 (0.0%) |
Disability Class: Cognitive Difficulty
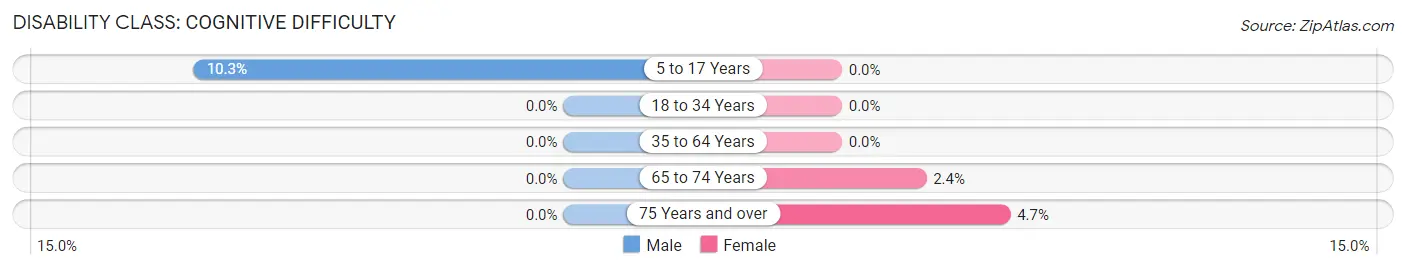
| Age Bracket | Male | Female |
| 5 to 17 Years | 14 (10.3%) | 0 (0.0%) |
| 18 to 34 Years | 0 (0.0%) | 0 (0.0%) |
| 35 to 64 Years | 0 (0.0%) | 0 (0.0%) |
| 65 to 74 Years | 0 (0.0%) | 2 (2.4%) |
| 75 Years and over | 0 (0.0%) | 3 (4.7%) |
Disability Class: Ambulatory Difficulty
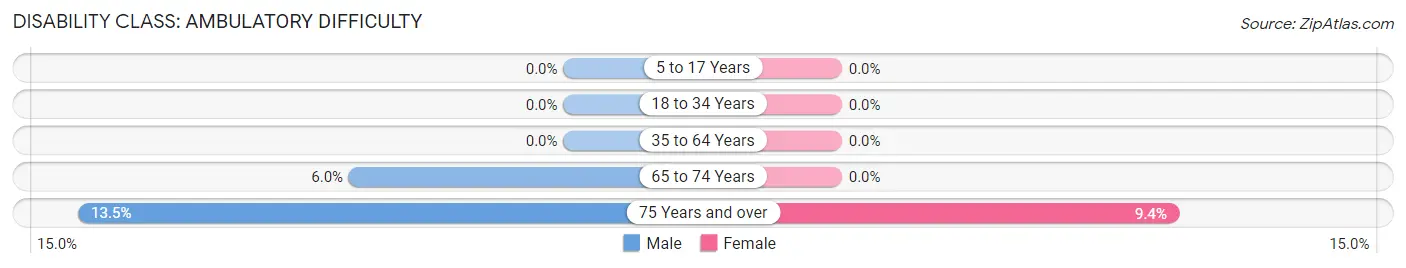
| Age Bracket | Male | Female |
| 5 to 17 Years | 0 (0.0%) | 0 (0.0%) |
| 18 to 34 Years | 0 (0.0%) | 0 (0.0%) |
| 35 to 64 Years | 0 (0.0%) | 0 (0.0%) |
| 65 to 74 Years | 4 (6.0%) | 0 (0.0%) |
| 75 Years and over | 5 (13.5%) | 6 (9.4%) |
Disability Class: Self-Care Difficulty
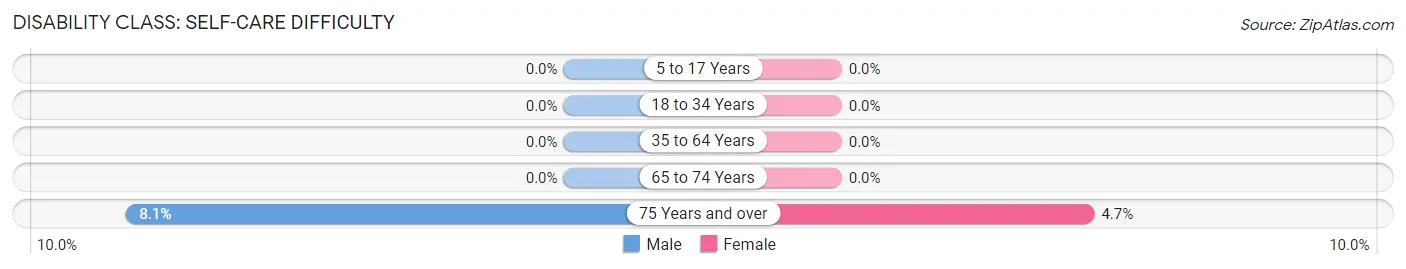
| Age Bracket | Male | Female |
| 5 to 17 Years | 0 (0.0%) | 0 (0.0%) |
| 18 to 34 Years | 0 (0.0%) | 0 (0.0%) |
| 35 to 64 Years | 0 (0.0%) | 0 (0.0%) |
| 65 to 74 Years | 0 (0.0%) | 0 (0.0%) |
| 75 Years and over | 3 (8.1%) | 3 (4.7%) |
Technology Access in Pittsford
Computing Device Access in Pittsford
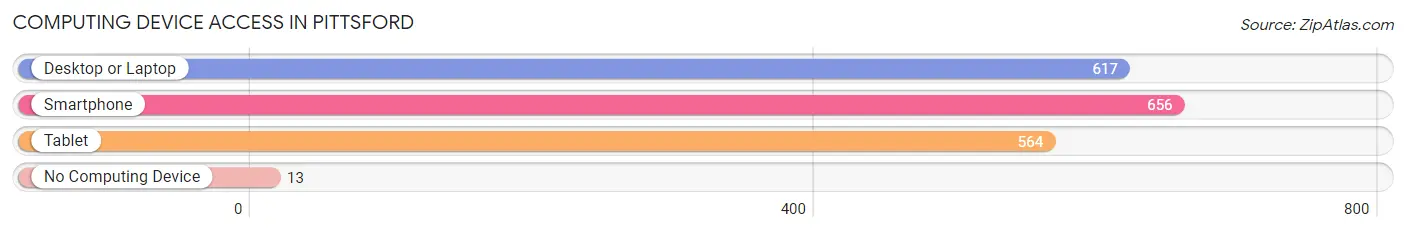
| Device Type | # Households | % Households |
| Desktop or Laptop | 617 | 90.2% |
| Smartphone | 656 | 95.9% |
| Tablet | 564 | 82.5% |
| No Computing Device | 13 | 1.9% |
| Total | 684 | 100.0% |
Internet Access in Pittsford
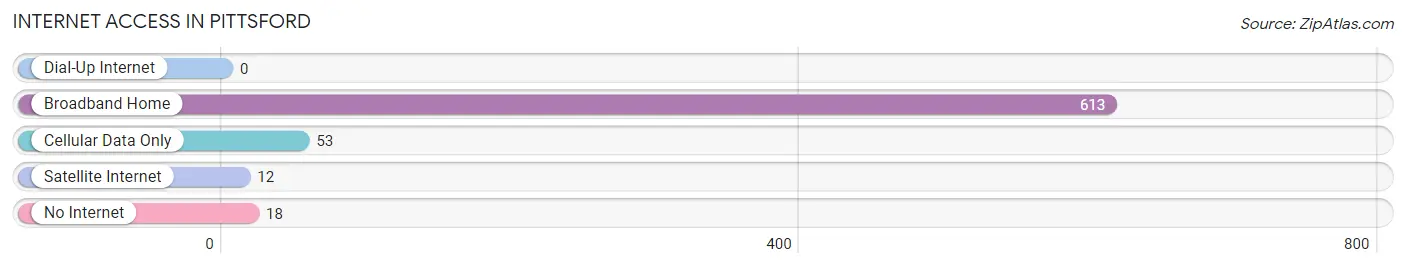
| Internet Type | # Households | % Households |
| Dial-Up Internet | 0 | 0.0% |
| Broadband Home | 613 | 89.6% |
| Cellular Data Only | 53 | 7.7% |
| Satellite Internet | 12 | 1.8% |
| No Internet | 18 | 2.6% |
| Total | 684 | 100.0% |
Pittsford Summary
Pittsford, NY is a town located in Monroe County, New York, United States. The town is a suburb of Rochester, located just south of the city. As of the 2010 census, the town had a total population of 29,405.
History
The area that is now Pittsford was first settled in 1789 by Colonel Caleb Hopkins, a Revolutionary War veteran. The town was originally part of the Town of Northfield, which was later divided into the towns of Pittsford and Brighton. The town was officially established in 1827.
The town was named after Pittsford, Vermont, the hometown of an early settler. The town was known for its many mills, which were powered by the nearby Genesee River. The mills were used to produce flour, lumber, and other goods.
Geography
Pittsford is located in western Monroe County, bordered by the towns of Brighton to the north, Mendon to the east, Perinton to the southeast, and Henrietta to the south. The Genesee River forms the western border of the town.
The town has a total area of 24.2 square miles, of which 24.1 square miles is land and 0.1 square miles is water. The highest point in the town is located at the intersection of Pittsford-Palmyra Road and Clover Street, at an elevation of 690 feet above sea level.
Economy
Pittsford is a primarily residential community, with a few small businesses located in the town. The largest employer in the town is the University of Rochester, which is located just outside of the town limits. Other major employers include Wegmans, Eastman Kodak, and Xerox.
Demographics
As of the 2010 census, there were 29,405 people, 11,845 households, and 8,717 families residing in the town. The population density was 1,219.3 people per square mile. The racial makeup of the town was 90.2% White, 4.2% African American, 0.2% Native American, 3.3% Asian, 0.1% Pacific Islander, 0.7% from other races, and 1.3% from two or more races. Hispanic or Latino of any race were 2.7% of the population.
The median income for a household in the town was $97,837, and the median income for a family was $118,945. The per capita income for the town was $50,945. About 2.2% of families and 3.7% of the population were below the poverty line, including 3.3% of those under age 18 and 3.2% of those age 65 or over.
Common Questions
What is Per Capita Income in Pittsford?
Per Capita income in Pittsford is $64,365.
What is the Median Family Income in Pittsford?
Median Family Income in Pittsford is $150,250.
What is the Median Household income in Pittsford?
Median Household Income in Pittsford is $116,250.
What is Income or Wage Gap in Pittsford?
Income or Wage Gap in Pittsford is 23.7%.
Women in Pittsford earn 76.3 cents for every dollar earned by a man.
What is Inequality or Gini Index in Pittsford?
Inequality or Gini Index in Pittsford is 0.41.
What is the Total Population of Pittsford?
Total Population of Pittsford is 1,644.
What is the Total Male Population of Pittsford?
Total Male Population of Pittsford is 777.
What is the Total Female Population of Pittsford?
Total Female Population of Pittsford is 867.
What is the Ratio of Males per 100 Females in Pittsford?
There are 89.62 Males per 100 Females in Pittsford.
What is the Ratio of Females per 100 Males in Pittsford?
There are 111.58 Females per 100 Males in Pittsford.
What is the Median Population Age in Pittsford?
Median Population Age in Pittsford is 40.4 Years.
What is the Average Family Size in Pittsford
Average Family Size in Pittsford is 3.1 People.
What is the Average Household Size in Pittsford
Average Household Size in Pittsford is 2.4 People.
How Large is the Labor Force in Pittsford?
There are 930 People in the Labor Forcein in Pittsford.
What is the Percentage of People in the Labor Force in Pittsford?
73.2% of People are in the Labor Force in Pittsford.
What is the Unemployment Rate in Pittsford?
Unemployment Rate in Pittsford is 1.9%.