Port Dickinson, NY Map & Demographics
Port Dickinson Map
Port Dickinson Overview
$28,477
PER CAPITA INCOME
$75,000
AVG FAMILY INCOME
$56,154
AVG HOUSEHOLD INCOME
28.8%
WAGE / INCOME GAP [ % ]
71.2¢/ $1
WAGE / INCOME GAP [ $ ]
0.37
INEQUALITY / GINI INDEX
1,976
TOTAL POPULATION
894
MALE POPULATION
1,082
FEMALE POPULATION
82.62
MALES / 100 FEMALES
121.03
FEMALES / 100 MALES
36.3
MEDIAN AGE
3.1
AVG FAMILY SIZE
2.5
AVG HOUSEHOLD SIZE
1,045
LABOR FORCE [ PEOPLE ]
69.0%
PERCENT IN LABOR FORCE
3.2%
UNEMPLOYMENT RATE
Income in Port Dickinson
Income Overview in Port Dickinson
Per Capita Income in Port Dickinson is $28,477, while median incomes of families and households are $75,000 and $56,154 respectively.
| Characteristic | Number | Measure |
| Per Capita Income | 1,976 | $28,477 |
| Median Family Income | 474 | $75,000 |
| Mean Family Income | 474 | $86,584 |
| Median Household Income | 794 | $56,154 |
| Mean Household Income | 794 | $70,002 |
| Income Deficit | 474 | $0 |
| Wage / Income Gap (%) | 1,976 | 28.77% |
| Wage / Income Gap ($) | 1,976 | 71.23¢ per $1 |
| Gini / Inequality Index | 1,976 | 0.37 |
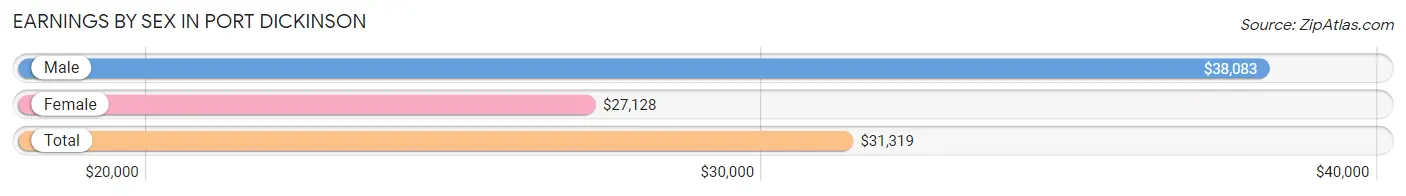
Earnings by Sex in Port Dickinson
Average Earnings in Port Dickinson are $31,319, $38,083 for men and $27,128 for women, a difference of 28.8%.
| Sex | Number | Average Earnings |
| Male | 544 (49.3%) | $38,083 |
| Female | 560 (50.7%) | $27,128 |
| Total | 1,104 (100.0%) | $31,319 |
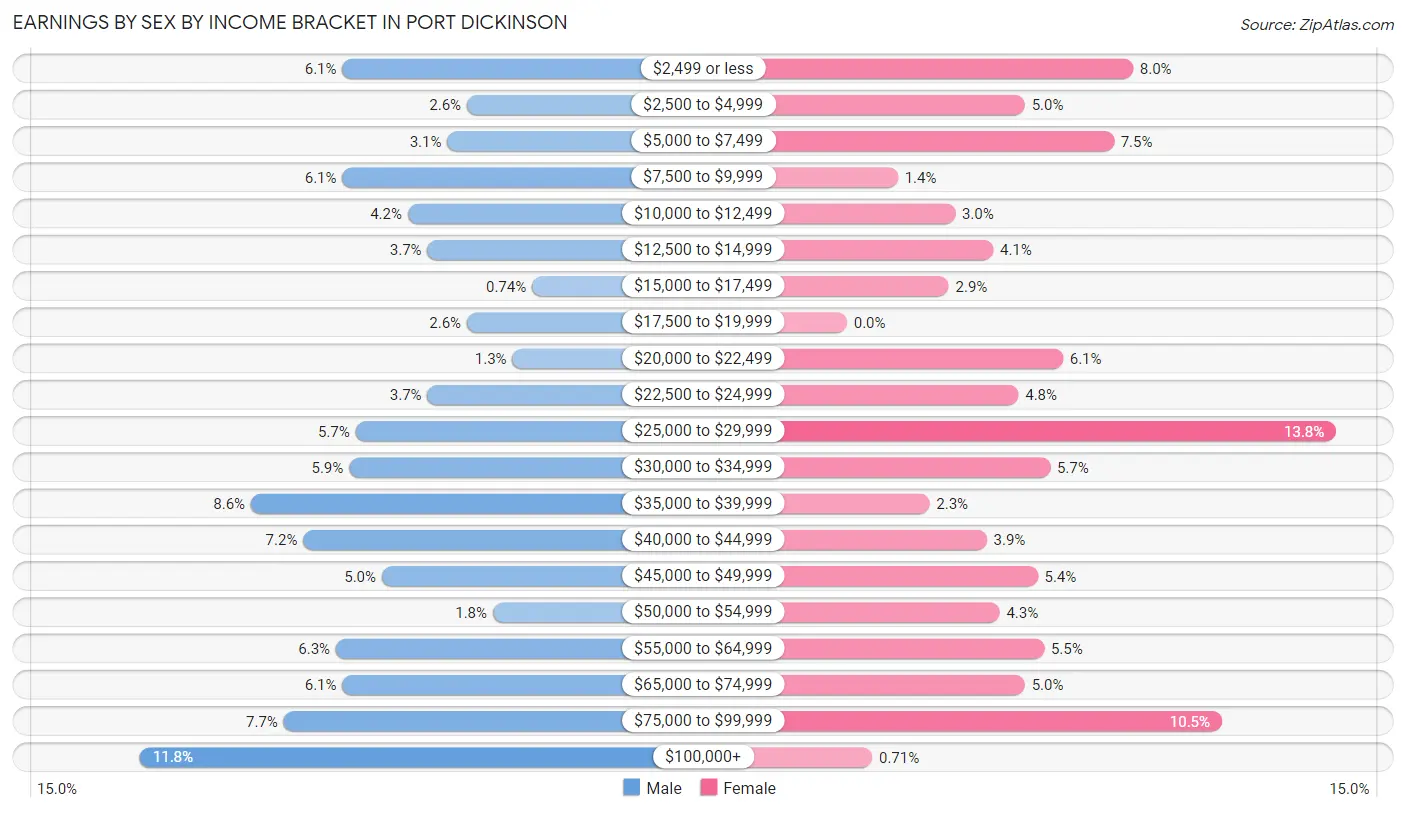
Earnings by Sex by Income Bracket in Port Dickinson
The most common earnings brackets in Port Dickinson are $100,000+ for men (64 | 11.8%) and $25,000 to $29,999 for women (77 | 13.8%).
| Income | Male | Female |
| $2,499 or less | 33 (6.1%) | 45 (8.0%) |
| $2,500 to $4,999 | 14 (2.6%) | 28 (5.0%) |
| $5,000 to $7,499 | 17 (3.1%) | 42 (7.5%) |
| $7,500 to $9,999 | 33 (6.1%) | 8 (1.4%) |
| $10,000 to $12,499 | 23 (4.2%) | 17 (3.0%) |
| $12,500 to $14,999 | 20 (3.7%) | 23 (4.1%) |
| $15,000 to $17,499 | 4 (0.7%) | 16 (2.9%) |
| $17,500 to $19,999 | 14 (2.6%) | 0 (0.0%) |
| $20,000 to $22,499 | 7 (1.3%) | 34 (6.1%) |
| $22,500 to $24,999 | 20 (3.7%) | 27 (4.8%) |
| $25,000 to $29,999 | 31 (5.7%) | 77 (13.8%) |
| $30,000 to $34,999 | 32 (5.9%) | 32 (5.7%) |
| $35,000 to $39,999 | 47 (8.6%) | 13 (2.3%) |
| $40,000 to $44,999 | 39 (7.2%) | 22 (3.9%) |
| $45,000 to $49,999 | 27 (5.0%) | 30 (5.4%) |
| $50,000 to $54,999 | 10 (1.8%) | 24 (4.3%) |
| $55,000 to $64,999 | 34 (6.2%) | 31 (5.5%) |
| $65,000 to $74,999 | 33 (6.1%) | 28 (5.0%) |
| $75,000 to $99,999 | 42 (7.7%) | 59 (10.5%) |
| $100,000+ | 64 (11.8%) | 4 (0.7%) |
| Total | 544 (100.0%) | 560 (100.0%) |
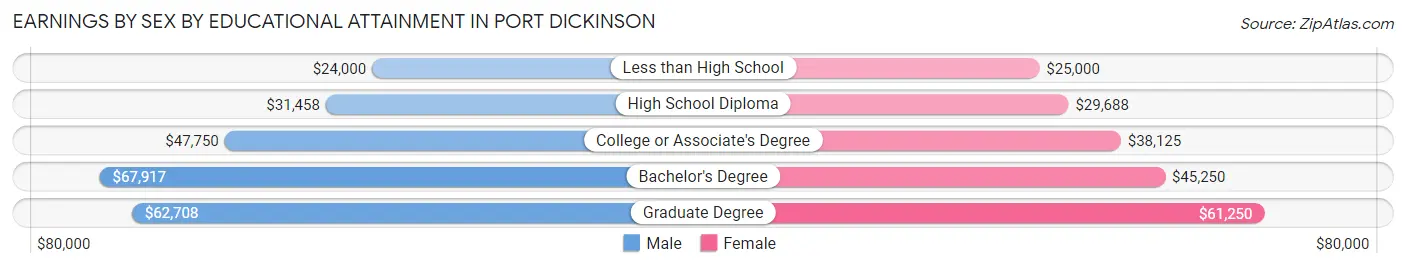
Earnings by Sex by Educational Attainment in Port Dickinson
Average earnings in Port Dickinson are $43,385 for men and $38,594 for women, a difference of 11.0%. Men with an educational attainment of bachelor's degree enjoy the highest average annual earnings of $67,917, while those with less than high school education earn the least with $24,000. Women with an educational attainment of graduate degree earn the most with the average annual earnings of $61,250, while those with less than high school education have the smallest earnings of $25,000.
| Educational Attainment | Male Income | Female Income |
| Less than High School | $24,000 | $25,000 |
| High School Diploma | $31,458 | $29,688 |
| College or Associate's Degree | $47,750 | $38,125 |
| Bachelor's Degree | $67,917 | $45,250 |
| Graduate Degree | $62,708 | $61,250 |
| Total | $43,385 | $38,594 |
Family Income in Port Dickinson
Family Income Brackets in Port Dickinson
According to the Port Dickinson family income data, there are 127 families falling into the $100,000 to $149,999 income range, which is the most common income bracket and makes up 26.8% of all families. Conversely, the $10,000 to $14,999 income bracket is the least frequent group with only 3 families (0.6%) belonging to this category.
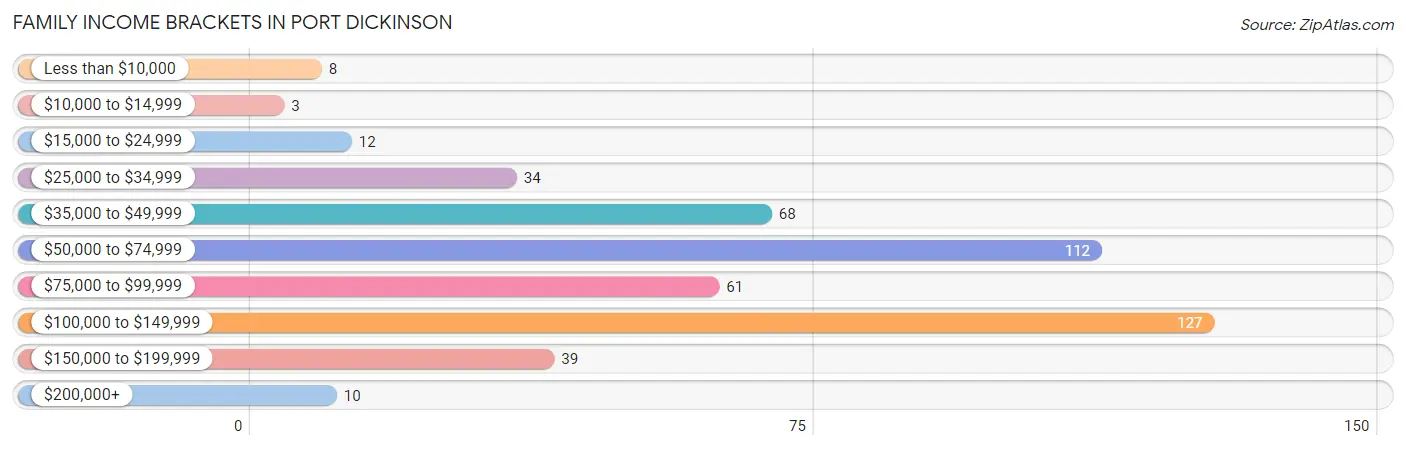
| Income Bracket | # Families | % Families |
| Less than $10,000 | 8 | 1.7% |
| $10,000 to $14,999 | 3 | 0.6% |
| $15,000 to $24,999 | 12 | 2.5% |
| $25,000 to $34,999 | 34 | 7.2% |
| $35,000 to $49,999 | 68 | 14.3% |
| $50,000 to $74,999 | 112 | 23.6% |
| $75,000 to $99,999 | 61 | 12.9% |
| $100,000 to $149,999 | 127 | 26.8% |
| $150,000 to $199,999 | 39 | 8.2% |
| $200,000+ | 10 | 2.1% |
Family Income by Famaliy Size in Port Dickinson
4-person families (81 | 17.1%) account for the highest median family income in Port Dickinson with $111,875 per family, while 2-person families (224 | 47.3%) have the highest median income of $36,634 per family member.
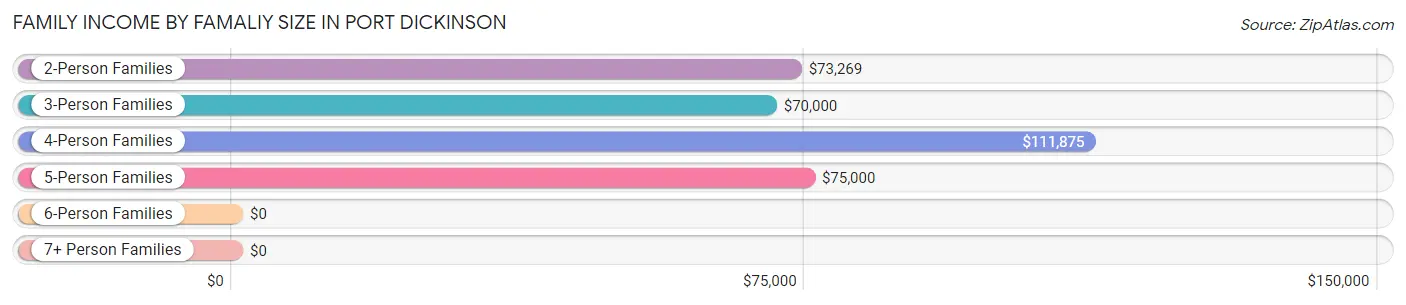
| Income Bracket | # Families | Median Income |
| 2-Person Families | 224 (47.3%) | $73,269 |
| 3-Person Families | 102 (21.5%) | $70,000 |
| 4-Person Families | 81 (17.1%) | $111,875 |
| 5-Person Families | 54 (11.4%) | $75,000 |
| 6-Person Families | 4 (0.8%) | $0 |
| 7+ Person Families | 9 (1.9%) | $0 |
| Total | 474 (100.0%) | $75,000 |
Family Income by Number of Earners in Port Dickinson
The median family income in Port Dickinson is $75,000, with families comprising 3+ earners (81) having the highest median family income of $125,250, while families with no earners (57) have the lowest median family income of $50,804, accounting for 17.1% and 12.0% of families, respectively.
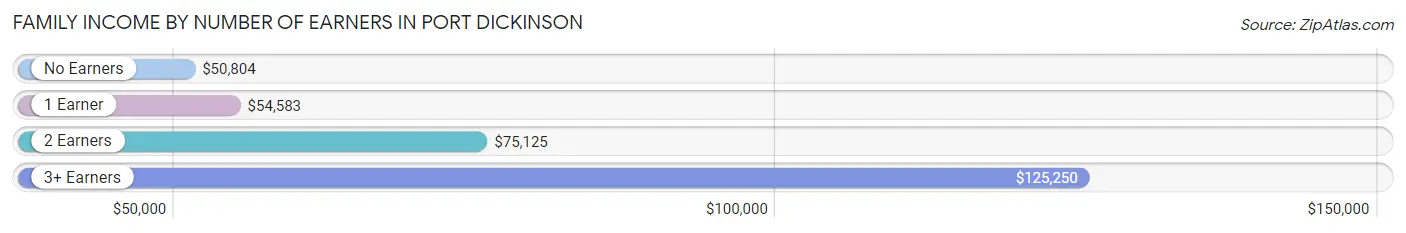
| Number of Earners | # Families | Median Income |
| No Earners | 57 (12.0%) | $50,804 |
| 1 Earner | 95 (20.0%) | $54,583 |
| 2 Earners | 241 (50.8%) | $75,125 |
| 3+ Earners | 81 (17.1%) | $125,250 |
| Total | 474 (100.0%) | $75,000 |
Household Income in Port Dickinson
Household Income Brackets in Port Dickinson
With 180 households falling in the category, the $50,000 to $74,999 income range is the most frequent in Port Dickinson, accounting for 22.7% of all households. In contrast, only 10 households (1.3%) fall into the $200,000+ income bracket, making it the least populous group.
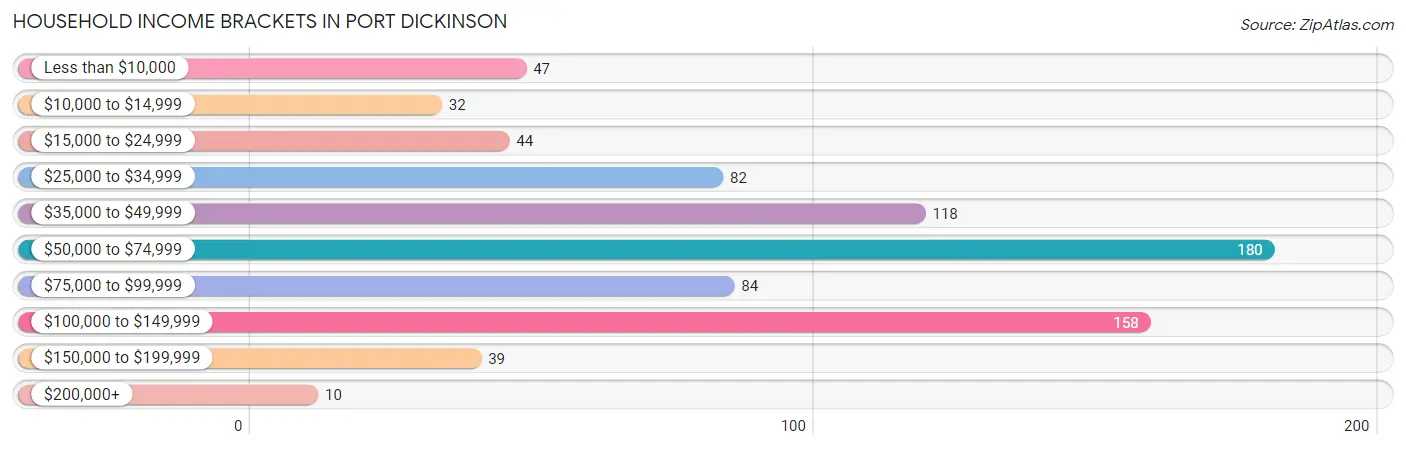
| Income Bracket | # Households | % Households |
| Less than $10,000 | 47 | 5.9% |
| $10,000 to $14,999 | 32 | 4.0% |
| $15,000 to $24,999 | 44 | 5.5% |
| $25,000 to $34,999 | 82 | 10.3% |
| $35,000 to $49,999 | 118 | 14.9% |
| $50,000 to $74,999 | 180 | 22.7% |
| $75,000 to $99,999 | 84 | 10.6% |
| $100,000 to $149,999 | 158 | 19.9% |
| $150,000 to $199,999 | 39 | 4.9% |
| $200,000+ | 10 | 1.3% |
Household Income by Householder Age in Port Dickinson
The median household income in Port Dickinson is $56,154, with the highest median household income of $71,875 found in the 45 to 64 years age bracket for the primary householder. A total of 272 households (34.3%) fall into this category. Meanwhile, the 15 to 24 years age bracket for the primary householder has the lowest median household income of $31,667, with 78 households (9.8%) in this group.
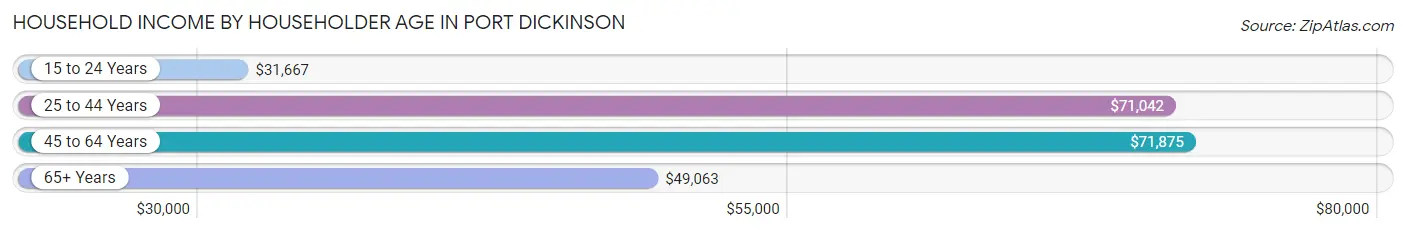
| Income Bracket | # Households | Median Income |
| 15 to 24 Years | 78 (9.8%) | $31,667 |
| 25 to 44 Years | 233 (29.3%) | $71,042 |
| 45 to 64 Years | 272 (34.3%) | $71,875 |
| 65+ Years | 211 (26.6%) | $49,063 |
| Total | 794 (100.0%) | $56,154 |
Poverty in Port Dickinson
Income Below Poverty by Sex and Age in Port Dickinson
With 13.5% poverty level for males and 10.5% for females among the residents of Port Dickinson, 5 year old males and 6 to 11 year old females are the most vulnerable to poverty, with 4 males (40.0%) and 30 females (25.6%) in their respective age groups living below the poverty level.
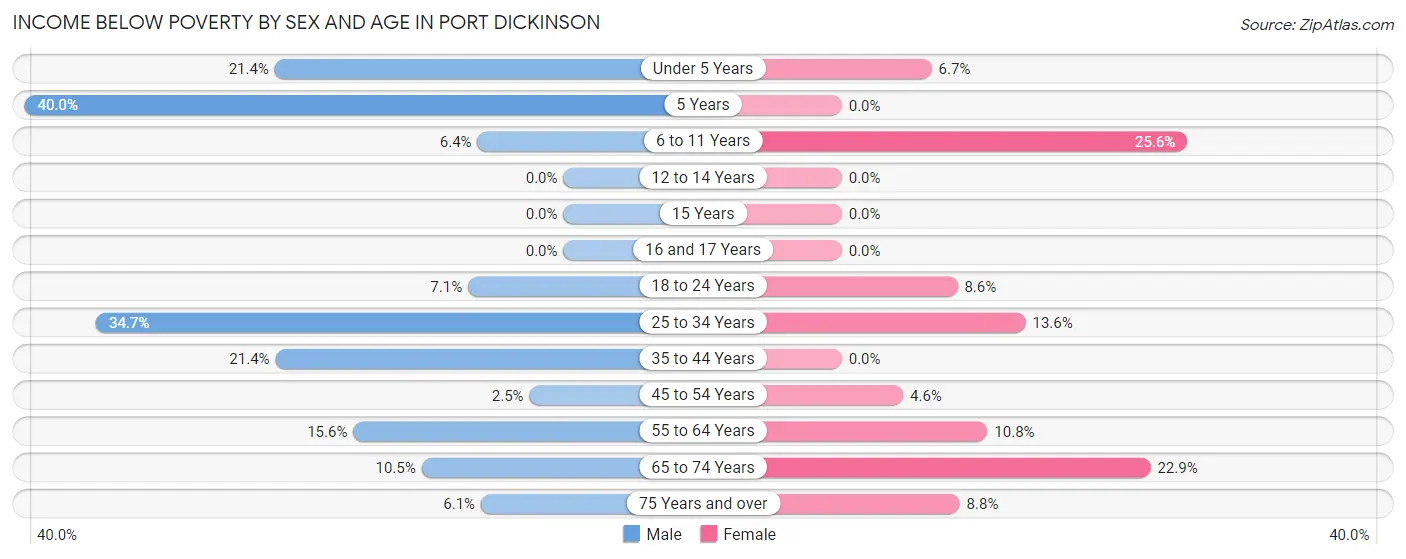
| Age Bracket | Male | Female |
| Under 5 Years | 3 (21.4%) | 3 (6.7%) |
| 5 Years | 4 (40.0%) | 0 (0.0%) |
| 6 to 11 Years | 6 (6.4%) | 30 (25.6%) |
| 12 to 14 Years | 0 (0.0%) | 0 (0.0%) |
| 15 Years | 0 (0.0%) | 0 (0.0%) |
| 16 and 17 Years | 0 (0.0%) | 0 (0.0%) |
| 18 to 24 Years | 8 (7.1%) | 14 (8.6%) |
| 25 to 34 Years | 34 (34.7%) | 15 (13.6%) |
| 35 to 44 Years | 31 (21.4%) | 0 (0.0%) |
| 45 to 54 Years | 3 (2.5%) | 5 (4.5%) |
| 55 to 64 Years | 17 (15.6%) | 12 (10.8%) |
| 65 to 74 Years | 8 (10.5%) | 22 (22.9%) |
| 75 Years and over | 3 (6.1%) | 7 (8.7%) |
| Total | 117 (13.5%) | 108 (10.5%) |
Income Above Poverty by Sex and Age in Port Dickinson
According to the poverty statistics in Port Dickinson, males aged 12 to 14 years and females aged 5 years are the age groups that are most secure financially, with 100.0% of males and 100.0% of females in these age groups living above the poverty line.
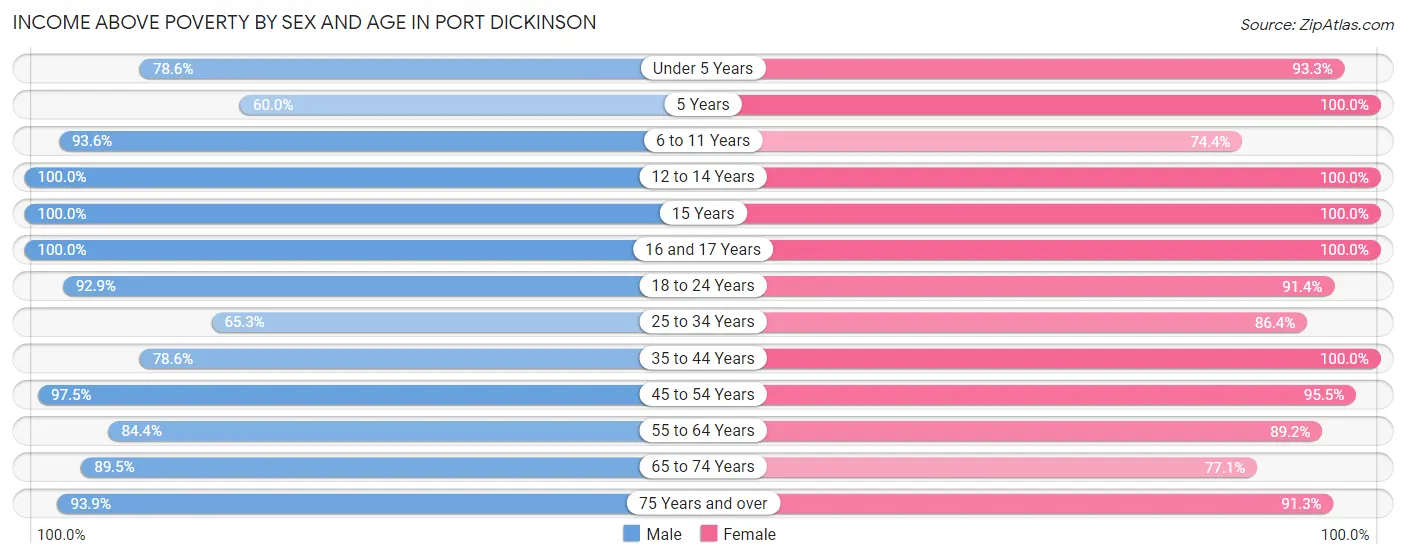
| Age Bracket | Male | Female |
| Under 5 Years | 11 (78.6%) | 42 (93.3%) |
| 5 Years | 6 (60.0%) | 8 (100.0%) |
| 6 to 11 Years | 88 (93.6%) | 87 (74.4%) |
| 12 to 14 Years | 18 (100.0%) | 52 (100.0%) |
| 15 Years | 13 (100.0%) | 13 (100.0%) |
| 16 and 17 Years | 12 (100.0%) | 13 (100.0%) |
| 18 to 24 Years | 105 (92.9%) | 149 (91.4%) |
| 25 to 34 Years | 64 (65.3%) | 95 (86.4%) |
| 35 to 44 Years | 114 (78.6%) | 111 (100.0%) |
| 45 to 54 Years | 116 (97.5%) | 105 (95.5%) |
| 55 to 64 Years | 92 (84.4%) | 99 (89.2%) |
| 65 to 74 Years | 68 (89.5%) | 74 (77.1%) |
| 75 Years and over | 46 (93.9%) | 73 (91.2%) |
| Total | 753 (86.6%) | 921 (89.5%) |
Income Below Poverty Among Married-Couple Families in Port Dickinson
The poverty statistics for married-couple families in Port Dickinson show that 4.8% or 17 of the total 356 families live below the poverty line. Families with 3 or 4 children have the highest poverty rate of 31.2%, comprising of 10 families. On the other hand, families with no children have the lowest poverty rate of 1.4%, which includes 3 families.
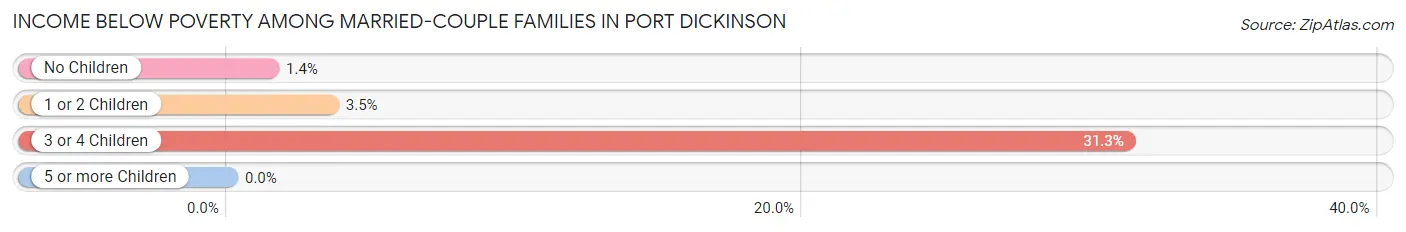
| Children | Above Poverty | Below Poverty |
| No Children | 207 (98.6%) | 3 (1.4%) |
| 1 or 2 Children | 110 (96.5%) | 4 (3.5%) |
| 3 or 4 Children | 22 (68.8%) | 10 (31.2%) |
| 5 or more Children | 0 (0.0%) | 0 (0.0%) |
| Total | 339 (95.2%) | 17 (4.8%) |
Income Below Poverty Among Single-Parent Households in Port Dickinson
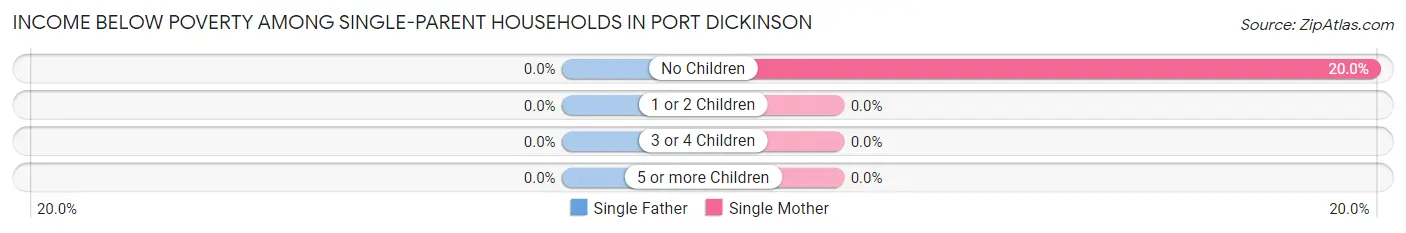
| Children | Single Father | Single Mother |
| No Children | 0 (0.0%) | 5 (20.0%) |
| 1 or 2 Children | 0 (0.0%) | 0 (0.0%) |
| 3 or 4 Children | 0 (0.0%) | 0 (0.0%) |
| 5 or more Children | 0 (0.0%) | 0 (0.0%) |
| Total | 0 (0.0%) | 5 (6.2%) |
Income Below Poverty Among Married-Couple vs Single-Parent Households in Port Dickinson
The poverty data for Port Dickinson shows that 17 of the married-couple family households (4.8%) and 5 of the single-parent households (4.2%) are living below the poverty level. Within the married-couple family households, those with 3 or 4 children have the highest poverty rate, with 10 households (31.2%) falling below the poverty line. Among the single-parent households, those with no children have the highest poverty rate, with 5 household (10.0%) living below poverty.
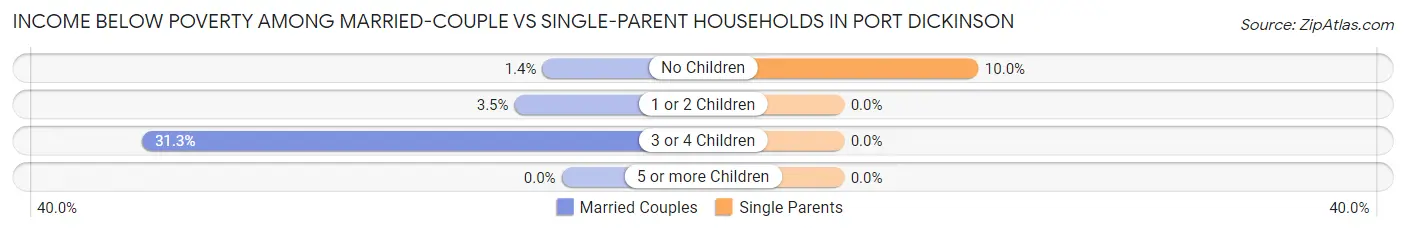
| Children | Married-Couple Families | Single-Parent Households |
| No Children | 3 (1.4%) | 5 (10.0%) |
| 1 or 2 Children | 4 (3.5%) | 0 (0.0%) |
| 3 or 4 Children | 10 (31.2%) | 0 (0.0%) |
| 5 or more Children | 0 (0.0%) | 0 (0.0%) |
| Total | 17 (4.8%) | 5 (4.2%) |
Race in Port Dickinson
The most populous races in Port Dickinson are White / Caucasian (1,870 | 94.6%), Hispanic or Latino (84 | 4.3%), and Two or more Races (50 | 2.5%).
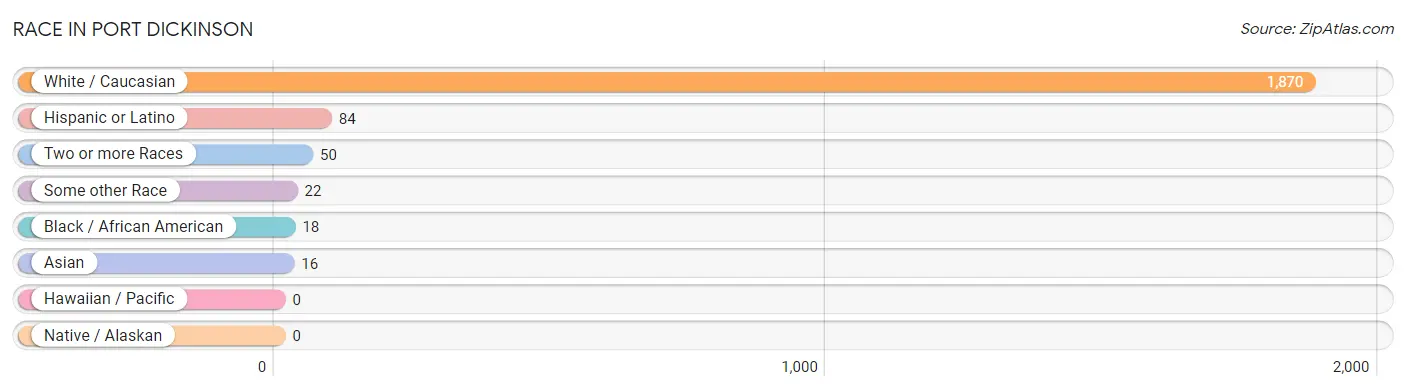
| Race | # Population | % Population |
| Asian | 16 | 0.8% |
| Black / African American | 18 | 0.9% |
| Hawaiian / Pacific | 0 | 0.0% |
| Hispanic or Latino | 84 | 4.3% |
| Native / Alaskan | 0 | 0.0% |
| White / Caucasian | 1,870 | 94.6% |
| Two or more Races | 50 | 2.5% |
| Some other Race | 22 | 1.1% |
| Total | 1,976 | 100.0% |
Ancestry in Port Dickinson
The most populous ancestries reported in Port Dickinson are Irish (723 | 36.6%), German (337 | 17.1%), English (301 | 15.2%), Italian (202 | 10.2%), and American (102 | 5.2%), together accounting for 84.2% of all Port Dickinson residents.
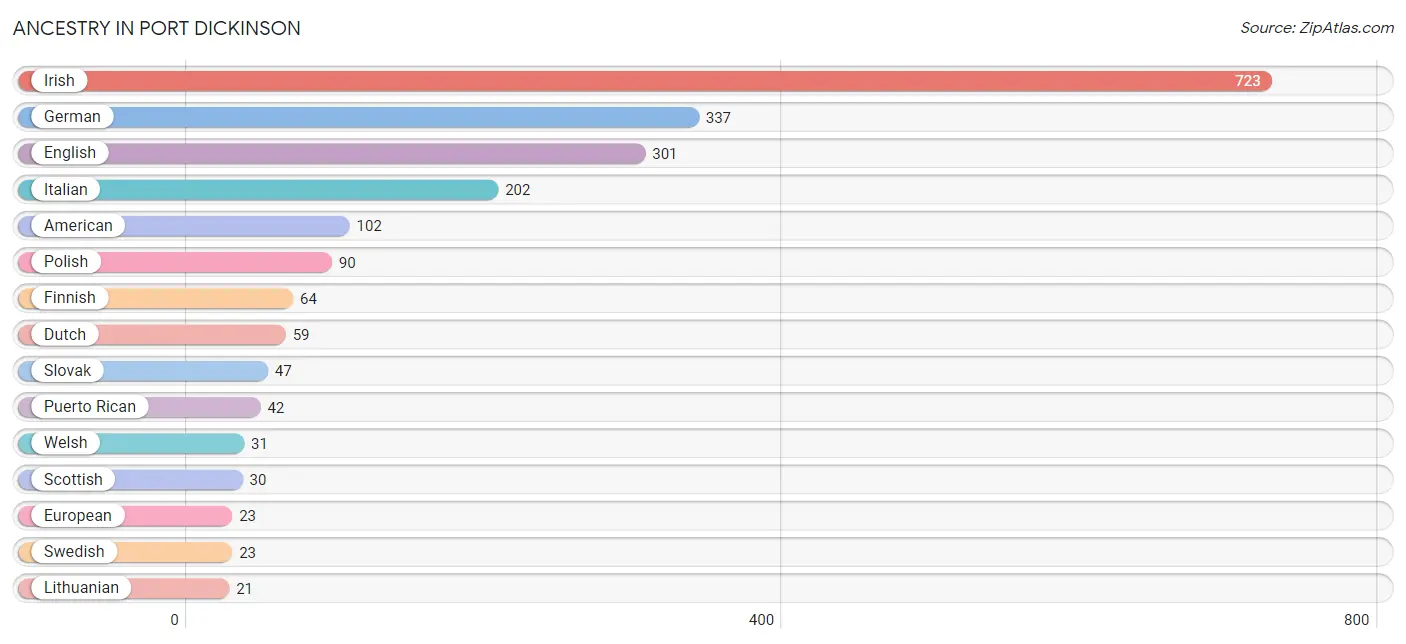
| Ancestry | # Population | % Population |
| African | 6 | 0.3% |
| Albanian | 13 | 0.7% |
| American | 102 | 5.2% |
| Austrian | 2 | 0.1% |
| Brazilian | 4 | 0.2% |
| British | 6 | 0.3% |
| Burmese | 7 | 0.4% |
| Central American | 3 | 0.2% |
| Colombian | 6 | 0.3% |
| Czech | 3 | 0.2% |
| Czechoslovakian | 4 | 0.2% |
| Dutch | 59 | 3.0% |
| Eastern European | 10 | 0.5% |
| English | 301 | 15.2% |
| European | 23 | 1.2% |
| Finnish | 64 | 3.2% |
| French | 10 | 0.5% |
| German | 337 | 17.1% |
| Guatemalan | 3 | 0.2% |
| Guyanese | 3 | 0.2% |
| Hungarian | 16 | 0.8% |
| Irish | 723 | 36.6% |
| Italian | 202 | 10.2% |
| Kiowa | 1 | 0.1% |
| Lithuanian | 21 | 1.1% |
| Malaysian | 16 | 0.8% |
| Mexican | 20 | 1.0% |
| Northern European | 4 | 0.2% |
| Norwegian | 16 | 0.8% |
| Polish | 90 | 4.5% |
| Portuguese | 4 | 0.2% |
| Puerto Rican | 42 | 2.1% |
| Russian | 11 | 0.6% |
| Scandinavian | 3 | 0.2% |
| Scotch-Irish | 19 | 1.0% |
| Scottish | 30 | 1.5% |
| Slavic | 15 | 0.8% |
| Slovak | 47 | 2.4% |
| Somali | 8 | 0.4% |
| South American | 6 | 0.3% |
| Spaniard | 2 | 0.1% |
| Subsaharan African | 14 | 0.7% |
| Swedish | 23 | 1.2% |
| Swiss | 9 | 0.5% |
| Ukrainian | 4 | 0.2% |
| Welsh | 31 | 1.6% | View All 46 Rows |
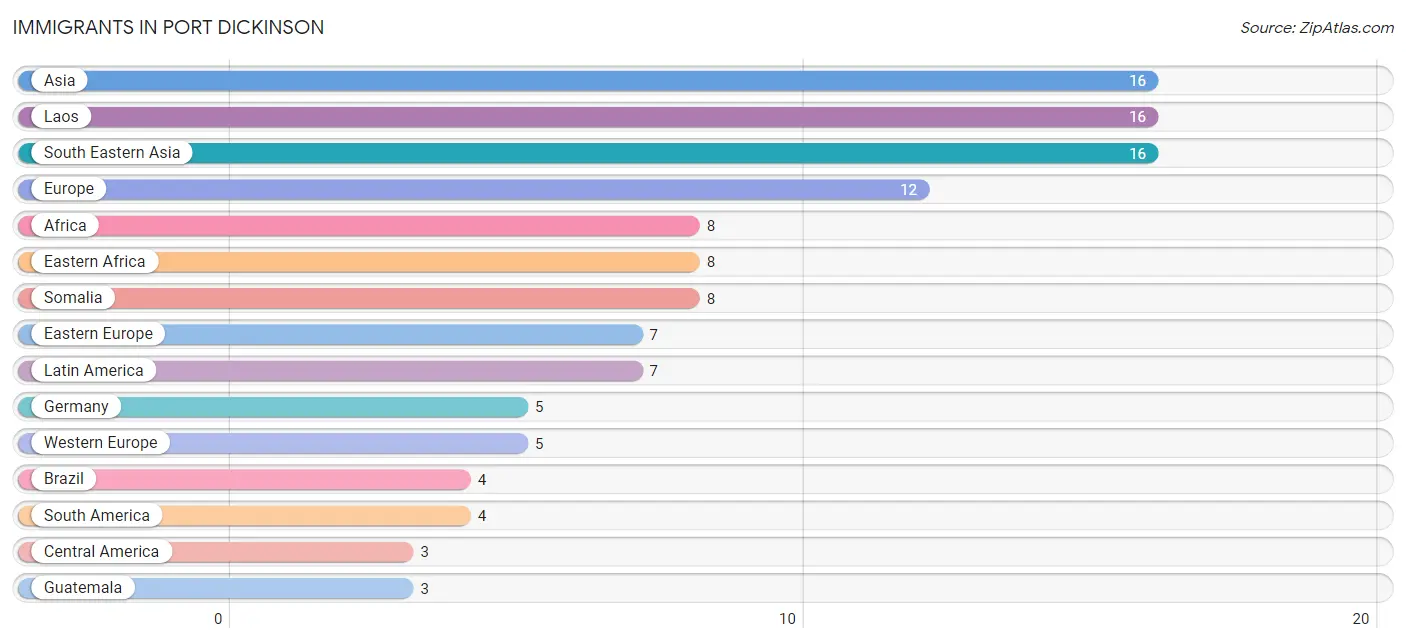
Immigrants in Port Dickinson
The most numerous immigrant groups reported in Port Dickinson came from Asia (16 | 0.8%), Laos (16 | 0.8%), South Eastern Asia (16 | 0.8%), Europe (12 | 0.6%), and Africa (8 | 0.4%), together accounting for 3.4% of all Port Dickinson residents.
| Immigration Origin | # Population | % Population |
| Africa | 8 | 0.4% |
| Asia | 16 | 0.8% |
| Brazil | 4 | 0.2% |
| Central America | 3 | 0.2% |
| Eastern Africa | 8 | 0.4% |
| Eastern Europe | 7 | 0.4% |
| Europe | 12 | 0.6% |
| Germany | 5 | 0.3% |
| Guatemala | 3 | 0.2% |
| Laos | 16 | 0.8% |
| Latin America | 7 | 0.4% |
| Somalia | 8 | 0.4% |
| South America | 4 | 0.2% |
| South Eastern Asia | 16 | 0.8% |
| Western Europe | 5 | 0.3% | View All 15 Rows |
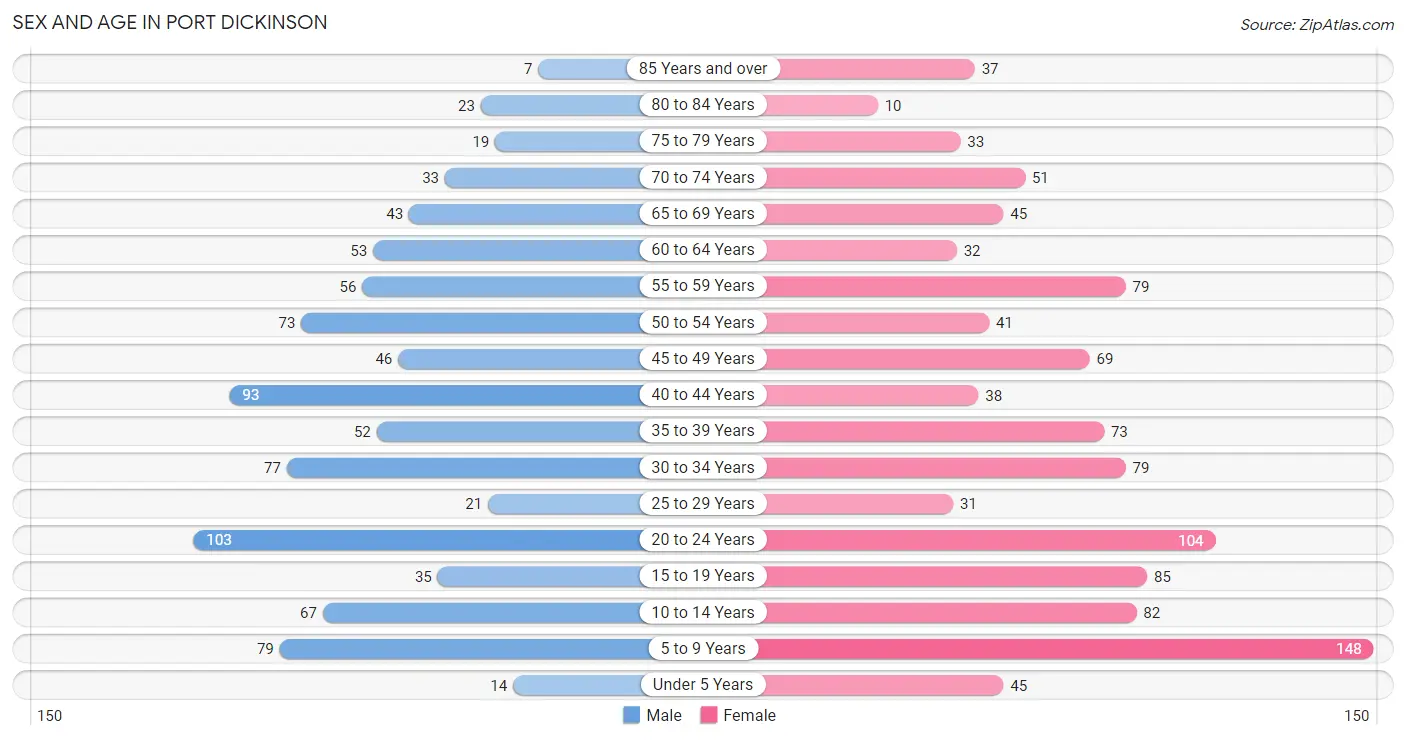
Sex and Age in Port Dickinson
Sex and Age in Port Dickinson
The most populous age groups in Port Dickinson are 20 to 24 Years (103 | 11.5%) for men and 5 to 9 Years (148 | 13.7%) for women.
| Age Bracket | Male | Female |
| Under 5 Years | 14 (1.6%) | 45 (4.2%) |
| 5 to 9 Years | 79 (8.8%) | 148 (13.7%) |
| 10 to 14 Years | 67 (7.5%) | 82 (7.6%) |
| 15 to 19 Years | 35 (3.9%) | 85 (7.9%) |
| 20 to 24 Years | 103 (11.5%) | 104 (9.6%) |
| 25 to 29 Years | 21 (2.4%) | 31 (2.9%) |
| 30 to 34 Years | 77 (8.6%) | 79 (7.3%) |
| 35 to 39 Years | 52 (5.8%) | 73 (6.8%) |
| 40 to 44 Years | 93 (10.4%) | 38 (3.5%) |
| 45 to 49 Years | 46 (5.1%) | 69 (6.4%) |
| 50 to 54 Years | 73 (8.2%) | 41 (3.8%) |
| 55 to 59 Years | 56 (6.3%) | 79 (7.3%) |
| 60 to 64 Years | 53 (5.9%) | 32 (3.0%) |
| 65 to 69 Years | 43 (4.8%) | 45 (4.2%) |
| 70 to 74 Years | 33 (3.7%) | 51 (4.7%) |
| 75 to 79 Years | 19 (2.1%) | 33 (3.0%) |
| 80 to 84 Years | 23 (2.6%) | 10 (0.9%) |
| 85 Years and over | 7 (0.8%) | 37 (3.4%) |
| Total | 894 (100.0%) | 1,082 (100.0%) |
Families and Households in Port Dickinson
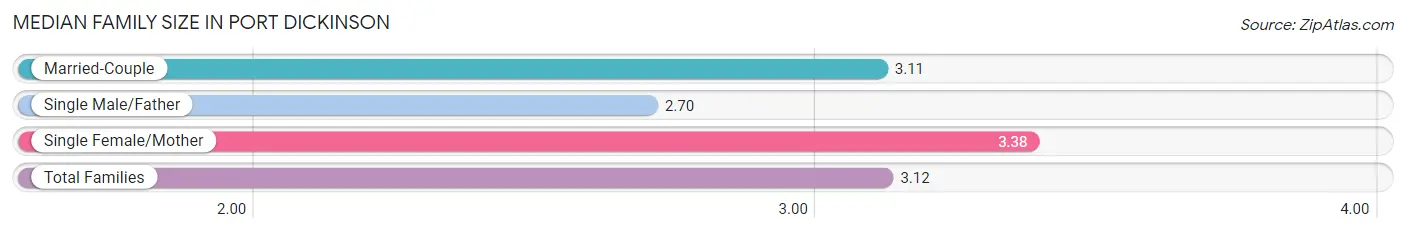
Median Family Size in Port Dickinson
The median family size in Port Dickinson is 3.12 persons per family, with single female/mother families (81 | 17.1%) accounting for the largest median family size of 3.38 persons per family. On the other hand, single male/father families (37 | 7.8%) represent the smallest median family size with 2.70 persons per family.
| Family Type | # Families | Family Size |
| Married-Couple | 356 (75.1%) | 3.11 |
| Single Male/Father | 37 (7.8%) | 2.70 |
| Single Female/Mother | 81 (17.1%) | 3.38 |
| Total Families | 474 (100.0%) | 3.12 |
Median Household Size in Port Dickinson
The median household size in Port Dickinson is 2.47 persons per household, with single female/mother households (81 | 10.2%) accounting for the largest median household size of 3.46 persons per household. non-family households (320 | 40.3%) represent the smallest median household size with 1.22 persons per household.

| Household Type | # Households | Household Size |
| Married-Couple | 356 (44.8%) | 3.33 |
| Single Male/Father | 37 (4.7%) | 2.84 |
| Single Female/Mother | 81 (10.2%) | 3.46 |
| Non-family | 320 (40.3%) | 1.22 |
| Total Households | 794 (100.0%) | 2.47 |
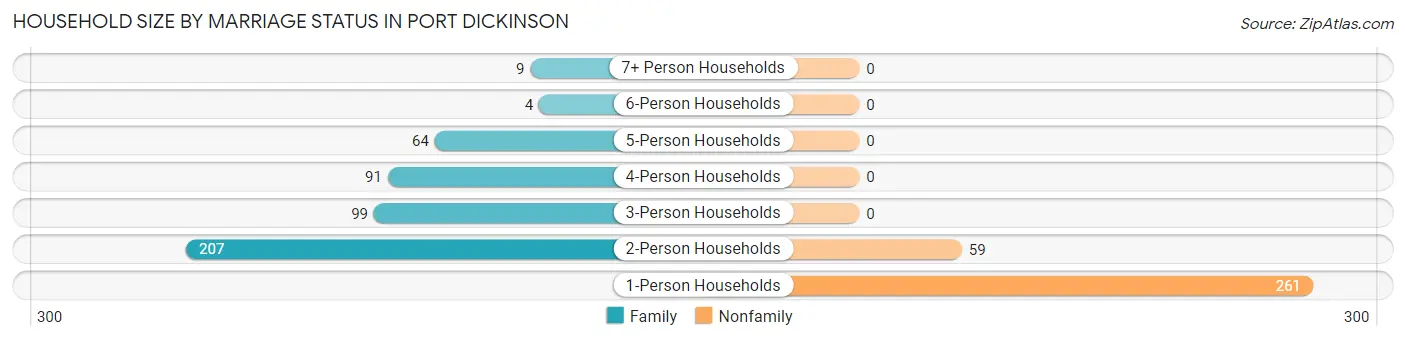
Household Size by Marriage Status in Port Dickinson
Out of a total of 794 households in Port Dickinson, 474 (59.7%) are family households, while 320 (40.3%) are nonfamily households. The most numerous type of family households are 2-person households, comprising 207, and the most common type of nonfamily households are 1-person households, comprising 261.
| Household Size | Family Households | Nonfamily Households |
| 1-Person Households | - | 261 (32.9%) |
| 2-Person Households | 207 (26.1%) | 59 (7.4%) |
| 3-Person Households | 99 (12.5%) | 0 (0.0%) |
| 4-Person Households | 91 (11.5%) | 0 (0.0%) |
| 5-Person Households | 64 (8.1%) | 0 (0.0%) |
| 6-Person Households | 4 (0.5%) | 0 (0.0%) |
| 7+ Person Households | 9 (1.1%) | 0 (0.0%) |
| Total | 474 (59.7%) | 320 (40.3%) |
Female Fertility in Port Dickinson
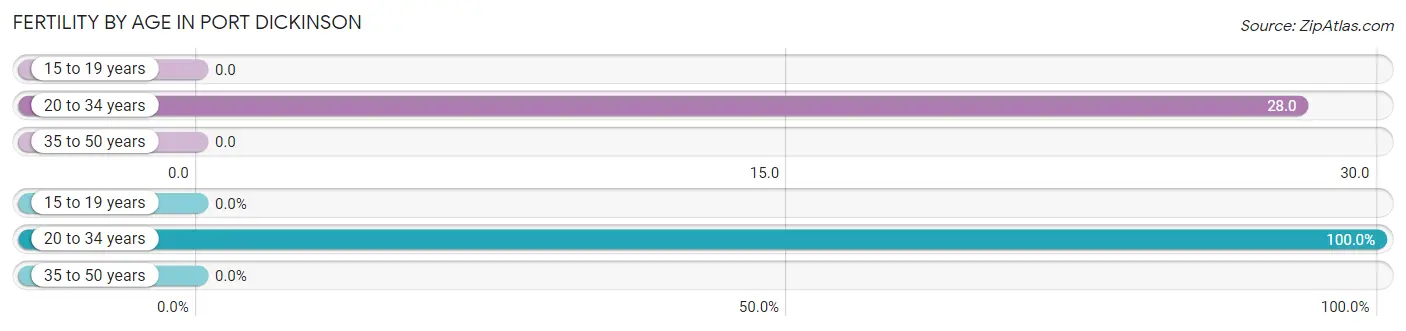
Fertility by Age in Port Dickinson
Average fertility rate in Port Dickinson is 12.0 births per 1,000 women. Women in the age bracket of 20 to 34 years have the highest fertility rate with 28.0 births per 1,000 women. Women in the age bracket of 20 to 34 years acount for 100.0% of all women with births.
| Age Bracket | Women with Births | Births / 1,000 Women |
| 15 to 19 years | 0 (0.0%) | 0.0 |
| 20 to 34 years | 6 (100.0%) | 28.0 |
| 35 to 50 years | 0 (0.0%) | 0.0 |
| Total | 6 (100.0%) | 12.0 |
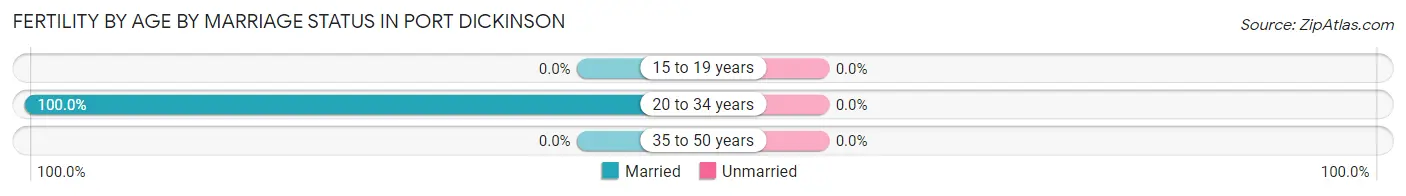
Fertility by Age by Marriage Status in Port Dickinson
| Age Bracket | Married | Unmarried |
| 15 to 19 years | 0 (0.0%) | 0 (0.0%) |
| 20 to 34 years | 6 (100.0%) | 0 (0.0%) |
| 35 to 50 years | 0 (0.0%) | 0 (0.0%) |
| Total | 6 (100.0%) | 0 (0.0%) |
Fertility by Education in Port Dickinson
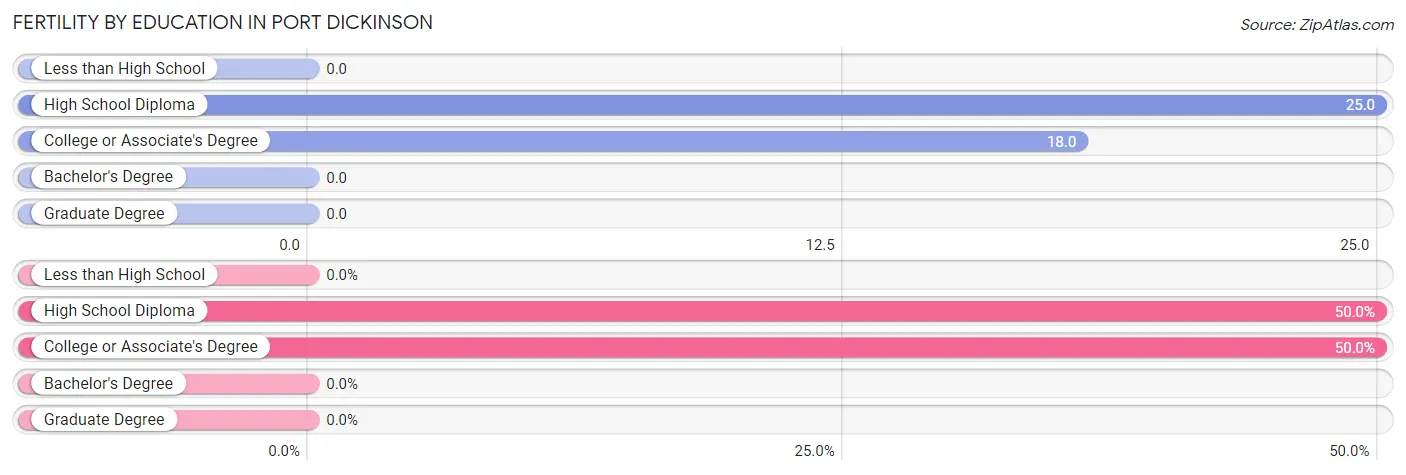
| Educational Attainment | Women with Births | Births / 1,000 Women |
| Less than High School | 0 (0.0%) | 0.0 |
| High School Diploma | 3 (50.0%) | 25.0 |
| College or Associate's Degree | 3 (50.0%) | 18.0 |
| Bachelor's Degree | 0 (0.0%) | 0.0 |
| Graduate Degree | 0 (0.0%) | 0.0 |
| Total | 6 (100.0%) | 12.0 |
Fertility by Education by Marriage Status in Port Dickinson
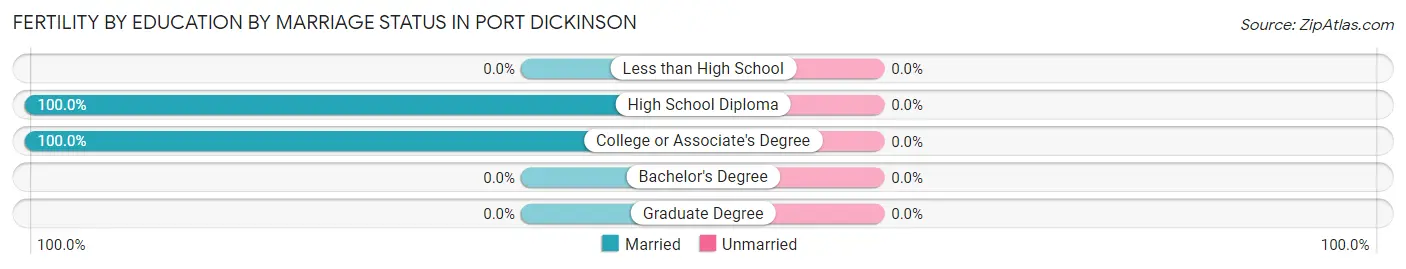
| Educational Attainment | Married | Unmarried |
| Less than High School | 0 (0.0%) | 0 (0.0%) |
| High School Diploma | 3 (100.0%) | 0 (0.0%) |
| College or Associate's Degree | 3 (100.0%) | 0 (0.0%) |
| Bachelor's Degree | 0 (0.0%) | 0 (0.0%) |
| Graduate Degree | 0 (0.0%) | 0 (0.0%) |
| Total | 6 (100.0%) | 0 (0.0%) |
Employment Characteristics in Port Dickinson
Employment by Class of Employer in Port Dickinson
Among the 1,007 employed individuals in Port Dickinson, private company employees (523 | 51.9%), state government employees (161 | 16.0%), and local government employees (155 | 15.4%) make up the most common classes of employment.
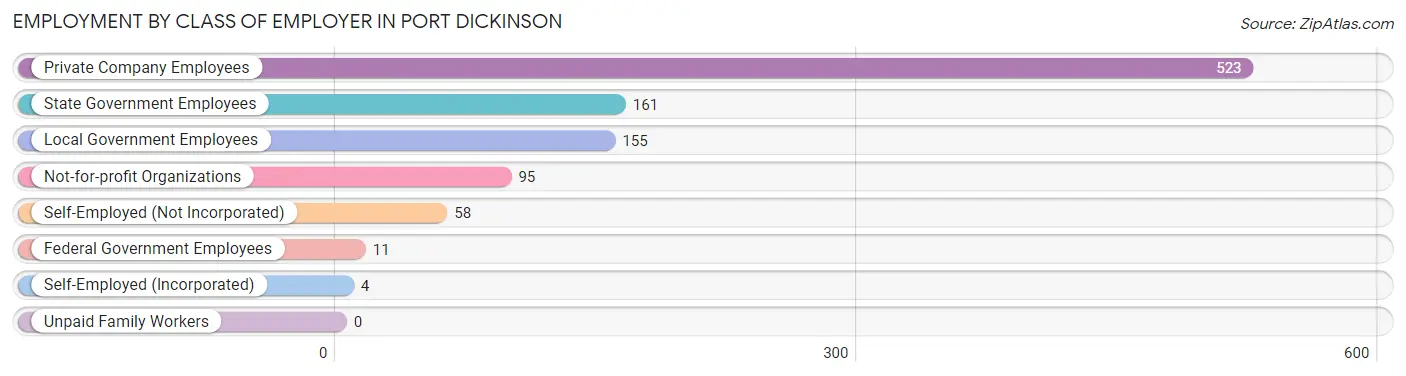
| Employer Class | # Employees | % Employees |
| Private Company Employees | 523 | 51.9% |
| Self-Employed (Incorporated) | 4 | 0.4% |
| Self-Employed (Not Incorporated) | 58 | 5.8% |
| Not-for-profit Organizations | 95 | 9.4% |
| Local Government Employees | 155 | 15.4% |
| State Government Employees | 161 | 16.0% |
| Federal Government Employees | 11 | 1.1% |
| Unpaid Family Workers | 0 | 0.0% |
| Total | 1,007 | 100.0% |
Employment Status by Age in Port Dickinson
According to the labor force statistics for Port Dickinson, out of the total population over 16 years of age (1,515), 69.0% or 1,045 individuals are in the labor force, with 3.2% or 33 of them unemployed. The age group with the highest labor force participation rate is 45 to 54 years, with 89.5% or 205 individuals in the labor force. Within the labor force, the 16 to 19 years age range has the highest percentage of unemployed individuals, with 30.0% or 21 of them being unemployed.
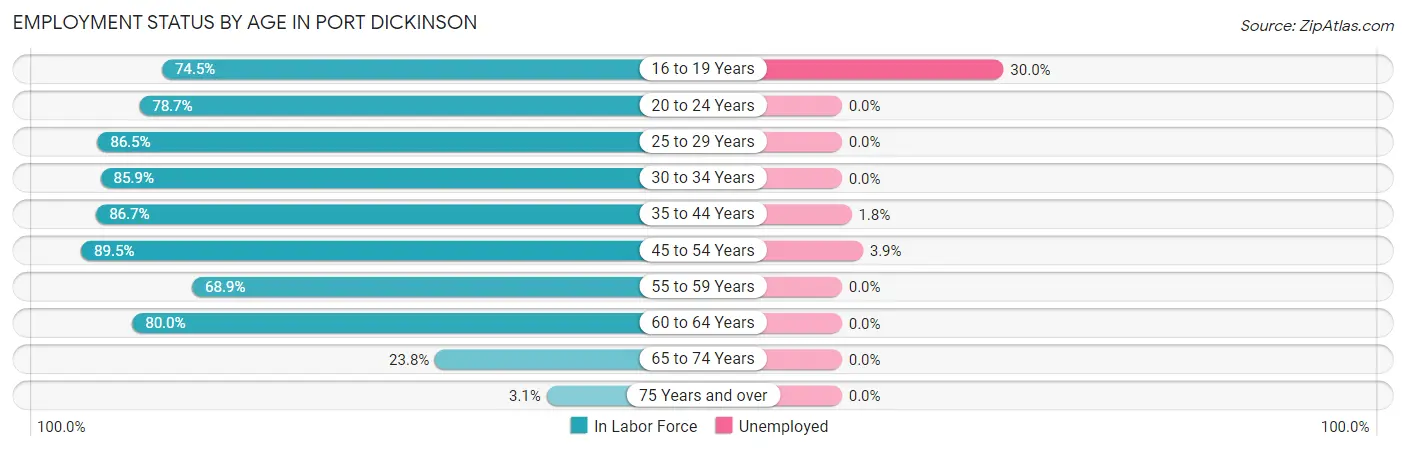
| Age Bracket | In Labor Force | Unemployed |
| 16 to 19 Years | 70 (74.5%) | 21 (30.0%) |
| 20 to 24 Years | 163 (78.7%) | 0 (0.0%) |
| 25 to 29 Years | 45 (86.5%) | 0 (0.0%) |
| 30 to 34 Years | 134 (85.9%) | 0 (0.0%) |
| 35 to 44 Years | 222 (86.7%) | 4 (1.8%) |
| 45 to 54 Years | 205 (89.5%) | 8 (3.9%) |
| 55 to 59 Years | 93 (68.9%) | 0 (0.0%) |
| 60 to 64 Years | 68 (80.0%) | 0 (0.0%) |
| 65 to 74 Years | 41 (23.8%) | 0 (0.0%) |
| 75 Years and over | 4 (3.1%) | 0 (0.0%) |
| Total | 1,045 (69.0%) | 33 (3.2%) |
Employment Status by Educational Attainment in Port Dickinson
According to labor force statistics for Port Dickinson, 84.0% of individuals (767) out of the total population between 25 and 64 years of age (913) are in the labor force, with 1.6% or 12 of them being unemployed. The group with the highest labor force participation rate are those with the educational attainment of bachelor's degree or higher, with 94.4% or 306 individuals in the labor force. Within the labor force, individuals with college / associate degree education have the highest percentage of unemployment, with 3.0% or 8 of them being unemployed.
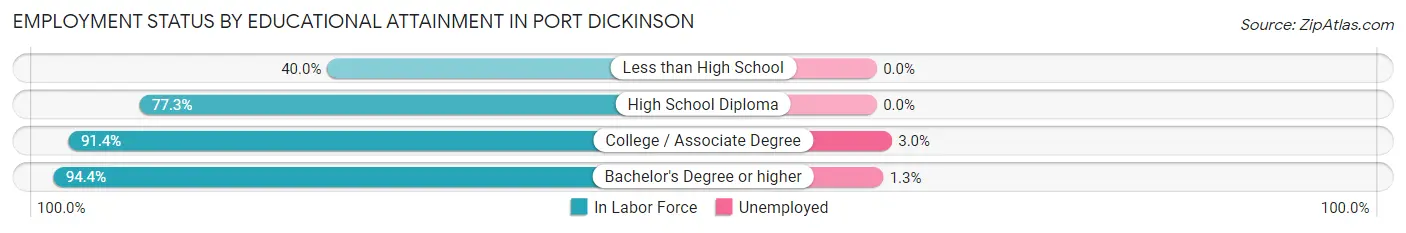
| Educational Attainment | In Labor Force | Unemployed |
| Less than High School | 38 (40.0%) | 0 (0.0%) |
| High School Diploma | 157 (77.3%) | 0 (0.0%) |
| College / Associate Degree | 266 (91.4%) | 9 (3.0%) |
| Bachelor's Degree or higher | 306 (94.4%) | 4 (1.3%) |
| Total | 767 (84.0%) | 15 (1.6%) |
Employment Occupations by Sex in Port Dickinson
Management, Business, Science and Arts Occupations
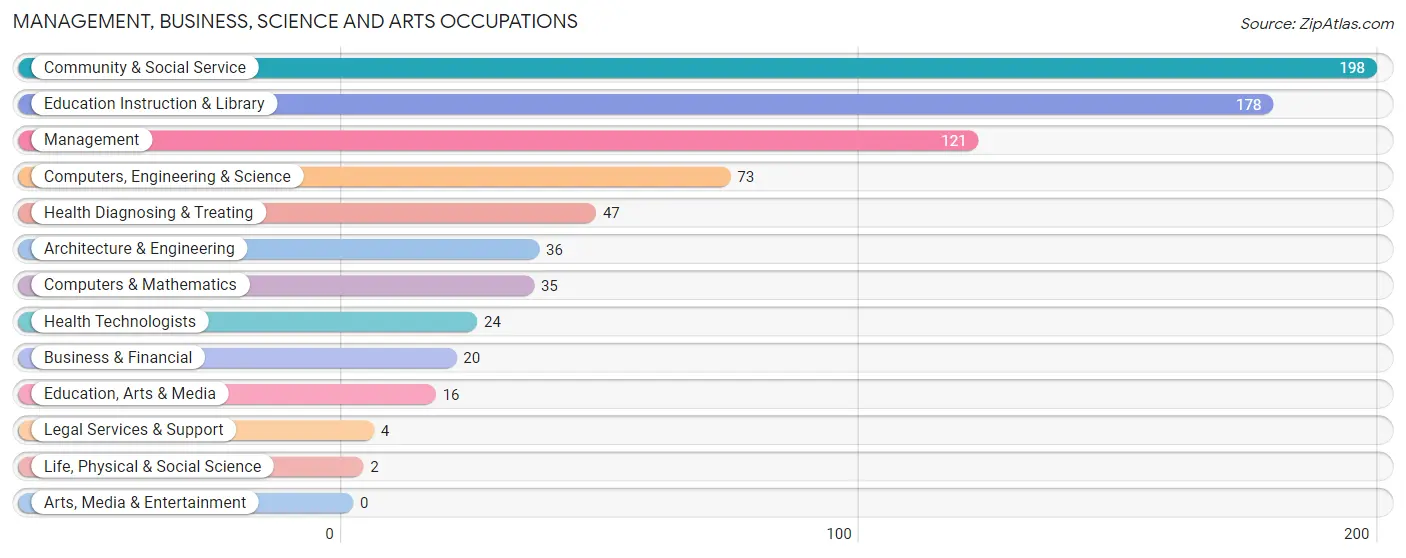
The most common Management, Business, Science and Arts occupations in Port Dickinson are Community & Social Service (198 | 19.6%), Education Instruction & Library (178 | 17.6%), Management (121 | 12.0%), Computers, Engineering & Science (73 | 7.2%), and Health Diagnosing & Treating (47 | 4.6%).
Management, Business, Science and Arts Occupations by Sex
Within the Management, Business, Science and Arts occupations in Port Dickinson, the most male-oriented occupations are Architecture & Engineering (94.4%), Management (76.0%), and Education, Arts & Media (75.0%), while the most female-oriented occupations are Business & Financial (100.0%), Life, Physical & Social Science (100.0%), and Legal Services & Support (100.0%).
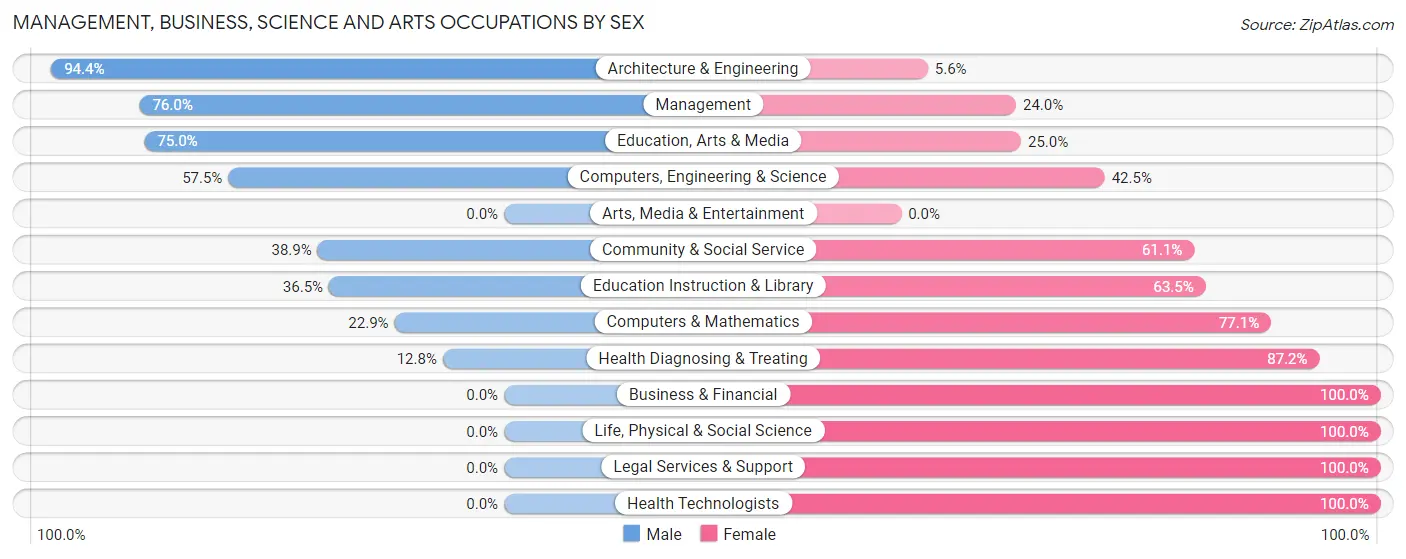
| Occupation | Male | Female |
| Management | 92 (76.0%) | 29 (24.0%) |
| Business & Financial | 0 (0.0%) | 20 (100.0%) |
| Computers, Engineering & Science | 42 (57.5%) | 31 (42.5%) |
| Computers & Mathematics | 8 (22.9%) | 27 (77.1%) |
| Architecture & Engineering | 34 (94.4%) | 2 (5.6%) |
| Life, Physical & Social Science | 0 (0.0%) | 2 (100.0%) |
| Community & Social Service | 77 (38.9%) | 121 (61.1%) |
| Education, Arts & Media | 12 (75.0%) | 4 (25.0%) |
| Legal Services & Support | 0 (0.0%) | 4 (100.0%) |
| Education Instruction & Library | 65 (36.5%) | 113 (63.5%) |
| Arts, Media & Entertainment | 0 (0.0%) | 0 (0.0%) |
| Health Diagnosing & Treating | 6 (12.8%) | 41 (87.2%) |
| Health Technologists | 0 (0.0%) | 24 (100.0%) |
| Total (Category) | 217 (47.3%) | 242 (52.7%) |
| Total (Overall) | 518 (51.2%) | 494 (48.8%) |
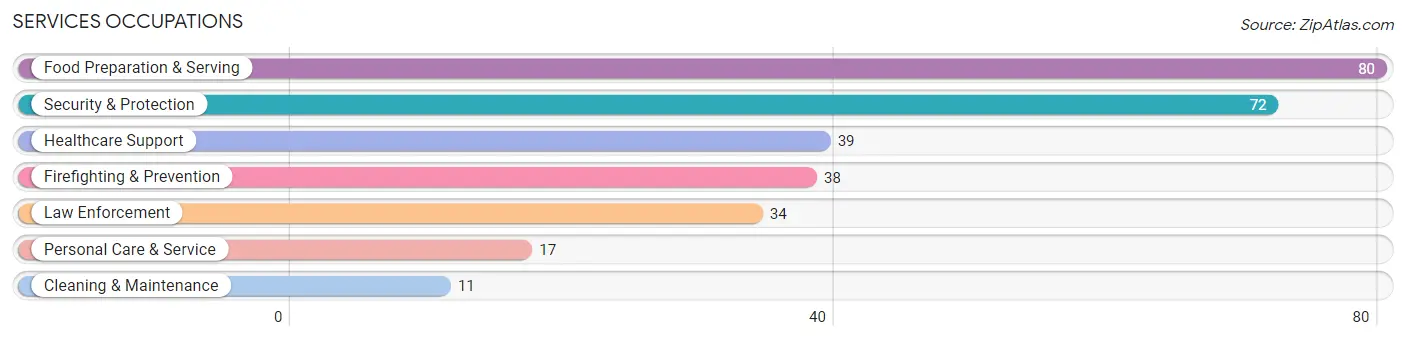
Services Occupations
The most common Services occupations in Port Dickinson are Food Preparation & Serving (80 | 7.9%), Security & Protection (72 | 7.1%), Healthcare Support (39 | 3.8%), Firefighting & Prevention (38 | 3.7%), and Law Enforcement (34 | 3.4%).
Services Occupations by Sex
Within the Services occupations in Port Dickinson, the most male-oriented occupations are Law Enforcement (100.0%), Security & Protection (87.5%), and Firefighting & Prevention (76.3%), while the most female-oriented occupations are Personal Care & Service (100.0%), Healthcare Support (94.9%), and Cleaning & Maintenance (63.6%).
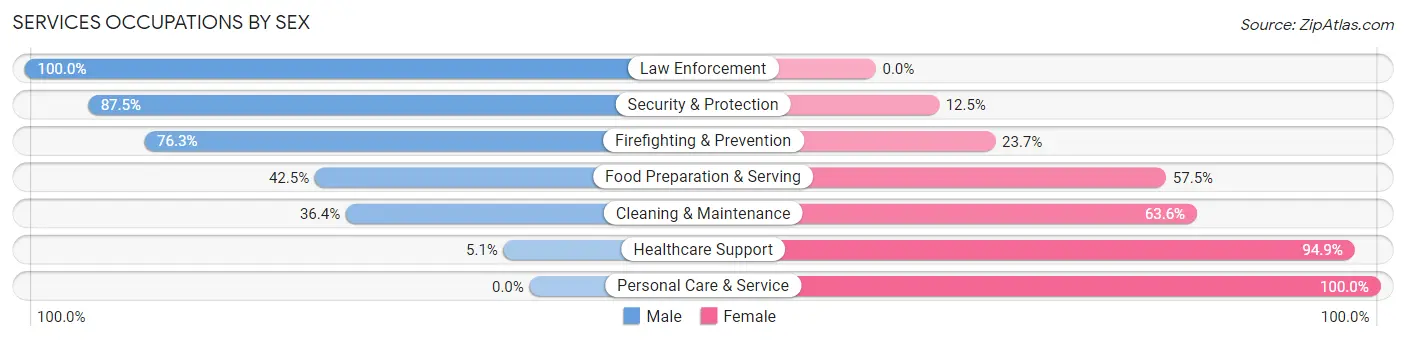
| Occupation | Male | Female |
| Healthcare Support | 2 (5.1%) | 37 (94.9%) |
| Security & Protection | 63 (87.5%) | 9 (12.5%) |
| Firefighting & Prevention | 29 (76.3%) | 9 (23.7%) |
| Law Enforcement | 34 (100.0%) | 0 (0.0%) |
| Food Preparation & Serving | 34 (42.5%) | 46 (57.5%) |
| Cleaning & Maintenance | 4 (36.4%) | 7 (63.6%) |
| Personal Care & Service | 0 (0.0%) | 17 (100.0%) |
| Total (Category) | 103 (47.0%) | 116 (53.0%) |
| Total (Overall) | 518 (51.2%) | 494 (48.8%) |
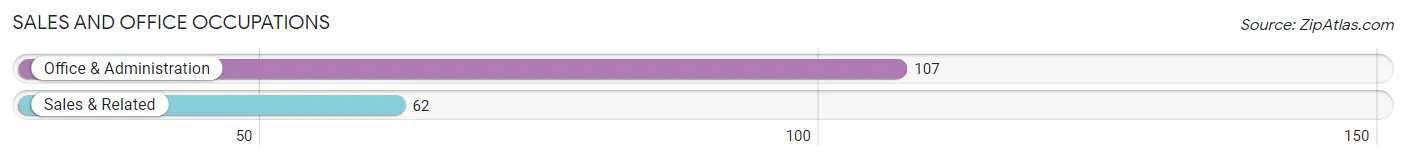
Sales and Office Occupations
The most common Sales and Office occupations in Port Dickinson are Office & Administration (107 | 10.6%), and Sales & Related (62 | 6.1%).
Sales and Office Occupations by Sex
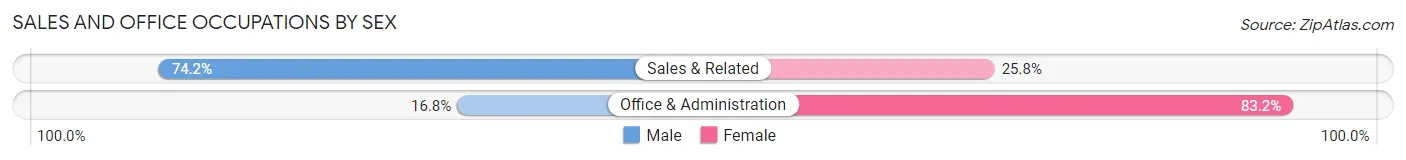
| Occupation | Male | Female |
| Sales & Related | 46 (74.2%) | 16 (25.8%) |
| Office & Administration | 18 (16.8%) | 89 (83.2%) |
| Total (Category) | 64 (37.9%) | 105 (62.1%) |
| Total (Overall) | 518 (51.2%) | 494 (48.8%) |
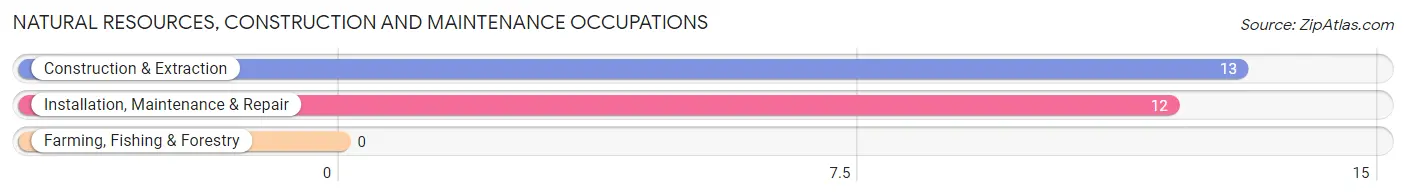
Natural Resources, Construction and Maintenance Occupations
The most common Natural Resources, Construction and Maintenance occupations in Port Dickinson are Construction & Extraction (13 | 1.3%), and Installation, Maintenance & Repair (12 | 1.2%).
Natural Resources, Construction and Maintenance Occupations by Sex
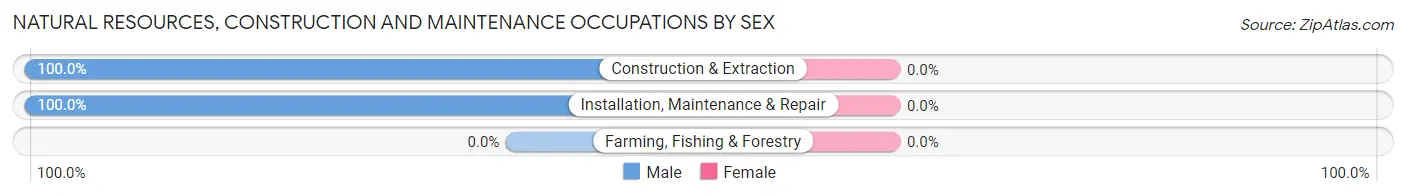
| Occupation | Male | Female |
| Farming, Fishing & Forestry | 0 (0.0%) | 0 (0.0%) |
| Construction & Extraction | 13 (100.0%) | 0 (0.0%) |
| Installation, Maintenance & Repair | 12 (100.0%) | 0 (0.0%) |
| Total (Category) | 25 (100.0%) | 0 (0.0%) |
| Total (Overall) | 518 (51.2%) | 494 (48.8%) |
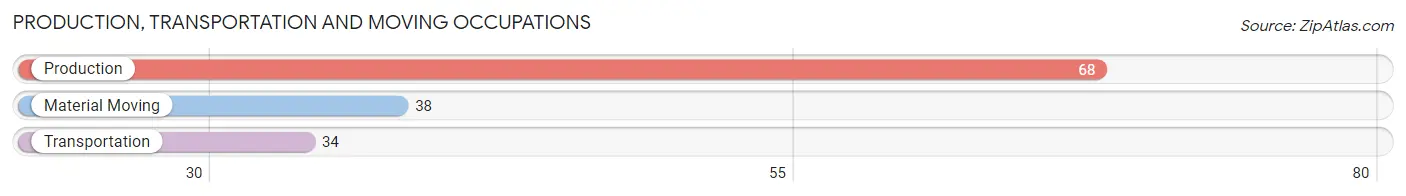
Production, Transportation and Moving Occupations
The most common Production, Transportation and Moving occupations in Port Dickinson are Production (68 | 6.7%), Material Moving (38 | 3.7%), and Transportation (34 | 3.4%).
Production, Transportation and Moving Occupations by Sex
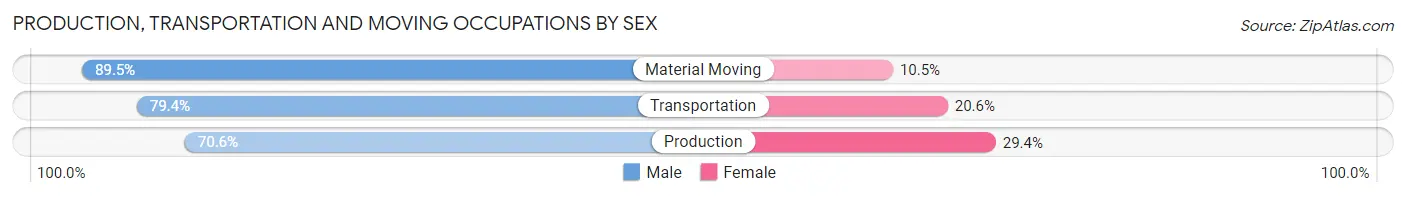
| Occupation | Male | Female |
| Production | 48 (70.6%) | 20 (29.4%) |
| Transportation | 27 (79.4%) | 7 (20.6%) |
| Material Moving | 34 (89.5%) | 4 (10.5%) |
| Total (Category) | 109 (77.9%) | 31 (22.1%) |
| Total (Overall) | 518 (51.2%) | 494 (48.8%) |
Employment Industries by Sex in Port Dickinson
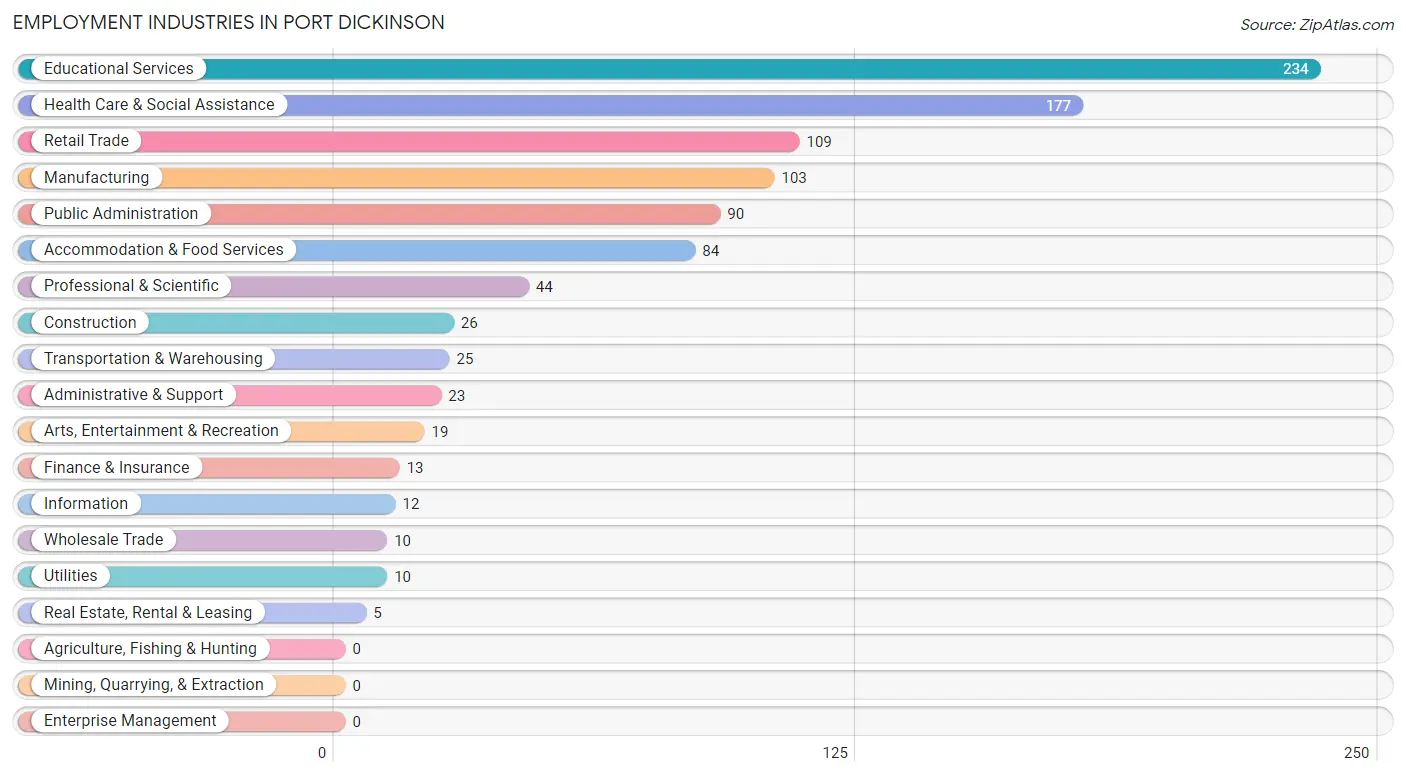
Employment Industries in Port Dickinson
The major employment industries in Port Dickinson include Educational Services (234 | 23.1%), Health Care & Social Assistance (177 | 17.5%), Retail Trade (109 | 10.8%), Manufacturing (103 | 10.2%), and Public Administration (90 | 8.9%).
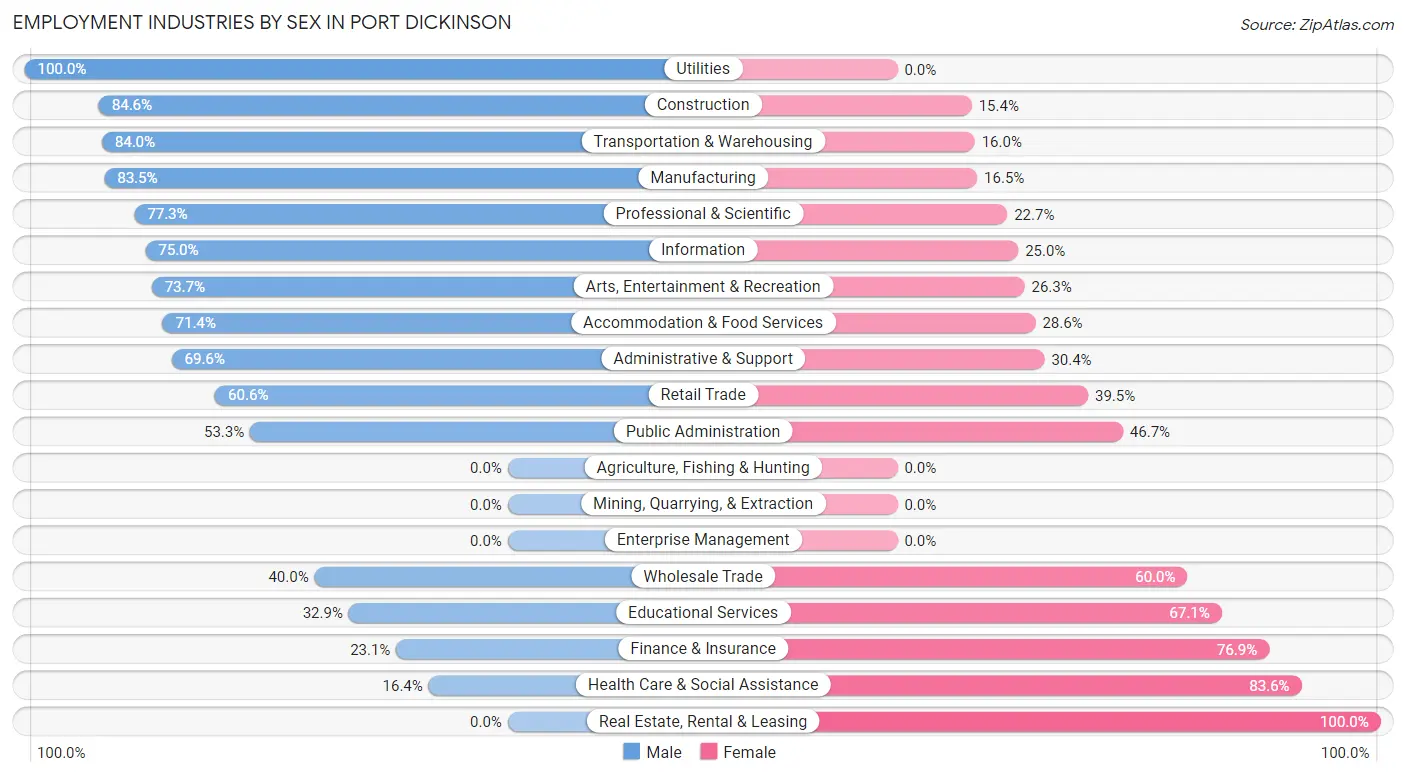
Employment Industries by Sex in Port Dickinson
The Port Dickinson industries that see more men than women are Utilities (100.0%), Construction (84.6%), and Transportation & Warehousing (84.0%), whereas the industries that tend to have a higher number of women are Real Estate, Rental & Leasing (100.0%), Health Care & Social Assistance (83.6%), and Finance & Insurance (76.9%).
| Industry | Male | Female |
| Agriculture, Fishing & Hunting | 0 (0.0%) | 0 (0.0%) |
| Mining, Quarrying, & Extraction | 0 (0.0%) | 0 (0.0%) |
| Construction | 22 (84.6%) | 4 (15.4%) |
| Manufacturing | 86 (83.5%) | 17 (16.5%) |
| Wholesale Trade | 4 (40.0%) | 6 (60.0%) |
| Retail Trade | 66 (60.6%) | 43 (39.5%) |
| Transportation & Warehousing | 21 (84.0%) | 4 (16.0%) |
| Utilities | 10 (100.0%) | 0 (0.0%) |
| Information | 9 (75.0%) | 3 (25.0%) |
| Finance & Insurance | 3 (23.1%) | 10 (76.9%) |
| Real Estate, Rental & Leasing | 0 (0.0%) | 5 (100.0%) |
| Professional & Scientific | 34 (77.3%) | 10 (22.7%) |
| Enterprise Management | 0 (0.0%) | 0 (0.0%) |
| Administrative & Support | 16 (69.6%) | 7 (30.4%) |
| Educational Services | 77 (32.9%) | 157 (67.1%) |
| Health Care & Social Assistance | 29 (16.4%) | 148 (83.6%) |
| Arts, Entertainment & Recreation | 14 (73.7%) | 5 (26.3%) |
| Accommodation & Food Services | 60 (71.4%) | 24 (28.6%) |
| Public Administration | 48 (53.3%) | 42 (46.7%) |
| Total | 518 (51.2%) | 494 (48.8%) |
Education in Port Dickinson
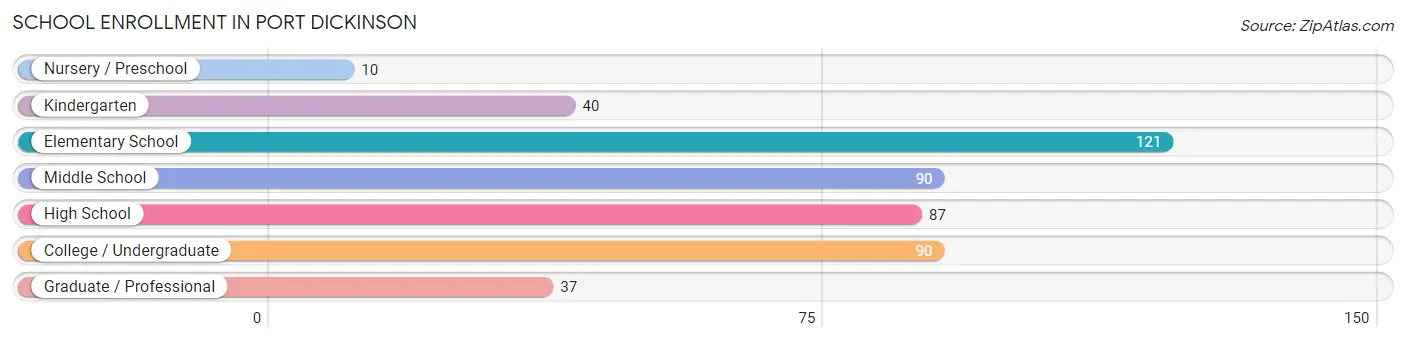
School Enrollment in Port Dickinson
The most common levels of schooling among the 475 students in Port Dickinson are elementary school (121 | 25.5%), middle school (90 | 19.0%), and college / undergraduate (90 | 19.0%).
| School Level | # Students | % Students |
| Nursery / Preschool | 10 | 2.1% |
| Kindergarten | 40 | 8.4% |
| Elementary School | 121 | 25.5% |
| Middle School | 90 | 19.0% |
| High School | 87 | 18.3% |
| College / Undergraduate | 90 | 19.0% |
| Graduate / Professional | 37 | 7.8% |
| Total | 475 | 100.0% |
School Enrollment by Age by Funding Source in Port Dickinson
Out of a total of 475 students who are enrolled in schools in Port Dickinson, 15 (3.2%) attend a private institution, while the remaining 460 (96.8%) are enrolled in public schools. The age group of 18 to 19 year olds has the highest likelihood of being enrolled in private schools, with 9 (20.4% in the age bracket) enrolled. Conversely, the age group of 3 to 4 year olds has the lowest likelihood of being enrolled in a private school, with 5 (100.0% in the age bracket) attending a public institution.
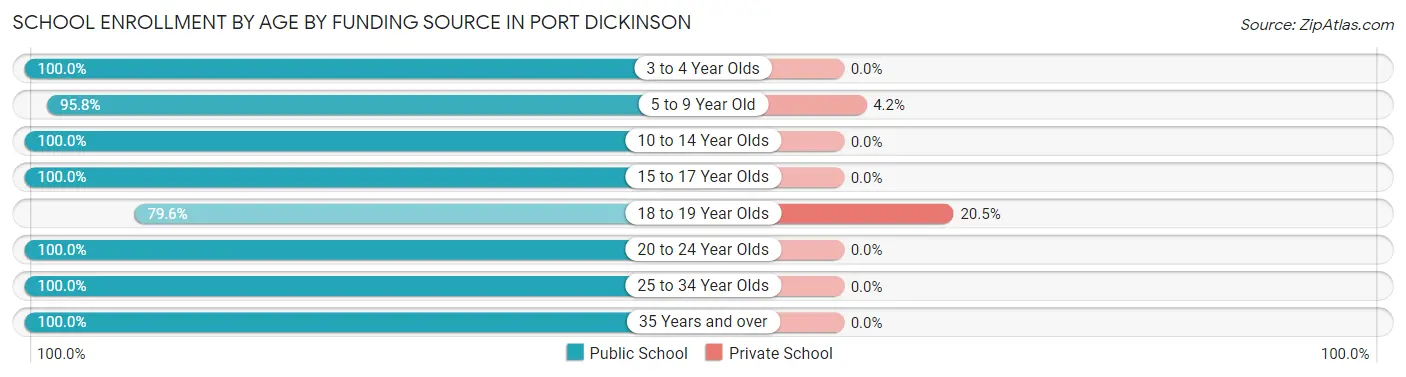
| Age Bracket | Public School | Private School |
| 3 to 4 Year Olds | 5 (100.0%) | 0 (0.0%) |
| 5 to 9 Year Old | 137 (95.8%) | 6 (4.2%) |
| 10 to 14 Year Olds | 149 (100.0%) | 0 (0.0%) |
| 15 to 17 Year Olds | 51 (100.0%) | 0 (0.0%) |
| 18 to 19 Year Olds | 35 (79.5%) | 9 (20.4%) |
| 20 to 24 Year Olds | 67 (100.0%) | 0 (0.0%) |
| 25 to 34 Year Olds | 6 (100.0%) | 0 (0.0%) |
| 35 Years and over | 10 (100.0%) | 0 (0.0%) |
| Total | 460 (96.8%) | 15 (3.2%) |
Educational Attainment by Field of Study in Port Dickinson
Education (78 | 19.8%), science & technology (59 | 14.9%), psychology (49 | 12.4%), business (43 | 10.9%), and literature & languages (38 | 9.6%) are the most common fields of study among 395 individuals in Port Dickinson who have obtained a bachelor's degree or higher.
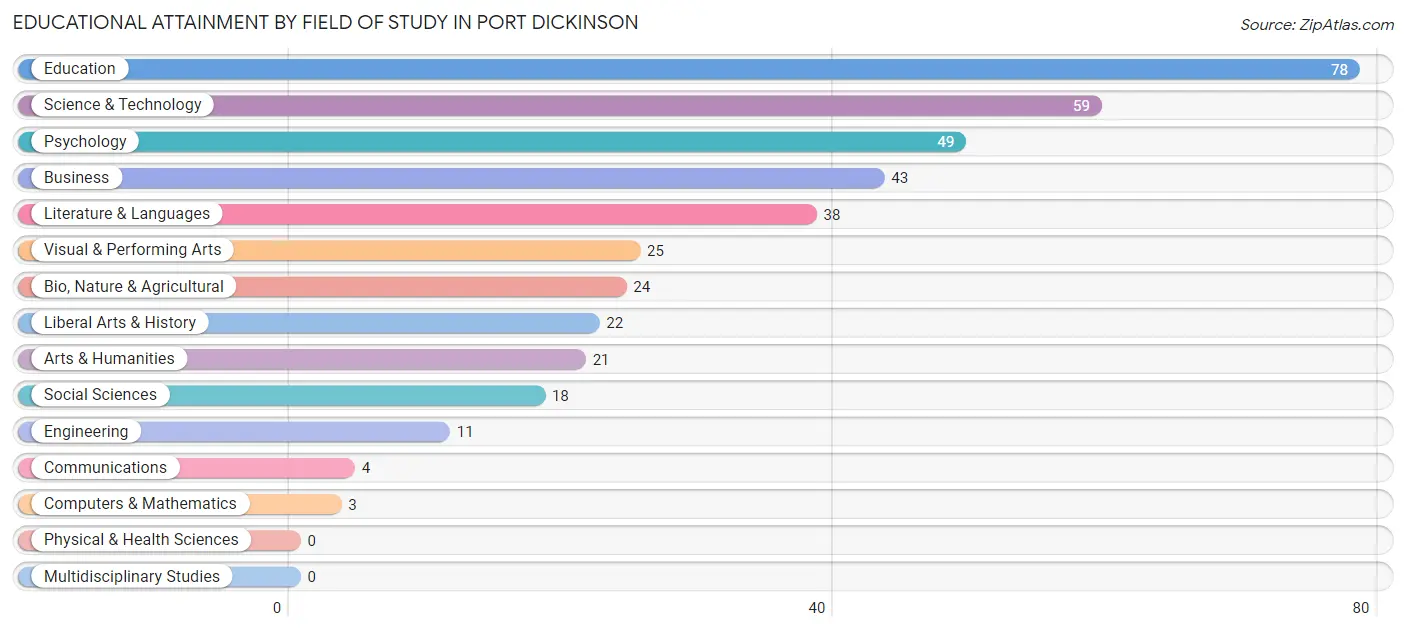
| Field of Study | # Graduates | % Graduates |
| Computers & Mathematics | 3 | 0.8% |
| Bio, Nature & Agricultural | 24 | 6.1% |
| Physical & Health Sciences | 0 | 0.0% |
| Psychology | 49 | 12.4% |
| Social Sciences | 18 | 4.6% |
| Engineering | 11 | 2.8% |
| Multidisciplinary Studies | 0 | 0.0% |
| Science & Technology | 59 | 14.9% |
| Business | 43 | 10.9% |
| Education | 78 | 19.8% |
| Literature & Languages | 38 | 9.6% |
| Liberal Arts & History | 22 | 5.6% |
| Visual & Performing Arts | 25 | 6.3% |
| Communications | 4 | 1.0% |
| Arts & Humanities | 21 | 5.3% |
| Total | 395 | 100.0% |
Transportation & Commute in Port Dickinson
Vehicle Availability by Sex in Port Dickinson
The most prevalent vehicle ownership categories in Port Dickinson are males with 2 vehicles (300, accounting for 57.9%) and females with 2 vehicles (256, making up 61.4%).
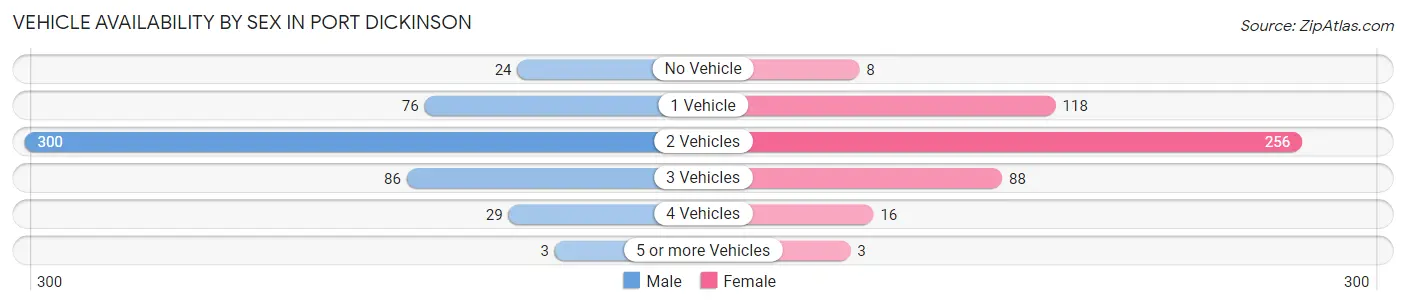
| Vehicles Available | Male | Female |
| No Vehicle | 24 (4.6%) | 8 (1.6%) |
| 1 Vehicle | 76 (14.7%) | 118 (24.1%) |
| 2 Vehicles | 300 (57.9%) | 256 (52.3%) |
| 3 Vehicles | 86 (16.6%) | 88 (18.0%) |
| 4 Vehicles | 29 (5.6%) | 16 (3.3%) |
| 5 or more Vehicles | 3 (0.6%) | 3 (0.6%) |
| Total | 518 (100.0%) | 489 (100.0%) |
Commute Time in Port Dickinson
The most frequently occuring commute durations in Port Dickinson are 10 to 14 minutes (244 commuters, 24.9%), 15 to 19 minutes (202 commuters, 20.6%), and 5 to 9 minutes (169 commuters, 17.3%).
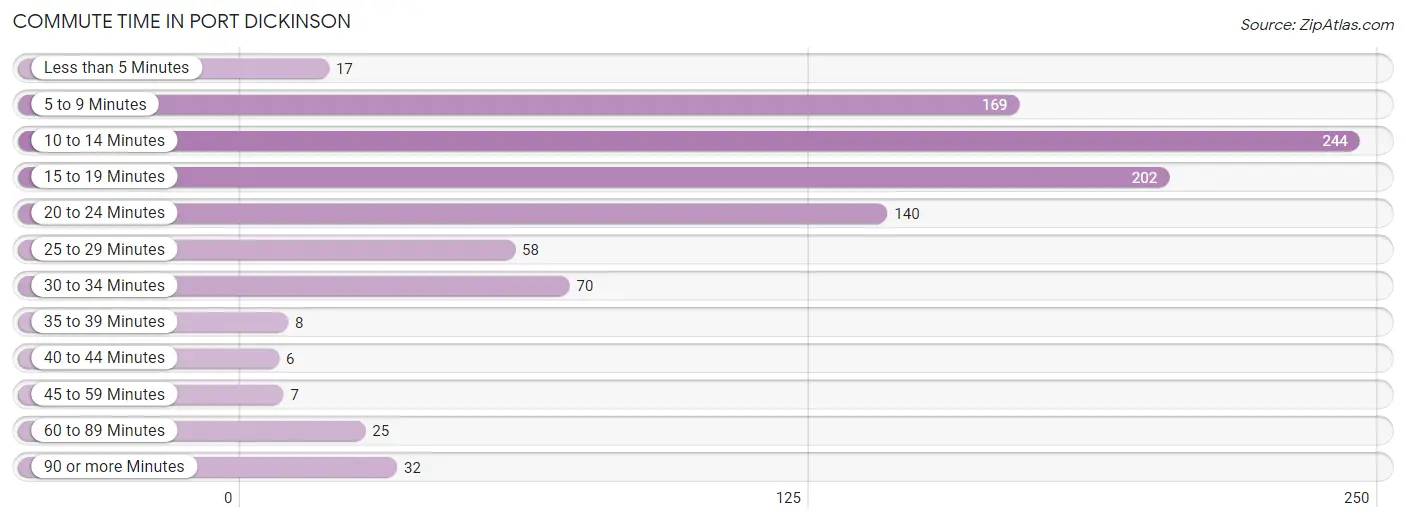
| Commute Time | # Commuters | % Commuters |
| Less than 5 Minutes | 17 | 1.7% |
| 5 to 9 Minutes | 169 | 17.3% |
| 10 to 14 Minutes | 244 | 24.9% |
| 15 to 19 Minutes | 202 | 20.6% |
| 20 to 24 Minutes | 140 | 14.3% |
| 25 to 29 Minutes | 58 | 5.9% |
| 30 to 34 Minutes | 70 | 7.2% |
| 35 to 39 Minutes | 8 | 0.8% |
| 40 to 44 Minutes | 6 | 0.6% |
| 45 to 59 Minutes | 7 | 0.7% |
| 60 to 89 Minutes | 25 | 2.6% |
| 90 or more Minutes | 32 | 3.3% |
Commute Time by Sex in Port Dickinson
The most common commute times in Port Dickinson are 15 to 19 minutes (111 commuters, 21.6%) for males and 10 to 14 minutes (137 commuters, 29.5%) for females.
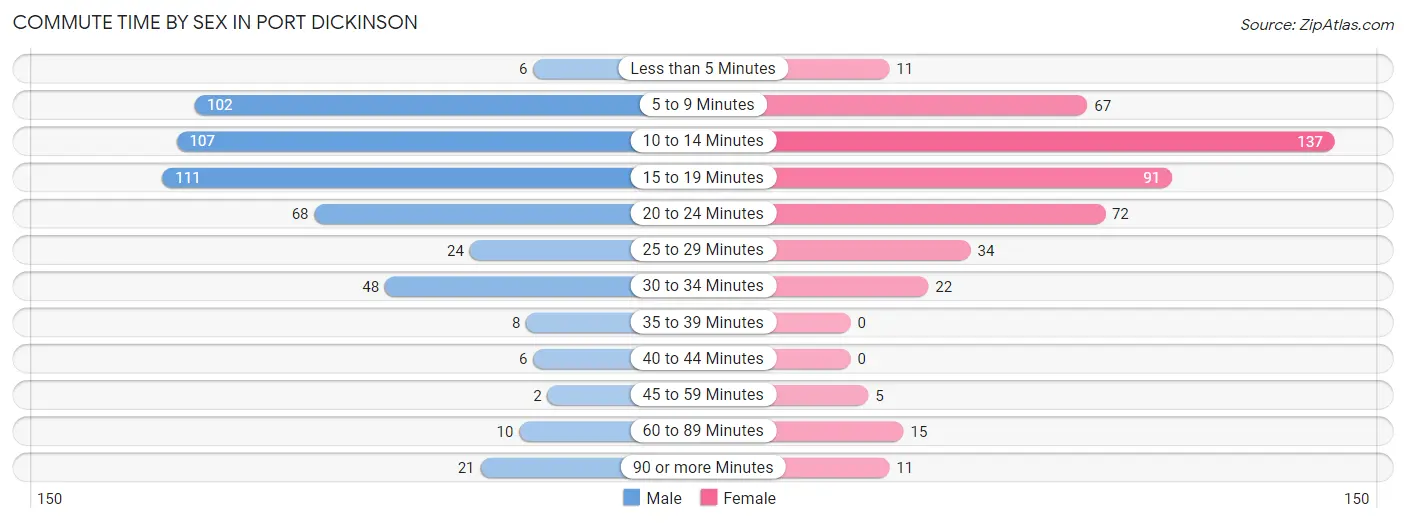
| Commute Time | Male | Female |
| Less than 5 Minutes | 6 (1.2%) | 11 (2.4%) |
| 5 to 9 Minutes | 102 (19.9%) | 67 (14.4%) |
| 10 to 14 Minutes | 107 (20.9%) | 137 (29.5%) |
| 15 to 19 Minutes | 111 (21.6%) | 91 (19.6%) |
| 20 to 24 Minutes | 68 (13.3%) | 72 (15.5%) |
| 25 to 29 Minutes | 24 (4.7%) | 34 (7.3%) |
| 30 to 34 Minutes | 48 (9.4%) | 22 (4.7%) |
| 35 to 39 Minutes | 8 (1.6%) | 0 (0.0%) |
| 40 to 44 Minutes | 6 (1.2%) | 0 (0.0%) |
| 45 to 59 Minutes | 2 (0.4%) | 5 (1.1%) |
| 60 to 89 Minutes | 10 (1.9%) | 15 (3.2%) |
| 90 or more Minutes | 21 (4.1%) | 11 (2.4%) |
Time of Departure to Work by Sex in Port Dickinson
The most frequent times of departure to work in Port Dickinson are 7:00 AM to 7:29 AM (83, 16.2%) for males and 7:30 AM to 7:59 AM (87, 18.7%) for females.
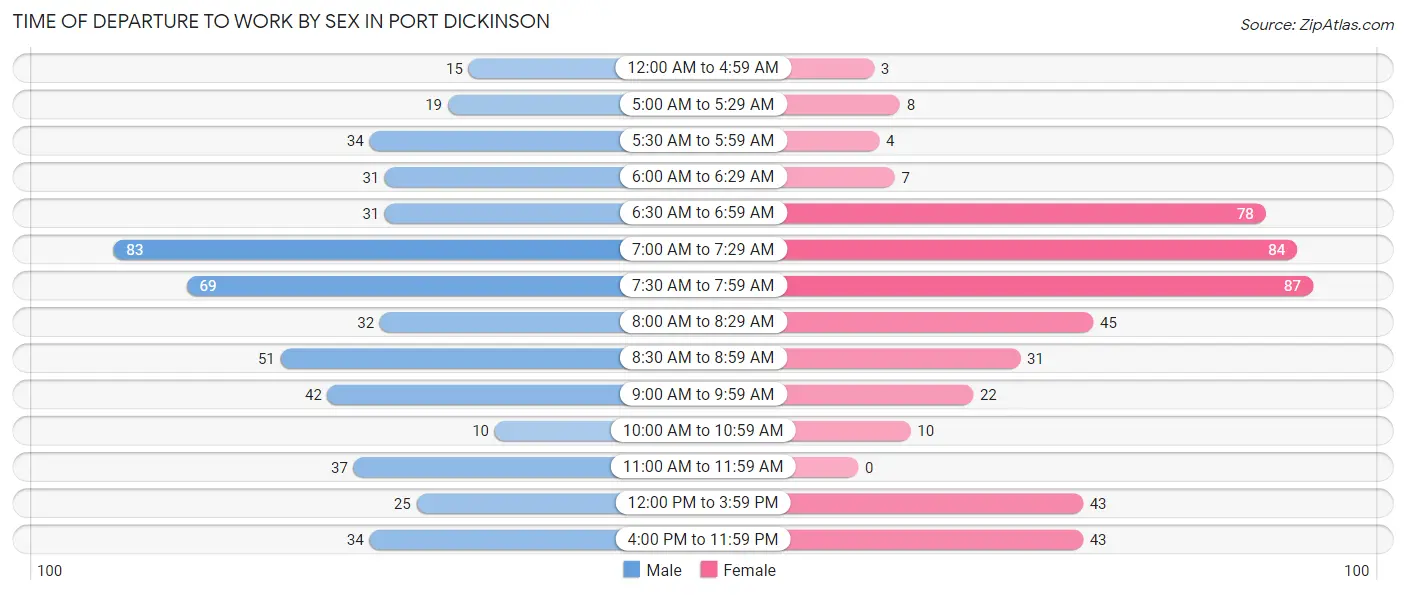
| Time of Departure | Male | Female |
| 12:00 AM to 4:59 AM | 15 (2.9%) | 3 (0.6%) |
| 5:00 AM to 5:29 AM | 19 (3.7%) | 8 (1.7%) |
| 5:30 AM to 5:59 AM | 34 (6.6%) | 4 (0.9%) |
| 6:00 AM to 6:29 AM | 31 (6.0%) | 7 (1.5%) |
| 6:30 AM to 6:59 AM | 31 (6.0%) | 78 (16.8%) |
| 7:00 AM to 7:29 AM | 83 (16.2%) | 84 (18.1%) |
| 7:30 AM to 7:59 AM | 69 (13.5%) | 87 (18.7%) |
| 8:00 AM to 8:29 AM | 32 (6.2%) | 45 (9.7%) |
| 8:30 AM to 8:59 AM | 51 (9.9%) | 31 (6.7%) |
| 9:00 AM to 9:59 AM | 42 (8.2%) | 22 (4.7%) |
| 10:00 AM to 10:59 AM | 10 (1.9%) | 10 (2.1%) |
| 11:00 AM to 11:59 AM | 37 (7.2%) | 0 (0.0%) |
| 12:00 PM to 3:59 PM | 25 (4.9%) | 43 (9.2%) |
| 4:00 PM to 11:59 PM | 34 (6.6%) | 43 (9.2%) |
| Total | 513 (100.0%) | 465 (100.0%) |
Housing Occupancy in Port Dickinson
Occupancy by Ownership in Port Dickinson
Of the total 794 dwellings in Port Dickinson, owner-occupied units account for 485 (61.1%), while renter-occupied units make up 309 (38.9%).
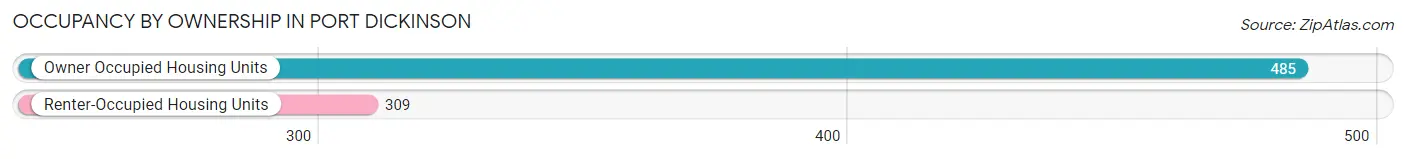
| Occupancy | # Housing Units | % Housing Units |
| Owner Occupied Housing Units | 485 | 61.1% |
| Renter-Occupied Housing Units | 309 | 38.9% |
| Total Occupied Housing Units | 794 | 100.0% |
Occupancy by Household Size in Port Dickinson
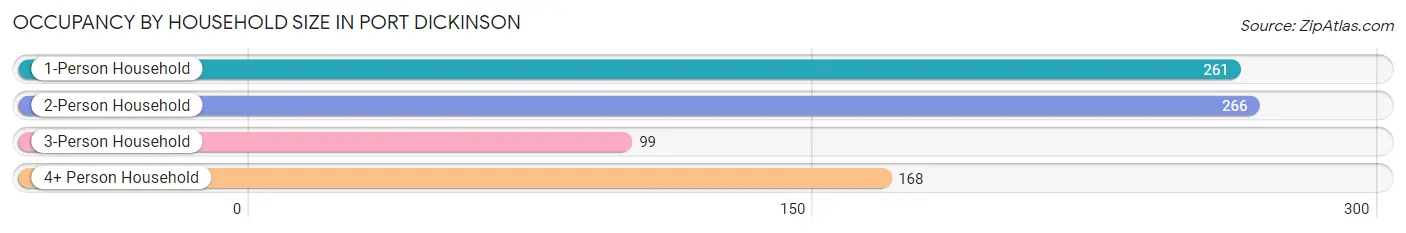
| Household Size | # Housing Units | % Housing Units |
| 1-Person Household | 261 | 32.9% |
| 2-Person Household | 266 | 33.5% |
| 3-Person Household | 99 | 12.5% |
| 4+ Person Household | 168 | 21.2% |
| Total Housing Units | 794 | 100.0% |
Occupancy by Ownership by Household Size in Port Dickinson
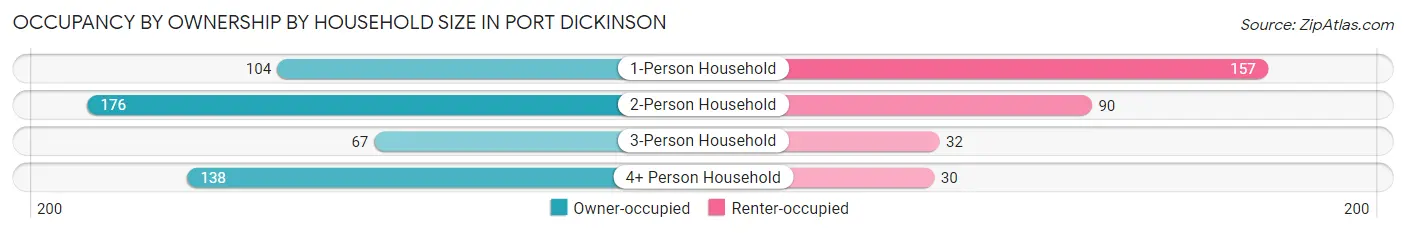
| Household Size | Owner-occupied | Renter-occupied |
| 1-Person Household | 104 (39.9%) | 157 (60.2%) |
| 2-Person Household | 176 (66.2%) | 90 (33.8%) |
| 3-Person Household | 67 (67.7%) | 32 (32.3%) |
| 4+ Person Household | 138 (82.1%) | 30 (17.9%) |
| Total Housing Units | 485 (61.1%) | 309 (38.9%) |
Occupancy by Educational Attainment in Port Dickinson
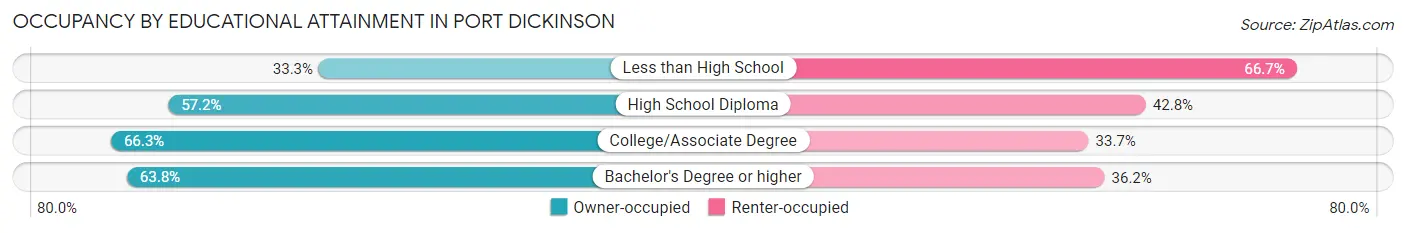
| Household Size | Owner-occupied | Renter-occupied |
| Less than High School | 17 (33.3%) | 34 (66.7%) |
| High School Diploma | 111 (57.2%) | 83 (42.8%) |
| College/Associate Degree | 181 (66.3%) | 92 (33.7%) |
| Bachelor's Degree or higher | 176 (63.8%) | 100 (36.2%) |
Occupancy by Age of Householder in Port Dickinson
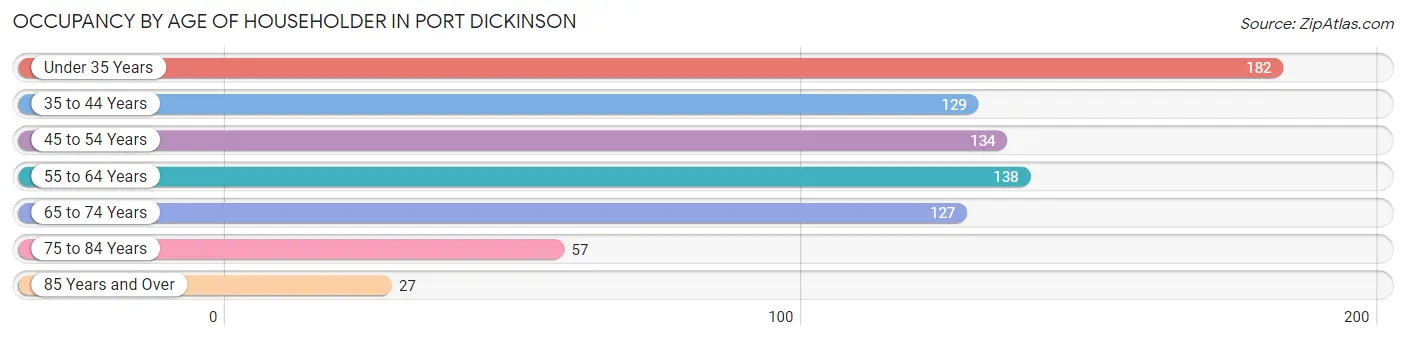
| Age Bracket | # Households | % Households |
| Under 35 Years | 182 | 22.9% |
| 35 to 44 Years | 129 | 16.3% |
| 45 to 54 Years | 134 | 16.9% |
| 55 to 64 Years | 138 | 17.4% |
| 65 to 74 Years | 127 | 16.0% |
| 75 to 84 Years | 57 | 7.2% |
| 85 Years and Over | 27 | 3.4% |
| Total | 794 | 100.0% |
Housing Finances in Port Dickinson
Median Income by Occupancy in Port Dickinson
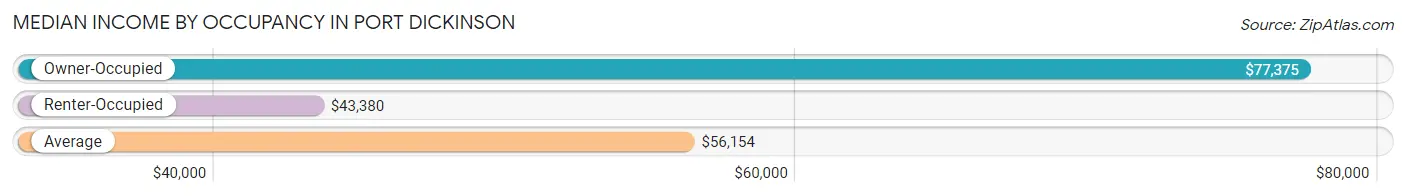
| Occupancy Type | # Households | Median Income |
| Owner-Occupied | 485 (61.1%) | $77,375 |
| Renter-Occupied | 309 (38.9%) | $43,380 |
| Average | 794 (100.0%) | $56,154 |
Occupancy by Householder Income Bracket in Port Dickinson
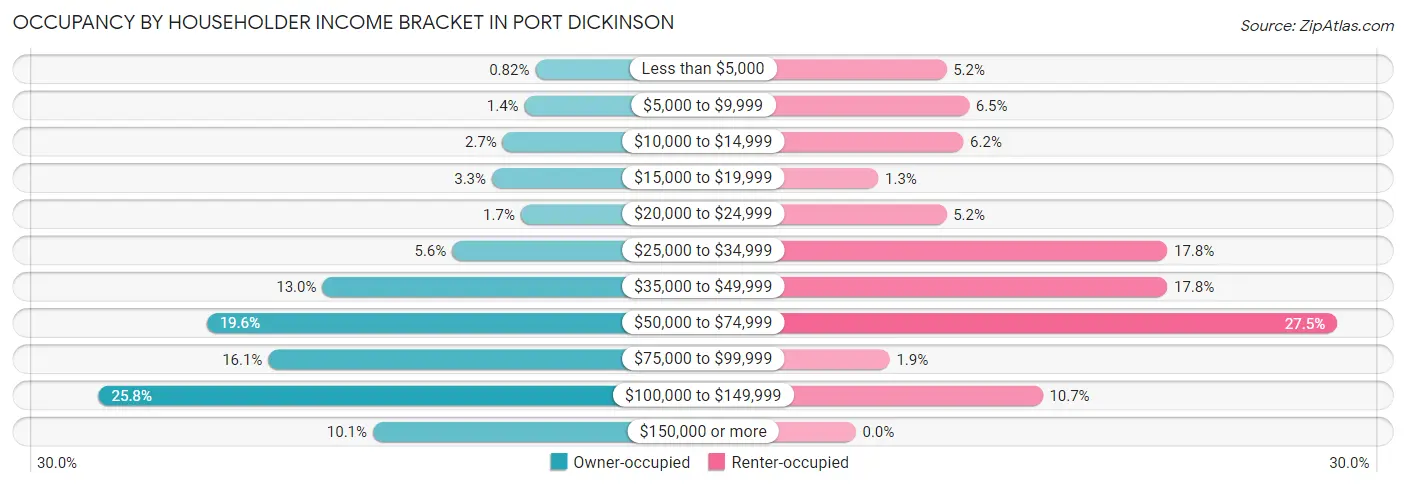
| Income Bracket | Owner-occupied | Renter-occupied |
| Less than $5,000 | 4 (0.8%) | 16 (5.2%) |
| $5,000 to $9,999 | 7 (1.4%) | 20 (6.5%) |
| $10,000 to $14,999 | 13 (2.7%) | 19 (6.1%) |
| $15,000 to $19,999 | 16 (3.3%) | 4 (1.3%) |
| $20,000 to $24,999 | 8 (1.7%) | 16 (5.2%) |
| $25,000 to $34,999 | 27 (5.6%) | 55 (17.8%) |
| $35,000 to $49,999 | 63 (13.0%) | 55 (17.8%) |
| $50,000 to $74,999 | 95 (19.6%) | 85 (27.5%) |
| $75,000 to $99,999 | 78 (16.1%) | 6 (1.9%) |
| $100,000 to $149,999 | 125 (25.8%) | 33 (10.7%) |
| $150,000 or more | 49 (10.1%) | 0 (0.0%) |
| Total | 485 (100.0%) | 309 (100.0%) |
Monthly Housing Cost Tiers in Port Dickinson
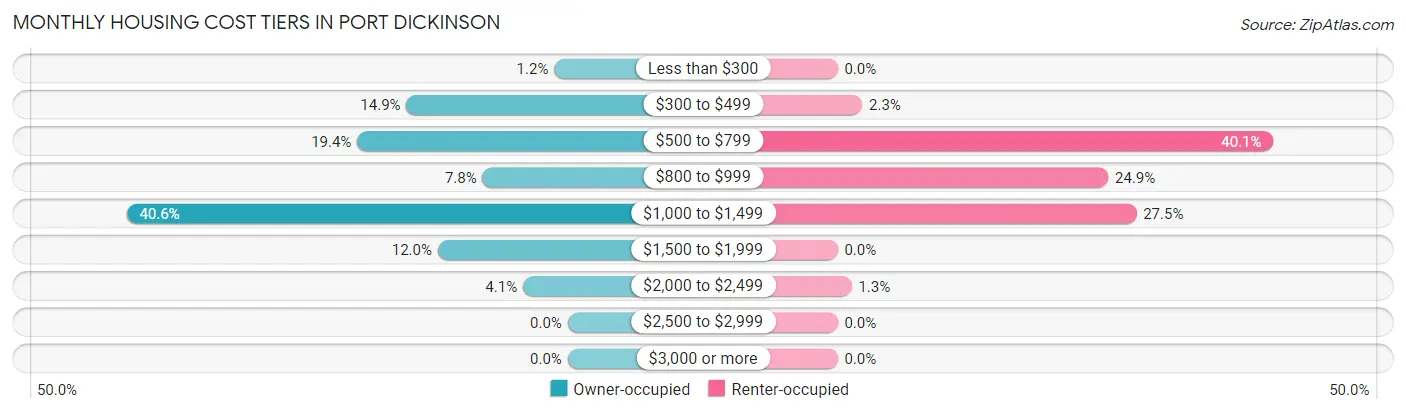
| Monthly Cost | Owner-occupied | Renter-occupied |
| Less than $300 | 6 (1.2%) | 0 (0.0%) |
| $300 to $499 | 72 (14.8%) | 7 (2.3%) |
| $500 to $799 | 94 (19.4%) | 124 (40.1%) |
| $800 to $999 | 38 (7.8%) | 77 (24.9%) |
| $1,000 to $1,499 | 197 (40.6%) | 85 (27.5%) |
| $1,500 to $1,999 | 58 (12.0%) | 0 (0.0%) |
| $2,000 to $2,499 | 20 (4.1%) | 4 (1.3%) |
| $2,500 to $2,999 | 0 (0.0%) | 0 (0.0%) |
| $3,000 or more | 0 (0.0%) | 0 (0.0%) |
| Total | 485 (100.0%) | 309 (100.0%) |
Physical Housing Characteristics in Port Dickinson
Housing Structures in Port Dickinson
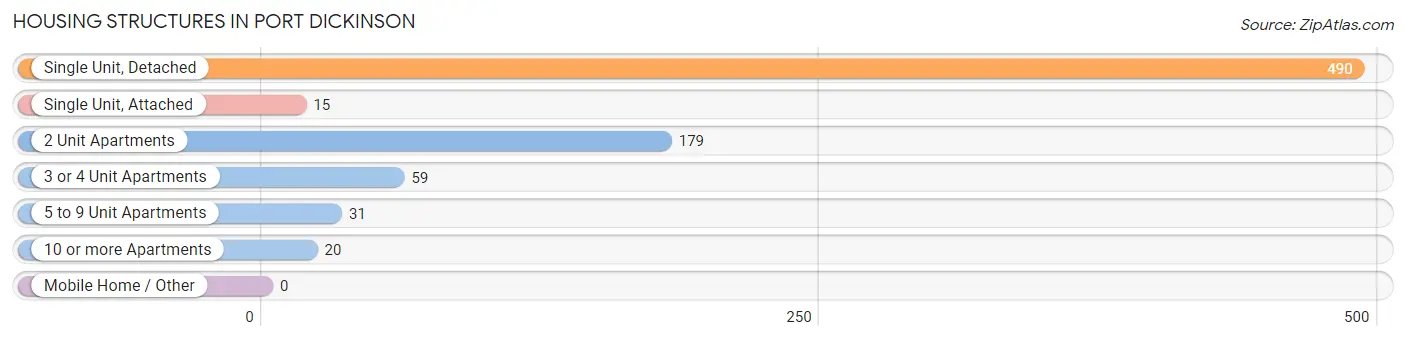
| Structure Type | # Housing Units | % Housing Units |
| Single Unit, Detached | 490 | 61.7% |
| Single Unit, Attached | 15 | 1.9% |
| 2 Unit Apartments | 179 | 22.5% |
| 3 or 4 Unit Apartments | 59 | 7.4% |
| 5 to 9 Unit Apartments | 31 | 3.9% |
| 10 or more Apartments | 20 | 2.5% |
| Mobile Home / Other | 0 | 0.0% |
| Total | 794 | 100.0% |
Housing Structures by Occupancy in Port Dickinson
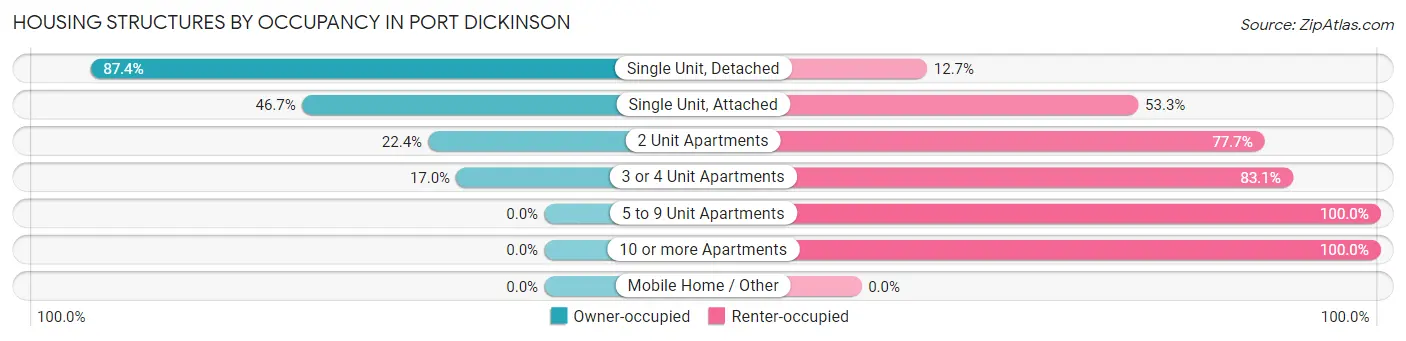
| Structure Type | Owner-occupied | Renter-occupied |
| Single Unit, Detached | 428 (87.4%) | 62 (12.7%) |
| Single Unit, Attached | 7 (46.7%) | 8 (53.3%) |
| 2 Unit Apartments | 40 (22.4%) | 139 (77.6%) |
| 3 or 4 Unit Apartments | 10 (17.0%) | 49 (83.1%) |
| 5 to 9 Unit Apartments | 0 (0.0%) | 31 (100.0%) |
| 10 or more Apartments | 0 (0.0%) | 20 (100.0%) |
| Mobile Home / Other | 0 (0.0%) | 0 (0.0%) |
| Total | 485 (61.1%) | 309 (38.9%) |
Housing Structures by Number of Rooms in Port Dickinson
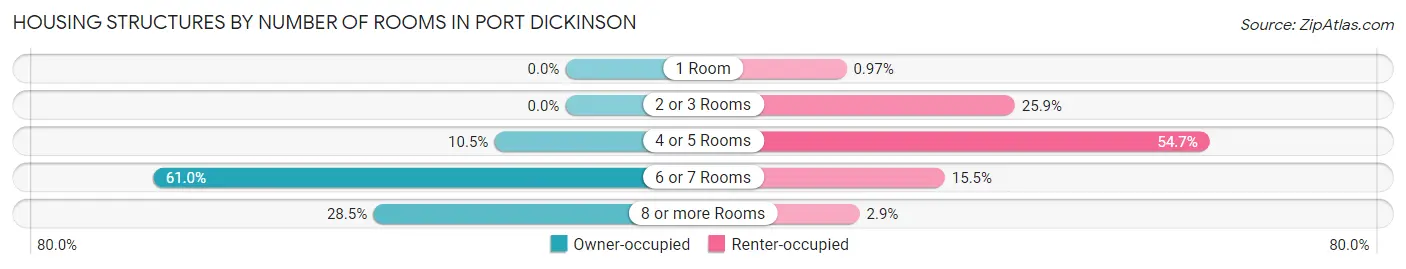
| Number of Rooms | Owner-occupied | Renter-occupied |
| 1 Room | 0 (0.0%) | 3 (1.0%) |
| 2 or 3 Rooms | 0 (0.0%) | 80 (25.9%) |
| 4 or 5 Rooms | 51 (10.5%) | 169 (54.7%) |
| 6 or 7 Rooms | 296 (61.0%) | 48 (15.5%) |
| 8 or more Rooms | 138 (28.4%) | 9 (2.9%) |
| Total | 485 (100.0%) | 309 (100.0%) |
Housing Structure by Heating Type in Port Dickinson
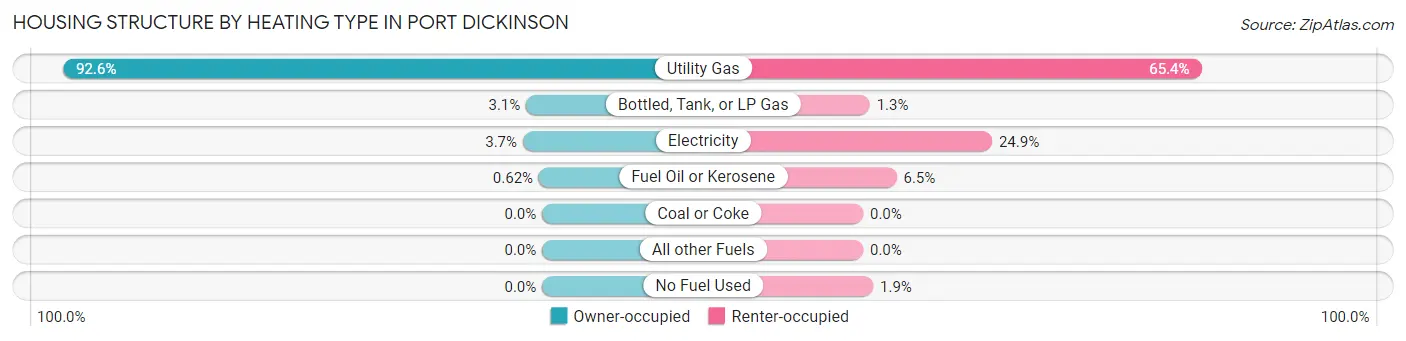
| Heating Type | Owner-occupied | Renter-occupied |
| Utility Gas | 449 (92.6%) | 202 (65.4%) |
| Bottled, Tank, or LP Gas | 15 (3.1%) | 4 (1.3%) |
| Electricity | 18 (3.7%) | 77 (24.9%) |
| Fuel Oil or Kerosene | 3 (0.6%) | 20 (6.5%) |
| Coal or Coke | 0 (0.0%) | 0 (0.0%) |
| All other Fuels | 0 (0.0%) | 0 (0.0%) |
| No Fuel Used | 0 (0.0%) | 6 (1.9%) |
| Total | 485 (100.0%) | 309 (100.0%) |
Household Vehicle Usage in Port Dickinson
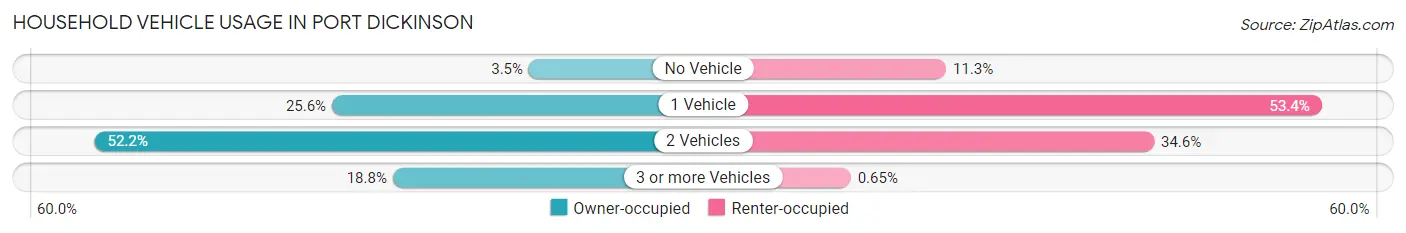
| Vehicles per Household | Owner-occupied | Renter-occupied |
| No Vehicle | 17 (3.5%) | 35 (11.3%) |
| 1 Vehicle | 124 (25.6%) | 165 (53.4%) |
| 2 Vehicles | 253 (52.2%) | 107 (34.6%) |
| 3 or more Vehicles | 91 (18.8%) | 2 (0.6%) |
| Total | 485 (100.0%) | 309 (100.0%) |
Real Estate & Mortgages in Port Dickinson
Real Estate and Mortgage Overview in Port Dickinson
| Characteristic | Without Mortgage | With Mortgage |
| Housing Units | 187 | 298 |
| Median Property Value | $123,000 | $136,500 |
| Median Household Income | $51,518 | $35 |
| Monthly Housing Costs | $544 | $0 |
| Real Estate Taxes | $2,741 | $0 |
Property Value by Mortgage Status in Port Dickinson
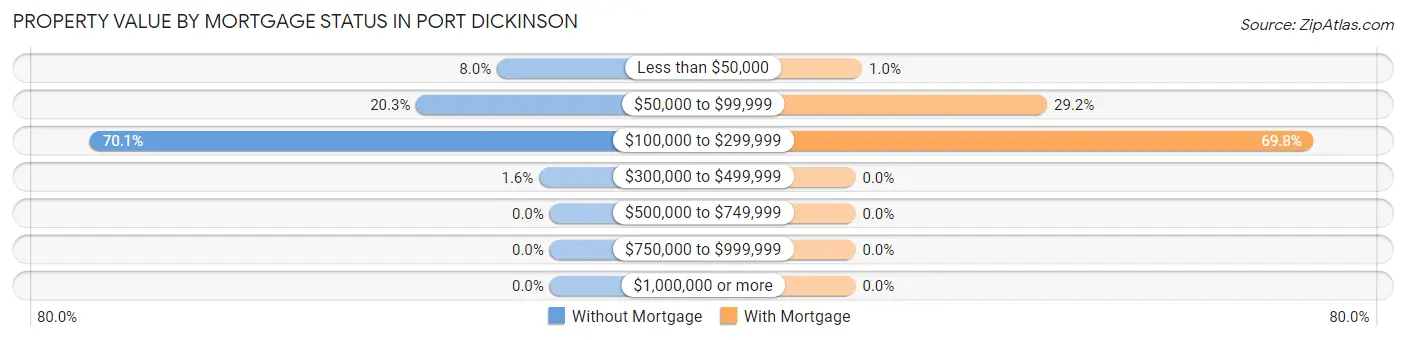
| Property Value | Without Mortgage | With Mortgage |
| Less than $50,000 | 15 (8.0%) | 3 (1.0%) |
| $50,000 to $99,999 | 38 (20.3%) | 87 (29.2%) |
| $100,000 to $299,999 | 131 (70.1%) | 208 (69.8%) |
| $300,000 to $499,999 | 3 (1.6%) | 0 (0.0%) |
| $500,000 to $749,999 | 0 (0.0%) | 0 (0.0%) |
| $750,000 to $999,999 | 0 (0.0%) | 0 (0.0%) |
| $1,000,000 or more | 0 (0.0%) | 0 (0.0%) |
| Total | 187 (100.0%) | 298 (100.0%) |
Household Income by Mortgage Status in Port Dickinson
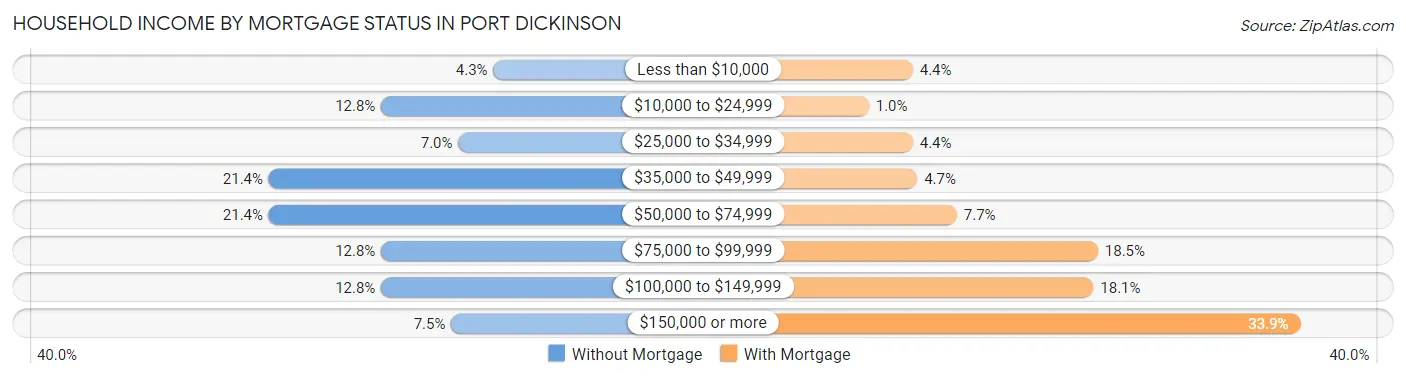
| Household Income | Without Mortgage | With Mortgage |
| Less than $10,000 | 8 (4.3%) | 13 (4.4%) |
| $10,000 to $24,999 | 24 (12.8%) | 3 (1.0%) |
| $25,000 to $34,999 | 13 (7.0%) | 13 (4.4%) |
| $35,000 to $49,999 | 40 (21.4%) | 14 (4.7%) |
| $50,000 to $74,999 | 40 (21.4%) | 23 (7.7%) |
| $75,000 to $99,999 | 24 (12.8%) | 55 (18.5%) |
| $100,000 to $149,999 | 24 (12.8%) | 54 (18.1%) |
| $150,000 or more | 14 (7.5%) | 101 (33.9%) |
| Total | 187 (100.0%) | 298 (100.0%) |
Property Value to Household Income Ratio in Port Dickinson
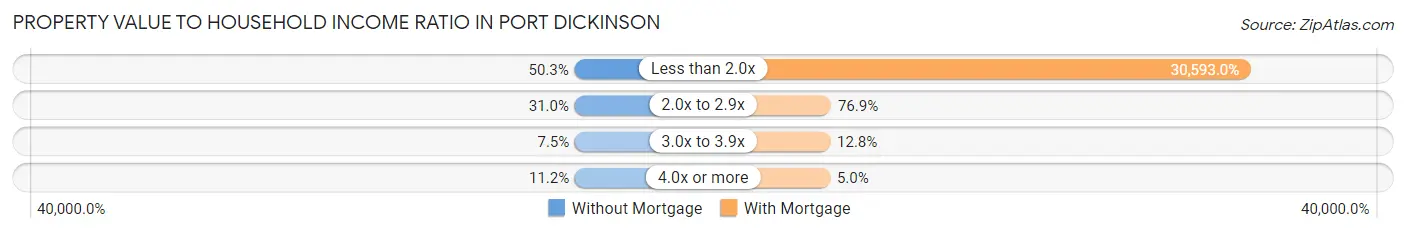
| Value-to-Income Ratio | Without Mortgage | With Mortgage |
| Less than 2.0x | 94 (50.3%) | 91,167 (30,593.0%) |
| 2.0x to 2.9x | 58 (31.0%) | 229 (76.8%) |
| 3.0x to 3.9x | 14 (7.5%) | 38 (12.8%) |
| 4.0x or more | 21 (11.2%) | 15 (5.0%) |
| Total | 187 (100.0%) | 298 (100.0%) |
Real Estate Taxes by Mortgage Status in Port Dickinson
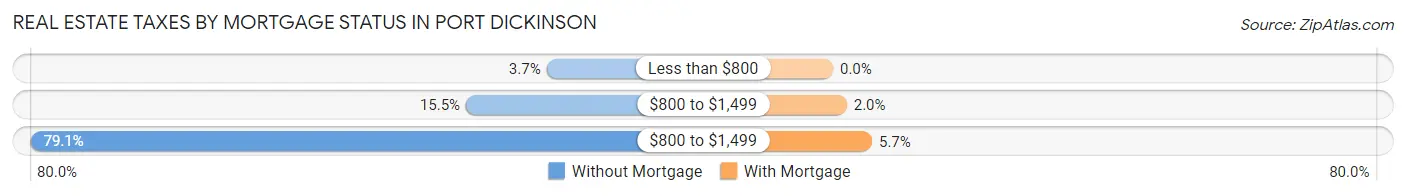
| Property Taxes | Without Mortgage | With Mortgage |
| Less than $800 | 7 (3.7%) | 0 (0.0%) |
| $800 to $1,499 | 29 (15.5%) | 6 (2.0%) |
| $800 to $1,499 | 148 (79.1%) | 17 (5.7%) |
| Total | 187 (100.0%) | 298 (100.0%) |
Health & Disability in Port Dickinson
Health Insurance Coverage by Age in Port Dickinson
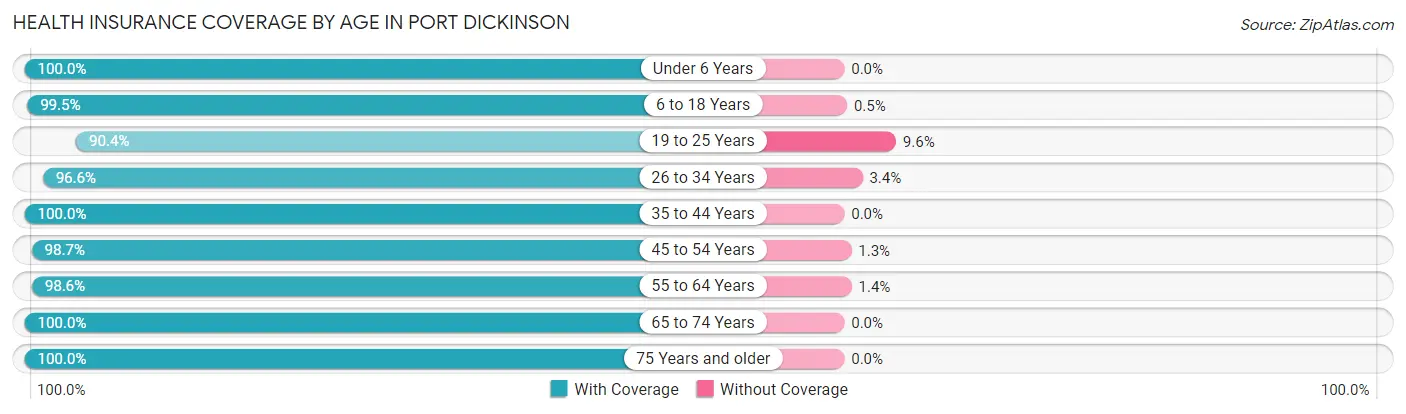
| Age Bracket | With Coverage | Without Coverage |
| Under 6 Years | 127 (100.0%) | 0 (0.0%) |
| 6 to 18 Years | 395 (99.5%) | 2 (0.5%) |
| 19 to 25 Years | 216 (90.4%) | 23 (9.6%) |
| 26 to 34 Years | 200 (96.6%) | 7 (3.4%) |
| 35 to 44 Years | 256 (100.0%) | 0 (0.0%) |
| 45 to 54 Years | 226 (98.7%) | 3 (1.3%) |
| 55 to 64 Years | 217 (98.6%) | 3 (1.4%) |
| 65 to 74 Years | 172 (100.0%) | 0 (0.0%) |
| 75 Years and older | 129 (100.0%) | 0 (0.0%) |
| Total | 1,938 (98.1%) | 38 (1.9%) |
Health Insurance Coverage by Citizenship Status in Port Dickinson
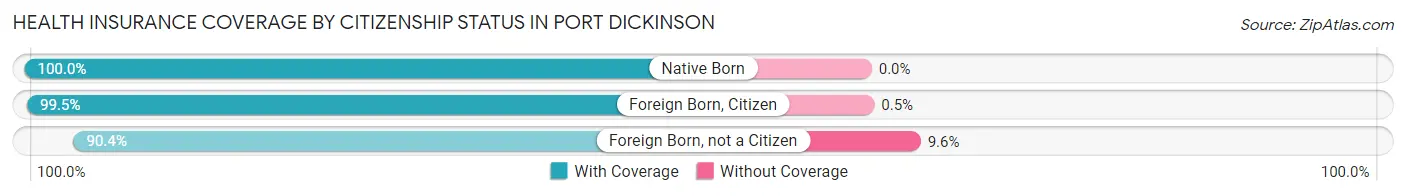
| Citizenship Status | With Coverage | Without Coverage |
| Native Born | 127 (100.0%) | 0 (0.0%) |
| Foreign Born, Citizen | 395 (99.5%) | 2 (0.5%) |
| Foreign Born, not a Citizen | 216 (90.4%) | 23 (9.6%) |
Health Insurance Coverage by Household Income in Port Dickinson
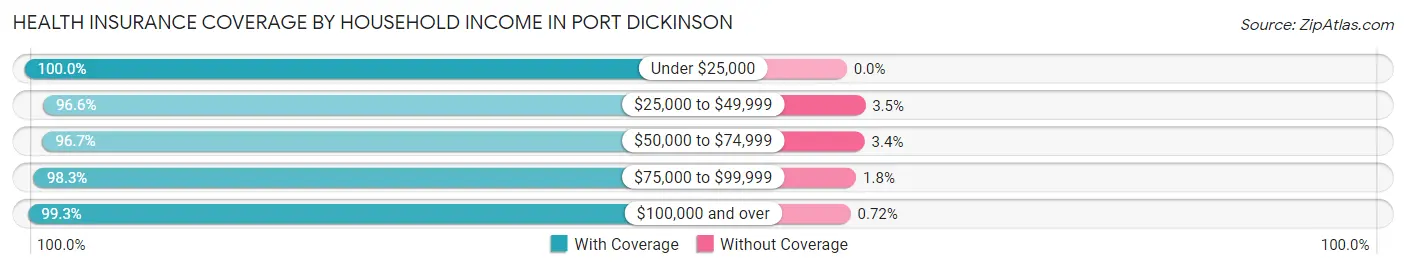
| Household Income | With Coverage | Without Coverage |
| Under $25,000 | 185 (100.0%) | 0 (0.0%) |
| $25,000 to $49,999 | 392 (96.6%) | 14 (3.5%) |
| $50,000 to $74,999 | 433 (96.7%) | 15 (3.4%) |
| $75,000 to $99,999 | 225 (98.3%) | 4 (1.8%) |
| $100,000 and over | 687 (99.3%) | 5 (0.7%) |
Public vs Private Health Insurance Coverage by Age in Port Dickinson
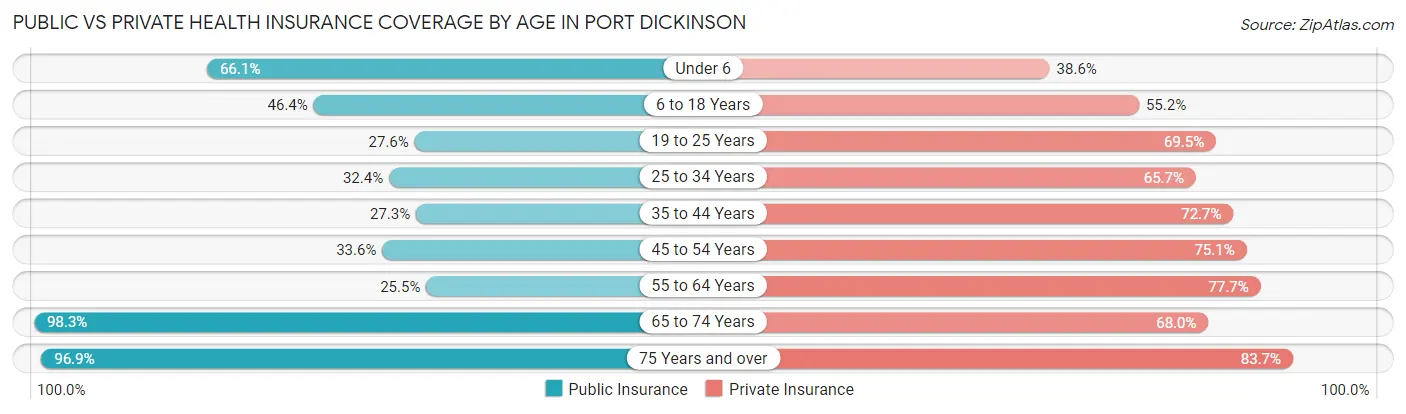
| Age Bracket | Public Insurance | Private Insurance |
| Under 6 | 84 (66.1%) | 49 (38.6%) |
| 6 to 18 Years | 184 (46.4%) | 219 (55.2%) |
| 19 to 25 Years | 66 (27.6%) | 166 (69.5%) |
| 25 to 34 Years | 67 (32.4%) | 136 (65.7%) |
| 35 to 44 Years | 70 (27.3%) | 186 (72.7%) |
| 45 to 54 Years | 77 (33.6%) | 172 (75.1%) |
| 55 to 64 Years | 56 (25.5%) | 171 (77.7%) |
| 65 to 74 Years | 169 (98.3%) | 117 (68.0%) |
| 75 Years and over | 125 (96.9%) | 108 (83.7%) |
| Total | 898 (45.5%) | 1,324 (67.0%) |
Disability Status by Sex by Age in Port Dickinson
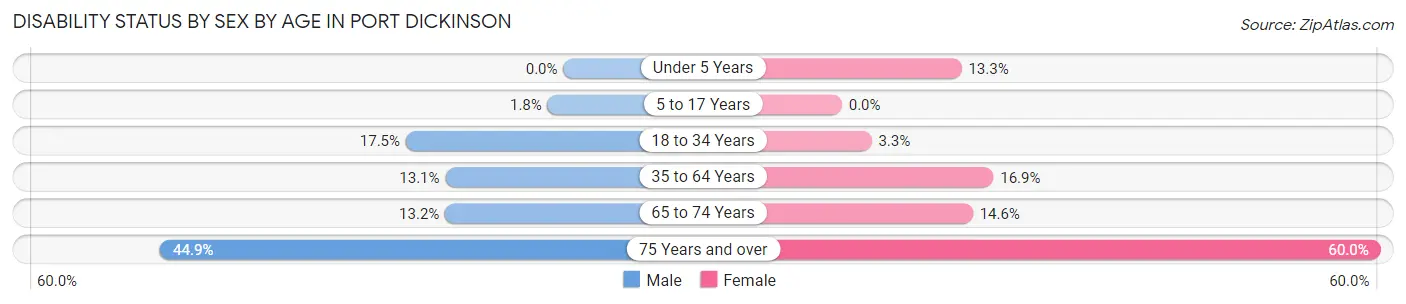
| Age Bracket | Male | Female |
| Under 5 Years | 0 (0.0%) | 6 (13.3%) |
| 5 to 17 Years | 3 (1.8%) | 0 (0.0%) |
| 18 to 34 Years | 37 (17.5%) | 9 (3.3%) |
| 35 to 64 Years | 49 (13.1%) | 56 (16.9%) |
| 65 to 74 Years | 10 (13.2%) | 14 (14.6%) |
| 75 Years and over | 22 (44.9%) | 48 (60.0%) |
Disability Class by Sex by Age in Port Dickinson
Disability Class: Hearing Difficulty
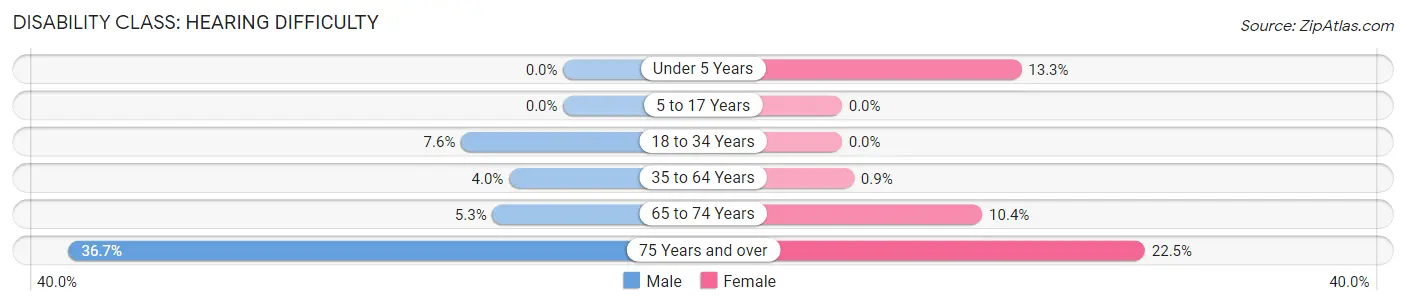
| Age Bracket | Male | Female |
| Under 5 Years | 0 (0.0%) | 6 (13.3%) |
| 5 to 17 Years | 0 (0.0%) | 0 (0.0%) |
| 18 to 34 Years | 16 (7.6%) | 0 (0.0%) |
| 35 to 64 Years | 15 (4.0%) | 3 (0.9%) |
| 65 to 74 Years | 4 (5.3%) | 10 (10.4%) |
| 75 Years and over | 18 (36.7%) | 18 (22.5%) |
Disability Class: Vision Difficulty
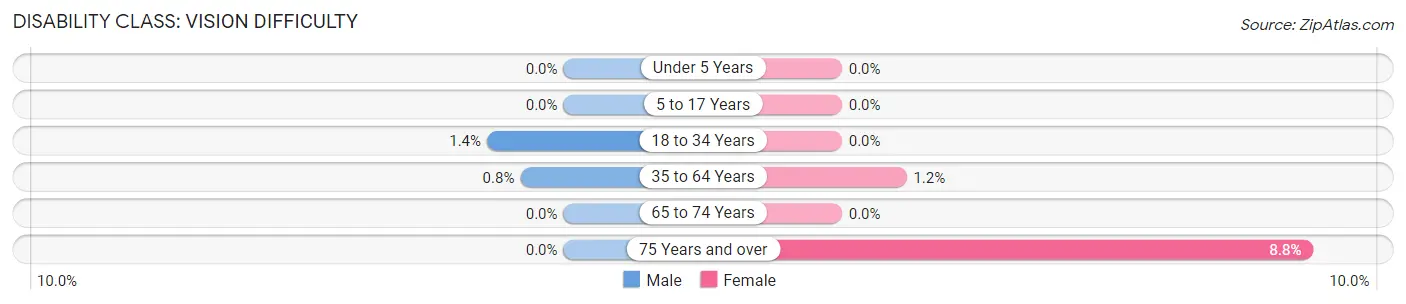
| Age Bracket | Male | Female |
| Under 5 Years | 0 (0.0%) | 0 (0.0%) |
| 5 to 17 Years | 0 (0.0%) | 0 (0.0%) |
| 18 to 34 Years | 3 (1.4%) | 0 (0.0%) |
| 35 to 64 Years | 3 (0.8%) | 4 (1.2%) |
| 65 to 74 Years | 0 (0.0%) | 0 (0.0%) |
| 75 Years and over | 0 (0.0%) | 7 (8.7%) |
Disability Class: Cognitive Difficulty
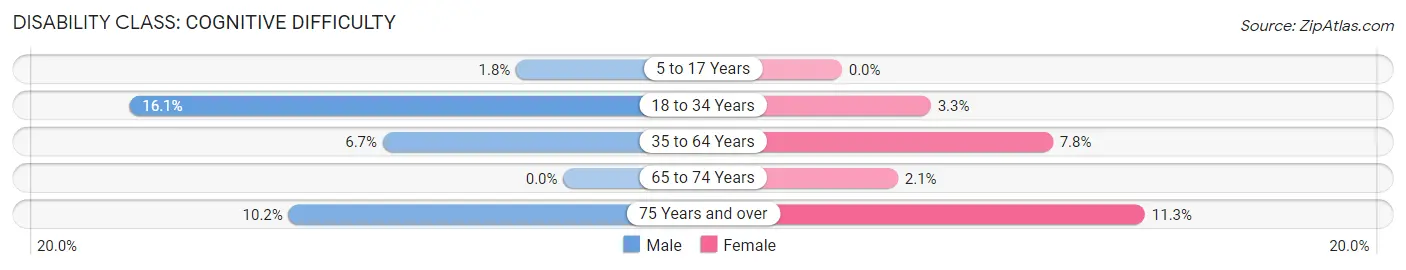
| Age Bracket | Male | Female |
| 5 to 17 Years | 3 (1.8%) | 0 (0.0%) |
| 18 to 34 Years | 34 (16.1%) | 9 (3.3%) |
| 35 to 64 Years | 25 (6.7%) | 26 (7.8%) |
| 65 to 74 Years | 0 (0.0%) | 2 (2.1%) |
| 75 Years and over | 5 (10.2%) | 9 (11.3%) |
Disability Class: Ambulatory Difficulty
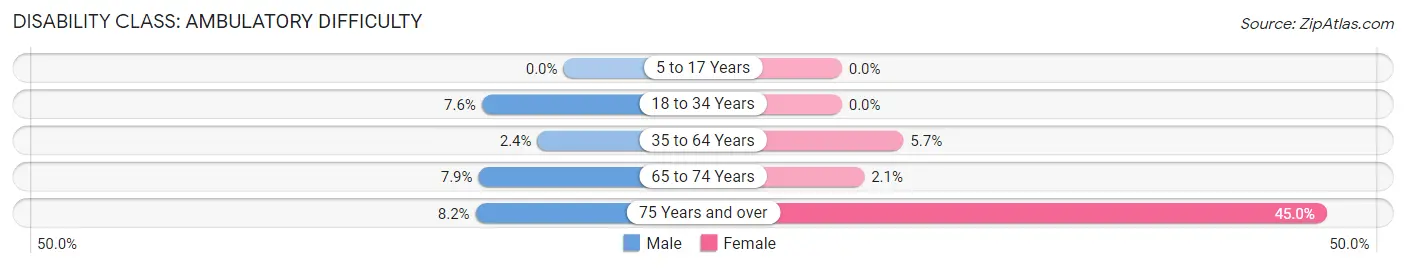
| Age Bracket | Male | Female |
| 5 to 17 Years | 0 (0.0%) | 0 (0.0%) |
| 18 to 34 Years | 16 (7.6%) | 0 (0.0%) |
| 35 to 64 Years | 9 (2.4%) | 19 (5.7%) |
| 65 to 74 Years | 6 (7.9%) | 2 (2.1%) |
| 75 Years and over | 4 (8.2%) | 36 (45.0%) |
Disability Class: Self-Care Difficulty
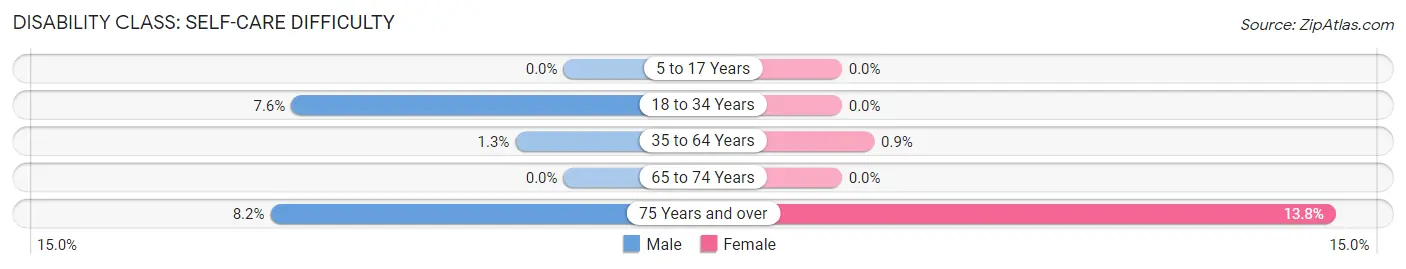
| Age Bracket | Male | Female |
| 5 to 17 Years | 0 (0.0%) | 0 (0.0%) |
| 18 to 34 Years | 16 (7.6%) | 0 (0.0%) |
| 35 to 64 Years | 5 (1.3%) | 3 (0.9%) |
| 65 to 74 Years | 0 (0.0%) | 0 (0.0%) |
| 75 Years and over | 4 (8.2%) | 11 (13.8%) |
Technology Access in Port Dickinson
Computing Device Access in Port Dickinson
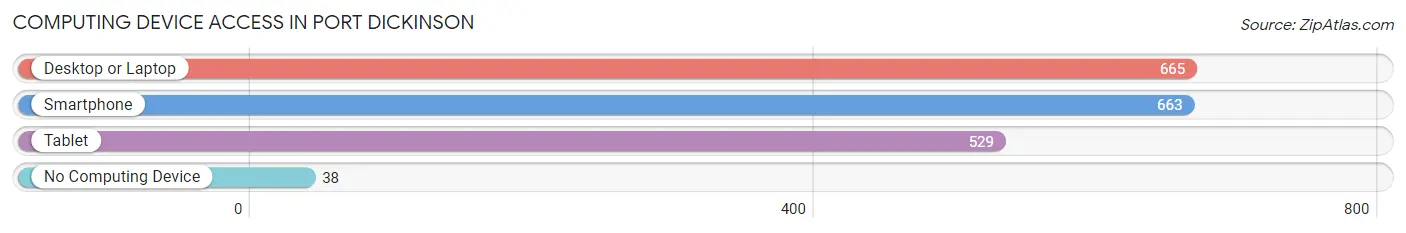
| Device Type | # Households | % Households |
| Desktop or Laptop | 665 | 83.8% |
| Smartphone | 663 | 83.5% |
| Tablet | 529 | 66.6% |
| No Computing Device | 38 | 4.8% |
| Total | 794 | 100.0% |
Internet Access in Port Dickinson
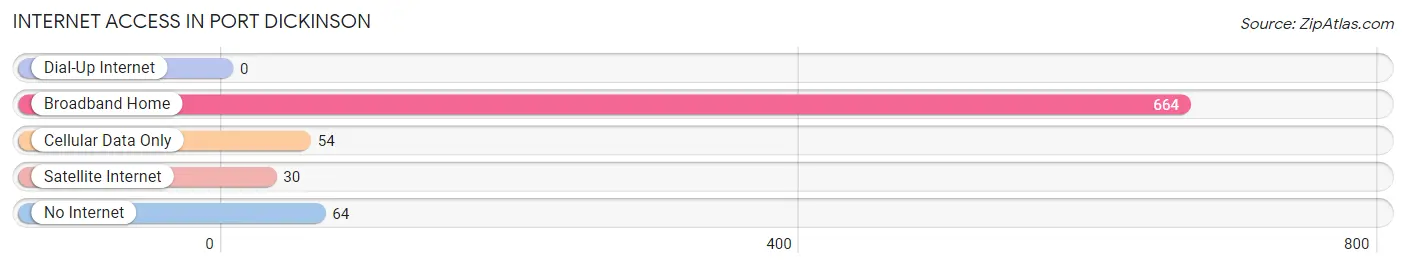
| Internet Type | # Households | % Households |
| Dial-Up Internet | 0 | 0.0% |
| Broadband Home | 664 | 83.6% |
| Cellular Data Only | 54 | 6.8% |
| Satellite Internet | 30 | 3.8% |
| No Internet | 64 | 8.1% |
| Total | 794 | 100.0% |
Port Dickinson Summary
History
Port Dickinson is a village located in Broome County, New York, United States. It is part of the Binghamton Metropolitan Statistical Area. The village was incorporated in 1887 and is located on the Susquehanna River. The village was originally known as "Port Dickinson Landing" and was a major port for the transportation of goods and passengers.
The area was first settled in 1786 by John Dickinson, who established a trading post and ferry service. The village was named after him. In 1820, the village was incorporated as the "Village of Port Dickinson". The village was a major port for the transportation of goods and passengers. The Susquehanna and Chenango Canal, which opened in 1837, connected the village to Binghamton and other towns in the region.
The village was a major center of industry in the 19th century. It was home to several mills, including a paper mill, a grist mill, and a saw mill. The village also had a tannery, a brewery, and a distillery. The village was also home to several churches, including the First Presbyterian Church, which was founded in 1820.
Geography
Port Dickinson is located at 42°05'N 75°54'W (42.0833, -75.9000). The village is located on the Susquehanna River, which forms the northern boundary of the village. The village is located in the Southern Tier region of New York State.
The village has a total area of 1.2 square miles (3.2 km2), all of which is land. The village is located in the Chenango Valley, which is part of the Appalachian Plateau. The village is located in a hilly area, with elevations ranging from 500 to 800 feet (152 to 244 m).
Economy
The economy of Port Dickinson is largely based on manufacturing and services. The village is home to several manufacturing companies, including a paper mill, a grist mill, and a saw mill. The village also has several retail stores, restaurants, and other businesses.
The village is also home to several educational institutions, including Broome Community College and the State University of New York at Binghamton. The village is also home to several medical facilities, including UHS Wilson Medical Center and Lourdes Hospital.
Demographics
As of the 2010 census, the village had a population of 2,845. The racial makeup of the village was 94.2% White, 1.7% African American, 0.3% Native American, 0.7% Asian, 0.1% Pacific Islander, 1.2% from other races, and 1.9% from two or more races. Hispanic or Latino of any race were 3.3% of the population.
The median income for a household in the village was $41,250, and the median income for a family was $50,000. The per capita income for the village was $20,945. About 8.3% of families and 11.2% of the population were below the poverty line, including 16.2% of those under age 18 and 5.2% of those age 65 or over.
Common Questions
What is Per Capita Income in Port Dickinson?
Per Capita income in Port Dickinson is $28,477.
What is the Median Family Income in Port Dickinson?
Median Family Income in Port Dickinson is $75,000.
What is the Median Household income in Port Dickinson?
Median Household Income in Port Dickinson is $56,154.
What is Income or Wage Gap in Port Dickinson?
Income or Wage Gap in Port Dickinson is 28.8%.
Women in Port Dickinson earn 71.2 cents for every dollar earned by a man.
What is Inequality or Gini Index in Port Dickinson?
Inequality or Gini Index in Port Dickinson is 0.37.
What is the Total Population of Port Dickinson?
Total Population of Port Dickinson is 1,976.
What is the Total Male Population of Port Dickinson?
Total Male Population of Port Dickinson is 894.
What is the Total Female Population of Port Dickinson?
Total Female Population of Port Dickinson is 1,082.
What is the Ratio of Males per 100 Females in Port Dickinson?
There are 82.62 Males per 100 Females in Port Dickinson.
What is the Ratio of Females per 100 Males in Port Dickinson?
There are 121.03 Females per 100 Males in Port Dickinson.
What is the Median Population Age in Port Dickinson?
Median Population Age in Port Dickinson is 36.3 Years.
What is the Average Family Size in Port Dickinson
Average Family Size in Port Dickinson is 3.1 People.
What is the Average Household Size in Port Dickinson
Average Household Size in Port Dickinson is 2.5 People.
How Large is the Labor Force in Port Dickinson?
There are 1,045 People in the Labor Forcein in Port Dickinson.
What is the Percentage of People in the Labor Force in Port Dickinson?
69.0% of People are in the Labor Force in Port Dickinson.
What is the Unemployment Rate in Port Dickinson?
Unemployment Rate in Port Dickinson is 3.2%.