Peach Lake, NY Map & Demographics
Peach Lake Map
Peach Lake Overview
$56,458
PER CAPITA INCOME
$155,469
AVG FAMILY INCOME
$119,861
AVG HOUSEHOLD INCOME
24.2%
WAGE / INCOME GAP [ % ]
75.8¢/ $1
WAGE / INCOME GAP [ $ ]
0.38
INEQUALITY / GINI INDEX
1,349
TOTAL POPULATION
719
MALE POPULATION
630
FEMALE POPULATION
114.13
MALES / 100 FEMALES
87.62
FEMALES / 100 MALES
51.9
MEDIAN AGE
3.1
AVG FAMILY SIZE
2.4
AVG HOUSEHOLD SIZE
807
LABOR FORCE [ PEOPLE ]
71.4%
PERCENT IN LABOR FORCE
6.8%
UNEMPLOYMENT RATE
Income in Peach Lake
Income Overview in Peach Lake
Per Capita Income in Peach Lake is $56,458, while median incomes of families and households are $155,469 and $119,861 respectively.
| Characteristic | Number | Measure |
| Per Capita Income | 1,349 | $56,458 |
| Median Family Income | 345 | $155,469 |
| Mean Family Income | 345 | $165,393 |
| Median Household Income | 573 | $119,861 |
| Mean Household Income | 573 | $134,678 |
| Income Deficit | 345 | $0 |
| Wage / Income Gap (%) | 1,349 | 24.16% |
| Wage / Income Gap ($) | 1,349 | 75.84¢ per $1 |
| Gini / Inequality Index | 1,349 | 0.38 |
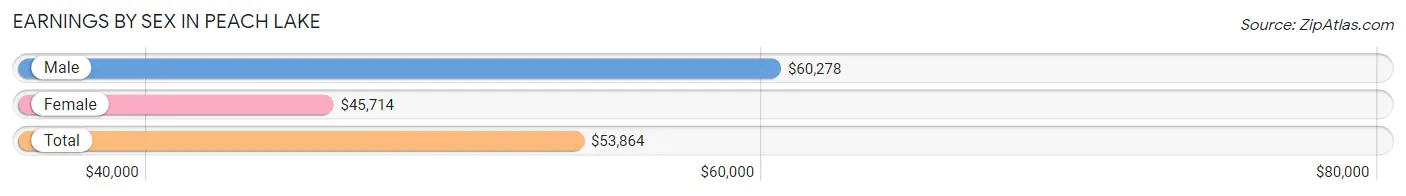
Earnings by Sex in Peach Lake
Average Earnings in Peach Lake are $53,864, $60,278 for men and $45,714 for women, a difference of 24.2%.
| Sex | Number | Average Earnings |
| Male | 430 (52.1%) | $60,278 |
| Female | 396 (47.9%) | $45,714 |
| Total | 826 (100.0%) | $53,864 |
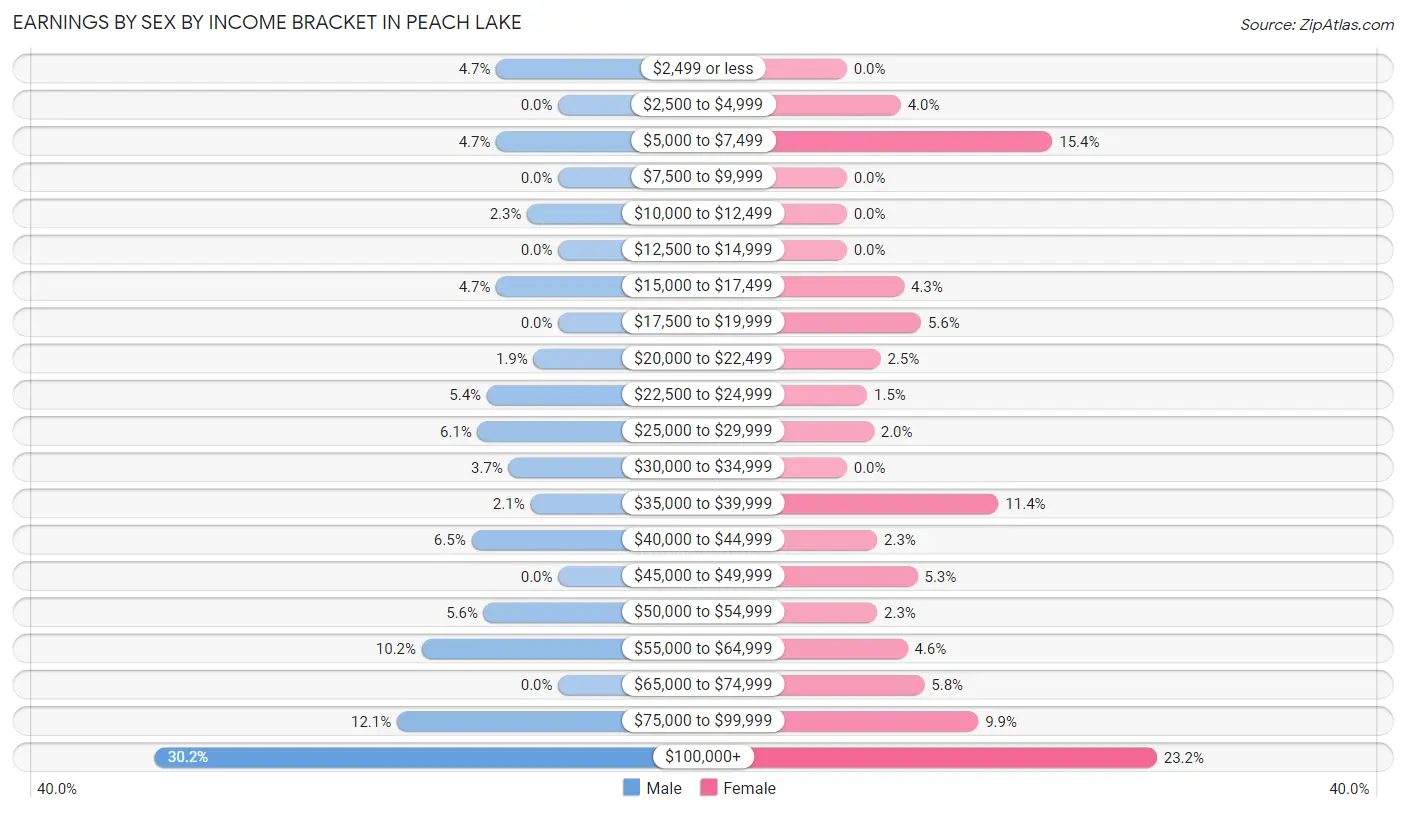
Earnings by Sex by Income Bracket in Peach Lake
The most common earnings brackets in Peach Lake are $100,000+ for men (130 | 30.2%) and $100,000+ for women (92 | 23.2%).
| Income | Male | Female |
| $2,499 or less | 20 (4.6%) | 0 (0.0%) |
| $2,500 to $4,999 | 0 (0.0%) | 16 (4.0%) |
| $5,000 to $7,499 | 20 (4.6%) | 61 (15.4%) |
| $7,500 to $9,999 | 0 (0.0%) | 0 (0.0%) |
| $10,000 to $12,499 | 10 (2.3%) | 0 (0.0%) |
| $12,500 to $14,999 | 0 (0.0%) | 0 (0.0%) |
| $15,000 to $17,499 | 20 (4.6%) | 17 (4.3%) |
| $17,500 to $19,999 | 0 (0.0%) | 22 (5.6%) |
| $20,000 to $22,499 | 8 (1.9%) | 10 (2.5%) |
| $22,500 to $24,999 | 23 (5.3%) | 6 (1.5%) |
| $25,000 to $29,999 | 26 (6.0%) | 8 (2.0%) |
| $30,000 to $34,999 | 16 (3.7%) | 0 (0.0%) |
| $35,000 to $39,999 | 9 (2.1%) | 45 (11.4%) |
| $40,000 to $44,999 | 28 (6.5%) | 9 (2.3%) |
| $45,000 to $49,999 | 0 (0.0%) | 21 (5.3%) |
| $50,000 to $54,999 | 24 (5.6%) | 9 (2.3%) |
| $55,000 to $64,999 | 44 (10.2%) | 18 (4.5%) |
| $65,000 to $74,999 | 0 (0.0%) | 23 (5.8%) |
| $75,000 to $99,999 | 52 (12.1%) | 39 (9.9%) |
| $100,000+ | 130 (30.2%) | 92 (23.2%) |
| Total | 430 (100.0%) | 396 (100.0%) |
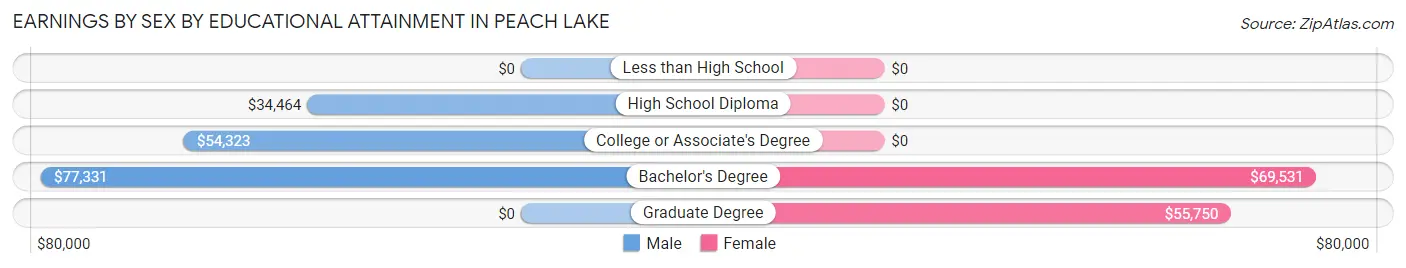
Earnings by Sex by Educational Attainment in Peach Lake
Average earnings in Peach Lake are $62,900 for men and $54,861 for women, a difference of 12.8%. Men with an educational attainment of bachelor's degree enjoy the highest average annual earnings of $77,331, while those with high school diploma education earn the least with $34,464. Women with an educational attainment of bachelor's degree earn the most with the average annual earnings of $69,531, while those with graduate degree education have the smallest earnings of $55,750.
| Educational Attainment | Male Income | Female Income |
| Less than High School | - | - |
| High School Diploma | $34,464 | $0 |
| College or Associate's Degree | $54,323 | $0 |
| Bachelor's Degree | $77,331 | $69,531 |
| Graduate Degree | - | - |
| Total | $62,900 | $54,861 |
Family Income in Peach Lake
Family Income Brackets in Peach Lake
According to the Peach Lake family income data, there are 96 families falling into the $100,000 to $149,999 income range, which is the most common income bracket and makes up 27.8% of all families.
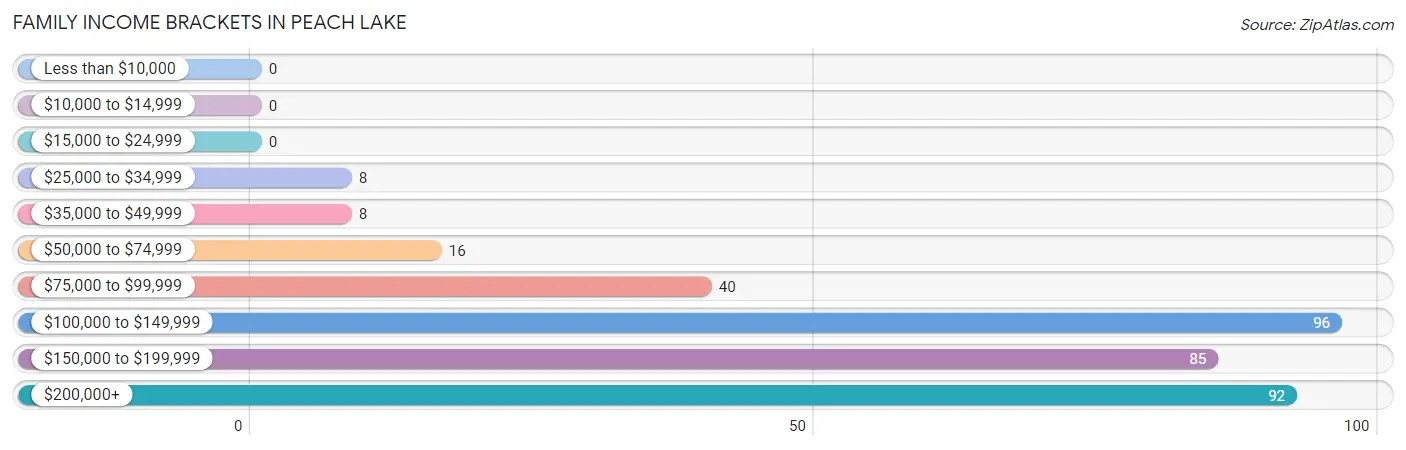
| Income Bracket | # Families | % Families |
| Less than $10,000 | 0 | 0.0% |
| $10,000 to $14,999 | 0 | 0.0% |
| $15,000 to $24,999 | 0 | 0.0% |
| $25,000 to $34,999 | 8 | 2.3% |
| $35,000 to $49,999 | 8 | 2.3% |
| $50,000 to $74,999 | 16 | 4.6% |
| $75,000 to $99,999 | 40 | 11.6% |
| $100,000 to $149,999 | 96 | 27.8% |
| $150,000 to $199,999 | 85 | 24.6% |
| $200,000+ | 92 | 26.7% |
Family Income by Famaliy Size in Peach Lake
4-person families (43 | 12.5%) account for the highest median family income in Peach Lake with $174,219 per family, while 2-person families (135 | 39.1%) have the highest median income of $70,062 per family member.
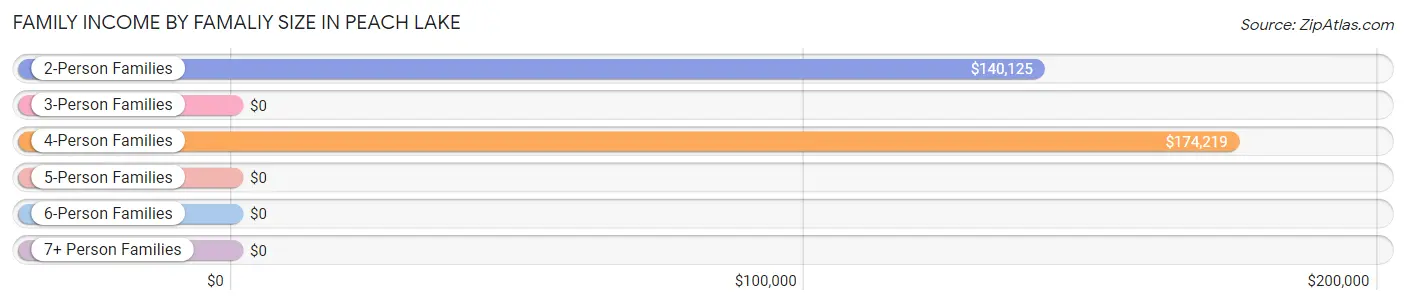
| Income Bracket | # Families | Median Income |
| 2-Person Families | 135 (39.1%) | $140,125 |
| 3-Person Families | 112 (32.5%) | $0 |
| 4-Person Families | 43 (12.5%) | $174,219 |
| 5-Person Families | 37 (10.7%) | $0 |
| 6-Person Families | 11 (3.2%) | $0 |
| 7+ Person Families | 7 (2.0%) | $0 |
| Total | 345 (100.0%) | $155,469 |
Family Income by Number of Earners in Peach Lake
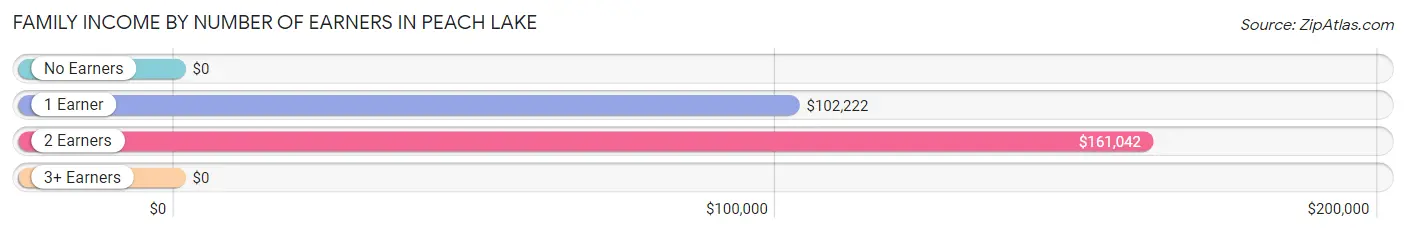
| Number of Earners | # Families | Median Income |
| No Earners | 7 (2.0%) | $0 |
| 1 Earner | 84 (24.3%) | $102,222 |
| 2 Earners | 188 (54.5%) | $161,042 |
| 3+ Earners | 66 (19.1%) | $0 |
| Total | 345 (100.0%) | $155,469 |
Household Income in Peach Lake
Household Income Brackets in Peach Lake
With 139 households falling in the category, the $100,000 to $149,999 income range is the most frequent in Peach Lake, accounting for 24.3% of all households.
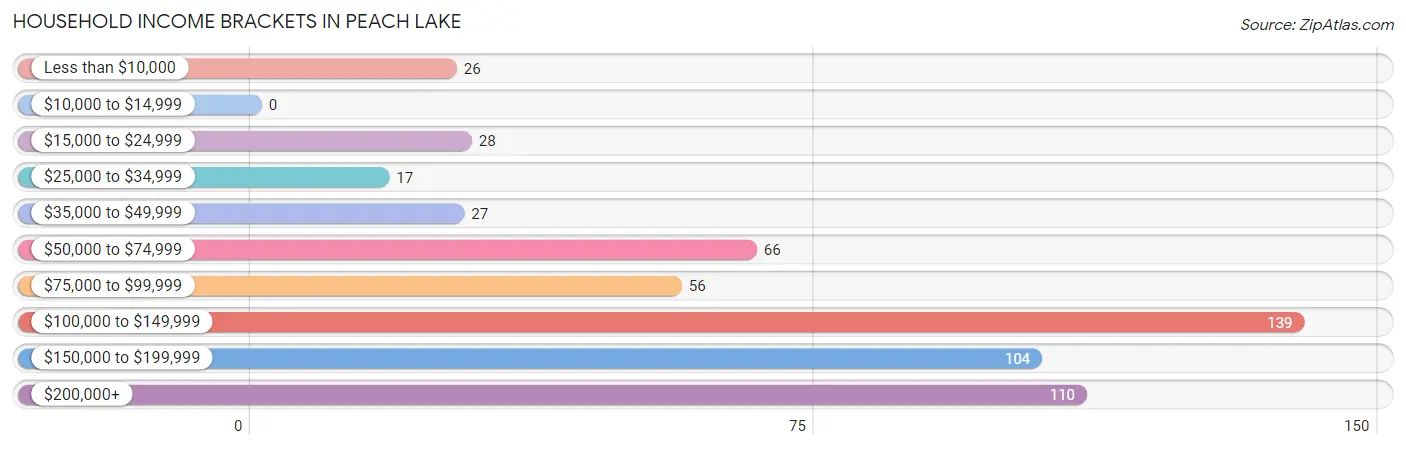
| Income Bracket | # Households | % Households |
| Less than $10,000 | 26 | 4.5% |
| $10,000 to $14,999 | 0 | 0.0% |
| $15,000 to $24,999 | 28 | 4.9% |
| $25,000 to $34,999 | 17 | 3.0% |
| $35,000 to $49,999 | 27 | 4.7% |
| $50,000 to $74,999 | 66 | 11.5% |
| $75,000 to $99,999 | 56 | 9.8% |
| $100,000 to $149,999 | 139 | 24.3% |
| $150,000 to $199,999 | 104 | 18.2% |
| $200,000+ | 110 | 19.2% |
Household Income by Householder Age in Peach Lake
The median household income in Peach Lake is $119,861, with the highest median household income of $148,125 found in the 25 to 44 years age bracket for the primary householder. A total of 108 households (18.9%) fall into this category.
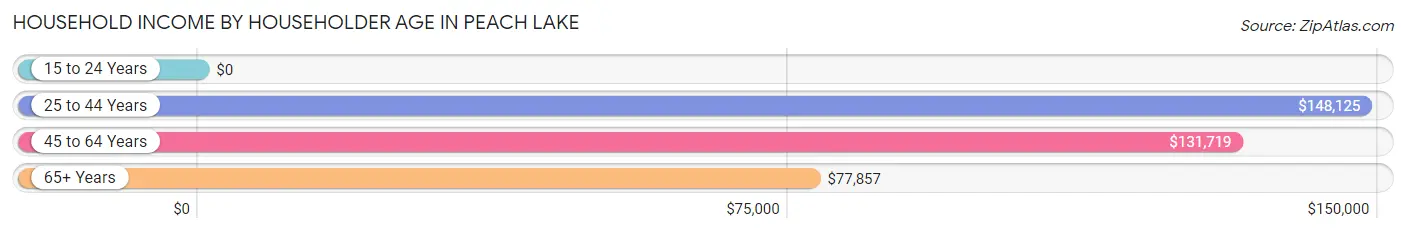
| Income Bracket | # Households | Median Income |
| 15 to 24 Years | 0 (0.0%) | $0 |
| 25 to 44 Years | 108 (18.9%) | $148,125 |
| 45 to 64 Years | 291 (50.8%) | $131,719 |
| 65+ Years | 174 (30.4%) | $77,857 |
| Total | 573 (100.0%) | $119,861 |
Poverty in Peach Lake
Income Below Poverty by Sex and Age in Peach Lake
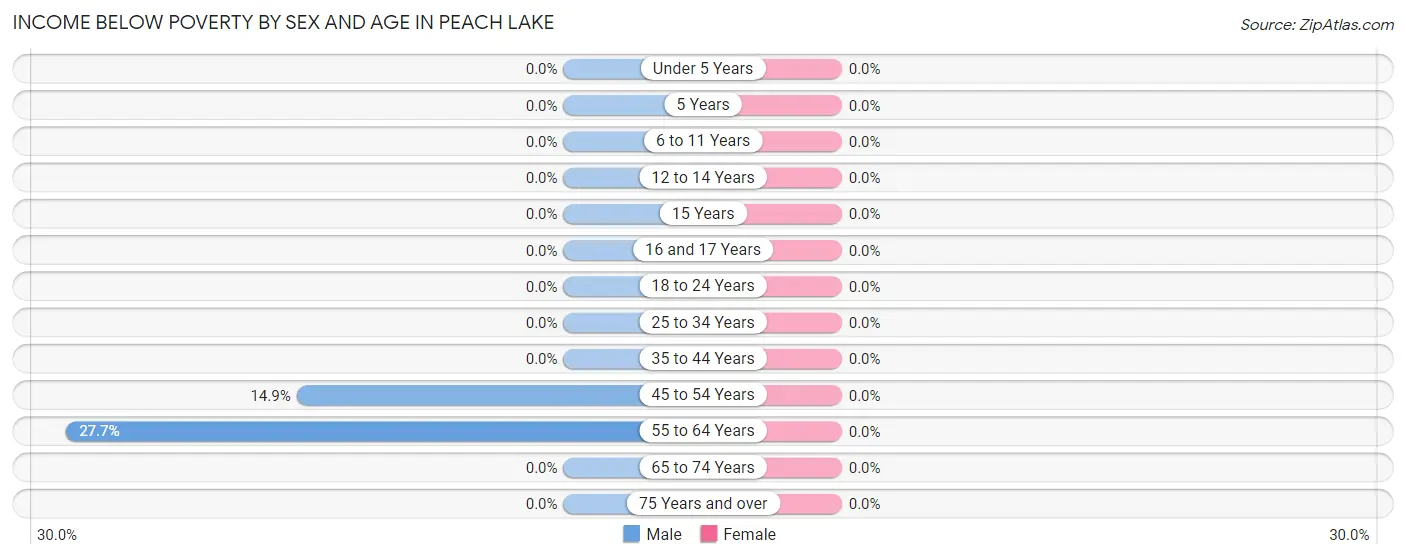
| Age Bracket | Male | Female |
| Under 5 Years | 0 (0.0%) | 0 (0.0%) |
| 5 Years | 0 (0.0%) | 0 (0.0%) |
| 6 to 11 Years | 0 (0.0%) | 0 (0.0%) |
| 12 to 14 Years | 0 (0.0%) | 0 (0.0%) |
| 15 Years | 0 (0.0%) | 0 (0.0%) |
| 16 and 17 Years | 0 (0.0%) | 0 (0.0%) |
| 18 to 24 Years | 0 (0.0%) | 0 (0.0%) |
| 25 to 34 Years | 0 (0.0%) | 0 (0.0%) |
| 35 to 44 Years | 0 (0.0%) | 0 (0.0%) |
| 45 to 54 Years | 11 (14.9%) | 0 (0.0%) |
| 55 to 64 Years | 49 (27.7%) | 0 (0.0%) |
| 65 to 74 Years | 0 (0.0%) | 0 (0.0%) |
| 75 Years and over | 0 (0.0%) | 0 (0.0%) |
| Total | 60 (8.3%) | 0 (0.0%) |
Income Above Poverty by Sex and Age in Peach Lake
According to the poverty statistics in Peach Lake, males aged under 5 years and females aged under 5 years are the age groups that are most secure financially, with 100.0% of males and 100.0% of females in these age groups living above the poverty line.
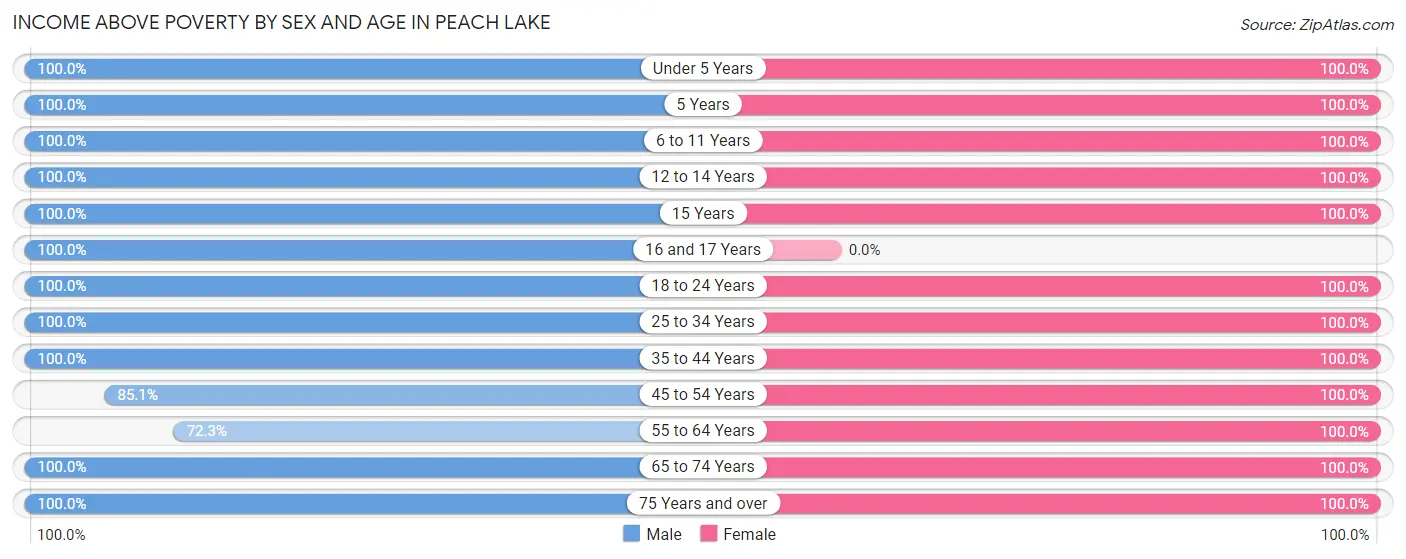
| Age Bracket | Male | Female |
| Under 5 Years | 14 (100.0%) | 62 (100.0%) |
| 5 Years | 11 (100.0%) | 9 (100.0%) |
| 6 to 11 Years | 48 (100.0%) | 7 (100.0%) |
| 12 to 14 Years | 9 (100.0%) | 27 (100.0%) |
| 15 Years | 23 (100.0%) | 9 (100.0%) |
| 16 and 17 Years | 15 (100.0%) | 0 (0.0%) |
| 18 to 24 Years | 47 (100.0%) | 51 (100.0%) |
| 25 to 34 Years | 77 (100.0%) | 84 (100.0%) |
| 35 to 44 Years | 55 (100.0%) | 36 (100.0%) |
| 45 to 54 Years | 63 (85.1%) | 64 (100.0%) |
| 55 to 64 Years | 128 (72.3%) | 139 (100.0%) |
| 65 to 74 Years | 121 (100.0%) | 84 (100.0%) |
| 75 Years and over | 48 (100.0%) | 58 (100.0%) |
| Total | 659 (91.7%) | 630 (100.0%) |
Income Below Poverty Among Married-Couple Families in Peach Lake
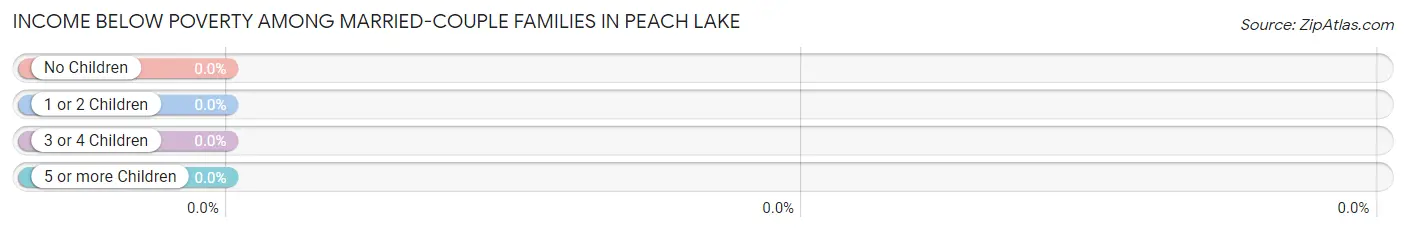
| Children | Above Poverty | Below Poverty |
| No Children | 135 (100.0%) | 0 (0.0%) |
| 1 or 2 Children | 132 (100.0%) | 0 (0.0%) |
| 3 or 4 Children | 17 (100.0%) | 0 (0.0%) |
| 5 or more Children | 0 (0.0%) | 0 (0.0%) |
| Total | 284 (100.0%) | 0 (0.0%) |
Income Below Poverty Among Single-Parent Households in Peach Lake
| Children | Single Father | Single Mother |
| No Children | 0 (0.0%) | 0 (0.0%) |
| 1 or 2 Children | 0 (0.0%) | 0 (0.0%) |
| 3 or 4 Children | 0 (0.0%) | 0 (0.0%) |
| 5 or more Children | 0 (0.0%) | 0 (0.0%) |
| Total | 0 (0.0%) | 0 (0.0%) |
Income Below Poverty Among Married-Couple vs Single-Parent Households in Peach Lake
| Children | Married-Couple Families | Single-Parent Households |
| No Children | 0 (0.0%) | 0 (0.0%) |
| 1 or 2 Children | 0 (0.0%) | 0 (0.0%) |
| 3 or 4 Children | 0 (0.0%) | 0 (0.0%) |
| 5 or more Children | 0 (0.0%) | 0 (0.0%) |
| Total | 0 (0.0%) | 0 (0.0%) |
Race in Peach Lake
The most populous races in Peach Lake are White / Caucasian (1,222 | 90.6%), Asian (78 | 5.8%), and Hispanic or Latino (56 | 4.2%).
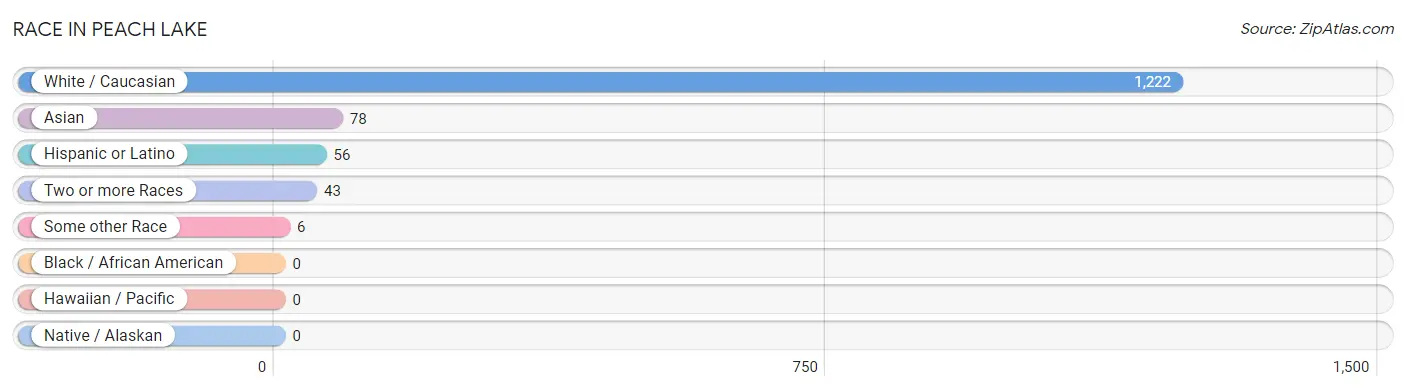
| Race | # Population | % Population |
| Asian | 78 | 5.8% |
| Black / African American | 0 | 0.0% |
| Hawaiian / Pacific | 0 | 0.0% |
| Hispanic or Latino | 56 | 4.2% |
| Native / Alaskan | 0 | 0.0% |
| White / Caucasian | 1,222 | 90.6% |
| Two or more Races | 43 | 3.2% |
| Some other Race | 6 | 0.4% |
| Total | 1,349 | 100.0% |
Ancestry in Peach Lake
The most populous ancestries reported in Peach Lake are Irish (488 | 36.2%), Italian (288 | 21.3%), German (169 | 12.5%), American (92 | 6.8%), and English (65 | 4.8%), together accounting for 81.7% of all Peach Lake residents.
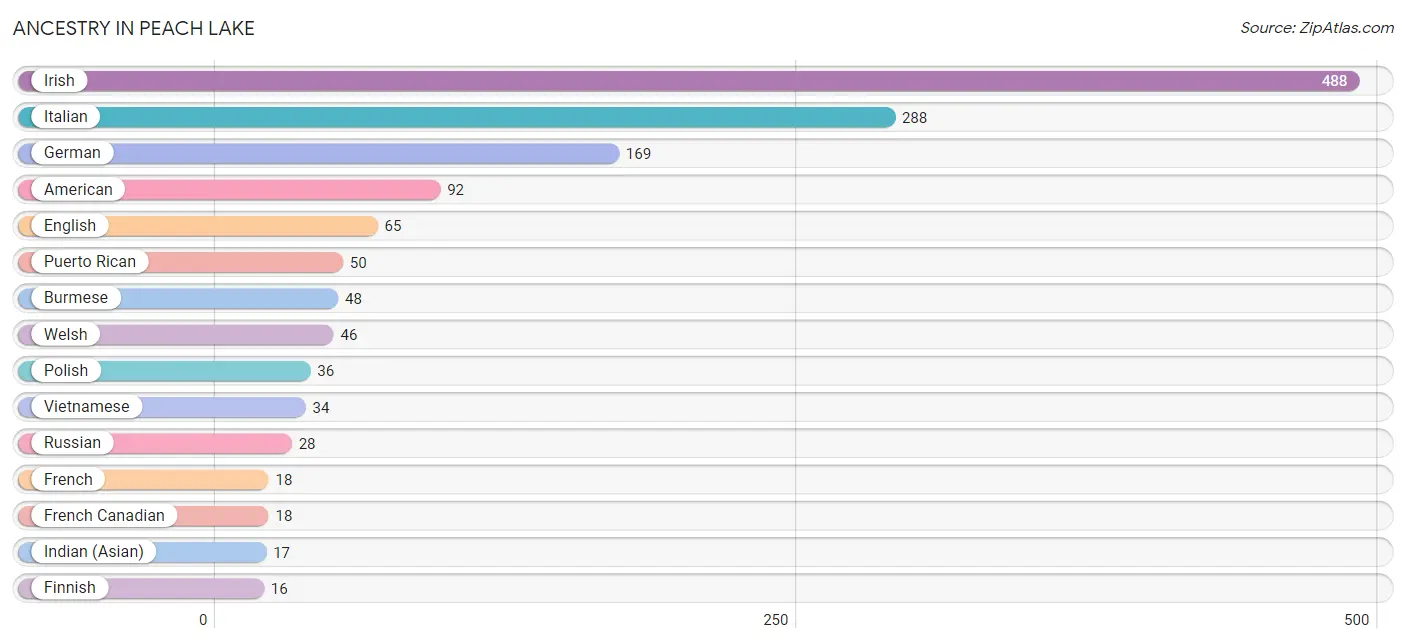
| Ancestry | # Population | % Population |
| American | 92 | 6.8% |
| Belgian | 7 | 0.5% |
| Brazilian | 9 | 0.7% |
| Burmese | 48 | 3.6% |
| Canadian | 10 | 0.7% |
| Czechoslovakian | 15 | 1.1% |
| Dutch | 10 | 0.7% |
| Ecuadorian | 6 | 0.4% |
| English | 65 | 4.8% |
| Finnish | 16 | 1.2% |
| French | 18 | 1.3% |
| French Canadian | 18 | 1.3% |
| German | 169 | 12.5% |
| Greek | 10 | 0.7% |
| Indian (Asian) | 17 | 1.3% |
| Iranian | 9 | 0.7% |
| Irish | 488 | 36.2% |
| Italian | 288 | 21.3% |
| Polish | 36 | 2.7% |
| Portuguese | 7 | 0.5% |
| Puerto Rican | 50 | 3.7% |
| Russian | 28 | 2.1% |
| Scottish | 9 | 0.7% |
| Slavic | 7 | 0.5% |
| Slovak | 15 | 1.1% |
| South American | 6 | 0.4% |
| Vietnamese | 34 | 2.5% |
| Welsh | 46 | 3.4% | View All 28 Rows |
Immigrants in Peach Lake
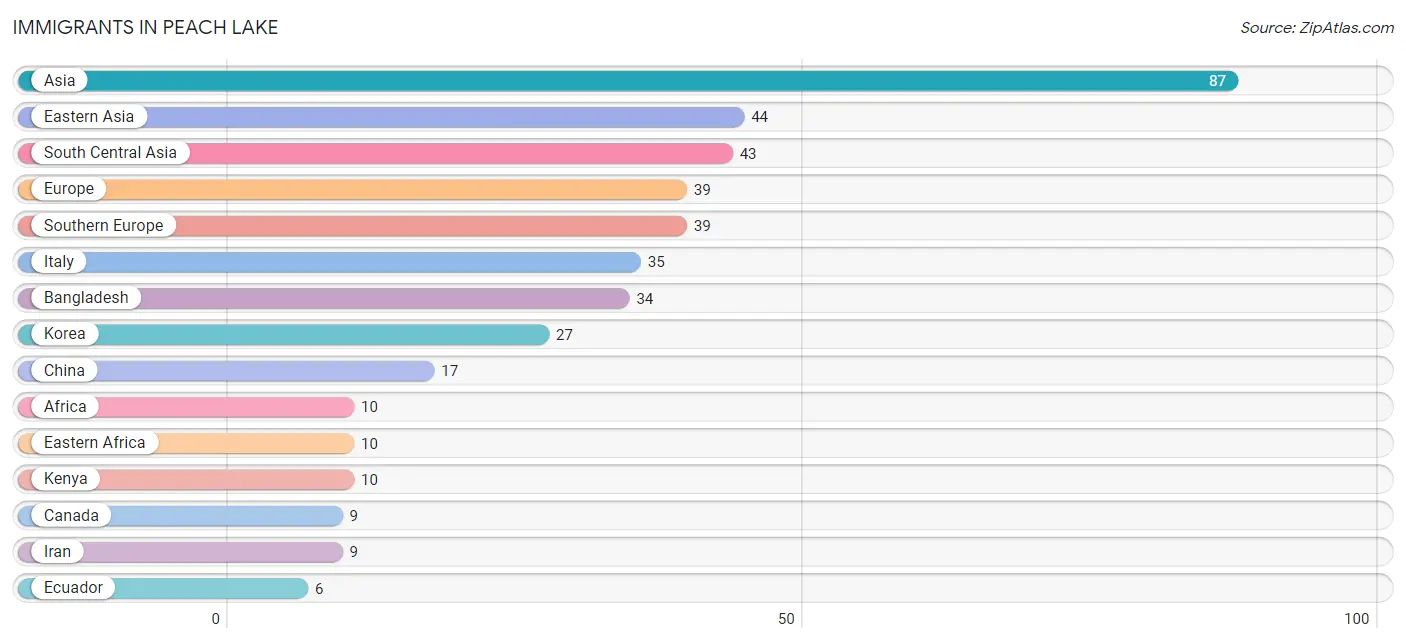
The most numerous immigrant groups reported in Peach Lake came from Asia (87 | 6.5%), Eastern Asia (44 | 3.3%), South Central Asia (43 | 3.2%), Europe (39 | 2.9%), and Southern Europe (39 | 2.9%), together accounting for 18.7% of all Peach Lake residents.
| Immigration Origin | # Population | % Population |
| Africa | 10 | 0.7% |
| Asia | 87 | 6.5% |
| Bangladesh | 34 | 2.5% |
| Canada | 9 | 0.7% |
| China | 17 | 1.3% |
| Eastern Africa | 10 | 0.7% |
| Eastern Asia | 44 | 3.3% |
| Ecuador | 6 | 0.4% |
| Europe | 39 | 2.9% |
| Iran | 9 | 0.7% |
| Italy | 35 | 2.6% |
| Kenya | 10 | 0.7% |
| Korea | 27 | 2.0% |
| Latin America | 6 | 0.4% |
| Portugal | 4 | 0.3% |
| South America | 6 | 0.4% |
| South Central Asia | 43 | 3.2% |
| Southern Europe | 39 | 2.9% | View All 18 Rows |
Sex and Age in Peach Lake
Sex and Age in Peach Lake
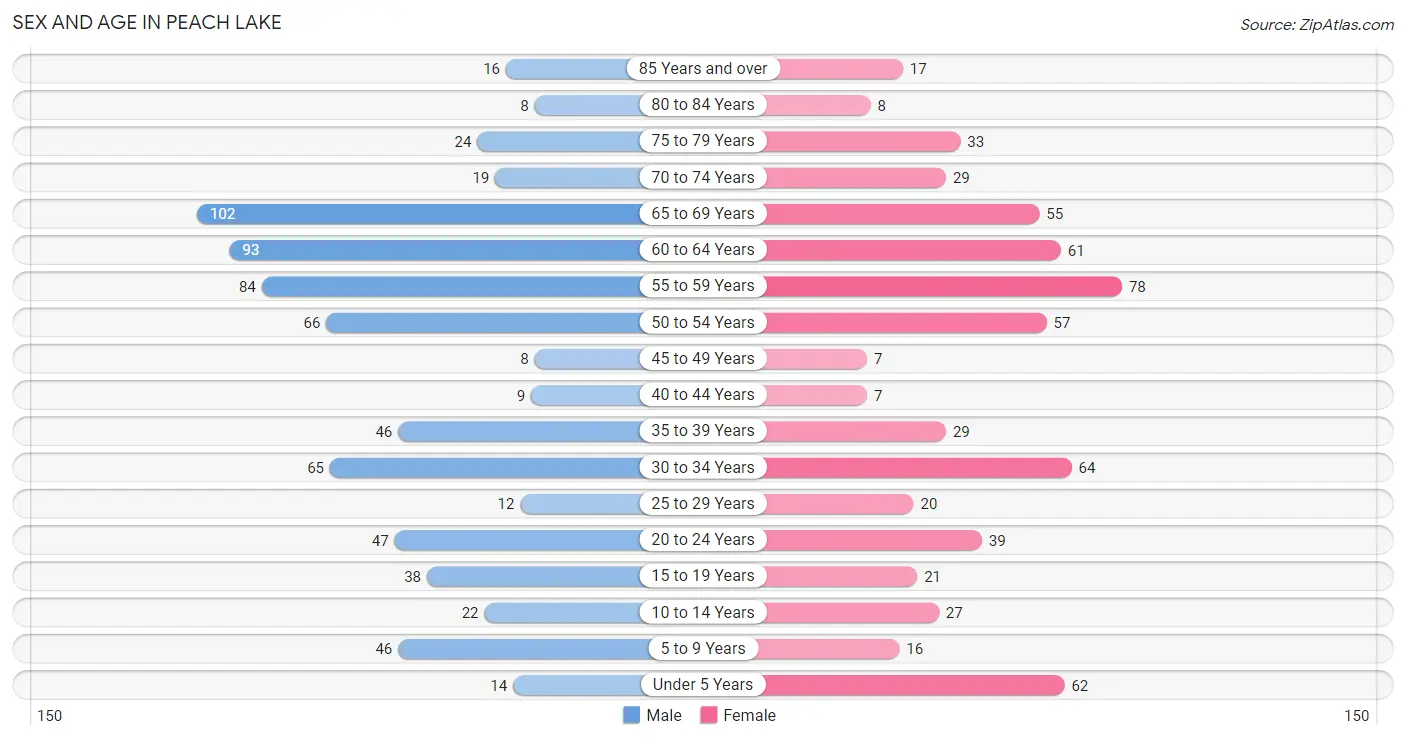
The most populous age groups in Peach Lake are 65 to 69 Years (102 | 14.2%) for men and 55 to 59 Years (78 | 12.4%) for women.
| Age Bracket | Male | Female |
| Under 5 Years | 14 (1.9%) | 62 (9.8%) |
| 5 to 9 Years | 46 (6.4%) | 16 (2.5%) |
| 10 to 14 Years | 22 (3.1%) | 27 (4.3%) |
| 15 to 19 Years | 38 (5.3%) | 21 (3.3%) |
| 20 to 24 Years | 47 (6.5%) | 39 (6.2%) |
| 25 to 29 Years | 12 (1.7%) | 20 (3.2%) |
| 30 to 34 Years | 65 (9.0%) | 64 (10.2%) |
| 35 to 39 Years | 46 (6.4%) | 29 (4.6%) |
| 40 to 44 Years | 9 (1.3%) | 7 (1.1%) |
| 45 to 49 Years | 8 (1.1%) | 7 (1.1%) |
| 50 to 54 Years | 66 (9.2%) | 57 (9.0%) |
| 55 to 59 Years | 84 (11.7%) | 78 (12.4%) |
| 60 to 64 Years | 93 (12.9%) | 61 (9.7%) |
| 65 to 69 Years | 102 (14.2%) | 55 (8.7%) |
| 70 to 74 Years | 19 (2.6%) | 29 (4.6%) |
| 75 to 79 Years | 24 (3.3%) | 33 (5.2%) |
| 80 to 84 Years | 8 (1.1%) | 8 (1.3%) |
| 85 Years and over | 16 (2.2%) | 17 (2.7%) |
| Total | 719 (100.0%) | 630 (100.0%) |
Families and Households in Peach Lake
Median Family Size in Peach Lake
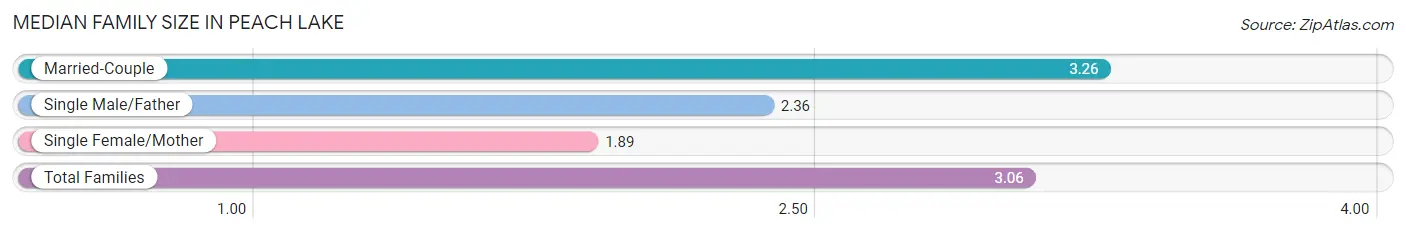
The median family size in Peach Lake is 3.06 persons per family, with married-couple families (284 | 82.3%) accounting for the largest median family size of 3.26 persons per family. On the other hand, single female/mother families (28 | 8.1%) represent the smallest median family size with 1.89 persons per family.
| Family Type | # Families | Family Size |
| Married-Couple | 284 (82.3%) | 3.26 |
| Single Male/Father | 33 (9.6%) | 2.36 |
| Single Female/Mother | 28 (8.1%) | 1.89 |
| Total Families | 345 (100.0%) | 3.06 |
Median Household Size in Peach Lake
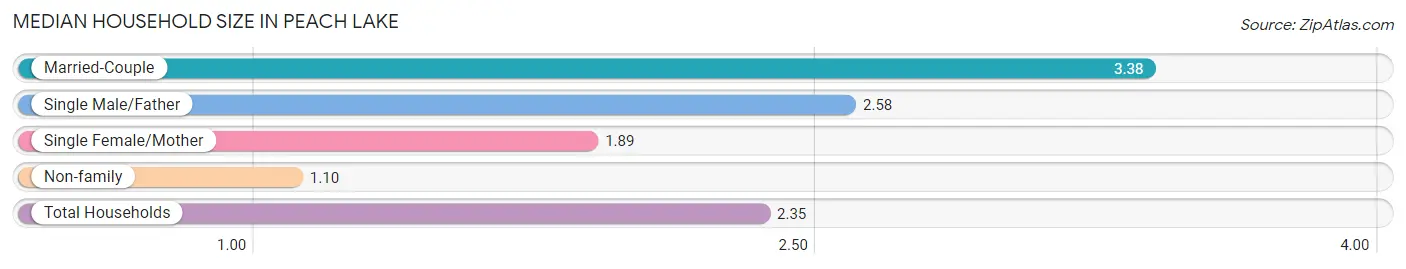
The median household size in Peach Lake is 2.35 persons per household, with married-couple households (284 | 49.6%) accounting for the largest median household size of 3.38 persons per household. non-family households (228 | 39.8%) represent the smallest median household size with 1.10 persons per household.
| Household Type | # Households | Household Size |
| Married-Couple | 284 (49.6%) | 3.38 |
| Single Male/Father | 33 (5.8%) | 2.58 |
| Single Female/Mother | 28 (4.9%) | 1.89 |
| Non-family | 228 (39.8%) | 1.10 |
| Total Households | 573 (100.0%) | 2.35 |
Household Size by Marriage Status in Peach Lake
Out of a total of 573 households in Peach Lake, 345 (60.2%) are family households, while 228 (39.8%) are nonfamily households. The most numerous type of family households are 3-person households, comprising 128, and the most common type of nonfamily households are 1-person households, comprising 203.
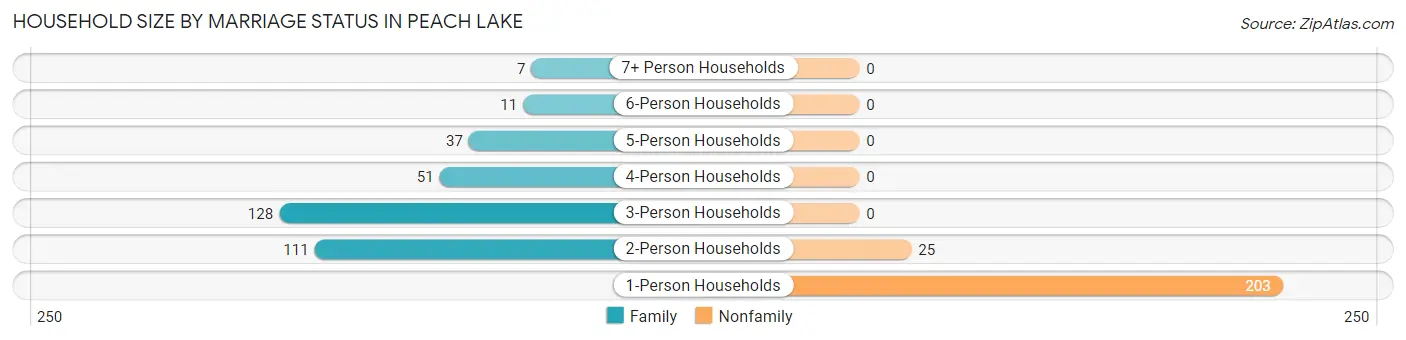
| Household Size | Family Households | Nonfamily Households |
| 1-Person Households | - | 203 (35.4%) |
| 2-Person Households | 111 (19.4%) | 25 (4.4%) |
| 3-Person Households | 128 (22.3%) | 0 (0.0%) |
| 4-Person Households | 51 (8.9%) | 0 (0.0%) |
| 5-Person Households | 37 (6.5%) | 0 (0.0%) |
| 6-Person Households | 11 (1.9%) | 0 (0.0%) |
| 7+ Person Households | 7 (1.2%) | 0 (0.0%) |
| Total | 345 (60.2%) | 228 (39.8%) |
Female Fertility in Peach Lake
Fertility by Age in Peach Lake
| Age Bracket | Women with Births | Births / 1,000 Women |
| 15 to 19 years | 0 (0.0%) | 0.0 |
| 20 to 34 years | 0 (0.0%) | 0.0 |
| 35 to 50 years | 0 (0.0%) | 0.0 |
| Total | 0 (0.0%) | 0.0 |
Fertility by Age by Marriage Status in Peach Lake
| Age Bracket | Married | Unmarried |
| 15 to 19 years | 0 (0.0%) | 0 (0.0%) |
| 20 to 34 years | 0 (0.0%) | 0 (0.0%) |
| 35 to 50 years | 0 (0.0%) | 0 (0.0%) |
| Total | 0 (0.0%) | 0 (0.0%) |
Fertility by Education in Peach Lake
| Educational Attainment | Women with Births | Births / 1,000 Women |
| Less than High School | 0 (0.0%) | 0.0 |
| High School Diploma | 0 (0.0%) | 0.0 |
| College or Associate's Degree | 0 (0.0%) | 0.0 |
| Bachelor's Degree | 0 (0.0%) | 0.0 |
| Graduate Degree | 0 (0.0%) | 0.0 |
| Total | 0 (0.0%) | 0.0 |
Fertility by Education by Marriage Status in Peach Lake
| Educational Attainment | Married | Unmarried |
| Less than High School | 0 (0.0%) | 0 (0.0%) |
| High School Diploma | 0 (0.0%) | 0 (0.0%) |
| College or Associate's Degree | 0 (0.0%) | 0 (0.0%) |
| Bachelor's Degree | 0 (0.0%) | 0 (0.0%) |
| Graduate Degree | 0 (0.0%) | 0 (0.0%) |
| Total | 0 (0.0%) | 0 (0.0%) |
Employment Characteristics in Peach Lake
Employment by Class of Employer in Peach Lake
Among the 726 employed individuals in Peach Lake, private company employees (422 | 58.1%), not-for-profit organizations (124 | 17.1%), and self-employed (not incorporated) (80 | 11.0%) make up the most common classes of employment.
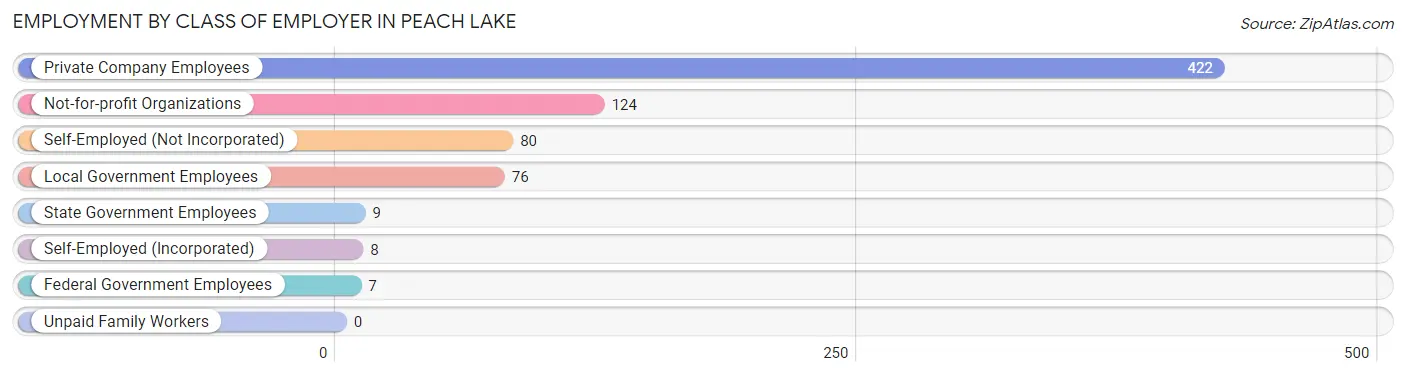
| Employer Class | # Employees | % Employees |
| Private Company Employees | 422 | 58.1% |
| Self-Employed (Incorporated) | 8 | 1.1% |
| Self-Employed (Not Incorporated) | 80 | 11.0% |
| Not-for-profit Organizations | 124 | 17.1% |
| Local Government Employees | 76 | 10.5% |
| State Government Employees | 9 | 1.2% |
| Federal Government Employees | 7 | 1.0% |
| Unpaid Family Workers | 0 | 0.0% |
| Total | 726 | 100.0% |
Employment Status by Age in Peach Lake
According to the labor force statistics for Peach Lake, out of the total population over 16 years of age (1,130), 71.4% or 807 individuals are in the labor force, with 6.8% or 55 of them unemployed. The age group with the highest labor force participation rate is 25 to 29 years, with 100.0% or 32 individuals in the labor force. Within the labor force, the 55 to 59 years age range has the highest percentage of unemployed individuals, with 18.8% or 27 of them being unemployed.
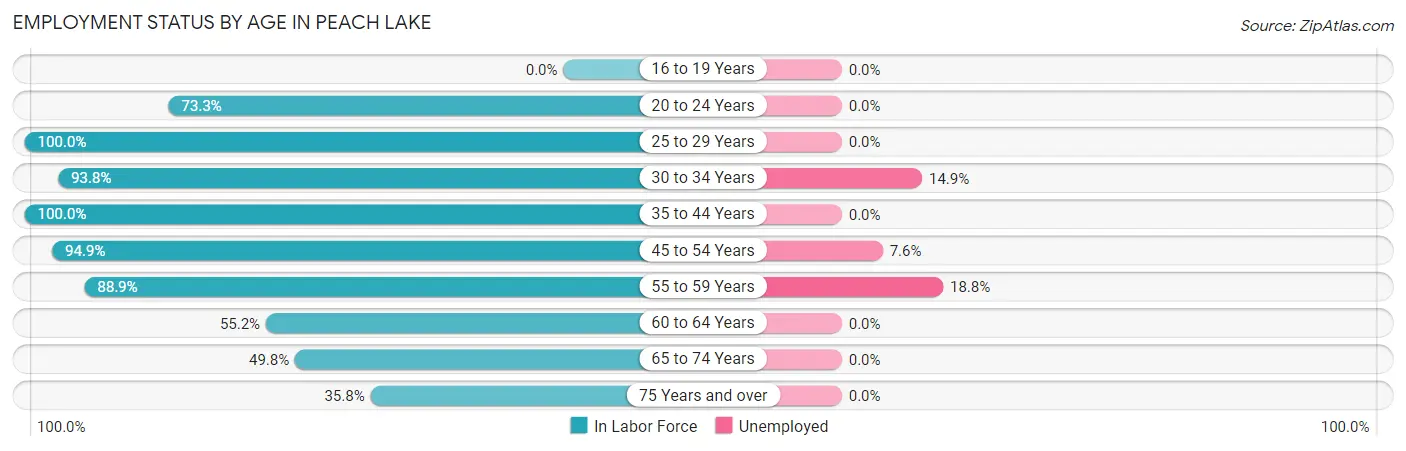
| Age Bracket | In Labor Force | Unemployed |
| 16 to 19 Years | 0 (0.0%) | 0 (0.0%) |
| 20 to 24 Years | 63 (73.3%) | 0 (0.0%) |
| 25 to 29 Years | 32 (100.0%) | 0 (0.0%) |
| 30 to 34 Years | 121 (93.8%) | 18 (14.9%) |
| 35 to 44 Years | 91 (100.0%) | 0 (0.0%) |
| 45 to 54 Years | 131 (94.9%) | 10 (7.6%) |
| 55 to 59 Years | 144 (88.9%) | 27 (18.8%) |
| 60 to 64 Years | 85 (55.2%) | 0 (0.0%) |
| 65 to 74 Years | 102 (49.8%) | 0 (0.0%) |
| 75 Years and over | 38 (35.8%) | 0 (0.0%) |
| Total | 807 (71.4%) | 55 (6.8%) |
Employment Status by Educational Attainment in Peach Lake
According to labor force statistics for Peach Lake, 85.6% of individuals (604) out of the total population between 25 and 64 years of age (706) are in the labor force, with 9.1% or 55 of them being unemployed. The group with the highest labor force participation rate are those with the educational attainment of less than high school, with 100.0% or 21 individuals in the labor force. Within the labor force, individuals with bachelor's degree or higher education have the highest percentage of unemployment, with 13.7% or 55 of them being unemployed.
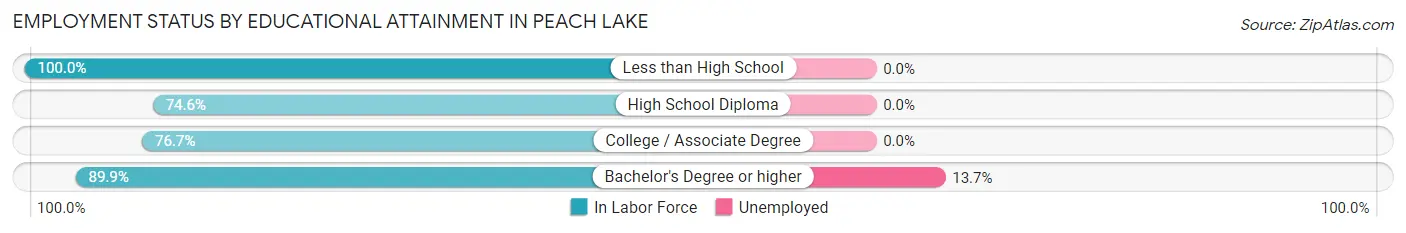
| Educational Attainment | In Labor Force | Unemployed |
| Less than High School | 21 (100.0%) | 0 (0.0%) |
| High School Diploma | 44 (74.6%) | 0 (0.0%) |
| College / Associate Degree | 138 (76.7%) | 0 (0.0%) |
| Bachelor's Degree or higher | 401 (89.9%) | 61 (13.7%) |
| Total | 604 (85.6%) | 64 (9.1%) |
Employment Occupations by Sex in Peach Lake
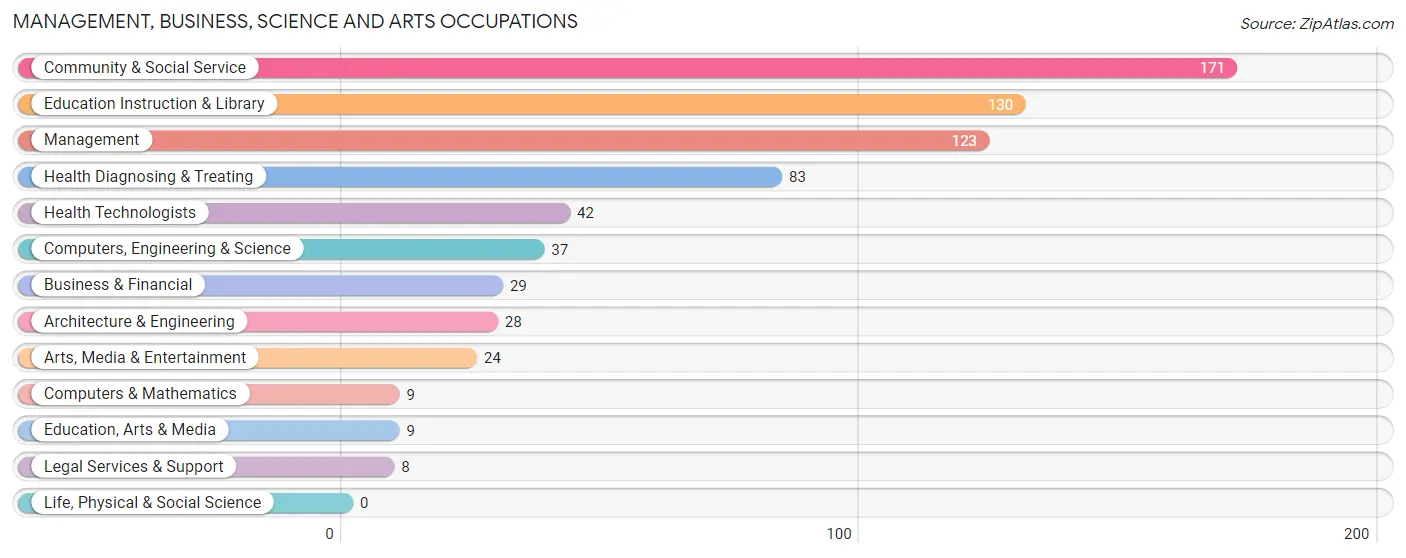
Management, Business, Science and Arts Occupations
The most common Management, Business, Science and Arts occupations in Peach Lake are Community & Social Service (171 | 22.7%), Education Instruction & Library (130 | 17.3%), Management (123 | 16.4%), Health Diagnosing & Treating (83 | 11.0%), and Health Technologists (42 | 5.6%).
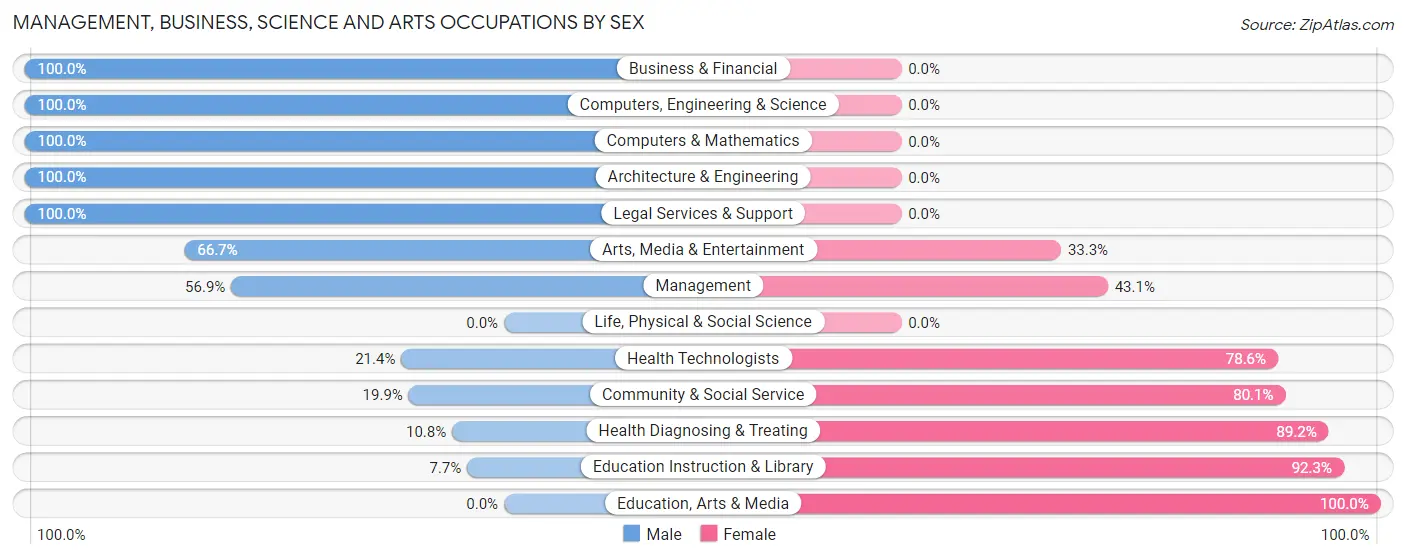
Management, Business, Science and Arts Occupations by Sex
Within the Management, Business, Science and Arts occupations in Peach Lake, the most male-oriented occupations are Business & Financial (100.0%), Computers, Engineering & Science (100.0%), and Computers & Mathematics (100.0%), while the most female-oriented occupations are Education, Arts & Media (100.0%), Education Instruction & Library (92.3%), and Health Diagnosing & Treating (89.2%).
| Occupation | Male | Female |
| Management | 70 (56.9%) | 53 (43.1%) |
| Business & Financial | 29 (100.0%) | 0 (0.0%) |
| Computers, Engineering & Science | 37 (100.0%) | 0 (0.0%) |
| Computers & Mathematics | 9 (100.0%) | 0 (0.0%) |
| Architecture & Engineering | 28 (100.0%) | 0 (0.0%) |
| Life, Physical & Social Science | 0 (0.0%) | 0 (0.0%) |
| Community & Social Service | 34 (19.9%) | 137 (80.1%) |
| Education, Arts & Media | 0 (0.0%) | 9 (100.0%) |
| Legal Services & Support | 8 (100.0%) | 0 (0.0%) |
| Education Instruction & Library | 10 (7.7%) | 120 (92.3%) |
| Arts, Media & Entertainment | 16 (66.7%) | 8 (33.3%) |
| Health Diagnosing & Treating | 9 (10.8%) | 74 (89.2%) |
| Health Technologists | 9 (21.4%) | 33 (78.6%) |
| Total (Category) | 179 (40.4%) | 264 (59.6%) |
| Total (Overall) | 378 (50.3%) | 374 (49.7%) |
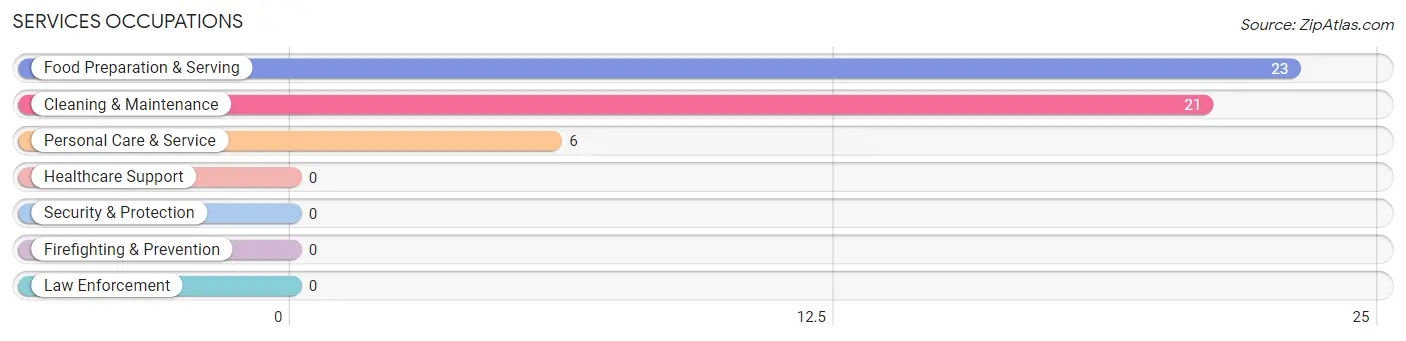
Services Occupations
The most common Services occupations in Peach Lake are Food Preparation & Serving (23 | 3.1%), Cleaning & Maintenance (21 | 2.8%), and Personal Care & Service (6 | 0.8%).
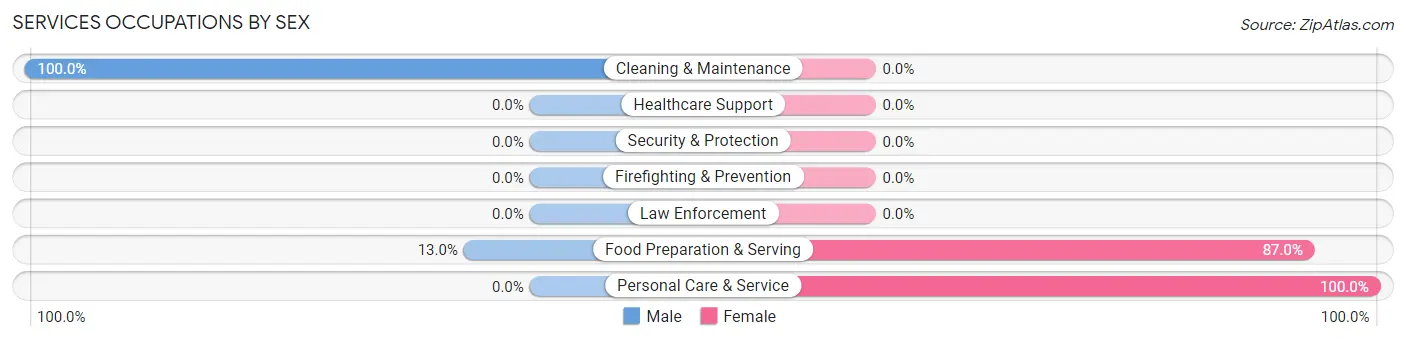
Services Occupations by Sex
Within the Services occupations in Peach Lake, the most male-oriented occupations are Cleaning & Maintenance (100.0%), and Food Preparation & Serving (13.0%), while the most female-oriented occupations are Personal Care & Service (100.0%), and Food Preparation & Serving (87.0%).
| Occupation | Male | Female |
| Healthcare Support | 0 (0.0%) | 0 (0.0%) |
| Security & Protection | 0 (0.0%) | 0 (0.0%) |
| Firefighting & Prevention | 0 (0.0%) | 0 (0.0%) |
| Law Enforcement | 0 (0.0%) | 0 (0.0%) |
| Food Preparation & Serving | 3 (13.0%) | 20 (87.0%) |
| Cleaning & Maintenance | 21 (100.0%) | 0 (0.0%) |
| Personal Care & Service | 0 (0.0%) | 6 (100.0%) |
| Total (Category) | 24 (48.0%) | 26 (52.0%) |
| Total (Overall) | 378 (50.3%) | 374 (49.7%) |
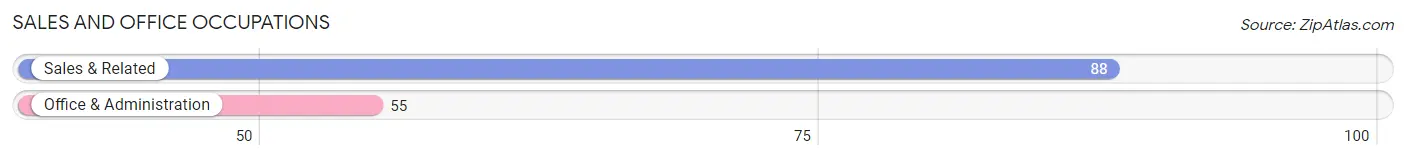
Sales and Office Occupations
The most common Sales and Office occupations in Peach Lake are Sales & Related (88 | 11.7%), and Office & Administration (55 | 7.3%).
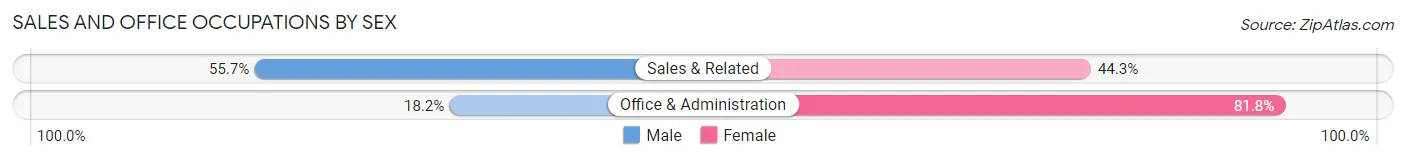
Sales and Office Occupations by Sex
| Occupation | Male | Female |
| Sales & Related | 49 (55.7%) | 39 (44.3%) |
| Office & Administration | 10 (18.2%) | 45 (81.8%) |
| Total (Category) | 59 (41.3%) | 84 (58.7%) |
| Total (Overall) | 378 (50.3%) | 374 (49.7%) |
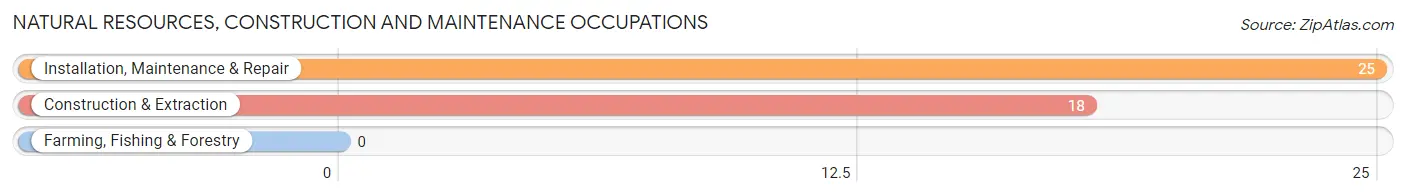
Natural Resources, Construction and Maintenance Occupations
The most common Natural Resources, Construction and Maintenance occupations in Peach Lake are Installation, Maintenance & Repair (25 | 3.3%), and Construction & Extraction (18 | 2.4%).
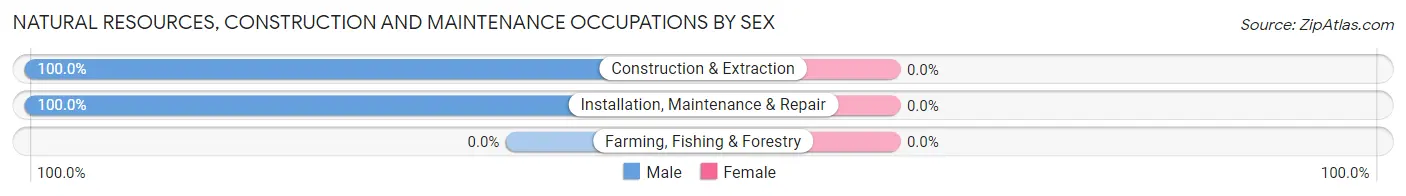
Natural Resources, Construction and Maintenance Occupations by Sex
| Occupation | Male | Female |
| Farming, Fishing & Forestry | 0 (0.0%) | 0 (0.0%) |
| Construction & Extraction | 18 (100.0%) | 0 (0.0%) |
| Installation, Maintenance & Repair | 25 (100.0%) | 0 (0.0%) |
| Total (Category) | 43 (100.0%) | 0 (0.0%) |
| Total (Overall) | 378 (50.3%) | 374 (49.7%) |
Production, Transportation and Moving Occupations
The most common Production, Transportation and Moving occupations in Peach Lake are Transportation (55 | 7.3%), Production (9 | 1.2%), and Material Moving (9 | 1.2%).
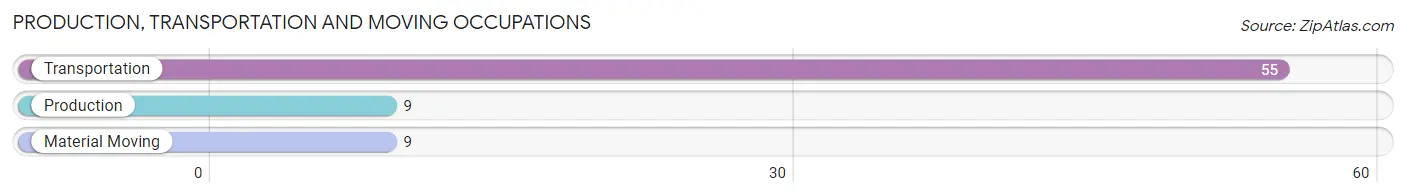
Production, Transportation and Moving Occupations by Sex
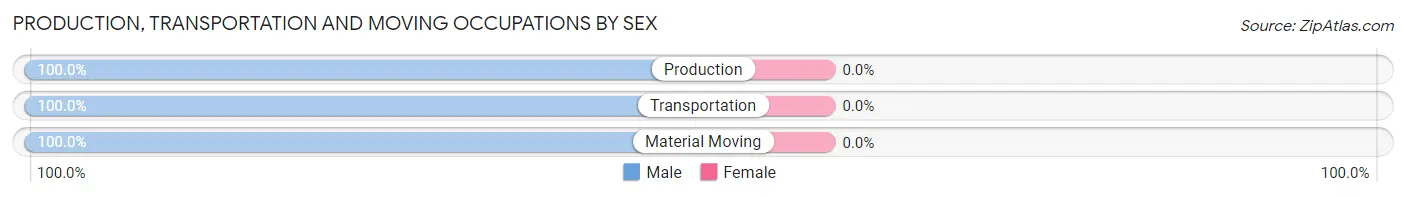
| Occupation | Male | Female |
| Production | 9 (100.0%) | 0 (0.0%) |
| Transportation | 55 (100.0%) | 0 (0.0%) |
| Material Moving | 9 (100.0%) | 0 (0.0%) |
| Total (Category) | 73 (100.0%) | 0 (0.0%) |
| Total (Overall) | 378 (50.3%) | 374 (49.7%) |
Employment Industries by Sex in Peach Lake
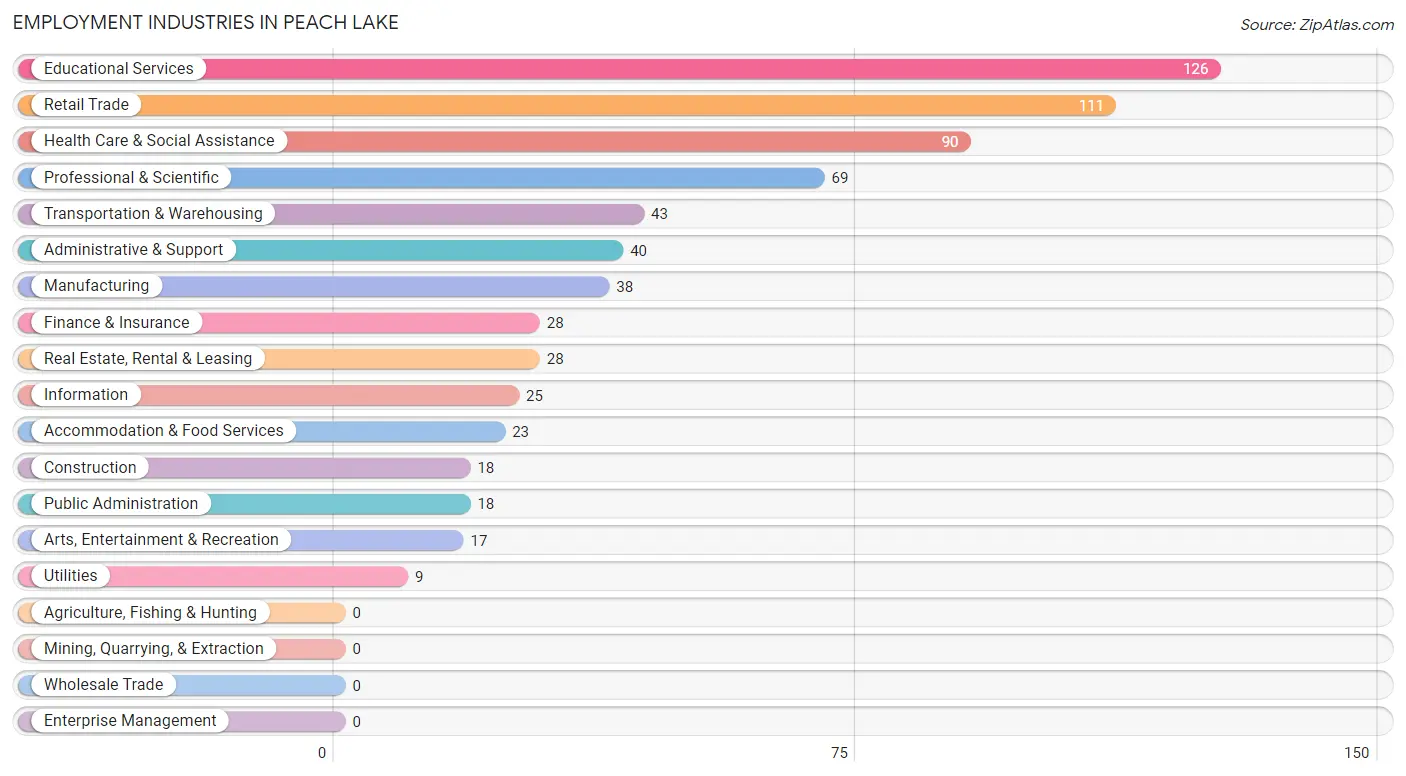
Employment Industries in Peach Lake
The major employment industries in Peach Lake include Educational Services (126 | 16.8%), Retail Trade (111 | 14.8%), Health Care & Social Assistance (90 | 12.0%), Professional & Scientific (69 | 9.2%), and Transportation & Warehousing (43 | 5.7%).
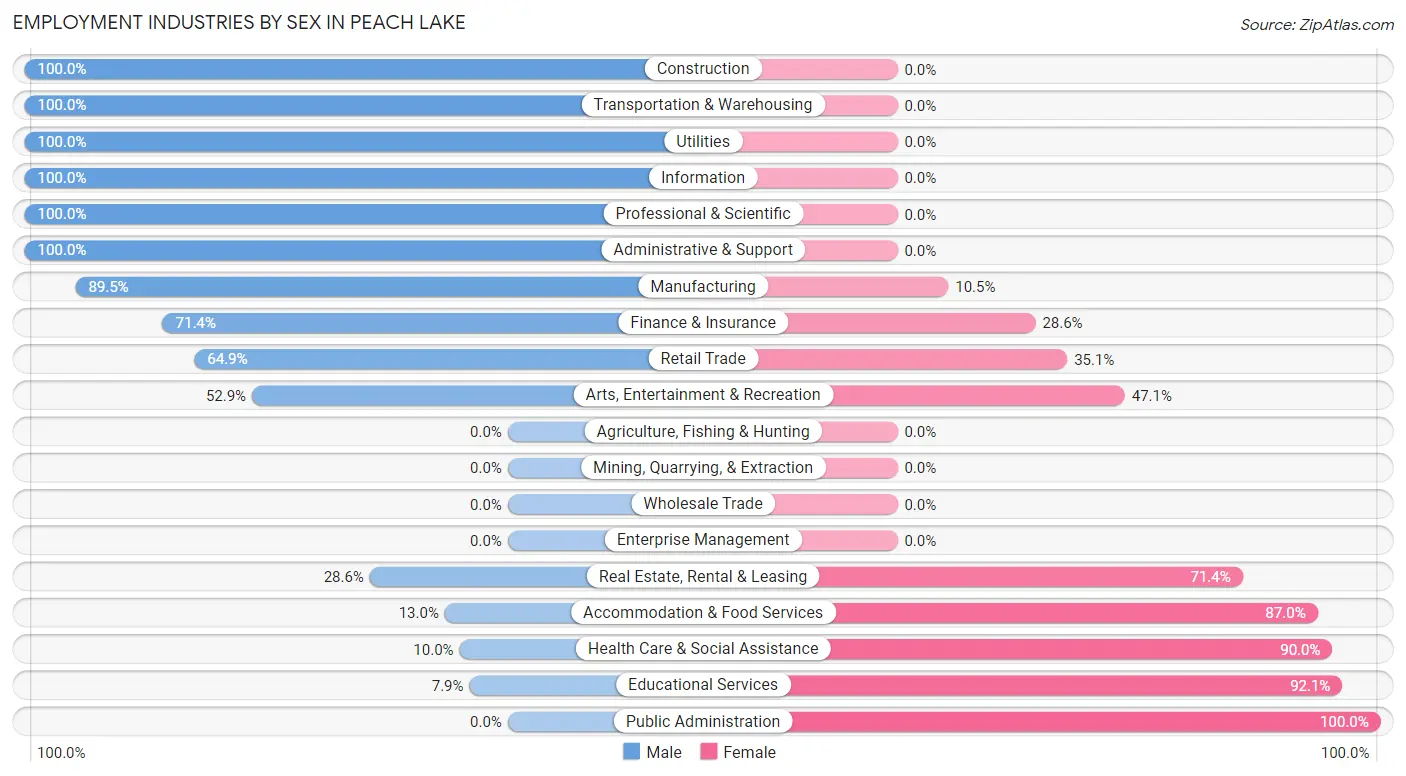
Employment Industries by Sex in Peach Lake
The Peach Lake industries that see more men than women are Construction (100.0%), Transportation & Warehousing (100.0%), and Utilities (100.0%), whereas the industries that tend to have a higher number of women are Public Administration (100.0%), Educational Services (92.1%), and Health Care & Social Assistance (90.0%).
| Industry | Male | Female |
| Agriculture, Fishing & Hunting | 0 (0.0%) | 0 (0.0%) |
| Mining, Quarrying, & Extraction | 0 (0.0%) | 0 (0.0%) |
| Construction | 18 (100.0%) | 0 (0.0%) |
| Manufacturing | 34 (89.5%) | 4 (10.5%) |
| Wholesale Trade | 0 (0.0%) | 0 (0.0%) |
| Retail Trade | 72 (64.9%) | 39 (35.1%) |
| Transportation & Warehousing | 43 (100.0%) | 0 (0.0%) |
| Utilities | 9 (100.0%) | 0 (0.0%) |
| Information | 25 (100.0%) | 0 (0.0%) |
| Finance & Insurance | 20 (71.4%) | 8 (28.6%) |
| Real Estate, Rental & Leasing | 8 (28.6%) | 20 (71.4%) |
| Professional & Scientific | 69 (100.0%) | 0 (0.0%) |
| Enterprise Management | 0 (0.0%) | 0 (0.0%) |
| Administrative & Support | 40 (100.0%) | 0 (0.0%) |
| Educational Services | 10 (7.9%) | 116 (92.1%) |
| Health Care & Social Assistance | 9 (10.0%) | 81 (90.0%) |
| Arts, Entertainment & Recreation | 9 (52.9%) | 8 (47.1%) |
| Accommodation & Food Services | 3 (13.0%) | 20 (87.0%) |
| Public Administration | 0 (0.0%) | 18 (100.0%) |
| Total | 378 (50.3%) | 374 (49.7%) |
Education in Peach Lake
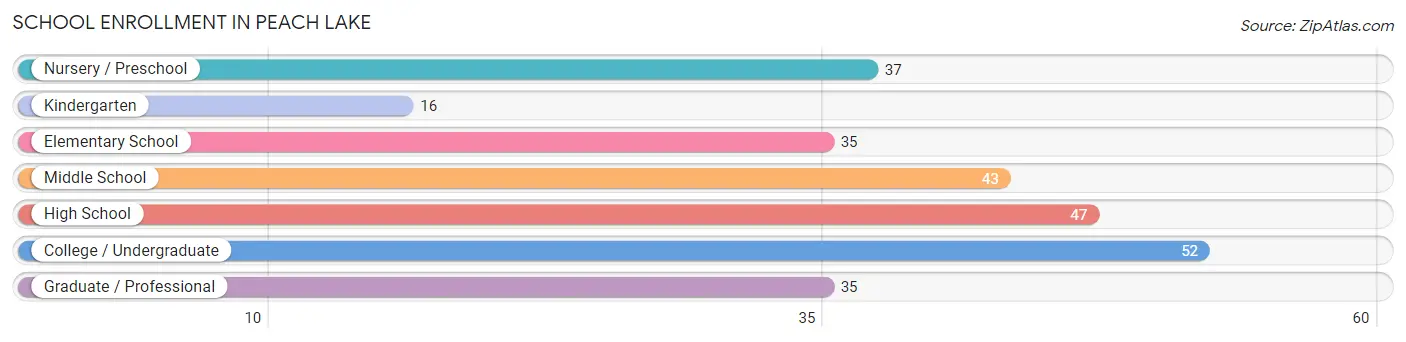
School Enrollment in Peach Lake
The most common levels of schooling among the 265 students in Peach Lake are college / undergraduate (52 | 19.6%), high school (47 | 17.7%), and middle school (43 | 16.2%).
| School Level | # Students | % Students |
| Nursery / Preschool | 37 | 14.0% |
| Kindergarten | 16 | 6.0% |
| Elementary School | 35 | 13.2% |
| Middle School | 43 | 16.2% |
| High School | 47 | 17.7% |
| College / Undergraduate | 52 | 19.6% |
| Graduate / Professional | 35 | 13.2% |
| Total | 265 | 100.0% |
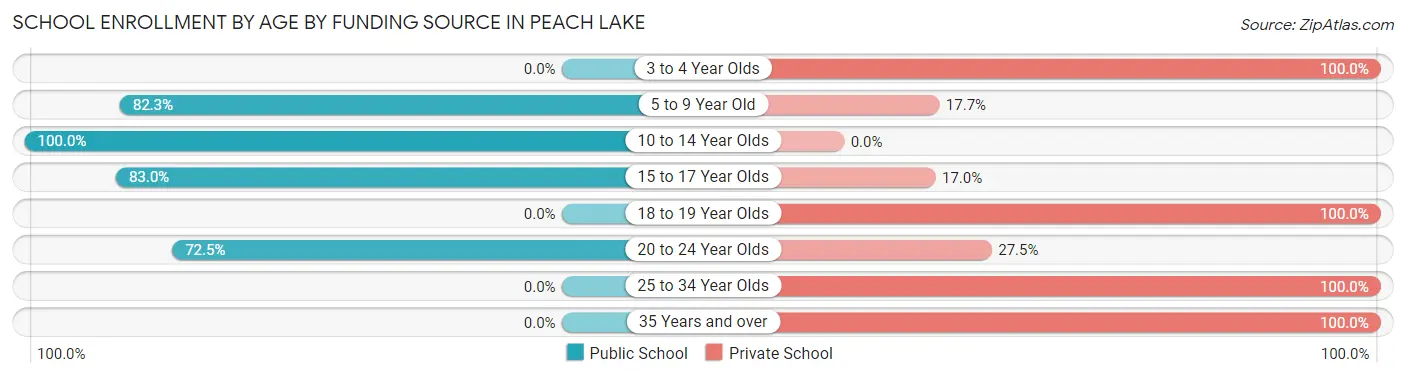
School Enrollment by Age by Funding Source in Peach Lake
Out of a total of 265 students who are enrolled in schools in Peach Lake, 103 (38.9%) attend a private institution, while the remaining 162 (61.1%) are enrolled in public schools. The age group of 3 to 4 year olds has the highest likelihood of being enrolled in private schools, with 26 (100.0% in the age bracket) enrolled. Conversely, the age group of 10 to 14 year olds has the lowest likelihood of being enrolled in a private school, with 43 (100.0% in the age bracket) attending a public institution.
| Age Bracket | Public School | Private School |
| 3 to 4 Year Olds | 0 (0.0%) | 26 (100.0%) |
| 5 to 9 Year Old | 51 (82.3%) | 11 (17.7%) |
| 10 to 14 Year Olds | 43 (100.0%) | 0 (0.0%) |
| 15 to 17 Year Olds | 39 (83.0%) | 8 (17.0%) |
| 18 to 19 Year Olds | 0 (0.0%) | 12 (100.0%) |
| 20 to 24 Year Olds | 29 (72.5%) | 11 (27.5%) |
| 25 to 34 Year Olds | 0 (0.0%) | 10 (100.0%) |
| 35 Years and over | 0 (0.0%) | 25 (100.0%) |
| Total | 162 (61.1%) | 103 (38.9%) |
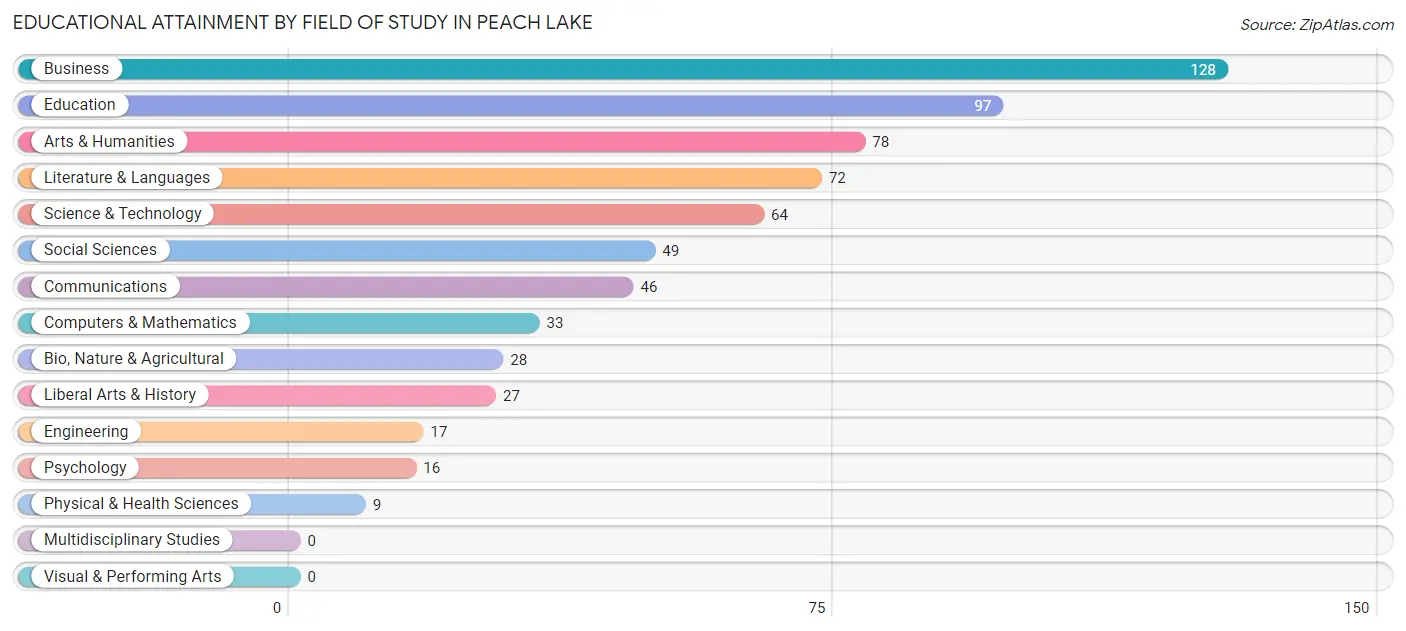
Educational Attainment by Field of Study in Peach Lake
Business (128 | 19.3%), education (97 | 14.6%), arts & humanities (78 | 11.7%), literature & languages (72 | 10.8%), and science & technology (64 | 9.6%) are the most common fields of study among 664 individuals in Peach Lake who have obtained a bachelor's degree or higher.
| Field of Study | # Graduates | % Graduates |
| Computers & Mathematics | 33 | 5.0% |
| Bio, Nature & Agricultural | 28 | 4.2% |
| Physical & Health Sciences | 9 | 1.4% |
| Psychology | 16 | 2.4% |
| Social Sciences | 49 | 7.4% |
| Engineering | 17 | 2.6% |
| Multidisciplinary Studies | 0 | 0.0% |
| Science & Technology | 64 | 9.6% |
| Business | 128 | 19.3% |
| Education | 97 | 14.6% |
| Literature & Languages | 72 | 10.8% |
| Liberal Arts & History | 27 | 4.1% |
| Visual & Performing Arts | 0 | 0.0% |
| Communications | 46 | 6.9% |
| Arts & Humanities | 78 | 11.7% |
| Total | 664 | 100.0% |
Transportation & Commute in Peach Lake
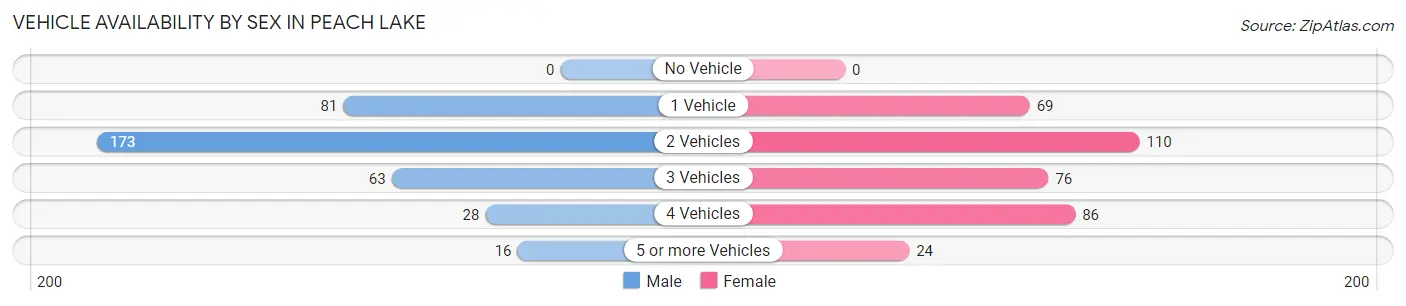
Vehicle Availability by Sex in Peach Lake
The most prevalent vehicle ownership categories in Peach Lake are males with 2 vehicles (173, accounting for 47.9%) and females with 2 vehicles (110, making up 47.4%).
| Vehicles Available | Male | Female |
| No Vehicle | 0 (0.0%) | 0 (0.0%) |
| 1 Vehicle | 81 (22.4%) | 69 (18.9%) |
| 2 Vehicles | 173 (47.9%) | 110 (30.1%) |
| 3 Vehicles | 63 (17.4%) | 76 (20.8%) |
| 4 Vehicles | 28 (7.8%) | 86 (23.6%) |
| 5 or more Vehicles | 16 (4.4%) | 24 (6.6%) |
| Total | 361 (100.0%) | 365 (100.0%) |
Commute Time in Peach Lake
The most frequently occuring commute durations in Peach Lake are 60 to 89 minutes (101 commuters, 15.9%), 10 to 14 minutes (100 commuters, 15.7%), and 15 to 19 minutes (90 commuters, 14.1%).
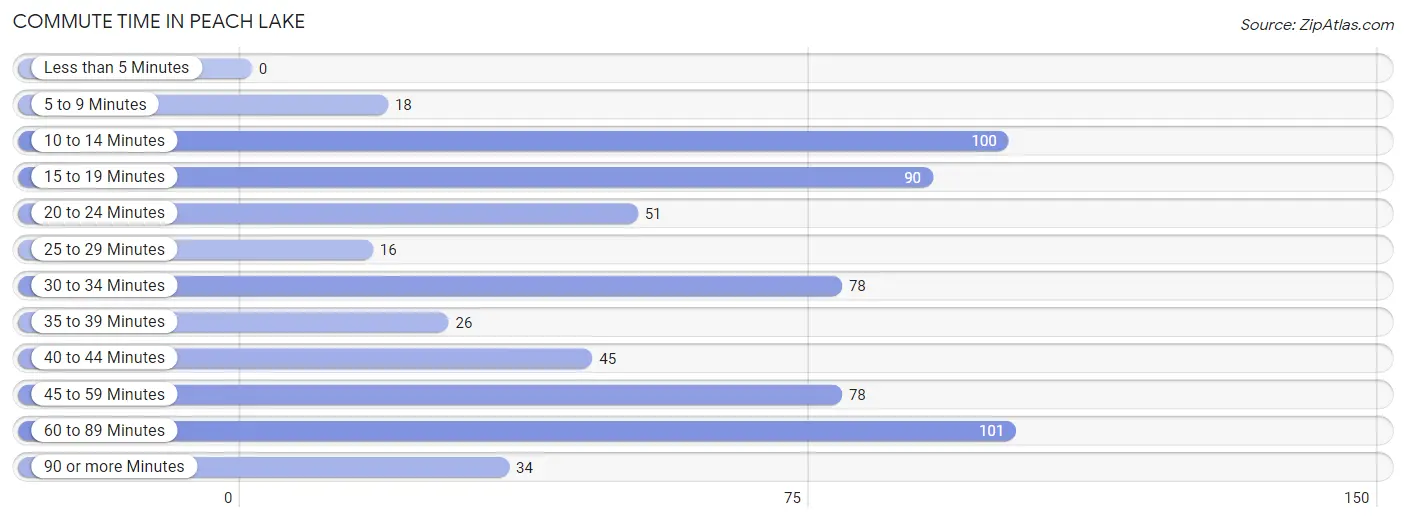
| Commute Time | # Commuters | % Commuters |
| Less than 5 Minutes | 0 | 0.0% |
| 5 to 9 Minutes | 18 | 2.8% |
| 10 to 14 Minutes | 100 | 15.7% |
| 15 to 19 Minutes | 90 | 14.1% |
| 20 to 24 Minutes | 51 | 8.0% |
| 25 to 29 Minutes | 16 | 2.5% |
| 30 to 34 Minutes | 78 | 12.2% |
| 35 to 39 Minutes | 26 | 4.1% |
| 40 to 44 Minutes | 45 | 7.1% |
| 45 to 59 Minutes | 78 | 12.2% |
| 60 to 89 Minutes | 101 | 15.9% |
| 90 or more Minutes | 34 | 5.3% |
Commute Time by Sex in Peach Lake
The most common commute times in Peach Lake are 60 to 89 minutes (75 commuters, 24.4%) for males and 10 to 14 minutes (84 commuters, 25.5%) for females.
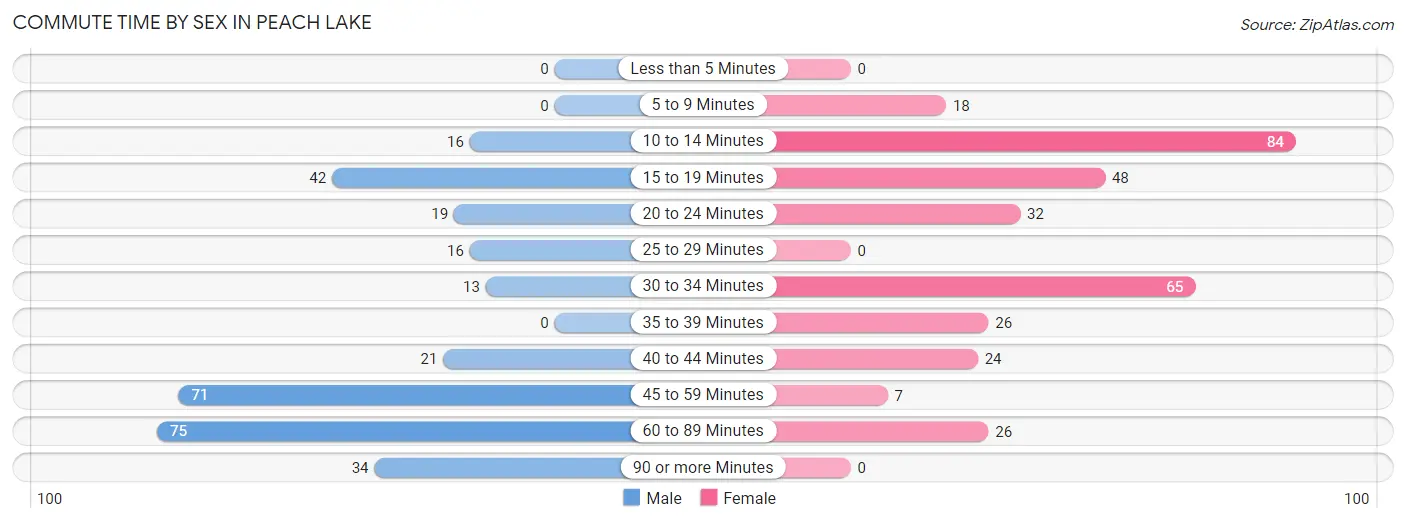
| Commute Time | Male | Female |
| Less than 5 Minutes | 0 (0.0%) | 0 (0.0%) |
| 5 to 9 Minutes | 0 (0.0%) | 18 (5.4%) |
| 10 to 14 Minutes | 16 (5.2%) | 84 (25.5%) |
| 15 to 19 Minutes | 42 (13.7%) | 48 (14.5%) |
| 20 to 24 Minutes | 19 (6.2%) | 32 (9.7%) |
| 25 to 29 Minutes | 16 (5.2%) | 0 (0.0%) |
| 30 to 34 Minutes | 13 (4.2%) | 65 (19.7%) |
| 35 to 39 Minutes | 0 (0.0%) | 26 (7.9%) |
| 40 to 44 Minutes | 21 (6.8%) | 24 (7.3%) |
| 45 to 59 Minutes | 71 (23.1%) | 7 (2.1%) |
| 60 to 89 Minutes | 75 (24.4%) | 26 (7.9%) |
| 90 or more Minutes | 34 (11.1%) | 0 (0.0%) |
Time of Departure to Work by Sex in Peach Lake
The most frequent times of departure to work in Peach Lake are 7:00 AM to 7:29 AM (107, 34.8%) for males and 7:00 AM to 7:29 AM (125, 37.9%) for females.
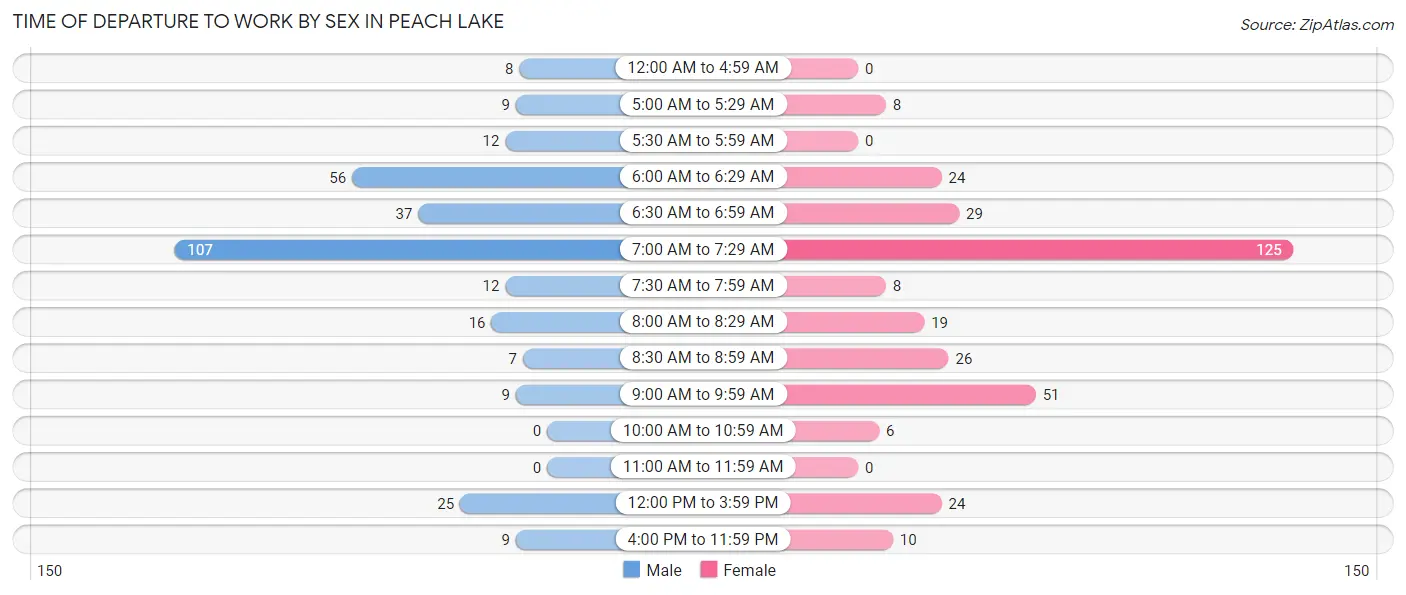
| Time of Departure | Male | Female |
| 12:00 AM to 4:59 AM | 8 (2.6%) | 0 (0.0%) |
| 5:00 AM to 5:29 AM | 9 (2.9%) | 8 (2.4%) |
| 5:30 AM to 5:59 AM | 12 (3.9%) | 0 (0.0%) |
| 6:00 AM to 6:29 AM | 56 (18.2%) | 24 (7.3%) |
| 6:30 AM to 6:59 AM | 37 (12.0%) | 29 (8.8%) |
| 7:00 AM to 7:29 AM | 107 (34.8%) | 125 (37.9%) |
| 7:30 AM to 7:59 AM | 12 (3.9%) | 8 (2.4%) |
| 8:00 AM to 8:29 AM | 16 (5.2%) | 19 (5.8%) |
| 8:30 AM to 8:59 AM | 7 (2.3%) | 26 (7.9%) |
| 9:00 AM to 9:59 AM | 9 (2.9%) | 51 (15.4%) |
| 10:00 AM to 10:59 AM | 0 (0.0%) | 6 (1.8%) |
| 11:00 AM to 11:59 AM | 0 (0.0%) | 0 (0.0%) |
| 12:00 PM to 3:59 PM | 25 (8.1%) | 24 (7.3%) |
| 4:00 PM to 11:59 PM | 9 (2.9%) | 10 (3.0%) |
| Total | 307 (100.0%) | 330 (100.0%) |
Housing Occupancy in Peach Lake
Occupancy by Ownership in Peach Lake
Of the total 573 dwellings in Peach Lake, owner-occupied units account for 480 (83.8%), while renter-occupied units make up 93 (16.2%).
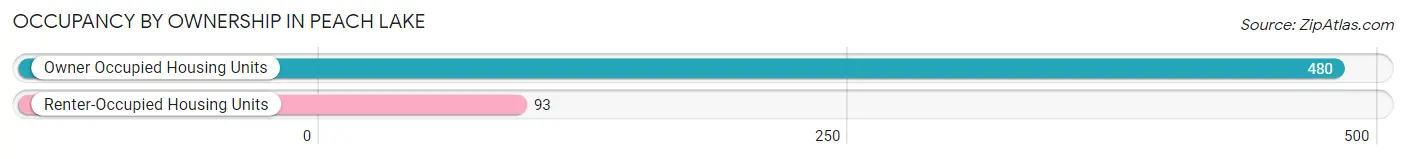
| Occupancy | # Housing Units | % Housing Units |
| Owner Occupied Housing Units | 480 | 83.8% |
| Renter-Occupied Housing Units | 93 | 16.2% |
| Total Occupied Housing Units | 573 | 100.0% |
Occupancy by Household Size in Peach Lake
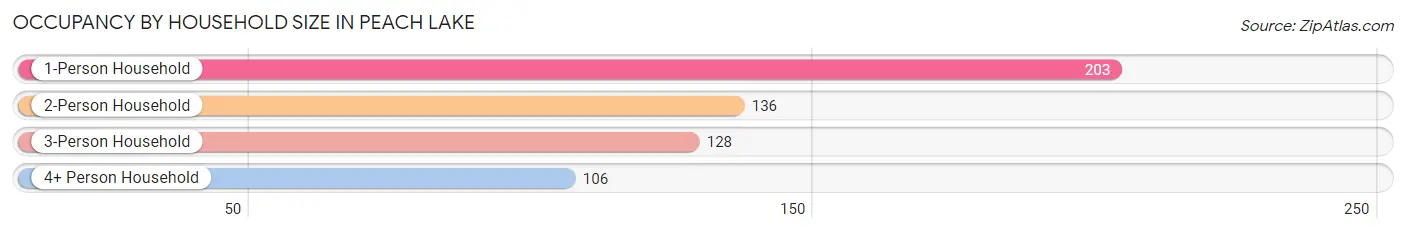
| Household Size | # Housing Units | % Housing Units |
| 1-Person Household | 203 | 35.4% |
| 2-Person Household | 136 | 23.7% |
| 3-Person Household | 128 | 22.3% |
| 4+ Person Household | 106 | 18.5% |
| Total Housing Units | 573 | 100.0% |
Occupancy by Ownership by Household Size in Peach Lake
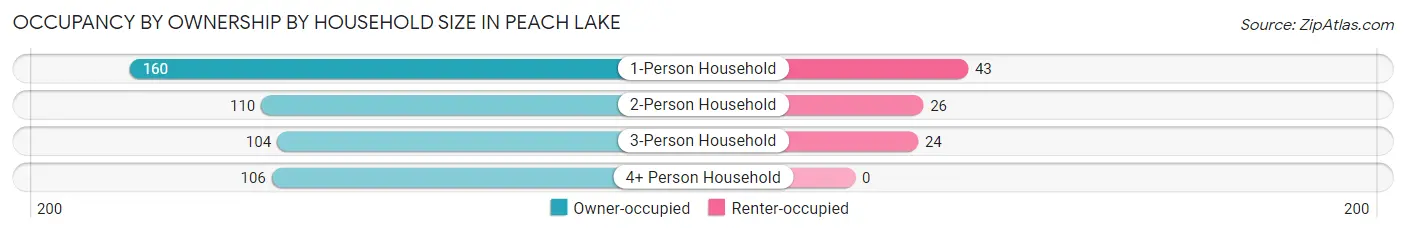
| Household Size | Owner-occupied | Renter-occupied |
| 1-Person Household | 160 (78.8%) | 43 (21.2%) |
| 2-Person Household | 110 (80.9%) | 26 (19.1%) |
| 3-Person Household | 104 (81.2%) | 24 (18.8%) |
| 4+ Person Household | 106 (100.0%) | 0 (0.0%) |
| Total Housing Units | 480 (83.8%) | 93 (16.2%) |
Occupancy by Educational Attainment in Peach Lake
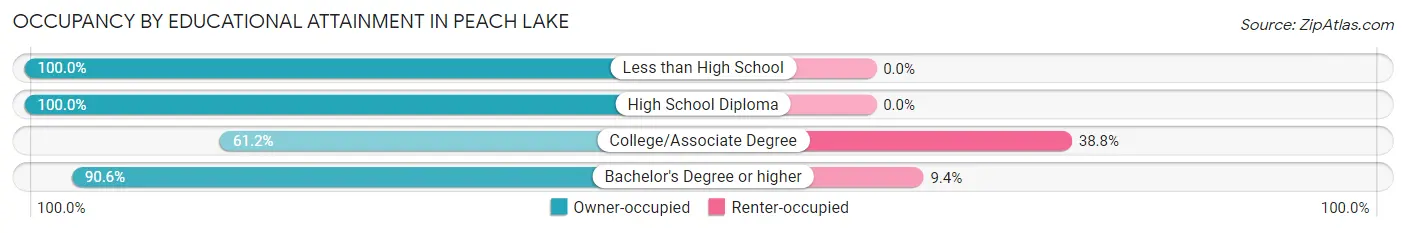
| Household Size | Owner-occupied | Renter-occupied |
| Less than High School | 9 (100.0%) | 0 (0.0%) |
| High School Diploma | 33 (100.0%) | 0 (0.0%) |
| College/Associate Degree | 90 (61.2%) | 57 (38.8%) |
| Bachelor's Degree or higher | 348 (90.6%) | 36 (9.4%) |
Occupancy by Age of Householder in Peach Lake
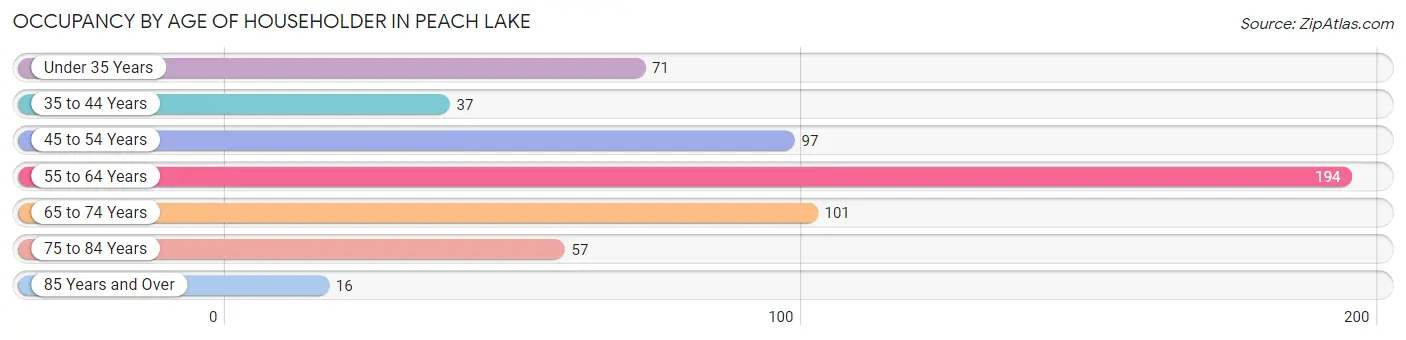
| Age Bracket | # Households | % Households |
| Under 35 Years | 71 | 12.4% |
| 35 to 44 Years | 37 | 6.5% |
| 45 to 54 Years | 97 | 16.9% |
| 55 to 64 Years | 194 | 33.9% |
| 65 to 74 Years | 101 | 17.6% |
| 75 to 84 Years | 57 | 10.0% |
| 85 Years and Over | 16 | 2.8% |
| Total | 573 | 100.0% |
Housing Finances in Peach Lake
Median Income by Occupancy in Peach Lake
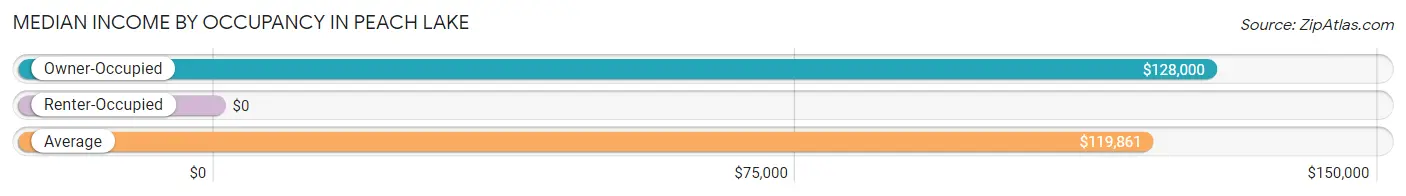
| Occupancy Type | # Households | Median Income |
| Owner-Occupied | 480 (83.8%) | $128,000 |
| Renter-Occupied | 93 (16.2%) | $0 |
| Average | 573 (100.0%) | $119,861 |
Occupancy by Householder Income Bracket in Peach Lake
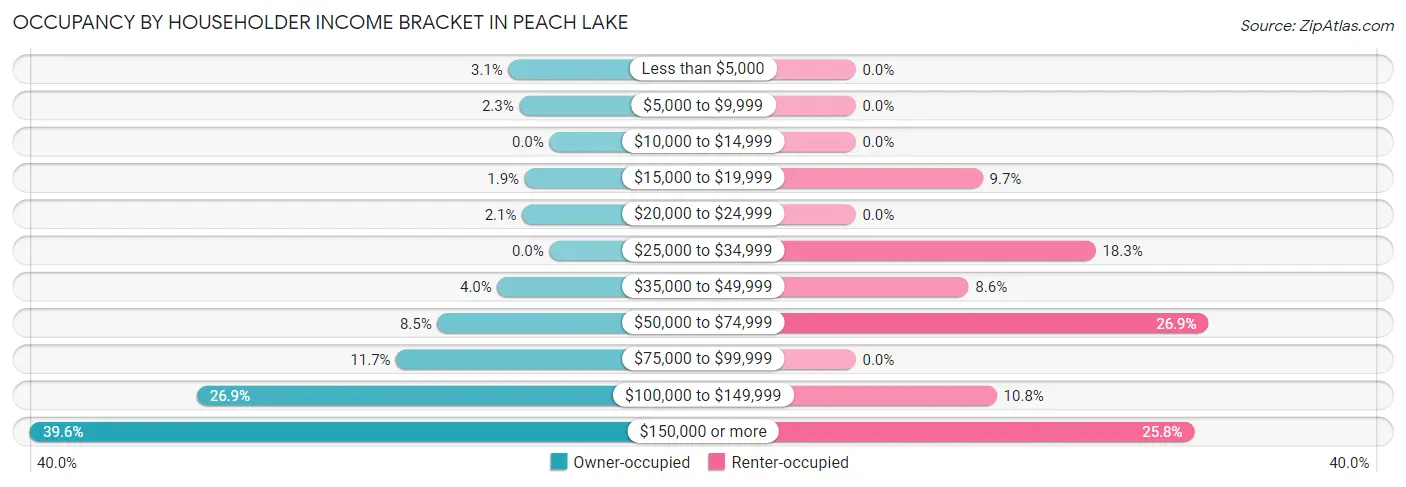
| Income Bracket | Owner-occupied | Renter-occupied |
| Less than $5,000 | 15 (3.1%) | 0 (0.0%) |
| $5,000 to $9,999 | 11 (2.3%) | 0 (0.0%) |
| $10,000 to $14,999 | 0 (0.0%) | 0 (0.0%) |
| $15,000 to $19,999 | 9 (1.9%) | 9 (9.7%) |
| $20,000 to $24,999 | 10 (2.1%) | 0 (0.0%) |
| $25,000 to $34,999 | 0 (0.0%) | 17 (18.3%) |
| $35,000 to $49,999 | 19 (4.0%) | 8 (8.6%) |
| $50,000 to $74,999 | 41 (8.5%) | 25 (26.9%) |
| $75,000 to $99,999 | 56 (11.7%) | 0 (0.0%) |
| $100,000 to $149,999 | 129 (26.9%) | 10 (10.7%) |
| $150,000 or more | 190 (39.6%) | 24 (25.8%) |
| Total | 480 (100.0%) | 93 (100.0%) |
Monthly Housing Cost Tiers in Peach Lake
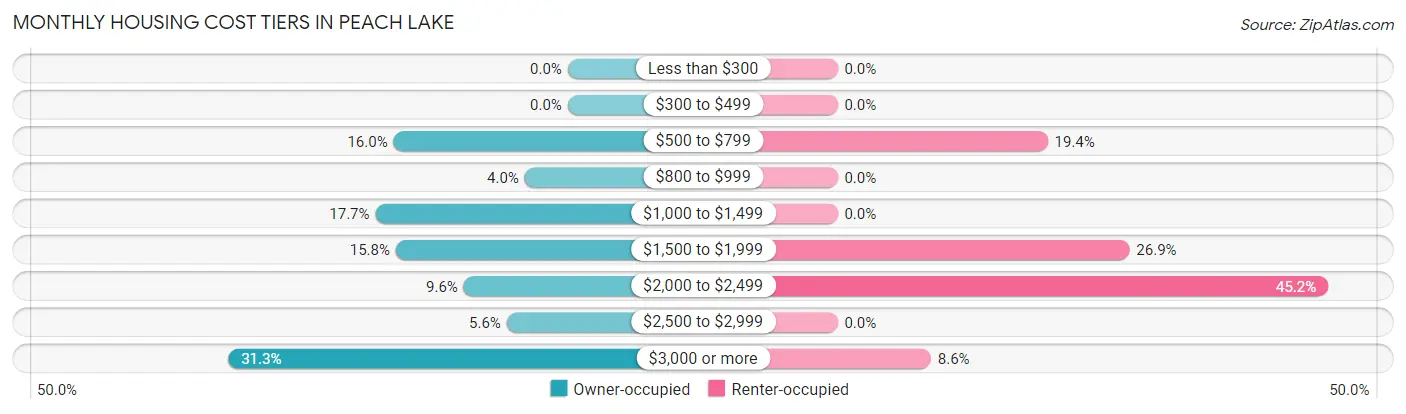
| Monthly Cost | Owner-occupied | Renter-occupied |
| Less than $300 | 0 (0.0%) | 0 (0.0%) |
| $300 to $499 | 0 (0.0%) | 0 (0.0%) |
| $500 to $799 | 77 (16.0%) | 18 (19.4%) |
| $800 to $999 | 19 (4.0%) | 0 (0.0%) |
| $1,000 to $1,499 | 85 (17.7%) | 0 (0.0%) |
| $1,500 to $1,999 | 76 (15.8%) | 25 (26.9%) |
| $2,000 to $2,499 | 46 (9.6%) | 42 (45.2%) |
| $2,500 to $2,999 | 27 (5.6%) | 0 (0.0%) |
| $3,000 or more | 150 (31.2%) | 8 (8.6%) |
| Total | 480 (100.0%) | 93 (100.0%) |
Physical Housing Characteristics in Peach Lake
Housing Structures in Peach Lake
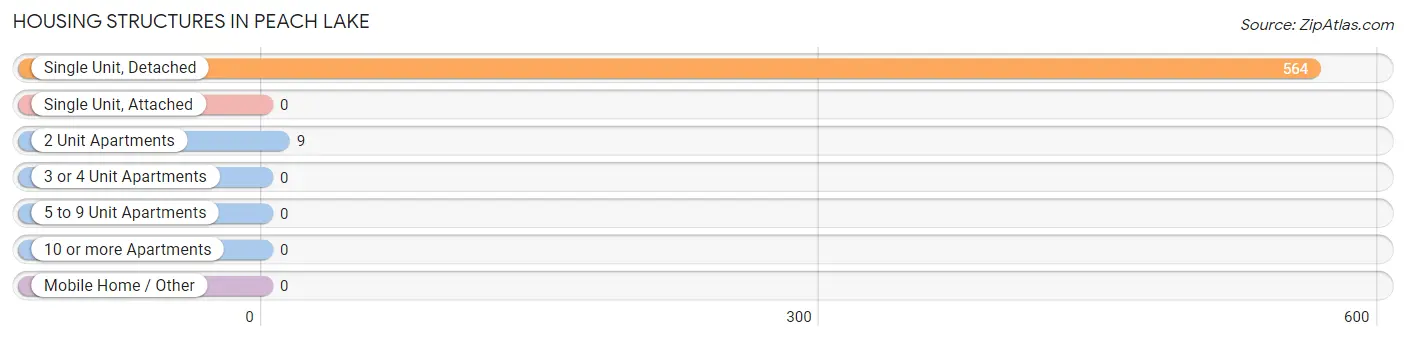
| Structure Type | # Housing Units | % Housing Units |
| Single Unit, Detached | 564 | 98.4% |
| Single Unit, Attached | 0 | 0.0% |
| 2 Unit Apartments | 9 | 1.6% |
| 3 or 4 Unit Apartments | 0 | 0.0% |
| 5 to 9 Unit Apartments | 0 | 0.0% |
| 10 or more Apartments | 0 | 0.0% |
| Mobile Home / Other | 0 | 0.0% |
| Total | 573 | 100.0% |
Housing Structures by Occupancy in Peach Lake
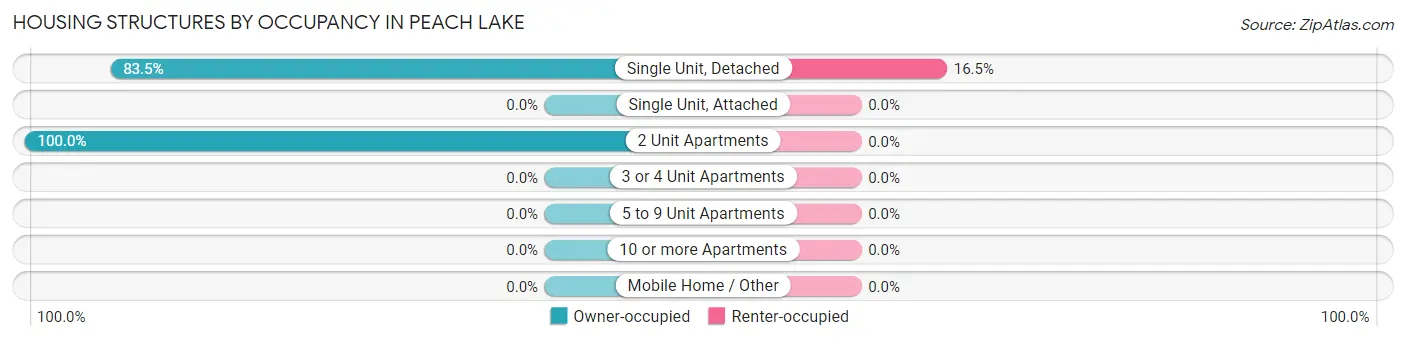
| Structure Type | Owner-occupied | Renter-occupied |
| Single Unit, Detached | 471 (83.5%) | 93 (16.5%) |
| Single Unit, Attached | 0 (0.0%) | 0 (0.0%) |
| 2 Unit Apartments | 9 (100.0%) | 0 (0.0%) |
| 3 or 4 Unit Apartments | 0 (0.0%) | 0 (0.0%) |
| 5 to 9 Unit Apartments | 0 (0.0%) | 0 (0.0%) |
| 10 or more Apartments | 0 (0.0%) | 0 (0.0%) |
| Mobile Home / Other | 0 (0.0%) | 0 (0.0%) |
| Total | 480 (83.8%) | 93 (16.2%) |
Housing Structures by Number of Rooms in Peach Lake
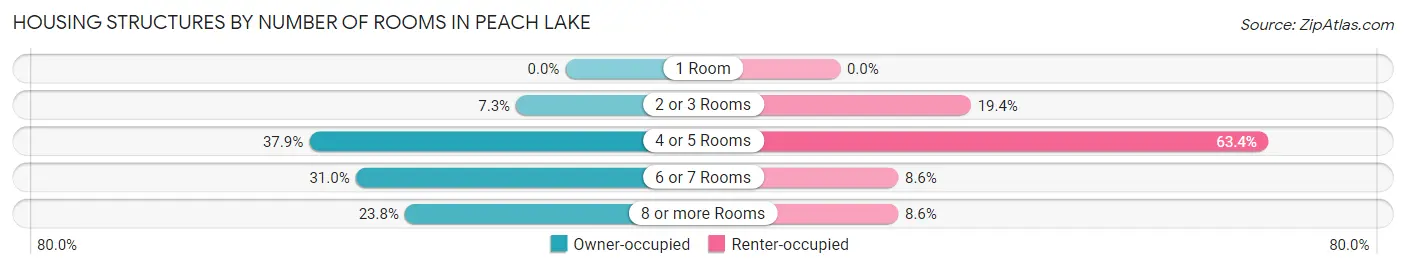
| Number of Rooms | Owner-occupied | Renter-occupied |
| 1 Room | 0 (0.0%) | 0 (0.0%) |
| 2 or 3 Rooms | 35 (7.3%) | 18 (19.4%) |
| 4 or 5 Rooms | 182 (37.9%) | 59 (63.4%) |
| 6 or 7 Rooms | 149 (31.0%) | 8 (8.6%) |
| 8 or more Rooms | 114 (23.7%) | 8 (8.6%) |
| Total | 480 (100.0%) | 93 (100.0%) |
Housing Structure by Heating Type in Peach Lake
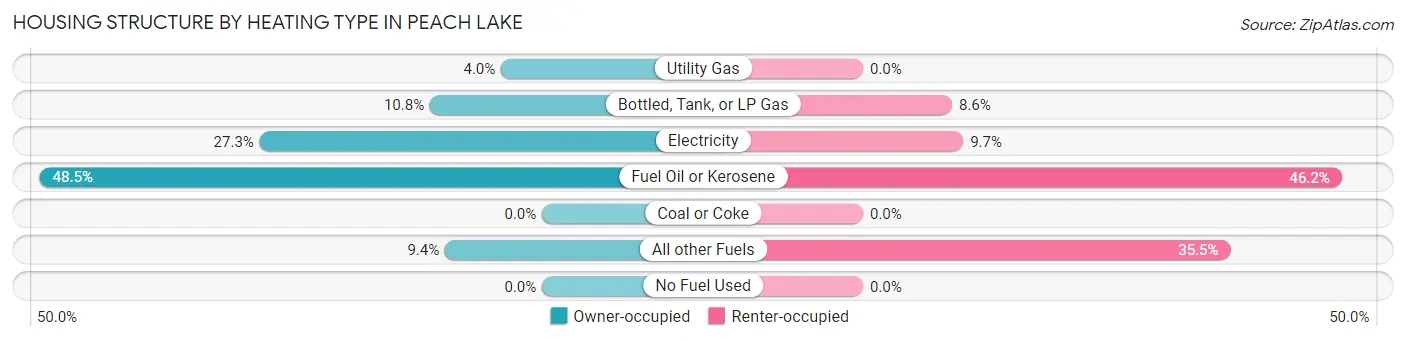
| Heating Type | Owner-occupied | Renter-occupied |
| Utility Gas | 19 (4.0%) | 0 (0.0%) |
| Bottled, Tank, or LP Gas | 52 (10.8%) | 8 (8.6%) |
| Electricity | 131 (27.3%) | 9 (9.7%) |
| Fuel Oil or Kerosene | 233 (48.5%) | 43 (46.2%) |
| Coal or Coke | 0 (0.0%) | 0 (0.0%) |
| All other Fuels | 45 (9.4%) | 33 (35.5%) |
| No Fuel Used | 0 (0.0%) | 0 (0.0%) |
| Total | 480 (100.0%) | 93 (100.0%) |
Household Vehicle Usage in Peach Lake
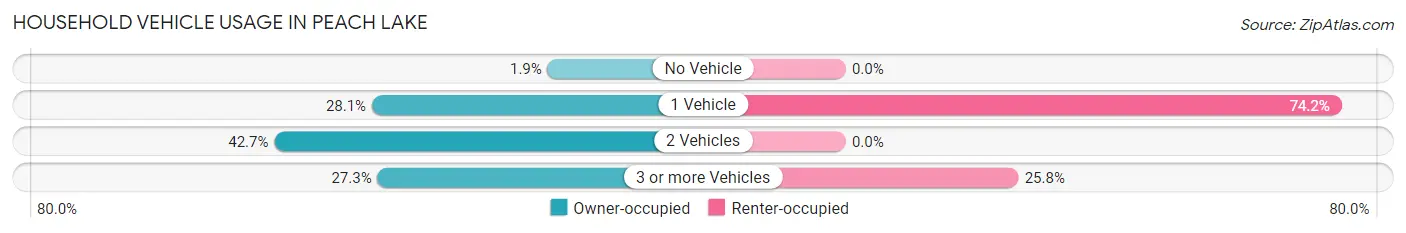
| Vehicles per Household | Owner-occupied | Renter-occupied |
| No Vehicle | 9 (1.9%) | 0 (0.0%) |
| 1 Vehicle | 135 (28.1%) | 69 (74.2%) |
| 2 Vehicles | 205 (42.7%) | 0 (0.0%) |
| 3 or more Vehicles | 131 (27.3%) | 24 (25.8%) |
| Total | 480 (100.0%) | 93 (100.0%) |
Real Estate & Mortgages in Peach Lake
Real Estate and Mortgage Overview in Peach Lake
| Characteristic | Without Mortgage | With Mortgage |
| Housing Units | 178 | 302 |
| Median Property Value | $363,300 | $445,600 |
| Median Household Income | $79,464 | $156 |
| Monthly Housing Costs | $1,035 | $150 |
| Real Estate Taxes | $5,980 | $8 |
Property Value by Mortgage Status in Peach Lake
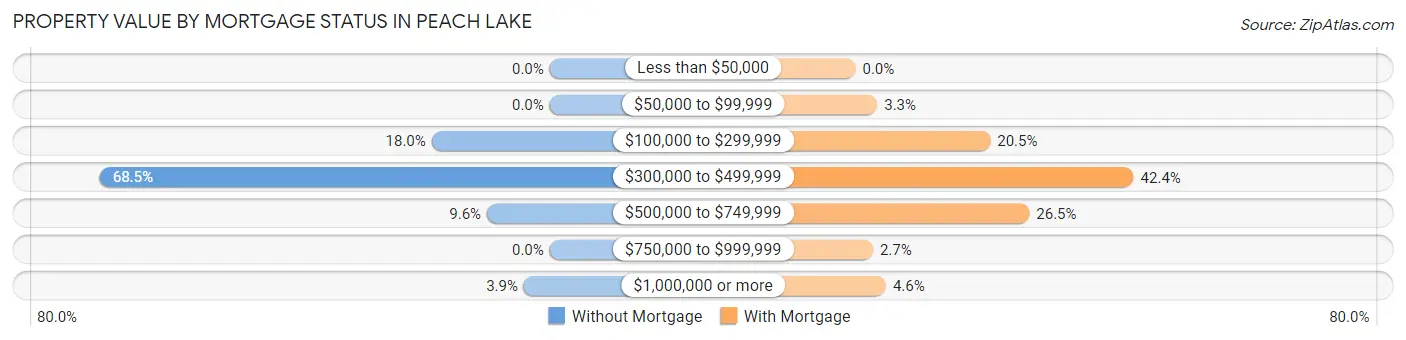
| Property Value | Without Mortgage | With Mortgage |
| Less than $50,000 | 0 (0.0%) | 0 (0.0%) |
| $50,000 to $99,999 | 0 (0.0%) | 10 (3.3%) |
| $100,000 to $299,999 | 32 (18.0%) | 62 (20.5%) |
| $300,000 to $499,999 | 122 (68.5%) | 128 (42.4%) |
| $500,000 to $749,999 | 17 (9.6%) | 80 (26.5%) |
| $750,000 to $999,999 | 0 (0.0%) | 8 (2.6%) |
| $1,000,000 or more | 7 (3.9%) | 14 (4.6%) |
| Total | 178 (100.0%) | 302 (100.0%) |
Household Income by Mortgage Status in Peach Lake
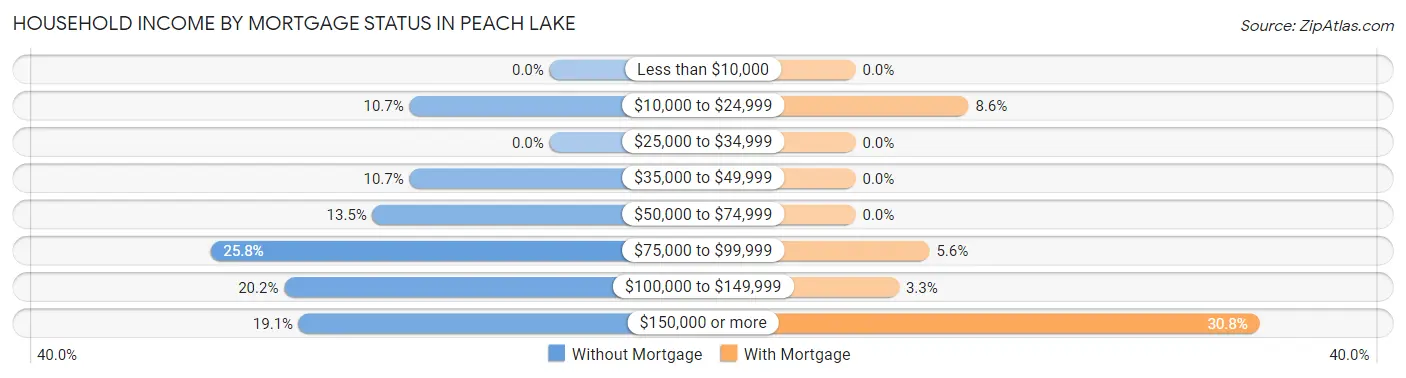
| Household Income | Without Mortgage | With Mortgage |
| Less than $10,000 | 0 (0.0%) | 0 (0.0%) |
| $10,000 to $24,999 | 19 (10.7%) | 26 (8.6%) |
| $25,000 to $34,999 | 0 (0.0%) | 0 (0.0%) |
| $35,000 to $49,999 | 19 (10.7%) | 0 (0.0%) |
| $50,000 to $74,999 | 24 (13.5%) | 0 (0.0%) |
| $75,000 to $99,999 | 46 (25.8%) | 17 (5.6%) |
| $100,000 to $149,999 | 36 (20.2%) | 10 (3.3%) |
| $150,000 or more | 34 (19.1%) | 93 (30.8%) |
| Total | 178 (100.0%) | 302 (100.0%) |
Property Value to Household Income Ratio in Peach Lake
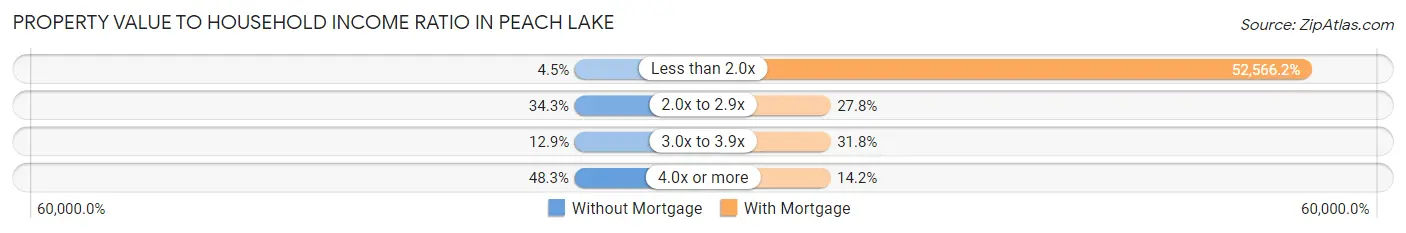
| Value-to-Income Ratio | Without Mortgage | With Mortgage |
| Less than 2.0x | 8 (4.5%) | 158,750 (52,566.2%) |
| 2.0x to 2.9x | 61 (34.3%) | 84 (27.8%) |
| 3.0x to 3.9x | 23 (12.9%) | 96 (31.8%) |
| 4.0x or more | 86 (48.3%) | 43 (14.2%) |
| Total | 178 (100.0%) | 302 (100.0%) |
Real Estate Taxes by Mortgage Status in Peach Lake
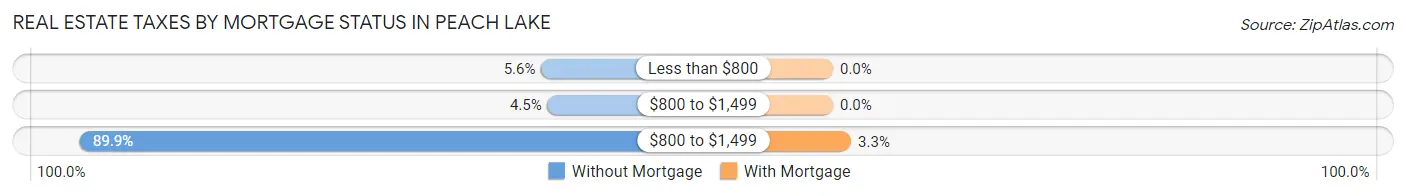
| Property Taxes | Without Mortgage | With Mortgage |
| Less than $800 | 10 (5.6%) | 0 (0.0%) |
| $800 to $1,499 | 8 (4.5%) | 0 (0.0%) |
| $800 to $1,499 | 160 (89.9%) | 10 (3.3%) |
| Total | 178 (100.0%) | 302 (100.0%) |
Health & Disability in Peach Lake
Health Insurance Coverage by Age in Peach Lake
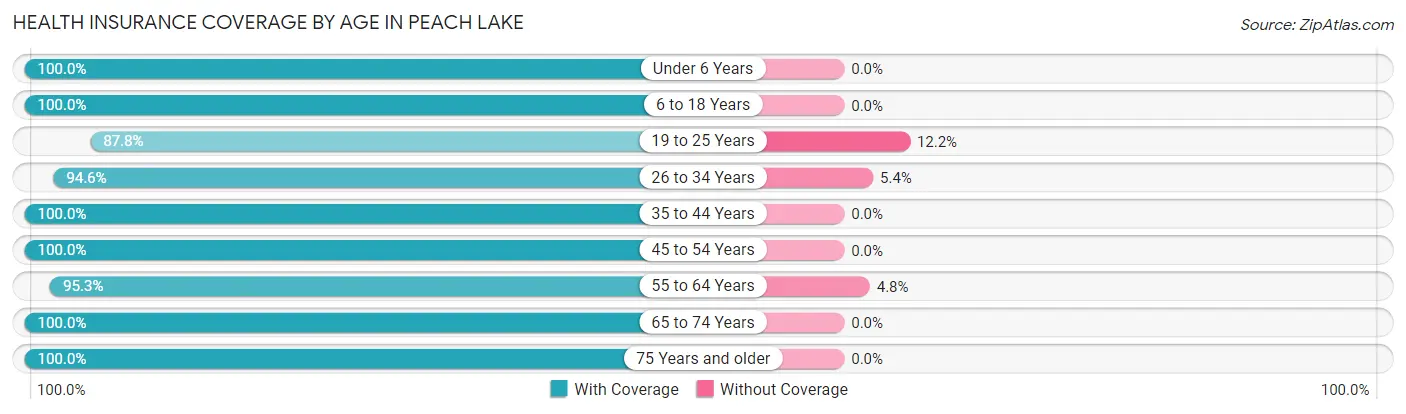
| Age Bracket | With Coverage | Without Coverage |
| Under 6 Years | 96 (100.0%) | 0 (0.0%) |
| 6 to 18 Years | 150 (100.0%) | 0 (0.0%) |
| 19 to 25 Years | 86 (87.8%) | 12 (12.2%) |
| 26 to 34 Years | 141 (94.6%) | 8 (5.4%) |
| 35 to 44 Years | 91 (100.0%) | 0 (0.0%) |
| 45 to 54 Years | 138 (100.0%) | 0 (0.0%) |
| 55 to 64 Years | 301 (95.3%) | 15 (4.8%) |
| 65 to 74 Years | 205 (100.0%) | 0 (0.0%) |
| 75 Years and older | 106 (100.0%) | 0 (0.0%) |
| Total | 1,314 (97.4%) | 35 (2.6%) |
Health Insurance Coverage by Citizenship Status in Peach Lake
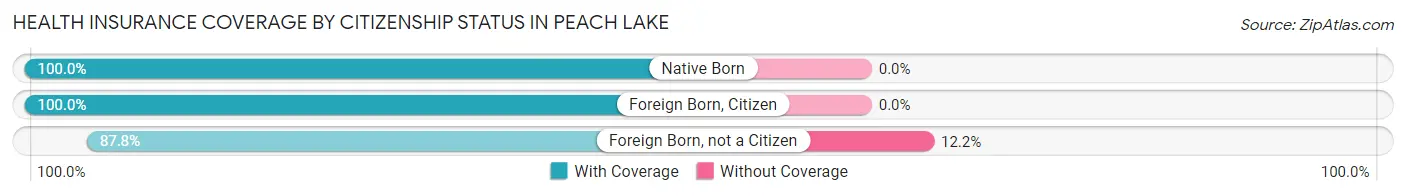
| Citizenship Status | With Coverage | Without Coverage |
| Native Born | 96 (100.0%) | 0 (0.0%) |
| Foreign Born, Citizen | 150 (100.0%) | 0 (0.0%) |
| Foreign Born, not a Citizen | 86 (87.8%) | 12 (12.2%) |
Health Insurance Coverage by Household Income in Peach Lake
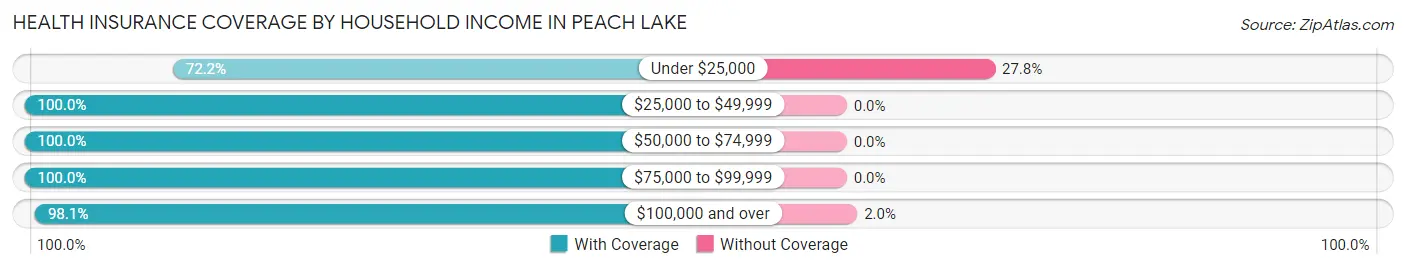
| Household Income | With Coverage | Without Coverage |
| Under $25,000 | 39 (72.2%) | 15 (27.8%) |
| $25,000 to $49,999 | 65 (100.0%) | 0 (0.0%) |
| $50,000 to $74,999 | 100 (100.0%) | 0 (0.0%) |
| $75,000 to $99,999 | 105 (100.0%) | 0 (0.0%) |
| $100,000 and over | 1,005 (98.1%) | 20 (1.9%) |
Public vs Private Health Insurance Coverage by Age in Peach Lake
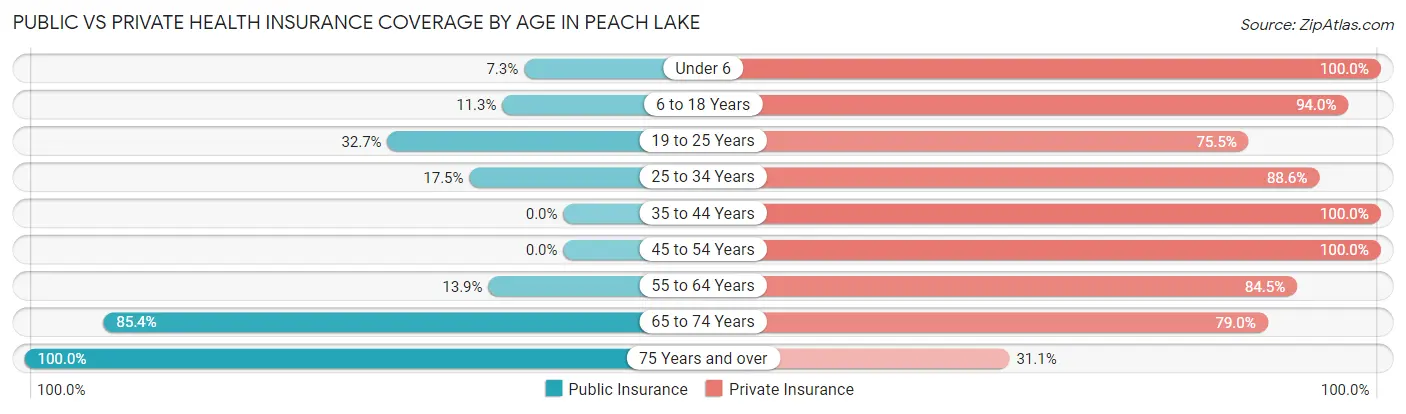
| Age Bracket | Public Insurance | Private Insurance |
| Under 6 | 7 (7.3%) | 96 (100.0%) |
| 6 to 18 Years | 17 (11.3%) | 141 (94.0%) |
| 19 to 25 Years | 32 (32.7%) | 74 (75.5%) |
| 25 to 34 Years | 26 (17.4%) | 132 (88.6%) |
| 35 to 44 Years | 0 (0.0%) | 91 (100.0%) |
| 45 to 54 Years | 0 (0.0%) | 138 (100.0%) |
| 55 to 64 Years | 44 (13.9%) | 267 (84.5%) |
| 65 to 74 Years | 175 (85.4%) | 162 (79.0%) |
| 75 Years and over | 106 (100.0%) | 33 (31.1%) |
| Total | 407 (30.2%) | 1,134 (84.1%) |
Disability Status by Sex by Age in Peach Lake
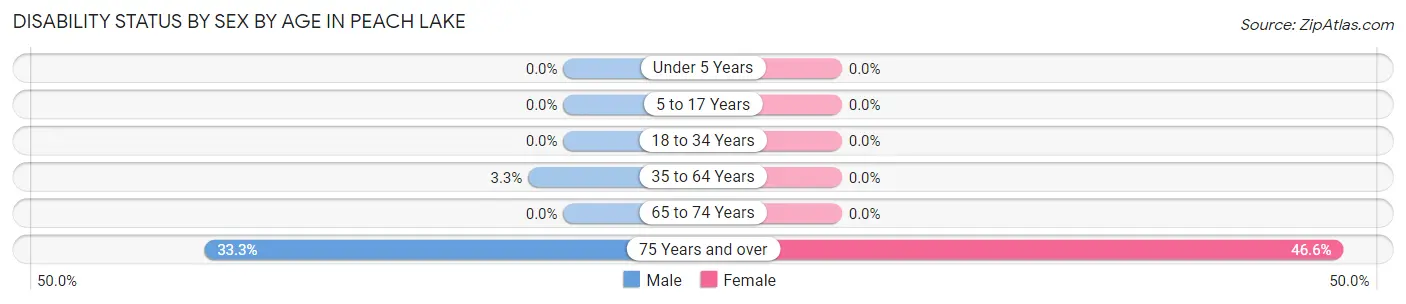
| Age Bracket | Male | Female |
| Under 5 Years | 0 (0.0%) | 0 (0.0%) |
| 5 to 17 Years | 0 (0.0%) | 0 (0.0%) |
| 18 to 34 Years | 0 (0.0%) | 0 (0.0%) |
| 35 to 64 Years | 10 (3.3%) | 0 (0.0%) |
| 65 to 74 Years | 0 (0.0%) | 0 (0.0%) |
| 75 Years and over | 16 (33.3%) | 27 (46.6%) |
Disability Class by Sex by Age in Peach Lake
Disability Class: Hearing Difficulty
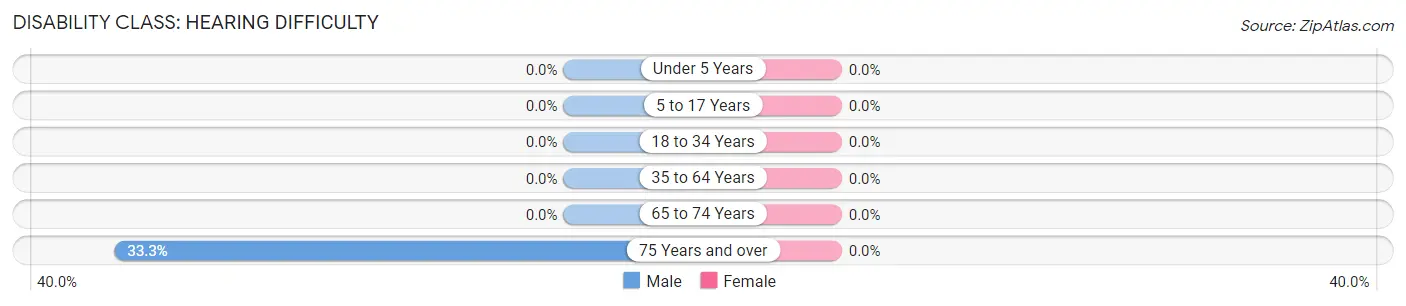
| Age Bracket | Male | Female |
| Under 5 Years | 0 (0.0%) | 0 (0.0%) |
| 5 to 17 Years | 0 (0.0%) | 0 (0.0%) |
| 18 to 34 Years | 0 (0.0%) | 0 (0.0%) |
| 35 to 64 Years | 0 (0.0%) | 0 (0.0%) |
| 65 to 74 Years | 0 (0.0%) | 0 (0.0%) |
| 75 Years and over | 16 (33.3%) | 0 (0.0%) |
Disability Class: Vision Difficulty
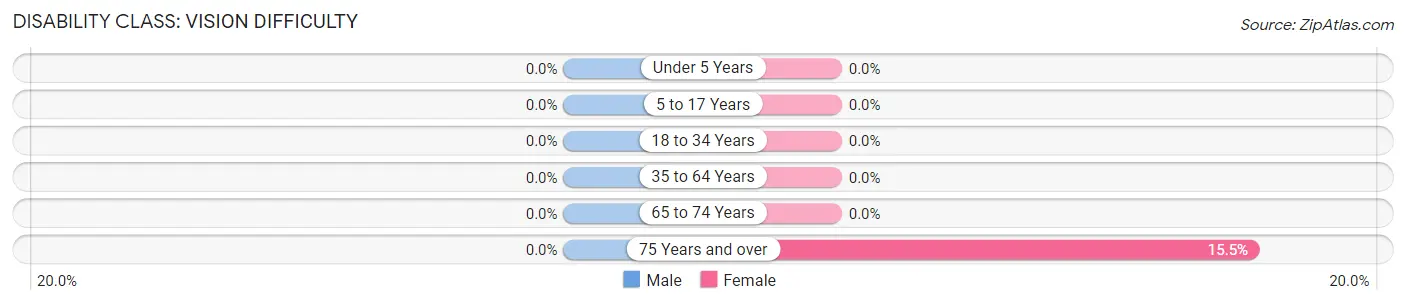
| Age Bracket | Male | Female |
| Under 5 Years | 0 (0.0%) | 0 (0.0%) |
| 5 to 17 Years | 0 (0.0%) | 0 (0.0%) |
| 18 to 34 Years | 0 (0.0%) | 0 (0.0%) |
| 35 to 64 Years | 0 (0.0%) | 0 (0.0%) |
| 65 to 74 Years | 0 (0.0%) | 0 (0.0%) |
| 75 Years and over | 0 (0.0%) | 9 (15.5%) |
Disability Class: Cognitive Difficulty

| Age Bracket | Male | Female |
| 5 to 17 Years | 0 (0.0%) | 0 (0.0%) |
| 18 to 34 Years | 0 (0.0%) | 0 (0.0%) |
| 35 to 64 Years | 10 (3.3%) | 0 (0.0%) |
| 65 to 74 Years | 0 (0.0%) | 0 (0.0%) |
| 75 Years and over | 0 (0.0%) | 8 (13.8%) |
Disability Class: Ambulatory Difficulty
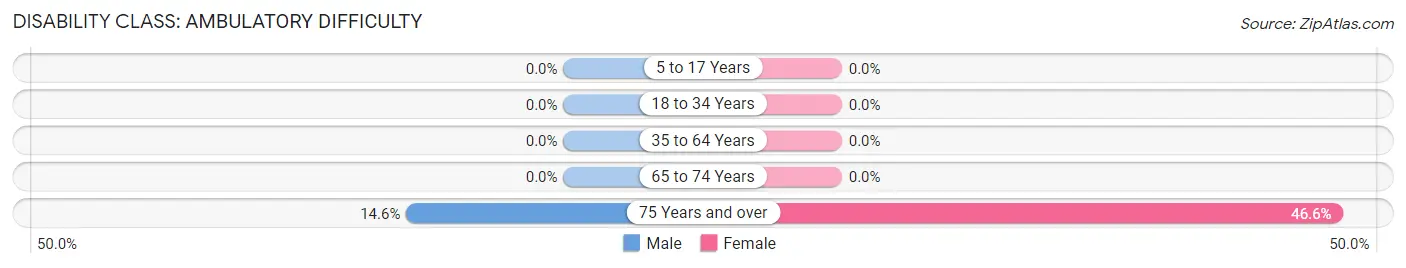
| Age Bracket | Male | Female |
| 5 to 17 Years | 0 (0.0%) | 0 (0.0%) |
| 18 to 34 Years | 0 (0.0%) | 0 (0.0%) |
| 35 to 64 Years | 0 (0.0%) | 0 (0.0%) |
| 65 to 74 Years | 0 (0.0%) | 0 (0.0%) |
| 75 Years and over | 7 (14.6%) | 27 (46.6%) |
Disability Class: Self-Care Difficulty
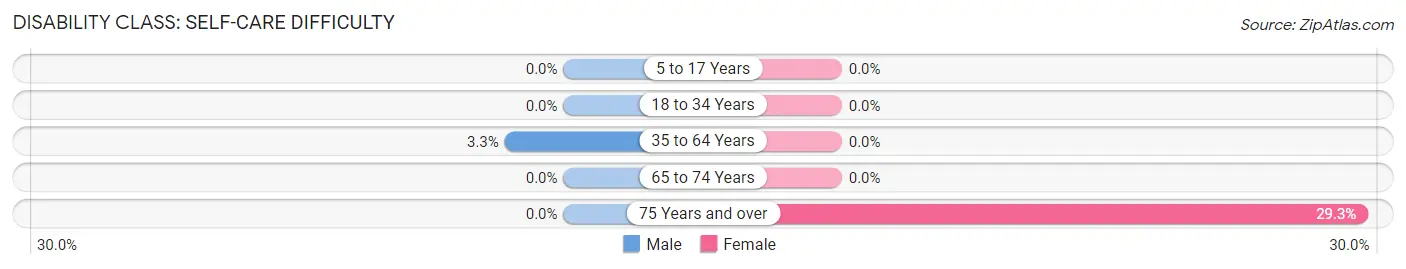
| Age Bracket | Male | Female |
| 5 to 17 Years | 0 (0.0%) | 0 (0.0%) |
| 18 to 34 Years | 0 (0.0%) | 0 (0.0%) |
| 35 to 64 Years | 10 (3.3%) | 0 (0.0%) |
| 65 to 74 Years | 0 (0.0%) | 0 (0.0%) |
| 75 Years and over | 0 (0.0%) | 17 (29.3%) |
Technology Access in Peach Lake
Computing Device Access in Peach Lake
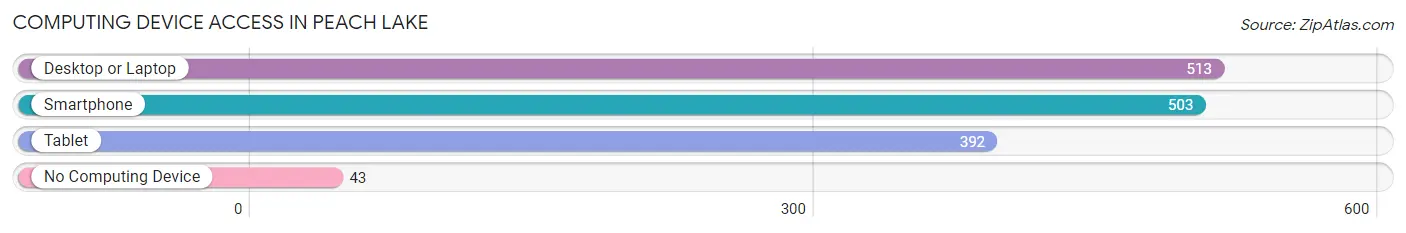
| Device Type | # Households | % Households |
| Desktop or Laptop | 513 | 89.5% |
| Smartphone | 503 | 87.8% |
| Tablet | 392 | 68.4% |
| No Computing Device | 43 | 7.5% |
| Total | 573 | 100.0% |
Internet Access in Peach Lake
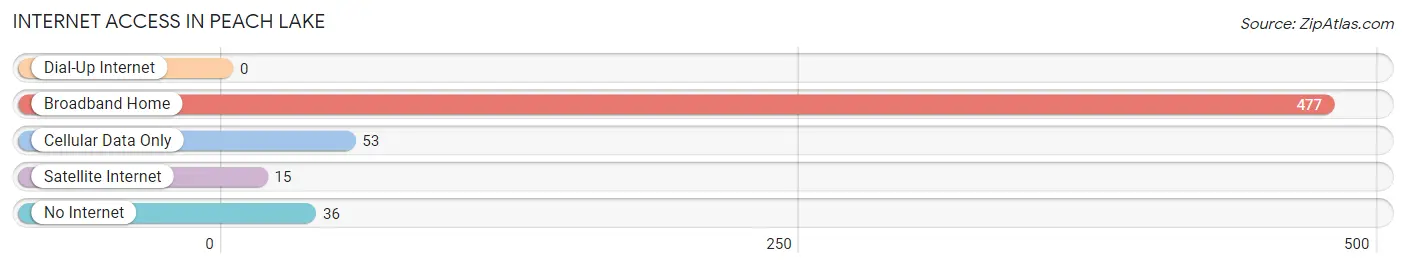
| Internet Type | # Households | % Households |
| Dial-Up Internet | 0 | 0.0% |
| Broadband Home | 477 | 83.3% |
| Cellular Data Only | 53 | 9.2% |
| Satellite Internet | 15 | 2.6% |
| No Internet | 36 | 6.3% |
| Total | 573 | 100.0% |
Peach Lake Summary
Peach Lake is a hamlet located in the town of Southeast in Putnam County, New York. It is situated on the eastern shore of Peach Lake, a small lake of the same name. The hamlet is located approximately 50 miles north of New York City and is part of the New York metropolitan area.
Geography
Peach Lake is located at 41°20'N 73°45'W. It is situated on the eastern shore of Peach Lake, a small lake of the same name. The lake is approximately 1.5 miles long and 0.5 miles wide. The lake is fed by several small streams and is drained by the Croton River. The hamlet is located in the town of Southeast in Putnam County, New York.
History
The area around Peach Lake was first settled in the late 1700s by Dutch and English settlers. The hamlet was originally known as "Peach Orchard" and was named after the many peach trees that grew in the area. The hamlet was officially incorporated in 1845.
In the late 1800s, Peach Lake became a popular summer resort destination. The lake was a popular spot for fishing, swimming, and boating. Several hotels and resorts were built in the area to accommodate the influx of tourists.
In the early 1900s, the hamlet began to decline in popularity as a resort destination. The Great Depression and World War II further contributed to the decline of the hamlet. In the 1950s, the hamlet began to experience a resurgence in popularity as a summer resort destination.
Economy
The economy of Peach Lake is largely based on tourism. The hamlet is home to several resorts and hotels, as well as restaurants and other tourist attractions. The hamlet is also home to several small businesses, including a marina, a general store, and a hardware store.
Demographics
As of the 2010 census, the population of Peach Lake was 1,845. The median age of the population was 44.7 years. The median household income was $63,750. The median home value was $310,000. The racial makeup of the hamlet was 94.3% White, 1.2% African American, 0.7% Asian, 0.3% Native American, and 3.5% other.
Conclusion
Peach Lake is a small hamlet located in the town of Southeast in Putnam County, New York. It is situated on the eastern shore of Peach Lake, a small lake of the same name. The hamlet is located approximately 50 miles north of New York City and is part of the New York metropolitan area. The economy of Peach Lake is largely based on tourism, with several resorts and hotels, as well as restaurants and other tourist attractions. As of the 2010 census, the population of Peach Lake was 1,845. The median age of the population was 44.7 years. The median household income was $63,750. The median home value was $310,000. The racial makeup of the hamlet was 94.3% White, 1.2% African American, 0.7% Asian, 0.3% Native American, and 3.5% other.
Common Questions
What is Per Capita Income in Peach Lake?
Per Capita income in Peach Lake is $56,458.
What is the Median Family Income in Peach Lake?
Median Family Income in Peach Lake is $155,469.
What is the Median Household income in Peach Lake?
Median Household Income in Peach Lake is $119,861.
What is Income or Wage Gap in Peach Lake?
Income or Wage Gap in Peach Lake is 24.2%.
Women in Peach Lake earn 75.8 cents for every dollar earned by a man.
What is Inequality or Gini Index in Peach Lake?
Inequality or Gini Index in Peach Lake is 0.38.
What is the Total Population of Peach Lake?
Total Population of Peach Lake is 1,349.
What is the Total Male Population of Peach Lake?
Total Male Population of Peach Lake is 719.
What is the Total Female Population of Peach Lake?
Total Female Population of Peach Lake is 630.
What is the Ratio of Males per 100 Females in Peach Lake?
There are 114.13 Males per 100 Females in Peach Lake.
What is the Ratio of Females per 100 Males in Peach Lake?
There are 87.62 Females per 100 Males in Peach Lake.
What is the Median Population Age in Peach Lake?
Median Population Age in Peach Lake is 51.9 Years.
What is the Average Family Size in Peach Lake
Average Family Size in Peach Lake is 3.1 People.
What is the Average Household Size in Peach Lake
Average Household Size in Peach Lake is 2.4 People.
How Large is the Labor Force in Peach Lake?
There are 807 People in the Labor Forcein in Peach Lake.
What is the Percentage of People in the Labor Force in Peach Lake?
71.4% of People are in the Labor Force in Peach Lake.
What is the Unemployment Rate in Peach Lake?
Unemployment Rate in Peach Lake is 6.8%.