Zip Codes with the Highest Percentage of Population Employed in Education Instruction & Library in New York
RELATED REPORTS & OPTIONS
Education Instruction & Library
New York
Compare Zip Codes
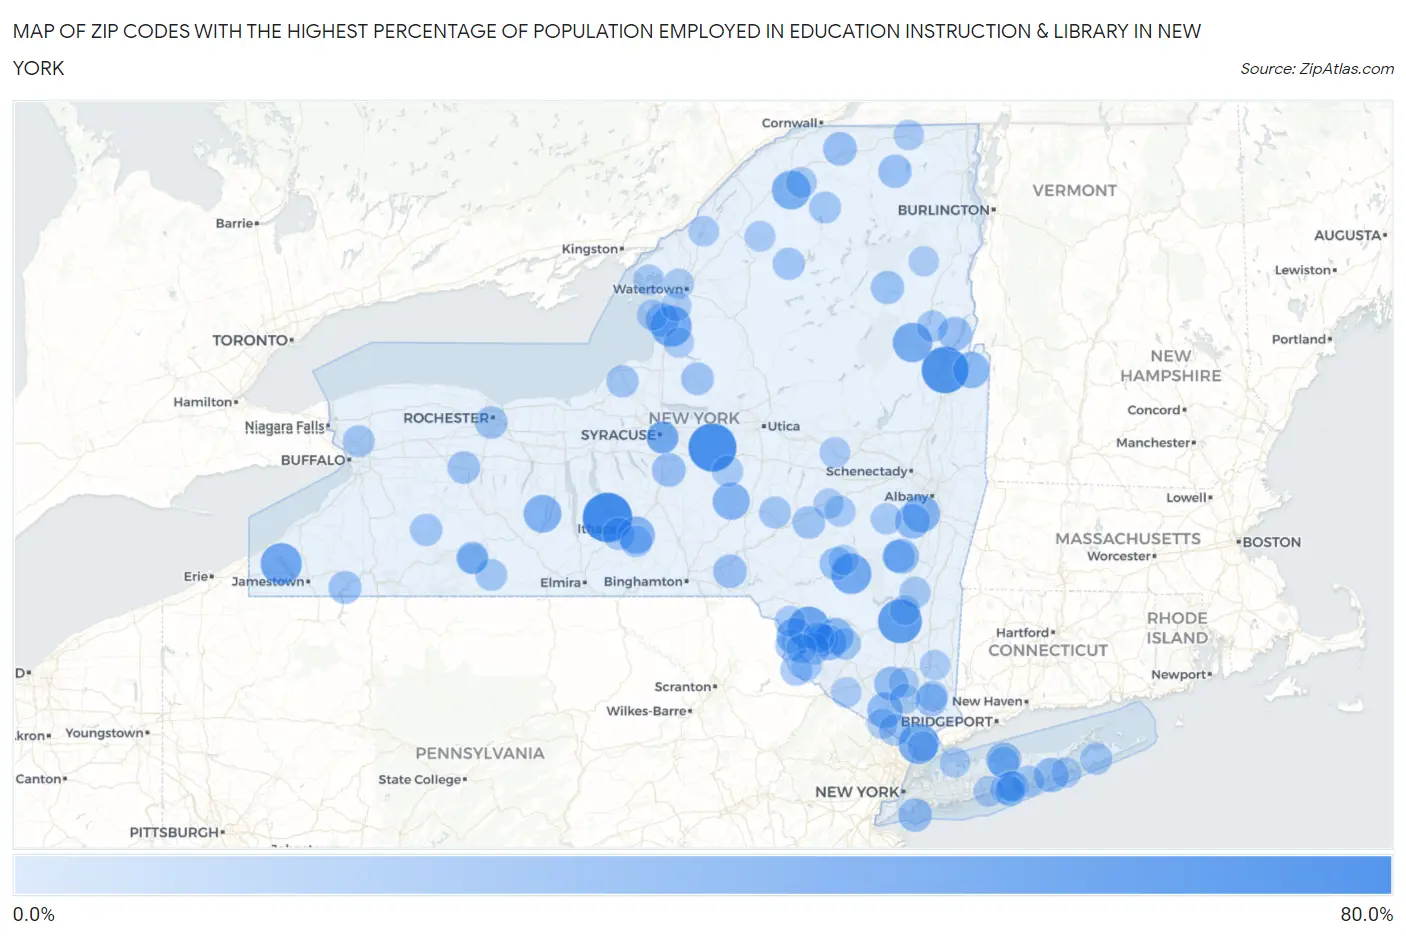
Map of Zip Codes with the Highest Percentage of Population Employed in Education Instruction & Library in New York
0.0%
80.0%
Zip Codes with the Highest Percentage of Population Employed in Education Instruction & Library in New York
| Zip Code | % Employed | vs State | vs National | |
| 1. | 14854 | 79.1% | 7.7%(+71.4)#1 | 6.2%(+72.9)#21 |
| 2. | 13134 | 74.0% | 7.7%(+66.3)#2 | 6.2%(+67.8)#24 |
| 3. | 12820 | 69.6% | 7.7%(+61.9)#3 | 6.2%(+63.4)#30 |
| 4. | 12471 | 60.0% | 7.7%(+52.3)#4 | 6.2%(+53.8)#40 |
| 5. | 12787 | 52.9% | 7.7%(+45.3)#5 | 6.2%(+46.8)#54 |
| 6. | 14722 | 51.2% | 7.7%(+43.5)#6 | 6.2%(+45.0)#63 |
| 7. | 13674 | 50.0% | 7.7%(+42.3)#7 | 6.2%(+43.8)#71 |
| 8. | 10503 | 48.9% | 7.7%(+41.2)#8 | 6.2%(+42.7)#81 |
| 9. | 12465 | 48.3% | 7.7%(+40.6)#9 | 6.2%(+42.1)#83 |
| 10. | 12886 | 45.3% | 7.7%(+37.7)#10 | 6.2%(+39.2)#98 |
| 11. | 13647 | 43.1% | 7.7%(+35.4)#11 | 6.2%(+36.9)#113 |
| 12. | 14874 | 40.0% | 7.7%(+32.3)#12 | 6.2%(+33.8)#131 |
| 13. | 12161 | 38.5% | 7.7%(+30.8)#13 | 6.2%(+32.3)#143 |
| 14. | 14881 | 37.5% | 7.7%(+29.8)#14 | 6.2%(+31.3)#150 |
| 15. | 13814 | 37.5% | 7.7%(+29.8)#15 | 6.2%(+31.3)#151 |
| 16. | 12750 | 36.4% | 7.7%(+28.7)#16 | 6.2%(+30.2)#162 |
| 17. | 12733 | 36.3% | 7.7%(+28.6)#17 | 6.2%(+30.1)#165 |
| 18. | 12821 | 35.0% | 7.7%(+27.3)#18 | 6.2%(+28.8)#182 |
| 19. | 10975 | 32.1% | 7.7%(+24.4)#19 | 6.2%(+25.9)#223 |
| 20. | 12751 | 31.9% | 7.7%(+24.3)#20 | 6.2%(+25.7)#228 |
| 21. | 12473 | 31.1% | 7.7%(+23.5)#21 | 6.2%(+25.0)#247 |
| 22. | 11794 | 31.1% | 7.7%(+23.4)#22 | 6.2%(+24.9)#249 |
| 23. | 12007 | 30.5% | 7.7%(+22.8)#23 | 6.2%(+24.3)#255 |
| 24. | 11972 | 29.1% | 7.7%(+21.4)#24 | 6.2%(+22.9)#272 |
| 25. | 12577 | 27.7% | 7.7%(+20.1)#25 | 6.2%(+21.6)#300 |
| 26. | 13611 | 27.7% | 7.7%(+20.0)#26 | 6.2%(+21.5)#301 |
| 27. | 13813 | 26.5% | 7.7%(+18.9)#27 | 6.2%(+20.4)#324 |
| 28. | 13020 | 26.5% | 7.7%(+18.9)#28 | 6.2%(+20.3)#325 |
| 29. | 12874 | 26.4% | 7.7%(+18.7)#29 | 6.2%(+20.2)#330 |
| 30. | 12957 | 26.4% | 7.7%(+18.7)#30 | 6.2%(+20.2)#331 |
| 31. | 11697 | 26.3% | 7.7%(+18.6)#31 | 6.2%(+20.1)#335 |
| 32. | 12969 | 25.5% | 7.7%(+17.8)#32 | 6.2%(+19.3)#350 |
| 33. | 12438 | 25.0% | 7.7%(+17.3)#33 | 6.2%(+18.8)#369 |
| 34. | 12852 | 24.8% | 7.7%(+17.2)#34 | 6.2%(+18.6)#377 |
| 35. | 14783 | 24.1% | 7.7%(+16.4)#35 | 6.2%(+17.9)#406 |
| 36. | 14627 | 23.3% | 7.7%(+15.6)#36 | 6.2%(+17.1)#453 |
| 37. | 13483 | 23.3% | 7.7%(+15.6)#37 | 6.2%(+17.1)#454 |
| 38. | 12470 | 23.1% | 7.7%(+15.4)#38 | 6.2%(+16.9)#462 |
| 39. | 13750 | 23.0% | 7.7%(+15.3)#39 | 6.2%(+16.8)#465 |
| 40. | 12742 | 22.8% | 7.7%(+15.1)#40 | 6.2%(+16.6)#477 |
| 41. | 14539 | 22.7% | 7.7%(+15.1)#41 | 6.2%(+16.5)#482 |
| 42. | 10527 | 22.3% | 7.7%(+14.6)#42 | 6.2%(+16.1)#499 |
| 43. | 14850 | 22.1% | 7.7%(+14.5)#43 | 6.2%(+15.9)#508 |
| 44. | 13115 | 22.0% | 7.7%(+14.3)#44 | 6.2%(+15.8)#517 |
| 45. | 14744 | 21.7% | 7.7%(+14.0)#45 | 6.2%(+15.5)#528 |
| 46. | 12762 | 21.6% | 7.7%(+13.9)#46 | 6.2%(+15.4)#536 |
| 47. | 13690 | 21.4% | 7.7%(+13.8)#47 | 6.2%(+15.2)#544 |
| 48. | 14802 | 21.3% | 7.7%(+13.6)#48 | 6.2%(+15.1)#551 |
| 49. | 13210 | 21.2% | 7.7%(+13.6)#49 | 6.2%(+15.0)#559 |
| 50. | 11932 | 20.9% | 7.7%(+13.2)#50 | 6.2%(+14.7)#574 |
| 51. | 14260 | 20.8% | 7.7%(+13.1)#51 | 6.2%(+14.6)#583 |
| 52. | 13796 | 20.7% | 7.7%(+13.0)#52 | 6.2%(+14.5)#588 |
| 53. | 12752 | 20.6% | 7.7%(+12.9)#53 | 6.2%(+14.4)#602 |
| 54. | 13672 | 20.5% | 7.7%(+12.8)#54 | 6.2%(+14.3)#611 |
| 55. | 10952 | 20.4% | 7.7%(+12.7)#55 | 6.2%(+14.2)#617 |
| 56. | 14839 | 20.1% | 7.7%(+12.5)#56 | 6.2%(+13.9)#638 |
| 57. | 14817 | 20.1% | 7.7%(+12.4)#57 | 6.2%(+13.9)#644 |
| 58. | 12763 | 20.0% | 7.7%(+12.3)#58 | 6.2%(+13.8)#648 |
| 59. | 12792 | 20.0% | 7.7%(+12.3)#59 | 6.2%(+13.8)#651 |
| 60. | 12734 | 19.6% | 7.7%(+11.9)#60 | 6.2%(+13.4)#684 |
| 61. | 12808 | 19.2% | 7.7%(+11.5)#61 | 6.2%(+13.0)#717 |
| 62. | 13244 | 19.2% | 7.7%(+11.5)#62 | 6.2%(+13.0)#719 |
| 63. | 11719 | 19.2% | 7.7%(+11.5)#63 | 6.2%(+13.0)#720 |
| 64. | 12504 | 19.1% | 7.7%(+11.4)#64 | 6.2%(+12.9)#729 |
| 65. | 11790 | 19.0% | 7.7%(+11.3)#65 | 6.2%(+12.8)#739 |
| 66. | 12147 | 18.5% | 7.7%(+10.9)#66 | 6.2%(+12.4)#782 |
| 67. | 11796 | 18.3% | 7.7%(+10.6)#67 | 6.2%(+12.1)#808 |
| 68. | 13676 | 18.2% | 7.7%(+10.6)#68 | 6.2%(+12.1)#810 |
| 69. | 12732 | 18.2% | 7.7%(+10.6)#69 | 6.2%(+12.1)#811 |
| 70. | 13650 | 18.1% | 7.7%(+10.5)#70 | 6.2%(+11.9)#822 |
| 71. | 13346 | 18.0% | 7.7%(+10.3)#71 | 6.2%(+11.8)#837 |
| 72. | 14803 | 17.6% | 7.7%(+9.93)#72 | 6.2%(+11.4)#886 |
| 73. | 11715 | 17.5% | 7.7%(+9.85)#73 | 6.2%(+11.3)#890 |
| 74. | 13693 | 17.5% | 7.7%(+9.79)#74 | 6.2%(+11.3)#896 |
| 75. | 10505 | 17.4% | 7.7%(+9.72)#75 | 6.2%(+11.2)#901 |
| 76. | 12175 | 17.4% | 7.7%(+9.72)#76 | 6.2%(+11.2)#902 |
| 77. | 12767 | 17.1% | 7.7%(+9.42)#77 | 6.2%(+10.9)#938 |
| 78. | 11718 | 16.9% | 7.7%(+9.26)#78 | 6.2%(+10.7)#954 |
| 79. | 13410 | 16.9% | 7.7%(+9.23)#79 | 6.2%(+10.7)#961 |
| 80. | 13635 | 16.6% | 7.7%(+8.96)#80 | 6.2%(+10.4)#1,013 |
| 81. | 10974 | 16.6% | 7.7%(+8.95)#81 | 6.2%(+10.4)#1,016 |
| 82. | 13679 | 16.3% | 7.7%(+8.61)#82 | 6.2%(+10.1)#1,054 |
| 83. | 12417 | 16.3% | 7.7%(+8.58)#83 | 6.2%(+10.1)#1,059 |
| 84. | 12064 | 16.2% | 7.7%(+8.48)#84 | 6.2%(+9.97)#1,074 |
| 85. | 12923 | 16.1% | 7.7%(+8.48)#85 | 6.2%(+9.96)#1,076 |
| 86. | 11705 | 16.0% | 7.7%(+8.36)#86 | 6.2%(+9.85)#1,094 |
| 87. | 10933 | 16.0% | 7.7%(+8.35)#87 | 6.2%(+9.84)#1,096 |
| 88. | 13615 | 15.9% | 7.7%(+8.21)#88 | 6.2%(+9.69)#1,113 |
| 89. | 11942 | 15.8% | 7.7%(+8.17)#89 | 6.2%(+9.66)#1,122 |
| 90. | 12520 | 15.8% | 7.7%(+8.14)#90 | 6.2%(+9.63)#1,129 |
| 91. | 12421 | 15.7% | 7.7%(+8.08)#91 | 6.2%(+9.56)#1,144 |
| 92. | 11709 | 15.7% | 7.7%(+8.01)#92 | 6.2%(+9.50)#1,153 |
| 93. | 11782 | 15.7% | 7.7%(+8.01)#93 | 6.2%(+9.50)#1,154 |
| 94. | 13083 | 15.7% | 7.7%(+7.99)#94 | 6.2%(+9.47)#1,160 |
| 95. | 13606 | 15.6% | 7.7%(+7.91)#95 | 6.2%(+9.40)#1,172 |
| 96. | 10922 | 15.6% | 7.7%(+7.90)#96 | 6.2%(+9.39)#1,174 |
| 97. | 12582 | 15.5% | 7.7%(+7.81)#97 | 6.2%(+9.29)#1,190 |
| 98. | 12943 | 15.4% | 7.7%(+7.77)#98 | 6.2%(+9.26)#1,197 |
| 99. | 12720 | 15.4% | 7.7%(+7.75)#99 | 6.2%(+9.24)#1,204 |
| 100. | 10502 | 15.4% | 7.7%(+7.72)#100 | 6.2%(+9.21)#1,208 |
Common Questions
What are the Top 10 Zip Codes with the Highest Percentage of Population Employed in Education Instruction & Library in New York?
Top 10 Zip Codes with the Highest Percentage of Population Employed in Education Instruction & Library in New York are:
What zip code has the Highest Percentage of Population Employed in Education Instruction & Library in New York?
14854 has the Highest Percentage of Population Employed in Education Instruction & Library in New York with 79.1%.
What is the Percentage of Population Employed in Education Instruction & Library in the State of New York?
Percentage of Population Employed in Education Instruction & Library in New York is 7.7%.
What is the Percentage of Population Employed in Education Instruction & Library in the United States?
Percentage of Population Employed in Education Instruction & Library in the United States is 6.2%.