Zip Codes with the Highest Percentage of Population Employed in Arts, Media & Entertainment in New York, NY

RELATED REPORTS & OPTIONS

Arts, Media & Entertainment
Population
Families and Households
Female Fertility
Female Fertility (Unmarried)
Race (Community Size)
Race (Percentage)
Ancestry (Community Size)
AfghanAfricanAlbanianAlsatianAmericanApacheArabArgentineanArmenianAssyrian / Chaldean / SyriacAustralianAustrianBahamianBarbadianBasqueBelgianBelizeanBermudanBhutaneseBlackfeetBolivianBrazilianBritishBritish West IndianBulgarianBurmeseCajunCambodianCanadianCape VerdeanCarpatho RusynCelticCentral AmericanCentral American IndianCherokeeChickasawChileanChippewaChoctawColombianCosta RicanCreekCroatianCubanCypriotCzechCzechoslovakianDanishDelawareDominicanDutchDutch West IndianEastern EuropeanEcuadorianEgyptianEnglishEstonianEthiopianEuropeanFilipinoFinnishFrenchFrench American IndianFrench CanadianGermanGhanaianGreekGuamanian / ChamorroGuatemalanGuyaneseHaitianHmongHonduranHungarianIcelanderIndian (Asian)IndonesianIranianIraqiIrishIroquoisIsraeliItalianJamaicanJapaneseJordanianKenyanKoreanLaotianLatvianLebaneseLiberianLithuanianLuxembourgerMacedonianMalaysianMalteseMexicanMexican American IndianMongolianMoroccanNative HawaiianNew ZealanderNicaraguanNigerianNorthern EuropeanNorwegianOkinawanPakistaniPalestinianPanamanianParaguayanPennsylvania GermanPeruvianPolishPortuguesePuebloPuerto RicanRomanianRussianSalvadoranSamoanScandinavianScotch-IrishScottishSenegaleseSerbianSierra LeoneanSiouxSlavicSlovakSloveneSomaliSouth AfricanSouth AmericanSouth American IndianSoviet UnionSpaniardSpanishSpanish AmericanSpanish American IndianSri LankanSubsaharan AfricanSudaneseSwedishSwissSyrianThaiTrinidadian and TobagonianTurkishU.S. Virgin IslanderUgandanUkrainianUruguayanVenezuelanVietnameseWelshWest IndianYugoslavianZimbabwean
Ancestry (Percentage)
AfghanAfricanAlbanianAlsatianAmericanApacheArabArgentineanArmenianAssyrian / Chaldean / SyriacAustralianAustrianBahamianBarbadianBasqueBelgianBelizeanBermudanBhutaneseBlackfeetBolivianBrazilianBritishBritish West IndianBulgarianBurmeseCajunCambodianCanadianCape VerdeanCarpatho RusynCelticCentral AmericanCentral American IndianCherokeeChickasawChileanChippewaChoctawColombianCosta RicanCreekCroatianCubanCypriotCzechCzechoslovakianDanishDelawareDominicanDutchDutch West IndianEastern EuropeanEcuadorianEgyptianEnglishEstonianEthiopianEuropeanFilipinoFinnishFrenchFrench American IndianFrench CanadianGermanGhanaianGreekGuamanian / ChamorroGuatemalanGuyaneseHaitianHmongHonduranHungarianIcelanderIndian (Asian)IndonesianIranianIraqiIrishIroquoisIsraeliItalianJamaicanJapaneseJordanianKenyanKoreanLaotianLatvianLebaneseLiberianLithuanianLuxembourgerMacedonianMalaysianMalteseMexicanMexican American IndianMongolianMoroccanNative HawaiianNew ZealanderNicaraguanNigerianNorthern EuropeanNorwegianOkinawanPakistaniPalestinianPanamanianParaguayanPennsylvania GermanPeruvianPolishPortuguesePuebloPuerto RicanRomanianRussianSalvadoranSamoanScandinavianScotch-IrishScottishSenegaleseSerbianSierra LeoneanSiouxSlavicSlovakSloveneSomaliSouth AfricanSouth AmericanSouth American IndianSoviet UnionSpaniardSpanishSpanish AmericanSpanish American IndianSri LankanSubsaharan AfricanSudaneseSwedishSwissSyrianThaiTrinidadian and TobagonianTurkishU.S. Virgin IslanderUgandanUkrainianUruguayanVenezuelanVietnameseWelshWest IndianYugoslavianZimbabwean
Immigrant Origin (Total)
AfghanistanAfricaAlbaniaArgentinaArmeniaAsiaAustraliaAustriaBahamasBangladeshBarbadosBelarusBelgiumBelizeBoliviaBosnia and HerzegovinaBrazilBulgariaBurma / MyanmarCambodiaCameroonCanadaCaribbeanCentral AmericaChileChinaColombiaCongoCosta RicaCroatiaCubaCzechoslovakiaDenmarkDominicaDominican RepublicEastern AfricaEastern AsiaEastern EuropeEcuadorEgyptEl SalvadorEnglandEritreaEthiopiaEuropeFranceGermanyGhanaGreeceGrenadaGuatemalaGuyanaHaitiHondurasHong KongHungaryIndiaIndonesiaIranIraqIrelandIsraelItalyJamaicaJapanJordanKazakhstanKenyaKoreaKuwaitLatin AmericaLatviaLebanonLiberiaLithuaniaMalaysiaMexicoMiddle AfricaMoldovaMoroccoNepalNetherlandsNicaraguaNigeriaNorth MacedoniaNorthern AfricaNorthern EuropeNorwayOceaniaPakistanPanamaPeruPhilippinesPolandPortugalRomaniaRussiaSaudi ArabiaScotlandSenegalSerbiaSierra LeoneSingaporeSomaliaSouth AfricaSouth AmericaSouth Central AsiaSouth Eastern AsiaSouthern EuropeSpainSri LankaSt. Vincent and the GrenadinesSudanSwedenSwitzerlandSyriaTaiwanThailandTrinidad and TobagoTurkeyUgandaUkraineUruguayUzbekistanVenezuelaVietnamWest IndiesWestern AfricaWestern AsiaWestern EuropeYemenZaireZimbabwe
Immigrant Origin (Percentage)
AfghanistanAfricaAlbaniaArgentinaArmeniaAsiaAustraliaAustriaBahamasBangladeshBarbadosBelarusBelgiumBelizeBoliviaBosnia and HerzegovinaBrazilBulgariaBurma / MyanmarCambodiaCameroonCanadaCaribbeanCentral AmericaChileChinaColombiaCongoCosta RicaCroatiaCubaCzechoslovakiaDenmarkDominicaDominican RepublicEastern AfricaEastern AsiaEastern EuropeEcuadorEgyptEl SalvadorEnglandEritreaEthiopiaEuropeFranceGermanyGhanaGreeceGrenadaGuatemalaGuyanaHaitiHondurasHong KongHungaryIndiaIndonesiaIranIraqIrelandIsraelItalyJamaicaJapanJordanKazakhstanKenyaKoreaKuwaitLatin AmericaLatviaLebanonLiberiaLithuaniaMalaysiaMexicoMiddle AfricaMoldovaMoroccoNepalNetherlandsNicaraguaNigeriaNorth MacedoniaNorthern AfricaNorthern EuropeNorwayOceaniaPakistanPanamaPeruPhilippinesPolandPortugalRomaniaRussiaSaudi ArabiaScotlandSenegalSerbiaSierra LeoneSingaporeSomaliaSouth AfricaSouth AmericaSouth Central AsiaSouth Eastern AsiaSouthern EuropeSpainSri LankaSt. Vincent and the GrenadinesSudanSwedenSwitzerlandSyriaTaiwanThailandTrinidad and TobagoTurkeyUgandaUkraineUruguayUzbekistanVenezuelaVietnamWest IndiesWestern AfricaWestern AsiaWestern EuropeYemenZaireZimbabwe
Income
Income (Families)
Income (Households)
Poverty
Poverty (Families)
Unemployment
Employment Occupations
Employment Industries
Employer Class
Commute Time
Commute Means
School Enrollment
Education by Degree Field
Occupancy
Finances
Physical Characteristics
New York
Compare Zip Codes
Comparison Subject

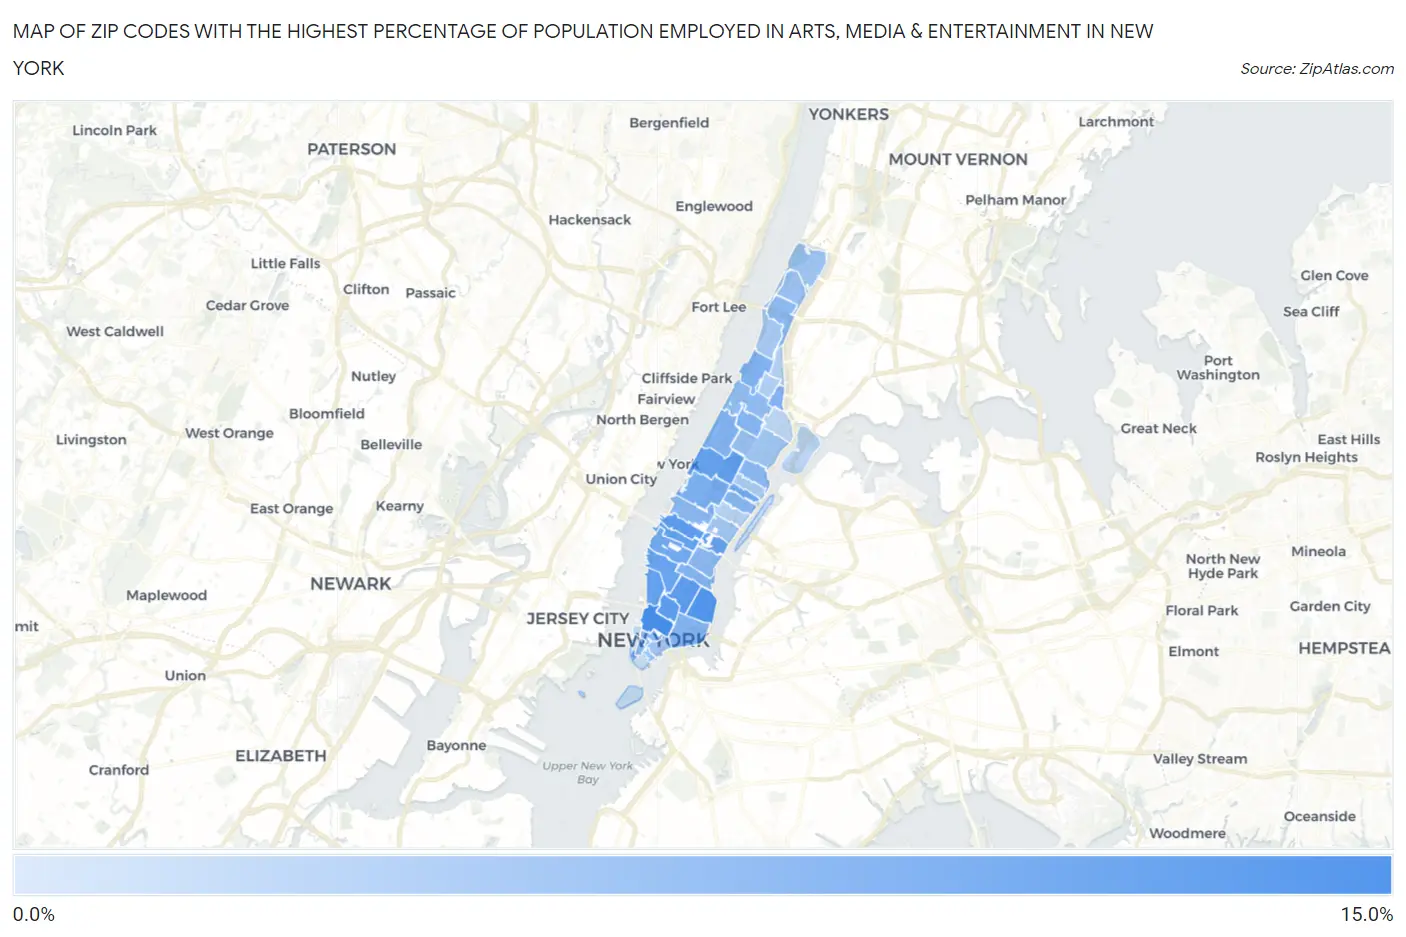
Map of Zip Codes with the Highest Percentage of Population Employed in Arts, Media & Entertainment in New York

0.0%
15.0%
Zip Codes with the Highest Percentage of Population Employed in Arts, Media & Entertainment in New York Map

Zip Codes with the Highest Percentage of Population Employed in Arts, Media & Entertainment in New York, NY

Zip Code % Employed vs State vs National
1.1001312.4%3.3%(+9.11)#322.1%(+10.3)#239
2.1000911.6%3.3%(+8.31)#382.1%(+9.52)#279
3.1001211.0%3.3%(+7.75)#442.1%(+8.97)#307
4.1000310.6%3.3%(+7.37)#502.1%(+8.59)#330
5.1003610.6%3.3%(+7.28)#512.1%(+8.49)#335
6.1001710.3%3.3%(+6.98)#562.1%(+8.20)#356
7.1001410.2%3.3%(+6.92)#582.1%(+8.13)#362
8.1002410.1%3.3%(+6.82)#592.1%(+8.03)#370
9.1001810.0%3.3%(+6.76)#602.1%(+7.97)#373
10.100119.8%3.3%(+6.53)#622.1%(+7.75)#387
11.100759.1%3.3%(+5.85)#722.1%(+7.07)#442
12.100019.1%3.3%(+5.81)#742.1%(+7.03)#447
13.100238.4%3.3%(+5.15)#832.1%(+6.37)#498
14.100318.1%3.3%(+4.80)#902.1%(+6.02)#543
15.100258.1%3.3%(+4.80)#912.1%(+6.01)#544
16.100107.8%3.3%(+4.51)#962.1%(+5.73)#583
17.100377.8%3.3%(+4.50)#972.1%(+5.72)#585
18.100267.7%3.3%(+4.40)#992.1%(+5.62)#607
19.100027.7%3.3%(+4.40)#1002.1%(+5.61)#608
20.100217.7%3.3%(+4.39)#1012.1%(+5.60)#609
21.100197.4%3.3%(+4.12)#1092.1%(+5.34)#669
22.101287.4%3.3%(+4.11)#1102.1%(+5.33)#672
23.100167.3%3.3%(+4.05)#1132.1%(+5.26)#684
24.100337.0%3.3%(+3.75)#1172.1%(+4.97)#760
25.100276.9%3.3%(+3.63)#1192.1%(+4.84)#780
26.100066.8%3.3%(+3.56)#1212.1%(+4.78)#795
27.100076.8%3.3%(+3.54)#1222.1%(+4.75)#802
28.100056.1%3.3%(+2.80)#1462.1%(+4.02)#1,007
29.100406.0%3.3%(+2.72)#1522.1%(+3.94)#1,034
30.100345.8%3.3%(+2.49)#1682.1%(+3.71)#1,128
31.100295.7%3.3%(+2.46)#1692.1%(+3.67)#1,144
32.100225.7%3.3%(+2.41)#1732.1%(+3.63)#1,162
33.100385.6%3.3%(+2.34)#1752.1%(+3.55)#1,188
34.100325.3%3.3%(+2.03)#1922.1%(+3.25)#1,347
35.100285.2%3.3%(+1.95)#1982.1%(+3.16)#1,389
36.100304.4%3.3%(+1.14)#2472.1%(+2.35)#1,930
37.100394.4%3.3%(+1.08)#2502.1%(+2.29)#1,979
38.100654.1%3.3%(+0.806)#2742.1%(+2.02)#2,267
39.100353.7%3.3%(+0.401)#3172.1%(+1.62)#2,798
40.102823.4%3.3%(+0.152)#3352.1%(+1.37)#3,171
41.100693.2%3.3%(-0.059)#3642.1%(+1.16)#3,575
42.100442.9%3.3%(-0.363)#4182.1%(+0.854)#4,307
43.100042.9%3.3%(-0.399)#4232.1%(+0.818)#4,399
44.102801.4%3.3%(-1.89)#8722.1%(-0.669)#11,772

Common Questions

What are the Top 10 Zip Codes with the Highest Percentage of Population Employed in Arts, Media & Entertainment in New York, NY?
Top 10 Zip Codes with the Highest Percentage of Population Employed in Arts, Media & Entertainment in New York, NY are:
#1
12.4%
#2
11.6%
#3
11.0%
#4
10.6%
#5
10.6%
#6
10.3%
#7
10.2%
#8
10.1%
#9
10.0%
#10
9.8%
What zip code has the Highest Percentage of Population Employed in Arts, Media & Entertainment in New York, NY?
10013 has the Highest Percentage of Population Employed in Arts, Media & Entertainment in New York, NY with 12.4%.
What is the Percentage of Population Employed in Arts, Media & Entertainment in New York, NY?
Percentage of Population Employed in Arts, Media & Entertainment in New York is 4.8%.
What is the Percentage of Population Employed in Arts, Media & Entertainment in New York?
Percentage of Population Employed in Arts, Media & Entertainment in New York is 3.3%.
What is the Percentage of Population Employed in Arts, Media & Entertainment in the United States?
Percentage of Population Employed in Arts, Media & Entertainment in the United States is 2.1%.