Zip Codes with the Highest Percentage of Families with Income Above $200,000 in Massachusetts
RELATED REPORTS & OPTIONS
Family Income | $200k+
Massachusetts
Compare Zip Codes
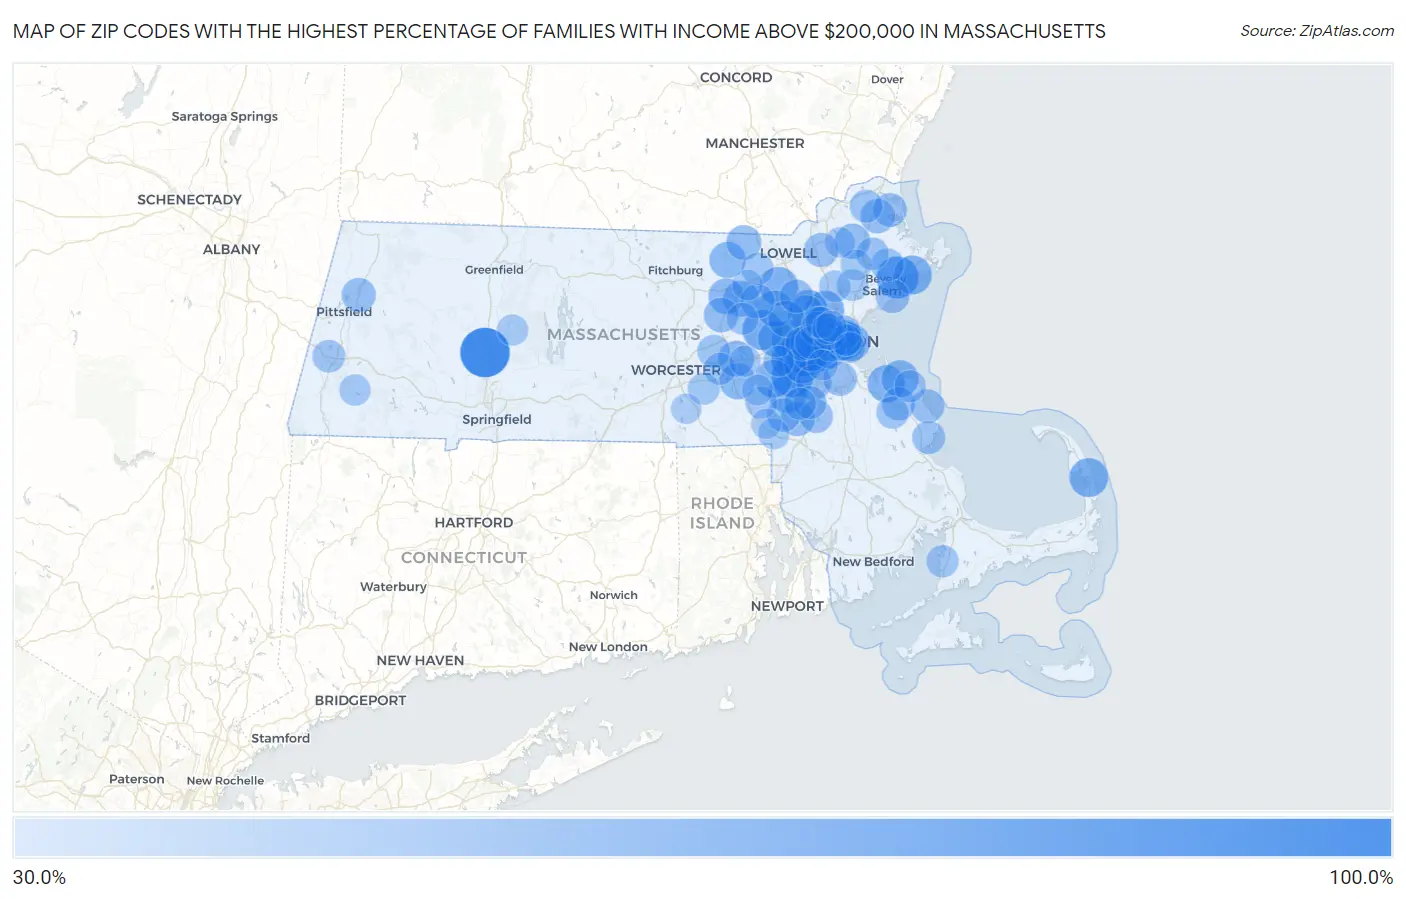
Map of Zip Codes with the Highest Percentage of Families with Income Above $200,000 in Massachusetts
30.0%
100.0%
Zip Codes with the Highest Percentage of Families with Income Above $200,000 in Massachusetts
| Zip Code | Families with Income > $200k | vs State | vs National | |
| 1. | 01063 | 100.0% | 25.6%(+74.4)#1 | 14.8%(+85.2)#4 |
| 2. | 02468 | 76.3% | 25.6%(+50.7)#2 | 14.8%(+61.5)#76 |
| 3. | 01965 | 75.8% | 25.6%(+50.2)#3 | 14.8%(+61.0)#78 |
| 4. | 02030 | 75.4% | 25.6%(+49.8)#4 | 14.8%(+60.6)#80 |
| 5. | 02481 | 72.1% | 25.6%(+46.5)#5 | 14.8%(+57.3)#97 |
| 6. | 02108 | 71.9% | 25.6%(+46.3)#6 | 14.8%(+57.1)#101 |
| 7. | 01776 | 70.0% | 25.6%(+44.4)#7 | 14.8%(+55.2)#120 |
| 8. | 02482 | 69.1% | 25.6%(+43.5)#8 | 14.8%(+54.3)#133 |
| 9. | 02493 | 67.4% | 25.6%(+41.8)#9 | 14.8%(+52.6)#152 |
| 10. | 02663 | 65.7% | 25.6%(+40.1)#10 | 14.8%(+50.9)#178 |
| 11. | 01944 | 65.4% | 25.6%(+39.8)#11 | 14.8%(+50.6)#182 |
| 12. | 01741 | 65.1% | 25.6%(+39.5)#12 | 14.8%(+50.3)#186 |
| 13. | 01890 | 64.6% | 25.6%(+39.0)#13 | 14.8%(+49.8)#193 |
| 14. | 02462 | 64.2% | 25.6%(+38.6)#14 | 14.8%(+49.4)#203 |
| 15. | 02052 | 63.1% | 25.6%(+37.5)#15 | 14.8%(+48.3)#218 |
| 16. | 01770 | 62.9% | 25.6%(+37.3)#16 | 14.8%(+48.1)#226 |
| 17. | 02420 | 62.6% | 25.6%(+37.0)#17 | 14.8%(+47.8)#234 |
| 18. | 02494 | 62.3% | 25.6%(+36.7)#18 | 14.8%(+47.5)#238 |
| 19. | 02210 | 61.6% | 25.6%(+36.0)#19 | 14.8%(+46.8)#253 |
| 20. | 02459 | 61.2% | 25.6%(+35.6)#20 | 14.8%(+46.4)#263 |
| 21. | 02043 | 60.8% | 25.6%(+35.2)#21 | 14.8%(+46.0)#269 |
| 22. | 02492 | 60.7% | 25.6%(+35.1)#22 | 14.8%(+45.9)#275 |
| 23. | 02025 | 60.5% | 25.6%(+34.9)#23 | 14.8%(+45.7)#290 |
| 24. | 02421 | 60.4% | 25.6%(+34.8)#24 | 14.8%(+45.6)#292 |
| 25. | 01778 | 59.4% | 25.6%(+33.8)#25 | 14.8%(+44.6)#314 |
| 26. | 01742 | 59.3% | 25.6%(+33.7)#26 | 14.8%(+44.5)#319 |
| 27. | 02467 | 58.7% | 25.6%(+33.1)#27 | 14.8%(+43.9)#335 |
| 28. | 01773 | 58.4% | 25.6%(+32.8)#28 | 14.8%(+43.6)#341 |
| 29. | 01748 | 57.7% | 25.6%(+32.1)#29 | 14.8%(+42.9)#360 |
| 30. | 01450 | 57.7% | 25.6%(+32.1)#30 | 14.8%(+42.9)#361 |
| 31. | 02116 | 57.4% | 25.6%(+31.8)#31 | 14.8%(+42.6)#374 |
| 32. | 01772 | 56.9% | 25.6%(+31.3)#32 | 14.8%(+42.1)#387 |
| 33. | 02114 | 56.8% | 25.6%(+31.2)#33 | 14.8%(+42.0)#389 |
| 34. | 01719 | 56.7% | 25.6%(+31.1)#34 | 14.8%(+41.9)#394 |
| 35. | 01451 | 56.1% | 25.6%(+30.5)#35 | 14.8%(+41.3)#413 |
| 36. | 02090 | 55.4% | 25.6%(+29.8)#36 | 14.8%(+40.6)#443 |
| 37. | 02461 | 55.3% | 25.6%(+29.7)#37 | 14.8%(+40.5)#448 |
| 38. | 01921 | 54.7% | 25.6%(+29.1)#38 | 14.8%(+39.9)#468 |
| 39. | 01827 | 53.6% | 25.6%(+28.0)#39 | 14.8%(+38.8)#514 |
| 40. | 02465 | 53.5% | 25.6%(+27.9)#40 | 14.8%(+38.7)#518 |
| 41. | 01740 | 53.2% | 25.6%(+27.6)#41 | 14.8%(+38.4)#526 |
| 42. | 02071 | 53.1% | 25.6%(+27.5)#42 | 14.8%(+38.3)#534 |
| 43. | 01720 | 52.4% | 25.6%(+26.8)#43 | 14.8%(+37.6)#557 |
| 44. | 01922 | 52.2% | 25.6%(+26.6)#44 | 14.8%(+37.4)#566 |
| 45. | 02445 | 51.9% | 25.6%(+26.3)#45 | 14.8%(+37.1)#577 |
| 46. | 02109 | 51.6% | 25.6%(+26.0)#46 | 14.8%(+36.8)#588 |
| 47. | 01810 | 51.4% | 25.6%(+25.8)#47 | 14.8%(+36.6)#596 |
| 48. | 02129 | 51.3% | 25.6%(+25.7)#48 | 14.8%(+36.5)#601 |
| 49. | 02458 | 51.2% | 25.6%(+25.6)#49 | 14.8%(+36.4)#608 |
| 50. | 01224 | 51.2% | 25.6%(+25.6)#50 | 14.8%(+36.4)#611 |
| 51. | 02186 | 51.0% | 25.6%(+25.4)#51 | 14.8%(+36.2)#621 |
| 52. | 02466 | 50.9% | 25.6%(+25.3)#52 | 14.8%(+36.1)#626 |
| 53. | 02478 | 50.8% | 25.6%(+25.2)#53 | 14.8%(+36.0)#629 |
| 54. | 01951 | 50.6% | 25.6%(+25.0)#54 | 14.8%(+35.8)#640 |
| 55. | 01945 | 50.0% | 25.6%(+24.4)#55 | 14.8%(+35.2)#654 |
| 56. | 02047 | 50.0% | 25.6%(+24.4)#56 | 14.8%(+35.2)#666 |
| 57. | 02061 | 49.5% | 25.6%(+23.9)#57 | 14.8%(+34.7)#692 |
| 58. | 01730 | 49.4% | 25.6%(+23.8)#58 | 14.8%(+34.6)#697 |
| 59. | 02067 | 49.3% | 25.6%(+23.7)#59 | 14.8%(+34.5)#704 |
| 60. | 02056 | 49.3% | 25.6%(+23.7)#60 | 14.8%(+34.5)#705 |
| 61. | 02332 | 48.3% | 25.6%(+22.7)#61 | 14.8%(+33.5)#747 |
| 62. | 02142 | 48.1% | 25.6%(+22.5)#62 | 14.8%(+33.3)#755 |
| 63. | 01984 | 48.0% | 25.6%(+22.4)#63 | 14.8%(+33.2)#763 |
| 64. | 02032 | 48.0% | 25.6%(+22.4)#64 | 14.8%(+33.2)#764 |
| 65. | 01985 | 47.8% | 25.6%(+22.2)#65 | 14.8%(+33.0)#775 |
| 66. | 01532 | 47.6% | 25.6%(+22.0)#66 | 14.8%(+32.8)#781 |
| 67. | 02446 | 47.1% | 25.6%(+21.5)#67 | 14.8%(+32.3)#807 |
| 68. | 02460 | 47.1% | 25.6%(+21.5)#68 | 14.8%(+32.3)#812 |
| 69. | 01262 | 46.7% | 25.6%(+21.1)#69 | 14.8%(+31.9)#831 |
| 70. | 01983 | 46.3% | 25.6%(+20.7)#70 | 14.8%(+31.5)#851 |
| 71. | 02138 | 46.0% | 25.6%(+20.4)#71 | 14.8%(+31.2)#867 |
| 72. | 02339 | 45.8% | 25.6%(+20.2)#72 | 14.8%(+31.0)#884 |
| 73. | 01886 | 45.7% | 25.6%(+20.1)#73 | 14.8%(+30.9)#889 |
| 74. | 02556 | 45.4% | 25.6%(+19.8)#74 | 14.8%(+30.6)#920 |
| 75. | 01581 | 45.0% | 25.6%(+19.4)#75 | 14.8%(+30.2)#937 |
| 76. | 02081 | 44.9% | 25.6%(+19.3)#76 | 14.8%(+30.1)#942 |
| 77. | 02066 | 44.7% | 25.6%(+19.1)#77 | 14.8%(+29.9)#950 |
| 78. | 02053 | 44.5% | 25.6%(+18.9)#78 | 14.8%(+29.7)#961 |
| 79. | 01519 | 44.4% | 25.6%(+18.8)#79 | 14.8%(+29.6)#967 |
| 80. | 01775 | 44.4% | 25.6%(+18.8)#80 | 14.8%(+29.6)#968 |
| 81. | 02476 | 44.2% | 25.6%(+18.6)#81 | 14.8%(+29.4)#982 |
| 82. | 01940 | 43.8% | 25.6%(+18.2)#82 | 14.8%(+29.0)#1,001 |
| 83. | 02110 | 43.8% | 25.6%(+18.2)#83 | 14.8%(+29.0)#1,004 |
| 84. | 01867 | 43.6% | 25.6%(+18.0)#84 | 14.8%(+28.8)#1,017 |
| 85. | 02474 | 43.2% | 25.6%(+17.6)#85 | 14.8%(+28.4)#1,037 |
| 86. | 01245 | 42.7% | 25.6%(+17.1)#86 | 14.8%(+27.9)#1,075 |
| 87. | 01745 | 42.5% | 25.6%(+16.9)#87 | 14.8%(+27.7)#1,100 |
| 88. | 01003 | 42.1% | 25.6%(+16.5)#88 | 14.8%(+27.3)#1,128 |
| 89. | 02093 | 42.0% | 25.6%(+16.4)#89 | 14.8%(+27.2)#1,137 |
| 90. | 01949 | 42.0% | 25.6%(+16.4)#90 | 14.8%(+27.2)#1,139 |
| 91. | 01760 | 41.5% | 25.6%(+15.9)#91 | 14.8%(+26.7)#1,183 |
| 92. | 01746 | 41.4% | 25.6%(+15.8)#92 | 14.8%(+26.6)#1,193 |
| 93. | 02140 | 41.3% | 25.6%(+15.7)#93 | 14.8%(+26.5)#1,196 |
| 94. | 02132 | 40.9% | 25.6%(+15.3)#94 | 14.8%(+26.1)#1,234 |
| 95. | 02144 | 40.8% | 25.6%(+15.2)#95 | 14.8%(+26.0)#1,241 |
| 96. | 01460 | 40.8% | 25.6%(+15.2)#96 | 14.8%(+26.0)#1,247 |
| 97. | 01845 | 40.7% | 25.6%(+15.1)#97 | 14.8%(+25.9)#1,253 |
| 98. | 02127 | 40.2% | 25.6%(+14.6)#98 | 14.8%(+25.4)#1,286 |
| 99. | 01590 | 39.8% | 25.6%(+14.2)#99 | 14.8%(+25.0)#1,334 |
| 100. | 02038 | 39.6% | 25.6%(+14.0)#100 | 14.8%(+24.8)#1,346 |
Common Questions
What are the Top 10 Zip Codes with the Highest Percentage of Families with Income Above $200,000 in Massachusetts?
Top 10 Zip Codes with the Highest Percentage of Families with Income Above $200,000 in Massachusetts are:
What zip code has the Highest Percentage of Families with Income Above $200,000 in Massachusetts?
01063 has the Highest Percentage of Families with Income Above $200,000 in Massachusetts with 100.0%.
What is the Percentage of Families with Income Above $200,000 in the State of Massachusetts?
Percentage of Families with Income Above $200,000 in Massachusetts is 25.6%.
What is the Percentage of Families with Income Above $200,000 in the United States?
Percentage of Families with Income Above $200,000 in the United States is 14.8%.