Zip Codes with the Highest Percentage of Population Employed in Accommodation & Food Services in Waltham, MA
RELATED REPORTS & OPTIONS
Accommodation & Food Services
Waltham
Compare Zip Codes
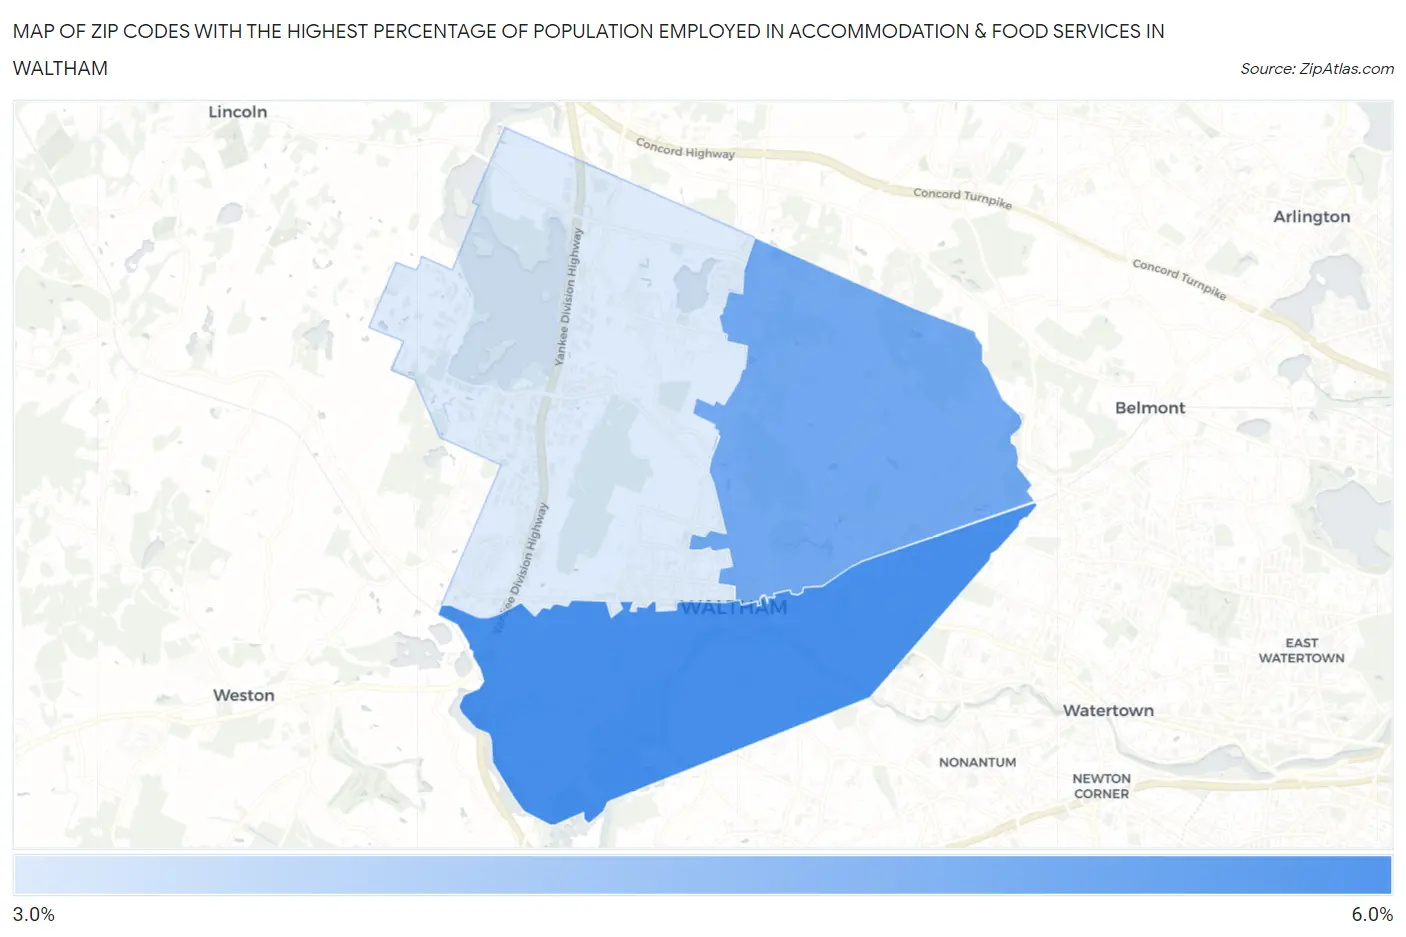
Map of Zip Codes with the Highest Percentage of Population Employed in Accommodation & Food Services in Waltham
4.0%
5.3%
Zip Codes with the Highest Percentage of Population Employed in Accommodation & Food Services in Waltham, MA
| Zip Code | % Employed | vs State | vs National | |
| 1. | 02453 | 5.3% | 5.8%(-0.469)#228 | 6.9%(-1.59)#15,807 |
| 2. | 02452 | 4.9% | 5.8%(-0.830)#254 | 6.9%(-1.95)#17,047 |
| 3. | 02451 | 4.0% | 5.8%(-1.78)#327 | 6.9%(-2.90)#20,210 |
1
Common Questions
What are the Top Zip Codes with the Highest Percentage of Population Employed in Accommodation & Food Services in Waltham, MA?
Top Zip Codes with the Highest Percentage of Population Employed in Accommodation & Food Services in Waltham, MA are:
What zip code has the Highest Percentage of Population Employed in Accommodation & Food Services in Waltham, MA?
02453 has the Highest Percentage of Population Employed in Accommodation & Food Services in Waltham, MA with 5.3%.
What is the Percentage of Population Employed in Accommodation & Food Services in Waltham, MA?
Percentage of Population Employed in Accommodation & Food Services in Waltham is 4.9%.
What is the Percentage of Population Employed in Accommodation & Food Services in Massachusetts?
Percentage of Population Employed in Accommodation & Food Services in Massachusetts is 5.8%.
What is the Percentage of Population Employed in Accommodation & Food Services in the United States?
Percentage of Population Employed in Accommodation & Food Services in the United States is 6.9%.