Seconsett Island, MA Map & Demographics
Seconsett Island Map
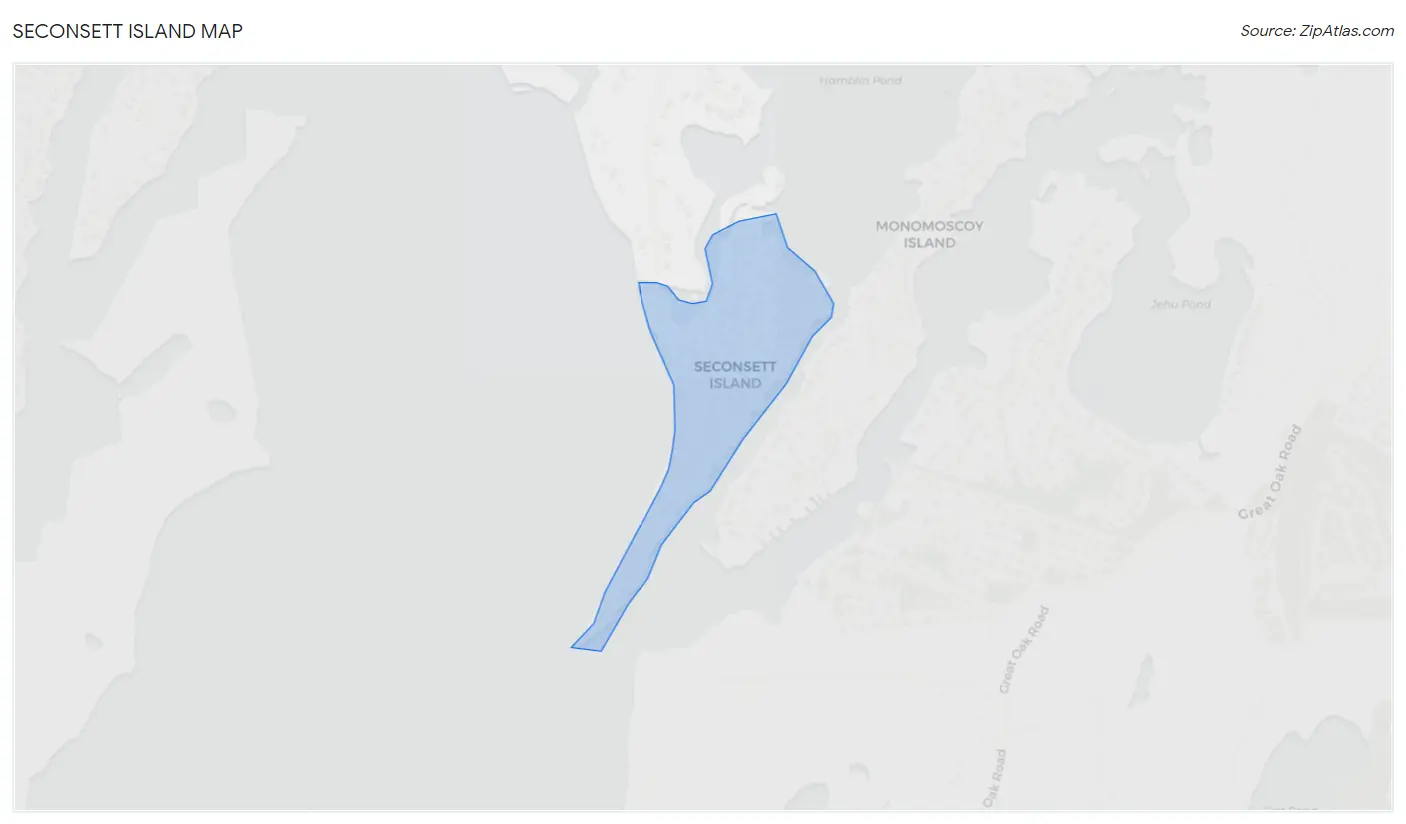
Seconsett Island Overview
$37,686
PER CAPITA INCOME
$122,708
AVG FAMILY INCOME
0.31
INEQUALITY / GINI INDEX
137
TOTAL POPULATION
45
MALE POPULATION
92
FEMALE POPULATION
48.91
MALES / 100 FEMALES
204.44
FEMALES / 100 MALES
50.4
MEDIAN AGE
3.5
AVG FAMILY SIZE
2.5
AVG HOUSEHOLD SIZE
53
LABOR FORCE [ PEOPLE ]
52.5%
PERCENT IN LABOR FORCE
15.1%
UNEMPLOYMENT RATE
Income in Seconsett Island
Income Overview in Seconsett Island
| Characteristic | Number | Measure |
| Per Capita Income | 137 | $37,686 |
| Median Family Income | 31 | $122,708 |
| Mean Family Income | 31 | $117,310 |
| Median Household Income | 54 | $0 |
| Mean Household Income | 54 | $95,511 |
| Income Deficit | 31 | $0 |
| Wage / Income Gap (%) | 137 | 0.00% |
| Wage / Income Gap ($) | 137 | 100.00¢ per $1 |
| Gini / Inequality Index | 137 | 0.31 |
Earnings by Sex in Seconsett Island
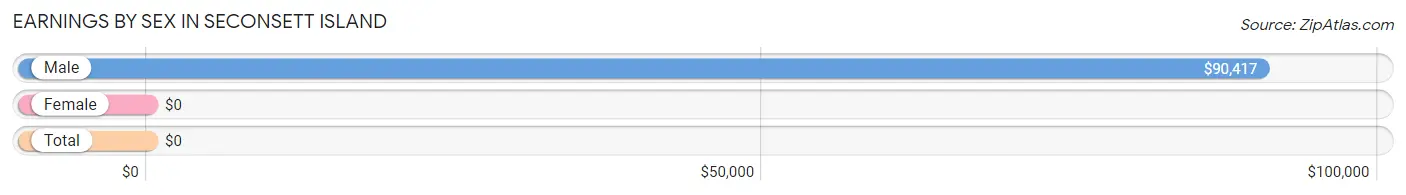
| Sex | Number | Average Earnings |
| Male | 30 (56.6%) | $90,417 |
| Female | 23 (43.4%) | $0 |
| Total | 53 (100.0%) | $0 |
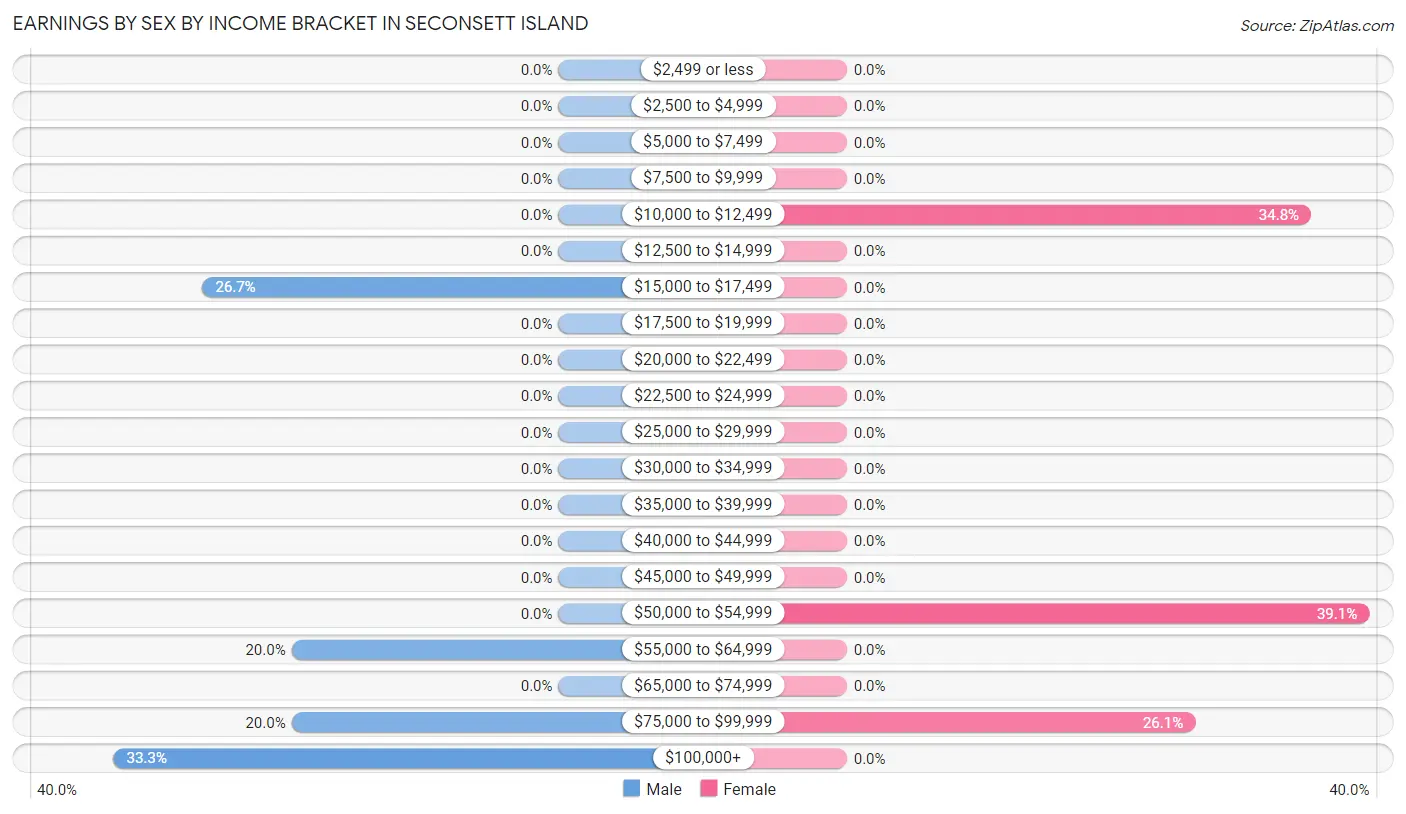
Earnings by Sex by Income Bracket in Seconsett Island
The most common earnings brackets in Seconsett Island are $100,000+ for men (10 | 33.3%) and $50,000 to $54,999 for women (9 | 39.1%).
| Income | Male | Female |
| $2,499 or less | 0 (0.0%) | 0 (0.0%) |
| $2,500 to $4,999 | 0 (0.0%) | 0 (0.0%) |
| $5,000 to $7,499 | 0 (0.0%) | 0 (0.0%) |
| $7,500 to $9,999 | 0 (0.0%) | 0 (0.0%) |
| $10,000 to $12,499 | 0 (0.0%) | 8 (34.8%) |
| $12,500 to $14,999 | 0 (0.0%) | 0 (0.0%) |
| $15,000 to $17,499 | 8 (26.7%) | 0 (0.0%) |
| $17,500 to $19,999 | 0 (0.0%) | 0 (0.0%) |
| $20,000 to $22,499 | 0 (0.0%) | 0 (0.0%) |
| $22,500 to $24,999 | 0 (0.0%) | 0 (0.0%) |
| $25,000 to $29,999 | 0 (0.0%) | 0 (0.0%) |
| $30,000 to $34,999 | 0 (0.0%) | 0 (0.0%) |
| $35,000 to $39,999 | 0 (0.0%) | 0 (0.0%) |
| $40,000 to $44,999 | 0 (0.0%) | 0 (0.0%) |
| $45,000 to $49,999 | 0 (0.0%) | 0 (0.0%) |
| $50,000 to $54,999 | 0 (0.0%) | 9 (39.1%) |
| $55,000 to $64,999 | 6 (20.0%) | 0 (0.0%) |
| $65,000 to $74,999 | 0 (0.0%) | 0 (0.0%) |
| $75,000 to $99,999 | 6 (20.0%) | 6 (26.1%) |
| $100,000+ | 10 (33.3%) | 0 (0.0%) |
| Total | 30 (100.0%) | 23 (100.0%) |
Earnings by Sex by Educational Attainment in Seconsett Island
| Educational Attainment | Male Income | Female Income |
| Less than High School | - | - |
| High School Diploma | - | - |
| College or Associate's Degree | - | - |
| Bachelor's Degree | - | - |
| Graduate Degree | - | - |
| Total | $90,417 | $0 |
Family Income in Seconsett Island
Family Income Brackets in Seconsett Island
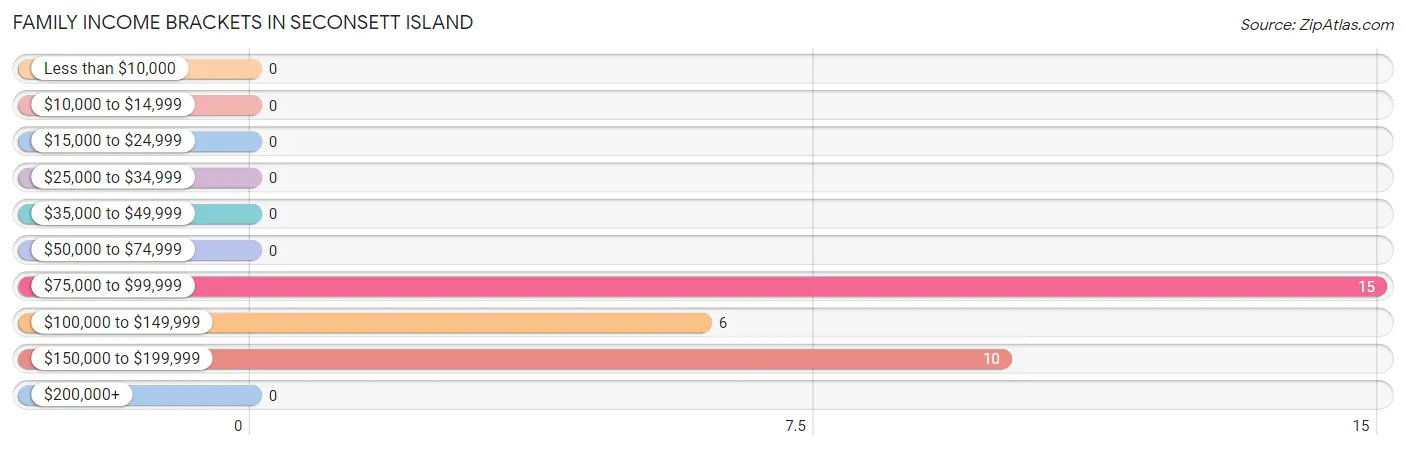
According to the Seconsett Island family income data, there are 15 families falling into the $75,000 to $99,999 income range, which is the most common income bracket and makes up 48.4% of all families.
| Income Bracket | # Families | % Families |
| Less than $10,000 | 0 | 0.0% |
| $10,000 to $14,999 | 0 | 0.0% |
| $15,000 to $24,999 | 0 | 0.0% |
| $25,000 to $34,999 | 0 | 0.0% |
| $35,000 to $49,999 | 0 | 0.0% |
| $50,000 to $74,999 | 0 | 0.0% |
| $75,000 to $99,999 | 15 | 48.4% |
| $100,000 to $149,999 | 6 | 19.4% |
| $150,000 to $199,999 | 10 | 32.3% |
| $200,000+ | 0 | 0.0% |
Family Income by Famaliy Size in Seconsett Island
| Income Bracket | # Families | Median Income |
| 2-Person Families | 10 (32.3%) | $0 |
| 3-Person Families | 6 (19.4%) | $0 |
| 4-Person Families | 9 (29.0%) | $0 |
| 5-Person Families | 6 (19.4%) | $0 |
| 6-Person Families | 0 (0.0%) | $0 |
| 7+ Person Families | 0 (0.0%) | $0 |
| Total | 31 (100.0%) | $122,708 |
Family Income by Number of Earners in Seconsett Island
| Number of Earners | # Families | Median Income |
| No Earners | 0 (0.0%) | $0 |
| 1 Earner | 16 (51.6%) | $0 |
| 2 Earners | 15 (48.4%) | $0 |
| 3+ Earners | 0 (0.0%) | $0 |
| Total | 31 (100.0%) | $122,708 |
Household Income in Seconsett Island
Household Income Brackets in Seconsett Island
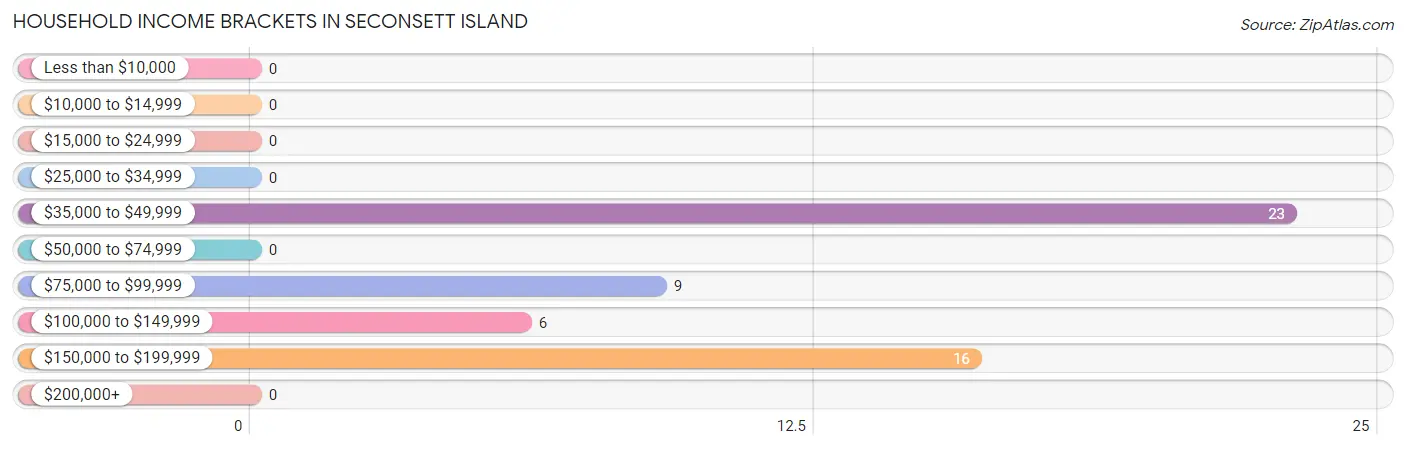
With 23 households falling in the category, the $35,000 to $49,999 income range is the most frequent in Seconsett Island, accounting for 42.6% of all households.
| Income Bracket | # Households | % Households |
| Less than $10,000 | 0 | 0.0% |
| $10,000 to $14,999 | 0 | 0.0% |
| $15,000 to $24,999 | 0 | 0.0% |
| $25,000 to $34,999 | 0 | 0.0% |
| $35,000 to $49,999 | 23 | 42.6% |
| $50,000 to $74,999 | 0 | 0.0% |
| $75,000 to $99,999 | 9 | 16.7% |
| $100,000 to $149,999 | 6 | 11.1% |
| $150,000 to $199,999 | 16 | 29.6% |
| $200,000+ | 0 | 0.0% |
Household Income by Householder Age in Seconsett Island
| Income Bracket | # Households | Median Income |
| 15 to 24 Years | 0 (0.0%) | $0 |
| 25 to 44 Years | 6 (11.1%) | $0 |
| 45 to 64 Years | 9 (16.7%) | $0 |
| 65+ Years | 39 (72.2%) | $0 |
| Total | 54 (100.0%) | $0 |
Poverty in Seconsett Island
Income Below Poverty by Sex and Age in Seconsett Island
| Age Bracket | Male | Female |
| Under 5 Years | 0 (0.0%) | 0 (0.0%) |
| 5 Years | 0 (0.0%) | 0 (0.0%) |
| 6 to 11 Years | 0 (0.0%) | 0 (0.0%) |
| 12 to 14 Years | 0 (0.0%) | 0 (0.0%) |
| 15 Years | 0 (0.0%) | 0 (0.0%) |
| 16 and 17 Years | 0 (0.0%) | 0 (0.0%) |
| 18 to 24 Years | 0 (0.0%) | 0 (0.0%) |
| 25 to 34 Years | 0 (0.0%) | 0 (0.0%) |
| 35 to 44 Years | 0 (0.0%) | 0 (0.0%) |
| 45 to 54 Years | 0 (0.0%) | 0 (0.0%) |
| 55 to 64 Years | 0 (0.0%) | 0 (0.0%) |
| 65 to 74 Years | 0 (0.0%) | 0 (0.0%) |
| 75 Years and over | 0 (0.0%) | 0 (0.0%) |
| Total | 0 (0.0%) | 0 (0.0%) |
Income Above Poverty by Sex and Age in Seconsett Island
According to the poverty statistics in Seconsett Island, males aged 6 to 11 years and females aged under 5 years are the age groups that are most secure financially, with 100.0% of males and 100.0% of females in these age groups living above the poverty line.
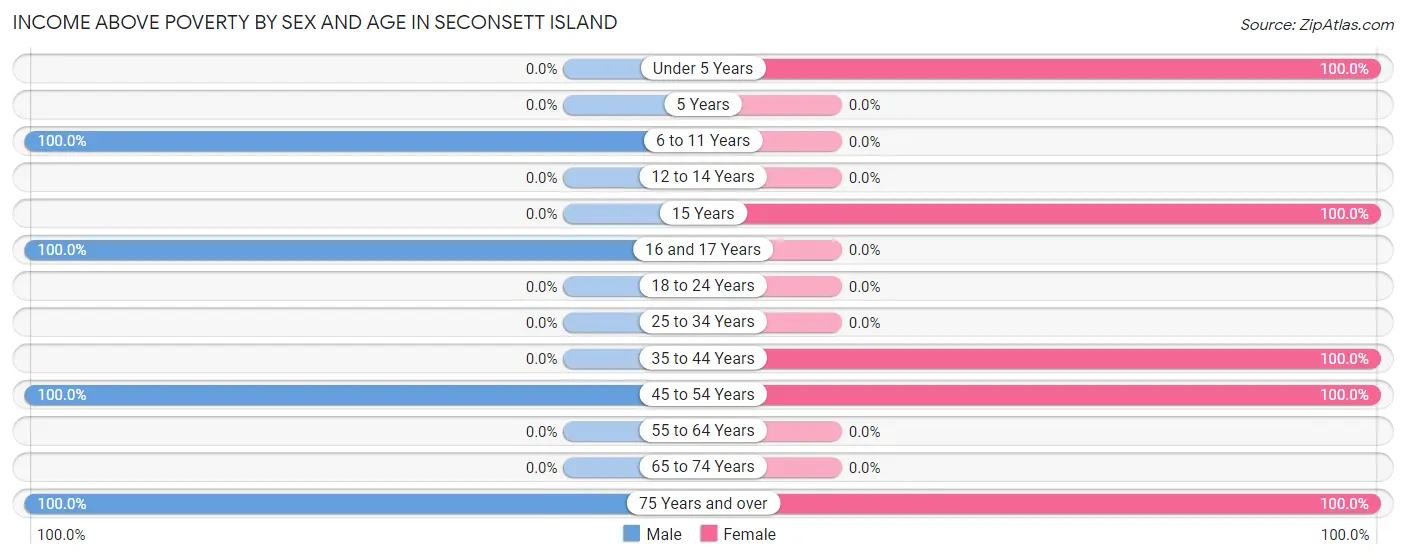
| Age Bracket | Male | Female |
| Under 5 Years | 0 (0.0%) | 21 (100.0%) |
| 5 Years | 0 (0.0%) | 0 (0.0%) |
| 6 to 11 Years | 6 (100.0%) | 0 (0.0%) |
| 12 to 14 Years | 0 (0.0%) | 0 (0.0%) |
| 15 Years | 0 (0.0%) | 9 (100.0%) |
| 16 and 17 Years | 9 (100.0%) | 0 (0.0%) |
| 18 to 24 Years | 0 (0.0%) | 0 (0.0%) |
| 25 to 34 Years | 0 (0.0%) | 0 (0.0%) |
| 35 to 44 Years | 0 (0.0%) | 14 (100.0%) |
| 45 to 54 Years | 14 (100.0%) | 9 (100.0%) |
| 55 to 64 Years | 0 (0.0%) | 0 (0.0%) |
| 65 to 74 Years | 0 (0.0%) | 0 (0.0%) |
| 75 Years and over | 16 (100.0%) | 39 (100.0%) |
| Total | 45 (100.0%) | 92 (100.0%) |
Income Below Poverty Among Married-Couple Families in Seconsett Island
| Children | Above Poverty | Below Poverty |
| No Children | 10 (100.0%) | 0 (0.0%) |
| 1 or 2 Children | 15 (100.0%) | 0 (0.0%) |
| 3 or 4 Children | 0 (0.0%) | 0 (0.0%) |
| 5 or more Children | 0 (0.0%) | 0 (0.0%) |
| Total | 25 (100.0%) | 0 (0.0%) |
Income Below Poverty Among Single-Parent Households in Seconsett Island
| Children | Single Father | Single Mother |
| No Children | 0 (0.0%) | 0 (0.0%) |
| 1 or 2 Children | 0 (0.0%) | 0 (0.0%) |
| 3 or 4 Children | 0 (0.0%) | 0 (0.0%) |
| 5 or more Children | 0 (0.0%) | 0 (0.0%) |
| Total | 0 (0.0%) | 0 (0.0%) |
Income Below Poverty Among Married-Couple vs Single-Parent Households in Seconsett Island
| Children | Married-Couple Families | Single-Parent Households |
| No Children | 0 (0.0%) | 0 (0.0%) |
| 1 or 2 Children | 0 (0.0%) | 0 (0.0%) |
| 3 or 4 Children | 0 (0.0%) | 0 (0.0%) |
| 5 or more Children | 0 (0.0%) | 0 (0.0%) |
| Total | 0 (0.0%) | 0 (0.0%) |
Race in Seconsett Island
The most populous races in Seconsett Island are , and White / Caucasian (137 | 100.0%).
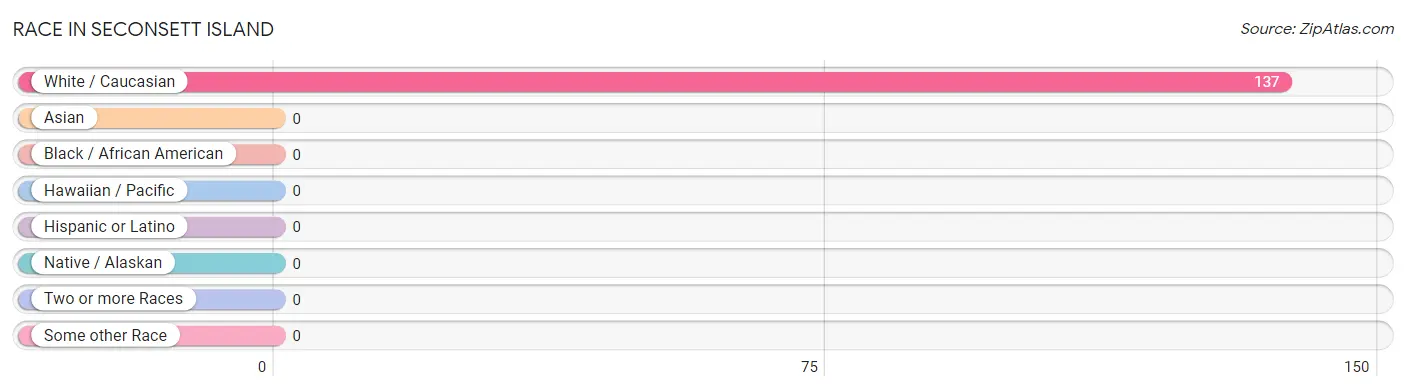
| Race | # Population | % Population |
| Asian | 0 | 0.0% |
| Black / African American | 0 | 0.0% |
| Hawaiian / Pacific | 0 | 0.0% |
| Hispanic or Latino | 0 | 0.0% |
| Native / Alaskan | 0 | 0.0% |
| White / Caucasian | 137 | 100.0% |
| Two or more Races | 0 | 0.0% |
| Some other Race | 0 | 0.0% |
| Total | 137 | 100.0% |
Ancestry in Seconsett Island
The most populous ancestries reported in Seconsett Island are Irish (61 | 44.5%), German (59 | 43.1%), Welsh (23 | 16.8%), French (10 | 7.3%), and French Canadian (10 | 7.3%), together accounting for 119.0% of all Seconsett Island residents.
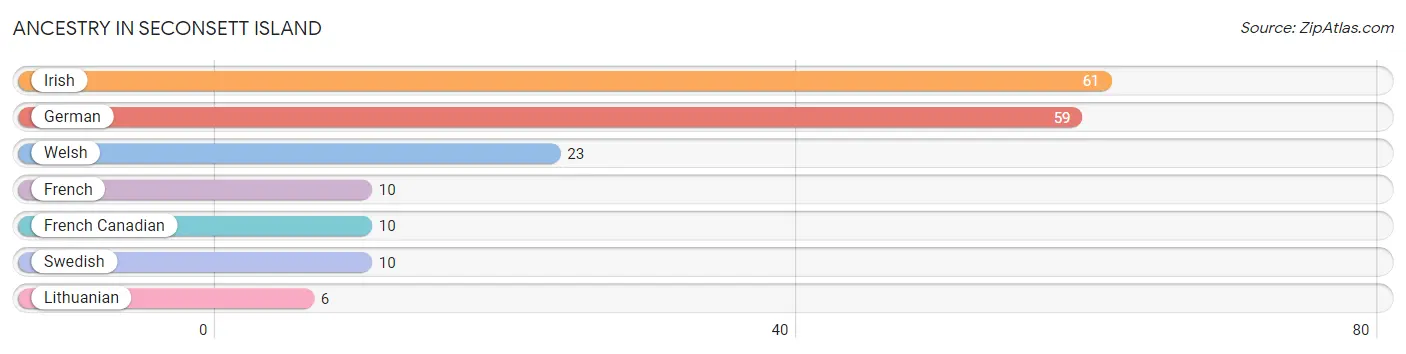
| Ancestry | # Population | % Population |
| French | 10 | 7.3% |
| French Canadian | 10 | 7.3% |
| German | 59 | 43.1% |
| Irish | 61 | 44.5% |
| Lithuanian | 6 | 4.4% |
| Swedish | 10 | 7.3% |
| Welsh | 23 | 16.8% | View All 7 Rows |
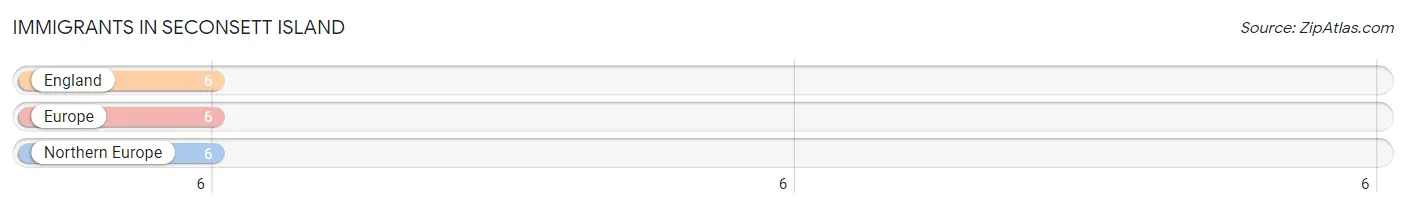
Immigrants in Seconsett Island
The most numerous immigrant groups reported in Seconsett Island came from England (6 | 4.4%), Europe (6 | 4.4%), and Northern Europe (6 | 4.4%), together accounting for 13.1% of all Seconsett Island residents.
| Immigration Origin | # Population | % Population |
| England | 6 | 4.4% |
| Europe | 6 | 4.4% |
| Northern Europe | 6 | 4.4% | View All 3 Rows |
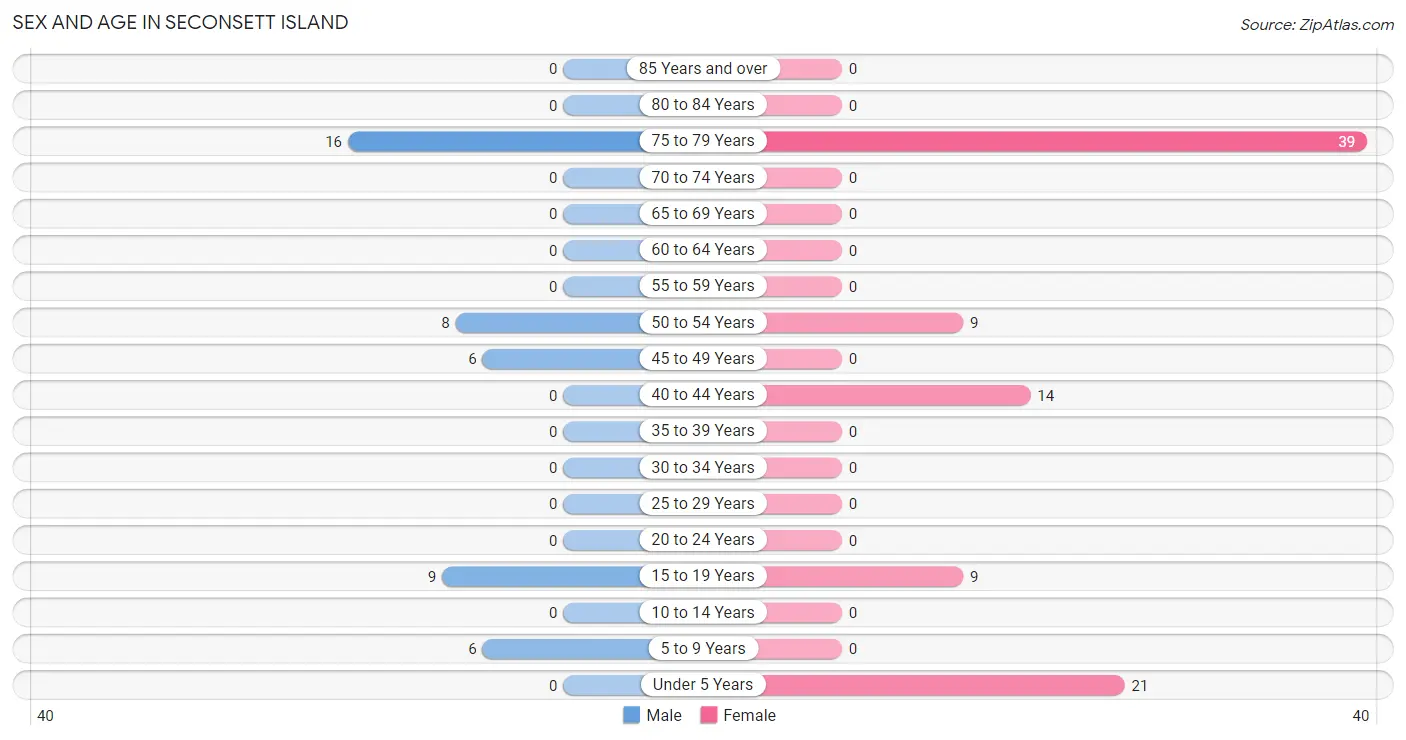
Sex and Age in Seconsett Island
Sex and Age in Seconsett Island
The most populous age groups in Seconsett Island are 75 to 79 Years (16 | 35.6%) for men and 75 to 79 Years (39 | 42.4%) for women.
| Age Bracket | Male | Female |
| Under 5 Years | 0 (0.0%) | 21 (22.8%) |
| 5 to 9 Years | 6 (13.3%) | 0 (0.0%) |
| 10 to 14 Years | 0 (0.0%) | 0 (0.0%) |
| 15 to 19 Years | 9 (20.0%) | 9 (9.8%) |
| 20 to 24 Years | 0 (0.0%) | 0 (0.0%) |
| 25 to 29 Years | 0 (0.0%) | 0 (0.0%) |
| 30 to 34 Years | 0 (0.0%) | 0 (0.0%) |
| 35 to 39 Years | 0 (0.0%) | 0 (0.0%) |
| 40 to 44 Years | 0 (0.0%) | 14 (15.2%) |
| 45 to 49 Years | 6 (13.3%) | 0 (0.0%) |
| 50 to 54 Years | 8 (17.8%) | 9 (9.8%) |
| 55 to 59 Years | 0 (0.0%) | 0 (0.0%) |
| 60 to 64 Years | 0 (0.0%) | 0 (0.0%) |
| 65 to 69 Years | 0 (0.0%) | 0 (0.0%) |
| 70 to 74 Years | 0 (0.0%) | 0 (0.0%) |
| 75 to 79 Years | 16 (35.6%) | 39 (42.4%) |
| 80 to 84 Years | 0 (0.0%) | 0 (0.0%) |
| 85 Years and over | 0 (0.0%) | 0 (0.0%) |
| Total | 45 (100.0%) | 92 (100.0%) |
Families and Households in Seconsett Island
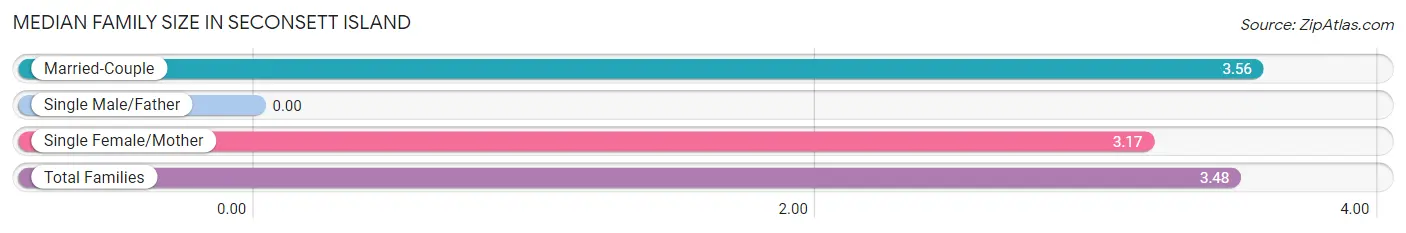
Median Family Size in Seconsett Island
| Family Type | # Families | Family Size |
| Married-Couple | 25 (80.6%) | 3.56 |
| Single Male/Father | 0 (0.0%) | - |
| Single Female/Mother | 6 (19.4%) | 3.17 |
| Total Families | 31 (100.0%) | 3.48 |
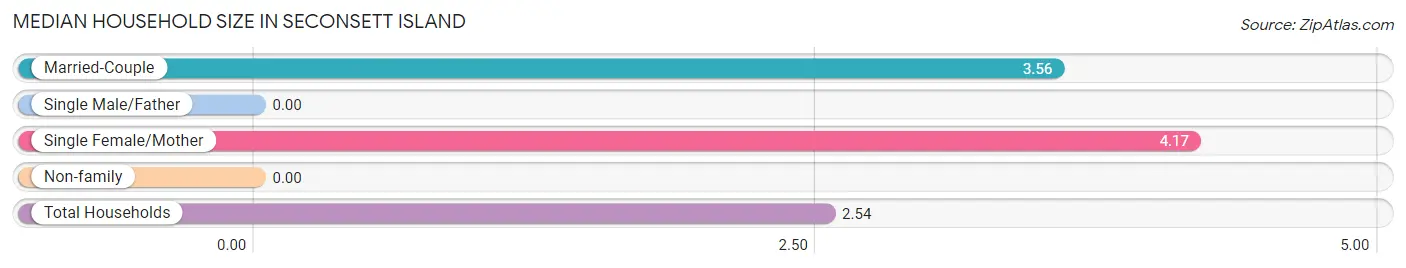
Median Household Size in Seconsett Island
| Household Type | # Households | Household Size |
| Married-Couple | 25 (46.3%) | 3.56 |
| Single Male/Father | 0 (0.0%) | - |
| Single Female/Mother | 6 (11.1%) | 4.17 |
| Non-family | 23 (42.6%) | - |
| Total Households | 54 (100.0%) | 2.54 |
Household Size by Marriage Status in Seconsett Island
Out of a total of 54 households in Seconsett Island, 31 (57.4%) are family households, while 23 (42.6%) are nonfamily households. The most numerous type of family households are 4-person households, comprising 15, and the most common type of nonfamily households are 1-person households, comprising 23.
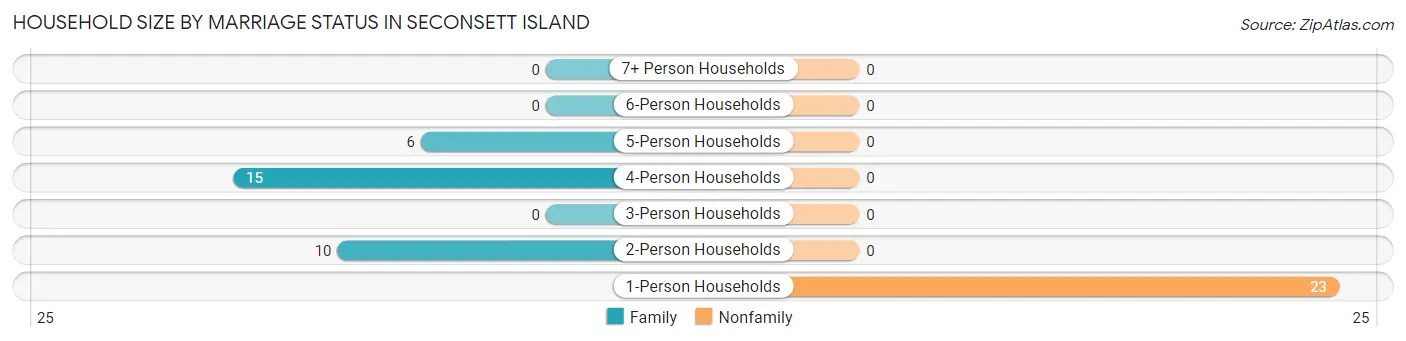
| Household Size | Family Households | Nonfamily Households |
| 1-Person Households | - | 23 (42.6%) |
| 2-Person Households | 10 (18.5%) | 0 (0.0%) |
| 3-Person Households | 0 (0.0%) | 0 (0.0%) |
| 4-Person Households | 15 (27.8%) | 0 (0.0%) |
| 5-Person Households | 6 (11.1%) | 0 (0.0%) |
| 6-Person Households | 0 (0.0%) | 0 (0.0%) |
| 7+ Person Households | 0 (0.0%) | 0 (0.0%) |
| Total | 31 (57.4%) | 23 (42.6%) |
Female Fertility in Seconsett Island
Fertility by Age in Seconsett Island
Average fertility rate in Seconsett Island is 348.0 births per 1,000 women. Women in the age bracket of 35 to 50 years have the highest fertility rate with 571.0 births per 1,000 women. Women in the age bracket of 35 to 50 years acount for 100.0% of all women with births.
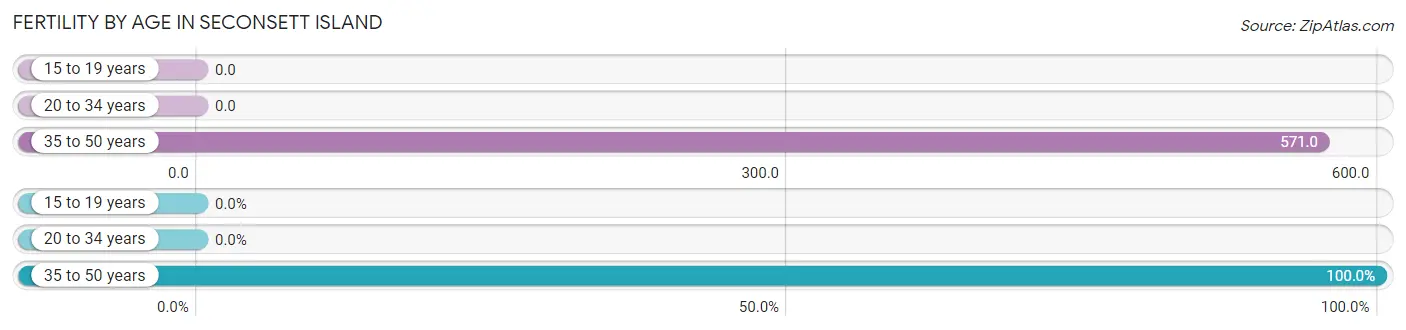
| Age Bracket | Women with Births | Births / 1,000 Women |
| 15 to 19 years | 0 (0.0%) | 0.0 |
| 20 to 34 years | 0 (0.0%) | 0.0 |
| 35 to 50 years | 8 (100.0%) | 571.0 |
| Total | 8 (100.0%) | 348.0 |
Fertility by Age by Marriage Status in Seconsett Island
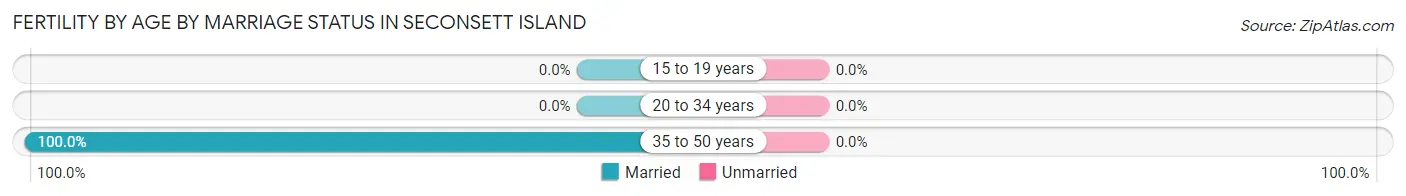
| Age Bracket | Married | Unmarried |
| 15 to 19 years | 0 (0.0%) | 0 (0.0%) |
| 20 to 34 years | 0 (0.0%) | 0 (0.0%) |
| 35 to 50 years | 8 (100.0%) | 0 (0.0%) |
| Total | 8 (100.0%) | 0 (0.0%) |
Fertility by Education in Seconsett Island
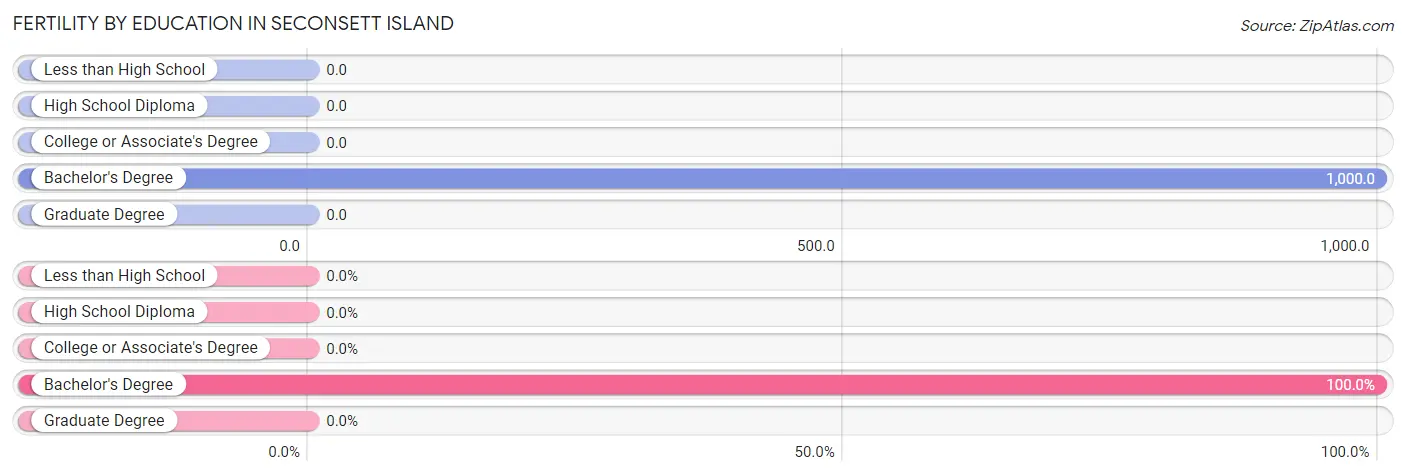
| Educational Attainment | Women with Births | Births / 1,000 Women |
| Less than High School | 0 (0.0%) | 0.0 |
| High School Diploma | 0 (0.0%) | 0.0 |
| College or Associate's Degree | 0 (0.0%) | 0.0 |
| Bachelor's Degree | 8 (100.0%) | 1,000.0 |
| Graduate Degree | 0 (0.0%) | 0.0 |
| Total | 8 (100.0%) | 348.0 |
Fertility by Education by Marriage Status in Seconsett Island
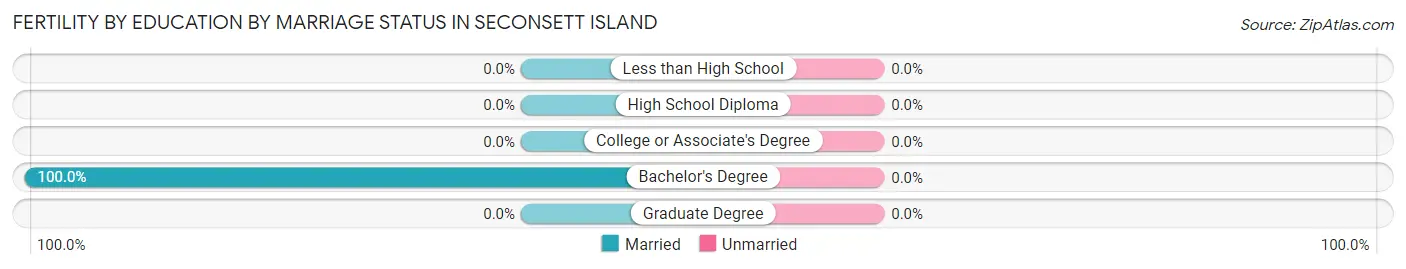
| Educational Attainment | Married | Unmarried |
| Less than High School | 0 (0.0%) | 0 (0.0%) |
| High School Diploma | 0 (0.0%) | 0 (0.0%) |
| College or Associate's Degree | 0 (0.0%) | 0 (0.0%) |
| Bachelor's Degree | 8 (100.0%) | 0 (0.0%) |
| Graduate Degree | 0 (0.0%) | 0 (0.0%) |
| Total | 8 (100.0%) | 0 (0.0%) |
Employment Characteristics in Seconsett Island
Employment by Class of Employer in Seconsett Island
Among the 45 employed individuals in Seconsett Island, private company employees (29 | 64.4%), not-for-profit organizations (10 | 22.2%), and local government employees (6 | 13.3%) make up the most common classes of employment.
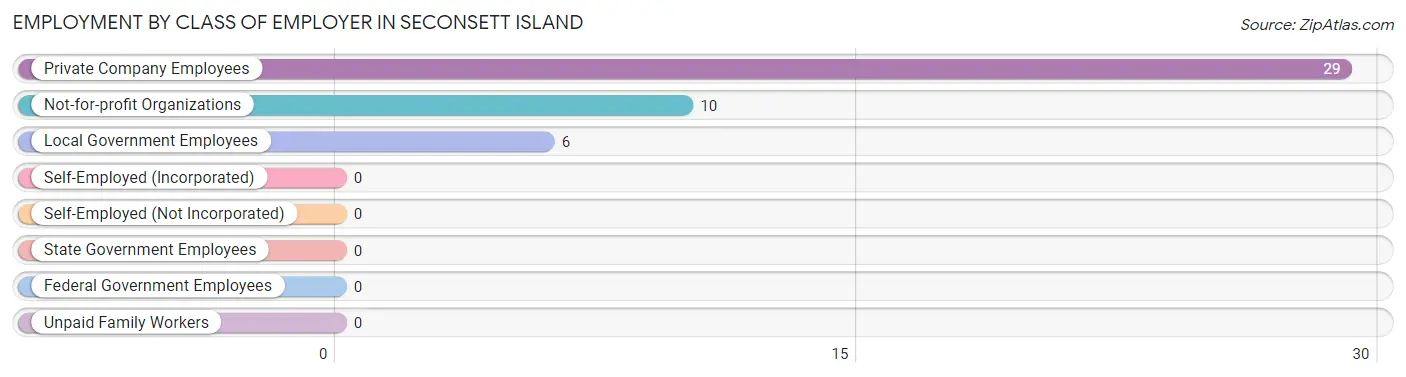
| Employer Class | # Employees | % Employees |
| Private Company Employees | 29 | 64.4% |
| Self-Employed (Incorporated) | 0 | 0.0% |
| Self-Employed (Not Incorporated) | 0 | 0.0% |
| Not-for-profit Organizations | 10 | 22.2% |
| Local Government Employees | 6 | 13.3% |
| State Government Employees | 0 | 0.0% |
| Federal Government Employees | 0 | 0.0% |
| Unpaid Family Workers | 0 | 0.0% |
| Total | 45 | 100.0% |
Employment Status by Age in Seconsett Island
According to the labor force statistics for Seconsett Island, out of the total population over 16 years of age (101), 52.5% or 53 individuals are in the labor force, with 15.1% or 8 of them unemployed. The age group with the highest labor force participation rate is 35 to 44 years, with 100.0% or 14 individuals in the labor force. Within the labor force, the 35 to 44 years age range has the highest percentage of unemployed individuals, with 57.1% or 8 of them being unemployed.
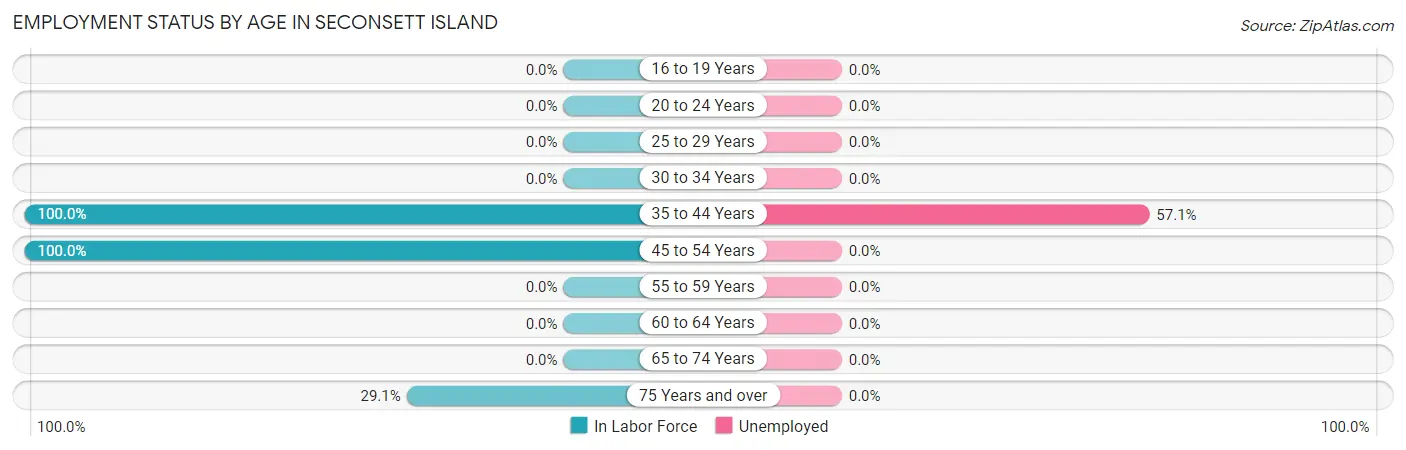
| Age Bracket | In Labor Force | Unemployed |
| 16 to 19 Years | 0 (0.0%) | 0 (0.0%) |
| 20 to 24 Years | 0 (0.0%) | 0 (0.0%) |
| 25 to 29 Years | 0 (0.0%) | 0 (0.0%) |
| 30 to 34 Years | 0 (0.0%) | 0 (0.0%) |
| 35 to 44 Years | 14 (100.0%) | 8 (57.1%) |
| 45 to 54 Years | 23 (100.0%) | 0 (0.0%) |
| 55 to 59 Years | 0 (0.0%) | 0 (0.0%) |
| 60 to 64 Years | 0 (0.0%) | 0 (0.0%) |
| 65 to 74 Years | 0 (0.0%) | 0 (0.0%) |
| 75 Years and over | 16 (29.1%) | 0 (0.0%) |
| Total | 53 (52.5%) | 8 (15.1%) |
Employment Status by Educational Attainment in Seconsett Island
According to labor force statistics for Seconsett Island, 100.0% of individuals (37) out of the total population between 25 and 64 years of age (37) are in the labor force, with 21.6% or 8 of them being unemployed. The group with the highest labor force participation rate are those with the educational attainment of high school diploma, with 100.0% or 8 individuals in the labor force. Within the labor force, individuals with bachelor's degree or higher education have the highest percentage of unemployment, with 27.6% or 8 of them being unemployed.
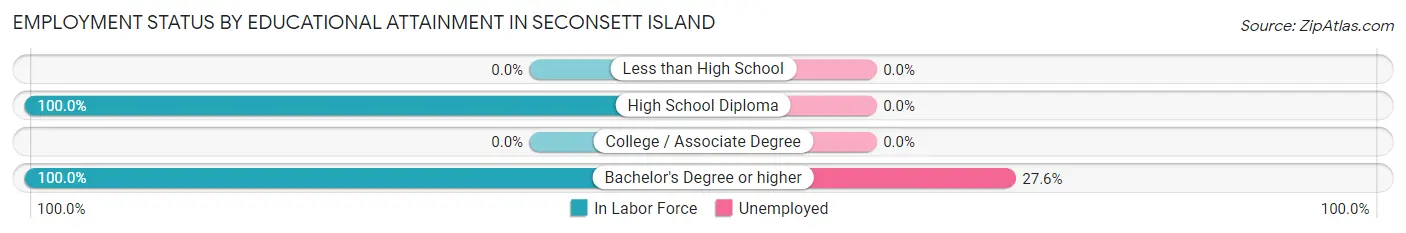
| Educational Attainment | In Labor Force | Unemployed |
| Less than High School | 0 (0.0%) | 0 (0.0%) |
| High School Diploma | 8 (100.0%) | 0 (0.0%) |
| College / Associate Degree | 0 (0.0%) | 0 (0.0%) |
| Bachelor's Degree or higher | 29 (100.0%) | 8 (27.6%) |
| Total | 37 (100.0%) | 8 (21.6%) |
Employment Occupations by Sex in Seconsett Island
Management, Business, Science and Arts Occupations
The most common Management, Business, Science and Arts occupations in Seconsett Island are , and Management (31 | 68.9%).
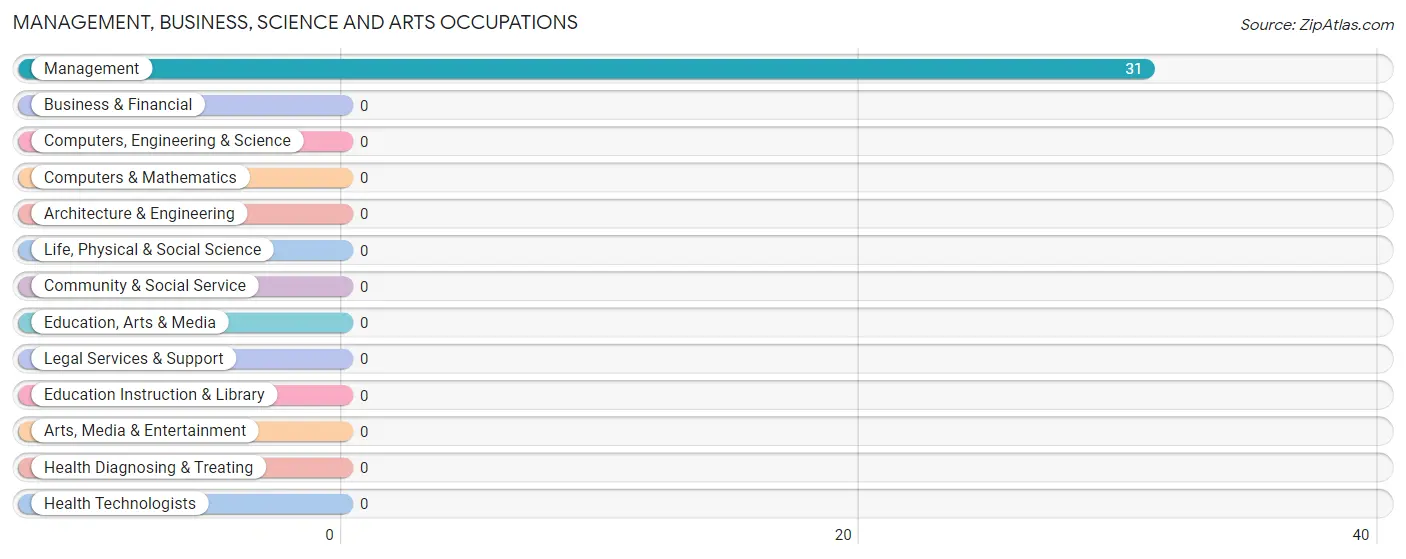
Management, Business, Science and Arts Occupations by Sex
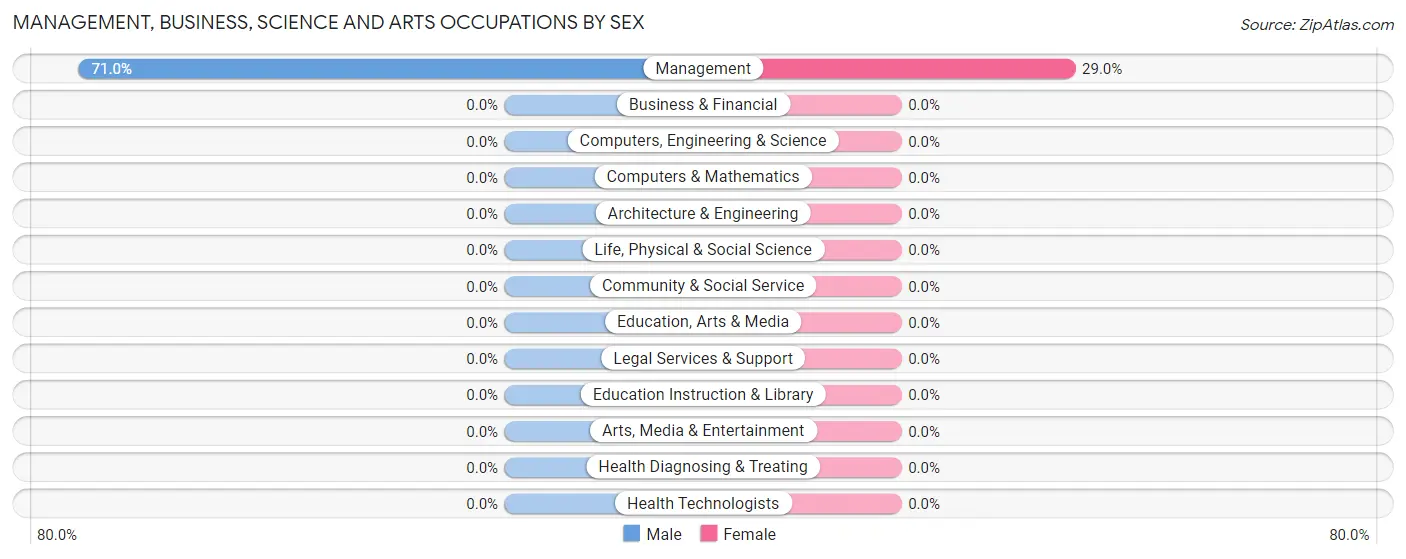
| Occupation | Male | Female |
| Management | 22 (71.0%) | 9 (29.0%) |
| Business & Financial | 0 (0.0%) | 0 (0.0%) |
| Computers, Engineering & Science | 0 (0.0%) | 0 (0.0%) |
| Computers & Mathematics | 0 (0.0%) | 0 (0.0%) |
| Architecture & Engineering | 0 (0.0%) | 0 (0.0%) |
| Life, Physical & Social Science | 0 (0.0%) | 0 (0.0%) |
| Community & Social Service | 0 (0.0%) | 0 (0.0%) |
| Education, Arts & Media | 0 (0.0%) | 0 (0.0%) |
| Legal Services & Support | 0 (0.0%) | 0 (0.0%) |
| Education Instruction & Library | 0 (0.0%) | 0 (0.0%) |
| Arts, Media & Entertainment | 0 (0.0%) | 0 (0.0%) |
| Health Diagnosing & Treating | 0 (0.0%) | 0 (0.0%) |
| Health Technologists | 0 (0.0%) | 0 (0.0%) |
| Total (Category) | 22 (71.0%) | 9 (29.0%) |
| Total (Overall) | 30 (66.7%) | 15 (33.3%) |
Services Occupations
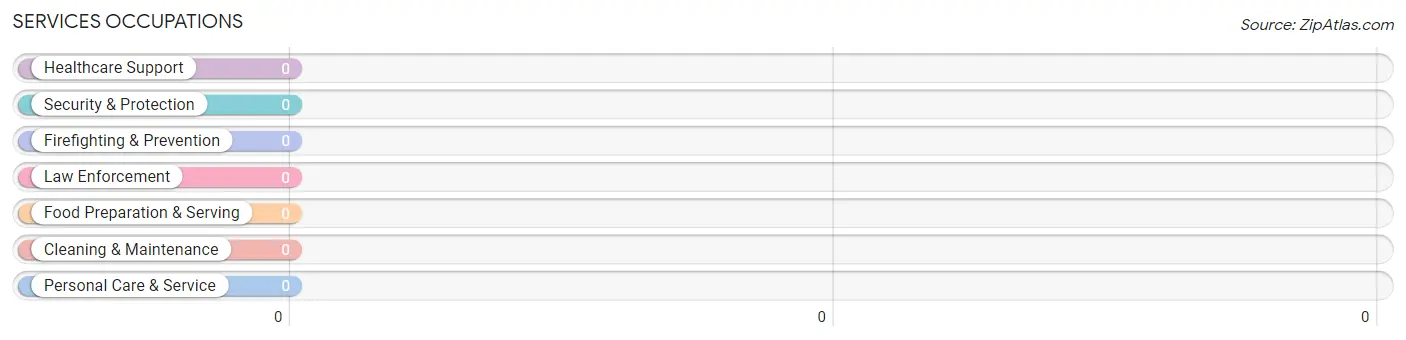
Services Occupations by Sex
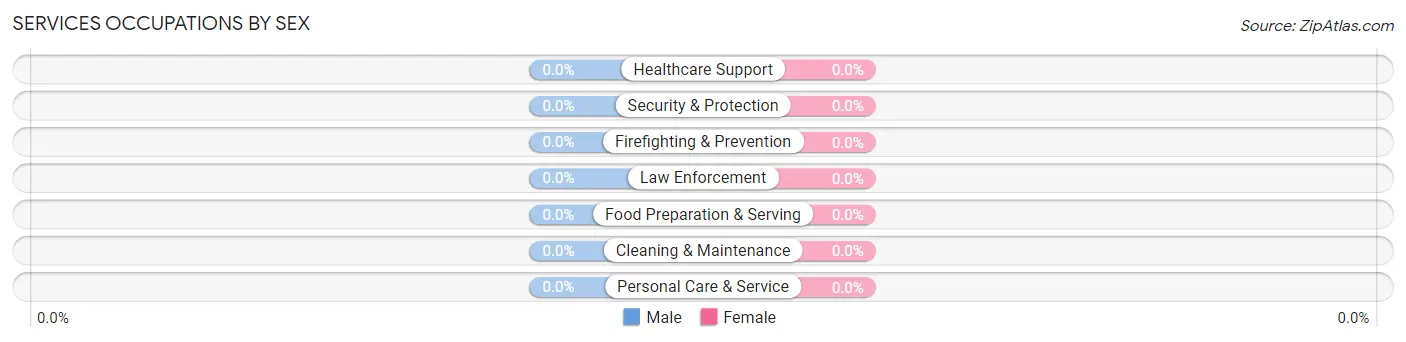
| Occupation | Male | Female |
| Healthcare Support | 0 (0.0%) | 0 (0.0%) |
| Security & Protection | 0 (0.0%) | 0 (0.0%) |
| Firefighting & Prevention | 0 (0.0%) | 0 (0.0%) |
| Law Enforcement | 0 (0.0%) | 0 (0.0%) |
| Food Preparation & Serving | 0 (0.0%) | 0 (0.0%) |
| Cleaning & Maintenance | 0 (0.0%) | 0 (0.0%) |
| Personal Care & Service | 0 (0.0%) | 0 (0.0%) |
| Total (Category) | 0 (0.0%) | 0 (0.0%) |
| Total (Overall) | 30 (66.7%) | 15 (33.3%) |
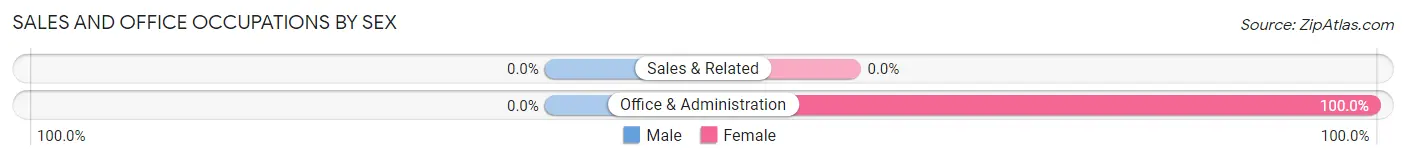
Sales and Office Occupations
The most common Sales and Office occupations in Seconsett Island are , and Office & Administration (6 | 13.3%).
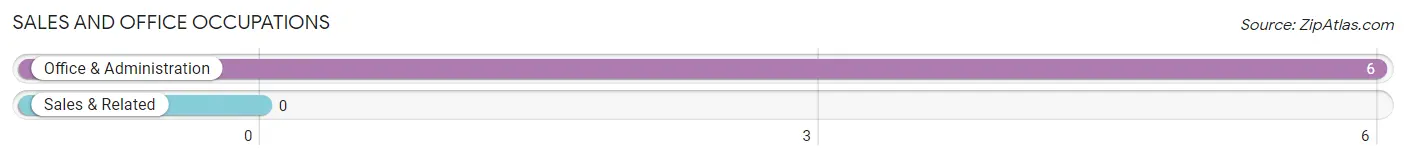
Sales and Office Occupations by Sex
| Occupation | Male | Female |
| Sales & Related | 0 (0.0%) | 0 (0.0%) |
| Office & Administration | 0 (0.0%) | 6 (100.0%) |
| Total (Category) | 0 (0.0%) | 6 (100.0%) |
| Total (Overall) | 30 (66.7%) | 15 (33.3%) |
Natural Resources, Construction and Maintenance Occupations
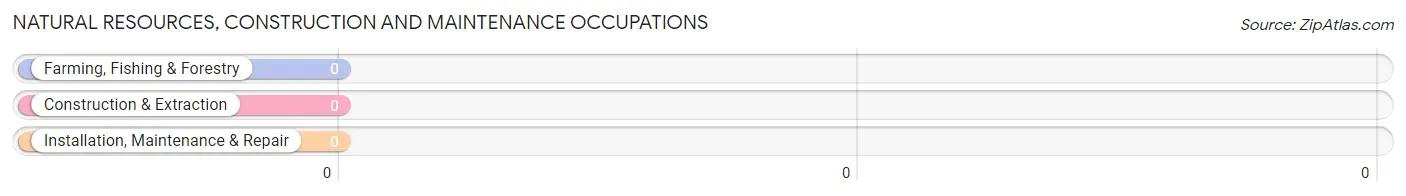
Natural Resources, Construction and Maintenance Occupations by Sex
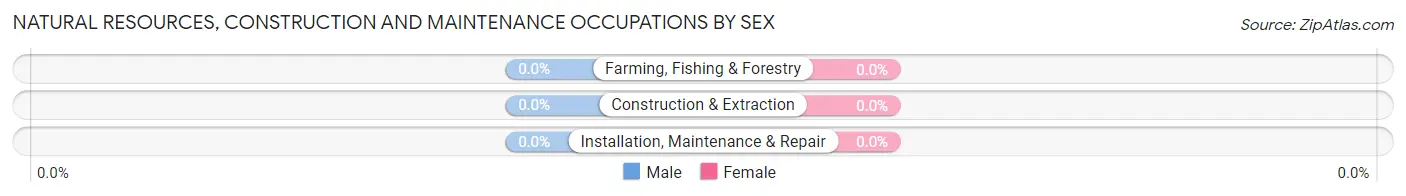
| Occupation | Male | Female |
| Farming, Fishing & Forestry | 0 (0.0%) | 0 (0.0%) |
| Construction & Extraction | 0 (0.0%) | 0 (0.0%) |
| Installation, Maintenance & Repair | 0 (0.0%) | 0 (0.0%) |
| Total (Category) | 0 (0.0%) | 0 (0.0%) |
| Total (Overall) | 30 (66.7%) | 15 (33.3%) |
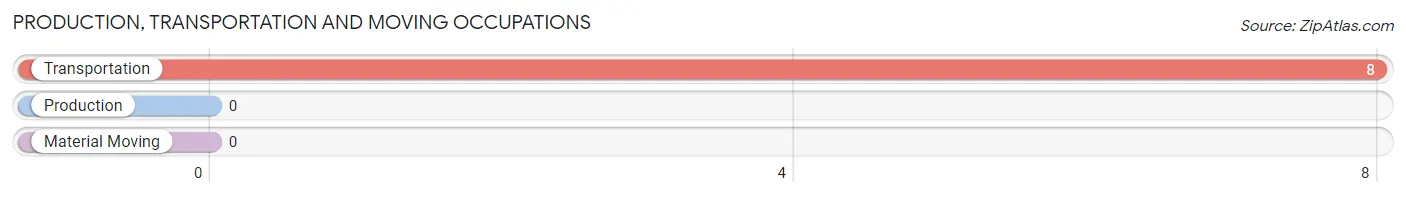
Production, Transportation and Moving Occupations
The most common Production, Transportation and Moving occupations in Seconsett Island are , and Transportation (8 | 17.8%).
Production, Transportation and Moving Occupations by Sex
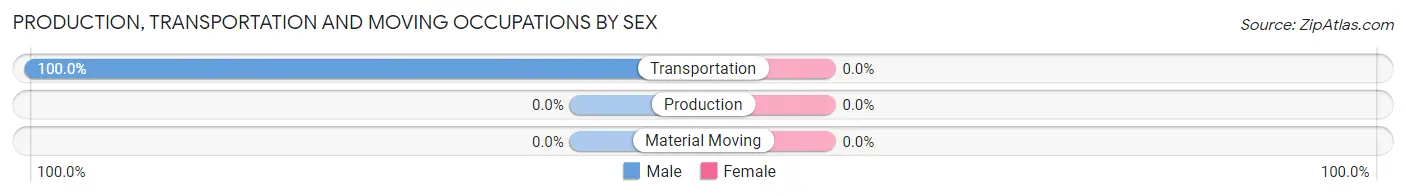
| Occupation | Male | Female |
| Production | 0 (0.0%) | 0 (0.0%) |
| Transportation | 8 (100.0%) | 0 (0.0%) |
| Material Moving | 0 (0.0%) | 0 (0.0%) |
| Total (Category) | 8 (100.0%) | 0 (0.0%) |
| Total (Overall) | 30 (66.7%) | 15 (33.3%) |
Employment Industries by Sex in Seconsett Island
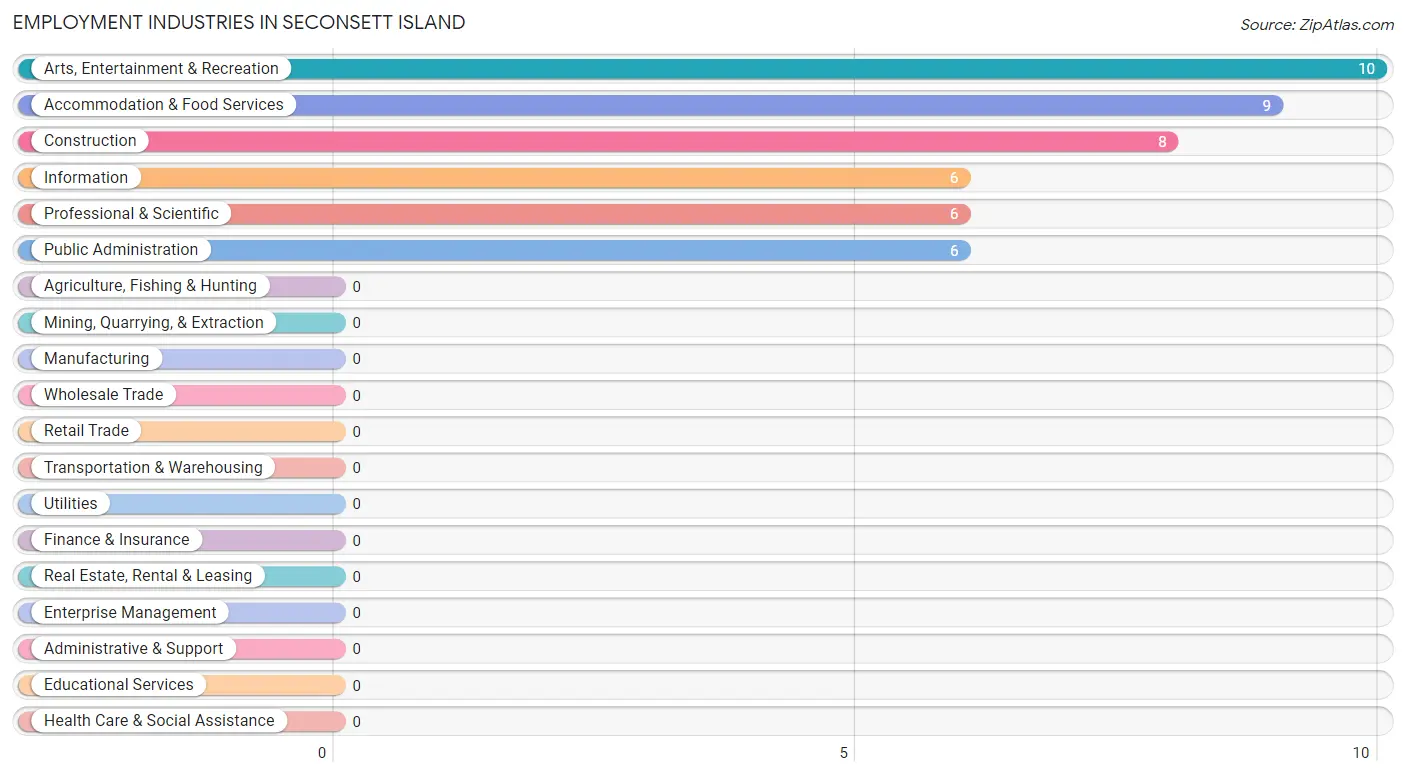
Employment Industries in Seconsett Island
The major employment industries in Seconsett Island include Arts, Entertainment & Recreation (10 | 22.2%), Accommodation & Food Services (9 | 20.0%), Construction (8 | 17.8%), Information (6 | 13.3%), and Professional & Scientific (6 | 13.3%).
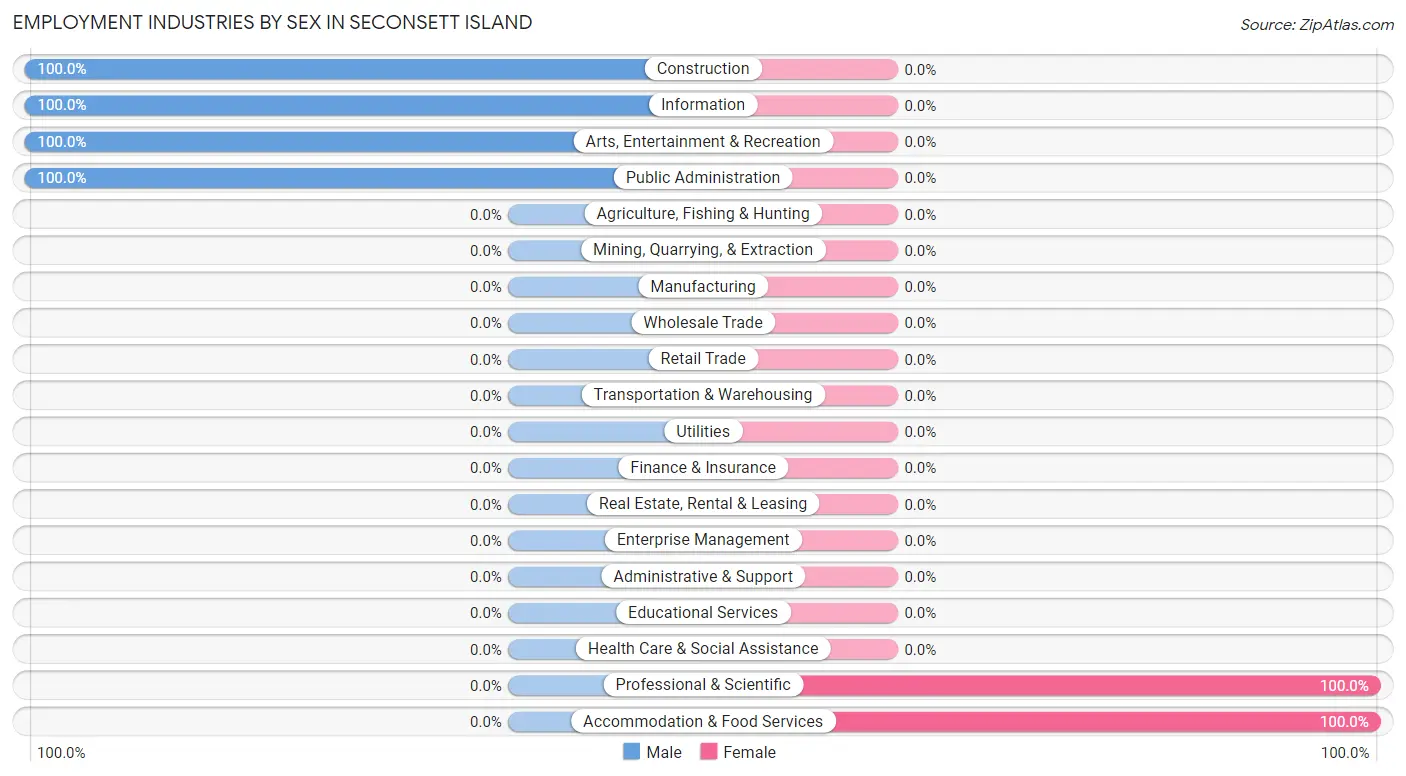
Employment Industries by Sex in Seconsett Island
The Seconsett Island industries that see more men than women are Construction (100.0%), Information (100.0%), and Arts, Entertainment & Recreation (100.0%), whereas the industries that tend to have a higher number of women are Professional & Scientific (100.0%), and Accommodation & Food Services (100.0%).
| Industry | Male | Female |
| Agriculture, Fishing & Hunting | 0 (0.0%) | 0 (0.0%) |
| Mining, Quarrying, & Extraction | 0 (0.0%) | 0 (0.0%) |
| Construction | 8 (100.0%) | 0 (0.0%) |
| Manufacturing | 0 (0.0%) | 0 (0.0%) |
| Wholesale Trade | 0 (0.0%) | 0 (0.0%) |
| Retail Trade | 0 (0.0%) | 0 (0.0%) |
| Transportation & Warehousing | 0 (0.0%) | 0 (0.0%) |
| Utilities | 0 (0.0%) | 0 (0.0%) |
| Information | 6 (100.0%) | 0 (0.0%) |
| Finance & Insurance | 0 (0.0%) | 0 (0.0%) |
| Real Estate, Rental & Leasing | 0 (0.0%) | 0 (0.0%) |
| Professional & Scientific | 0 (0.0%) | 6 (100.0%) |
| Enterprise Management | 0 (0.0%) | 0 (0.0%) |
| Administrative & Support | 0 (0.0%) | 0 (0.0%) |
| Educational Services | 0 (0.0%) | 0 (0.0%) |
| Health Care & Social Assistance | 0 (0.0%) | 0 (0.0%) |
| Arts, Entertainment & Recreation | 10 (100.0%) | 0 (0.0%) |
| Accommodation & Food Services | 0 (0.0%) | 9 (100.0%) |
| Public Administration | 6 (100.0%) | 0 (0.0%) |
| Total | 30 (66.7%) | 15 (33.3%) |
Education in Seconsett Island
School Enrollment in Seconsett Island
The most common levels of schooling among the 31 students in Seconsett Island are high school (18 | 58.1%), nursery / preschool (7 | 22.6%), and kindergarten (6 | 19.4%).
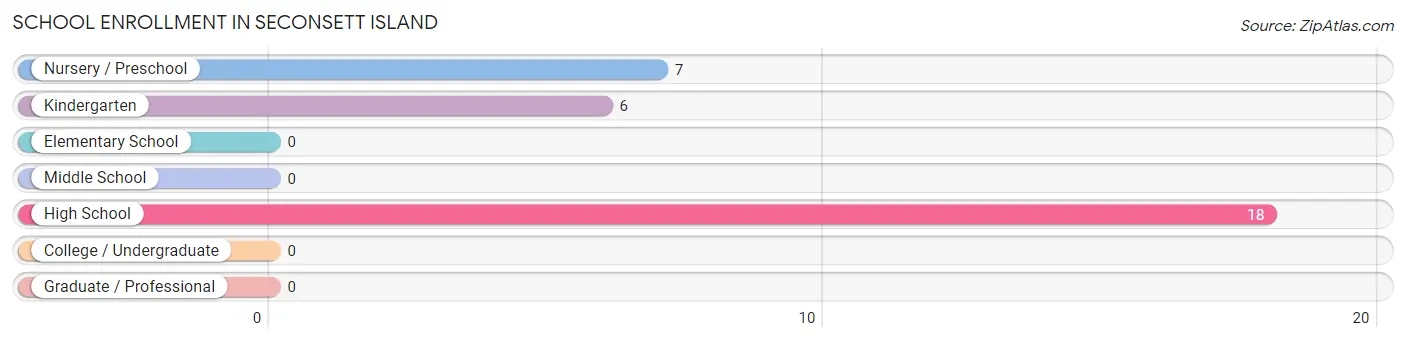
| School Level | # Students | % Students |
| Nursery / Preschool | 7 | 22.6% |
| Kindergarten | 6 | 19.4% |
| Elementary School | 0 | 0.0% |
| Middle School | 0 | 0.0% |
| High School | 18 | 58.1% |
| College / Undergraduate | 0 | 0.0% |
| Graduate / Professional | 0 | 0.0% |
| Total | 31 | 100.0% |
School Enrollment by Age by Funding Source in Seconsett Island
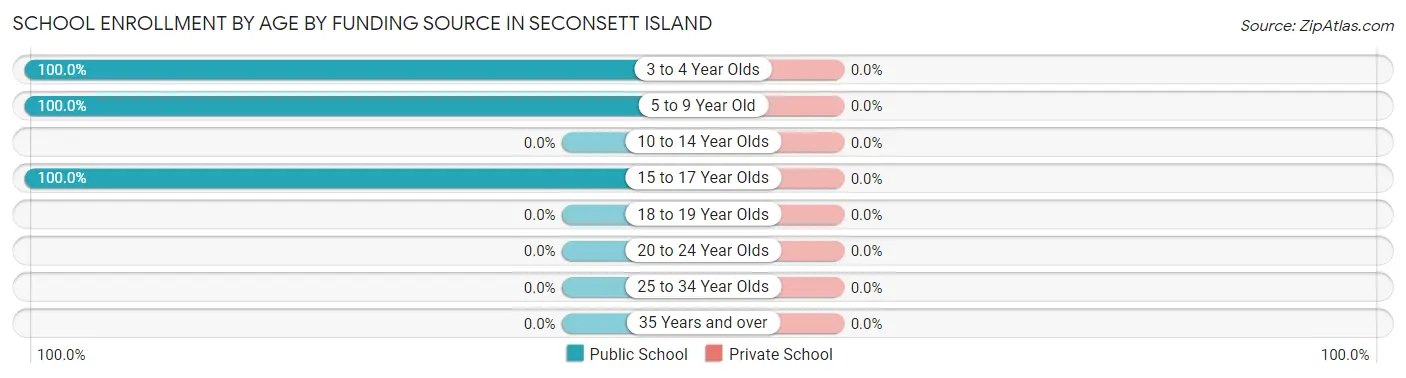
| Age Bracket | Public School | Private School |
| 3 to 4 Year Olds | 7 (100.0%) | 0 (0.0%) |
| 5 to 9 Year Old | 6 (100.0%) | 0 (0.0%) |
| 10 to 14 Year Olds | 0 (0.0%) | 0 (0.0%) |
| 15 to 17 Year Olds | 18 (100.0%) | 0 (0.0%) |
| 18 to 19 Year Olds | 0 (0.0%) | 0 (0.0%) |
| 20 to 24 Year Olds | 0 (0.0%) | 0 (0.0%) |
| 25 to 34 Year Olds | 0 (0.0%) | 0 (0.0%) |
| 35 Years and over | 0 (0.0%) | 0 (0.0%) |
| Total | 31 (100.0%) | 0 (0.0%) |
Educational Attainment by Field of Study in Seconsett Island
Education (23 | 33.8%), business (15 | 22.1%), engineering (10 | 14.7%), communications (8 | 11.8%), and physical & health sciences (6 | 8.8%) are the most common fields of study among 68 individuals in Seconsett Island who have obtained a bachelor's degree or higher.
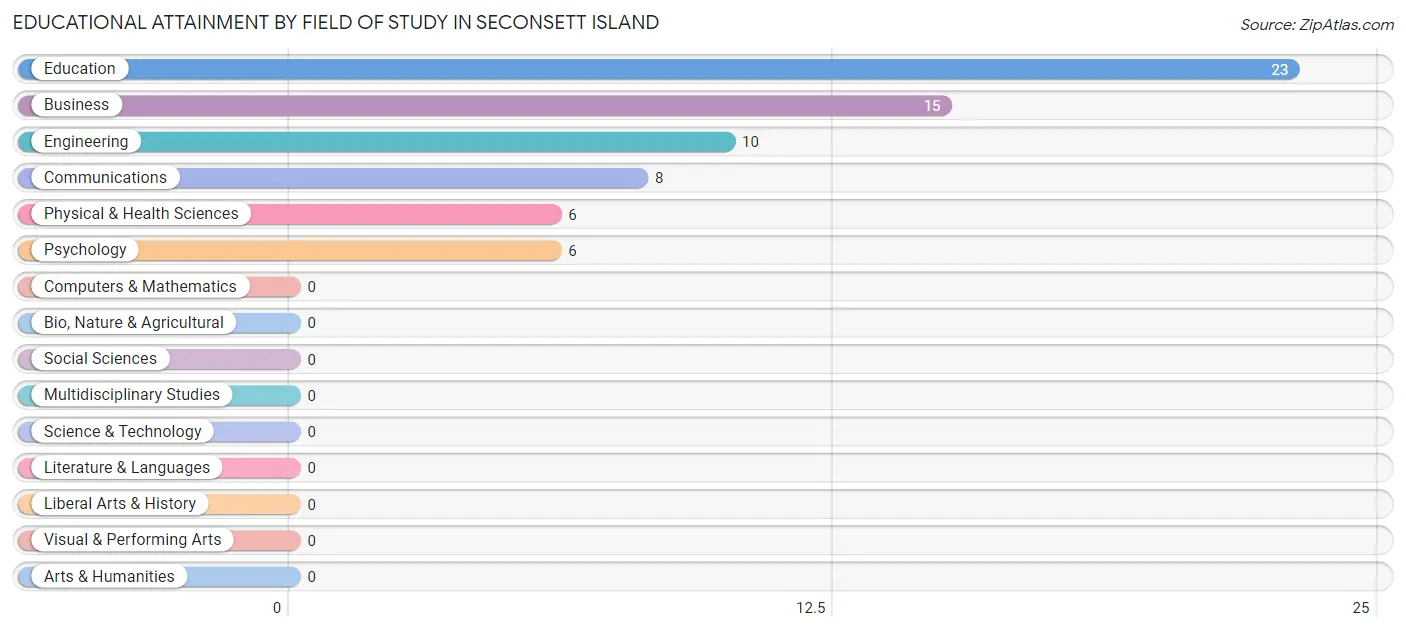
| Field of Study | # Graduates | % Graduates |
| Computers & Mathematics | 0 | 0.0% |
| Bio, Nature & Agricultural | 0 | 0.0% |
| Physical & Health Sciences | 6 | 8.8% |
| Psychology | 6 | 8.8% |
| Social Sciences | 0 | 0.0% |
| Engineering | 10 | 14.7% |
| Multidisciplinary Studies | 0 | 0.0% |
| Science & Technology | 0 | 0.0% |
| Business | 15 | 22.1% |
| Education | 23 | 33.8% |
| Literature & Languages | 0 | 0.0% |
| Liberal Arts & History | 0 | 0.0% |
| Visual & Performing Arts | 0 | 0.0% |
| Communications | 8 | 11.8% |
| Arts & Humanities | 0 | 0.0% |
| Total | 68 | 100.0% |
Transportation & Commute in Seconsett Island
Vehicle Availability by Sex in Seconsett Island
The most prevalent vehicle ownership categories in Seconsett Island are males with 2 vehicles (24, accounting for 80.0%) and females with 2 vehicles (15, making up 160.0%).
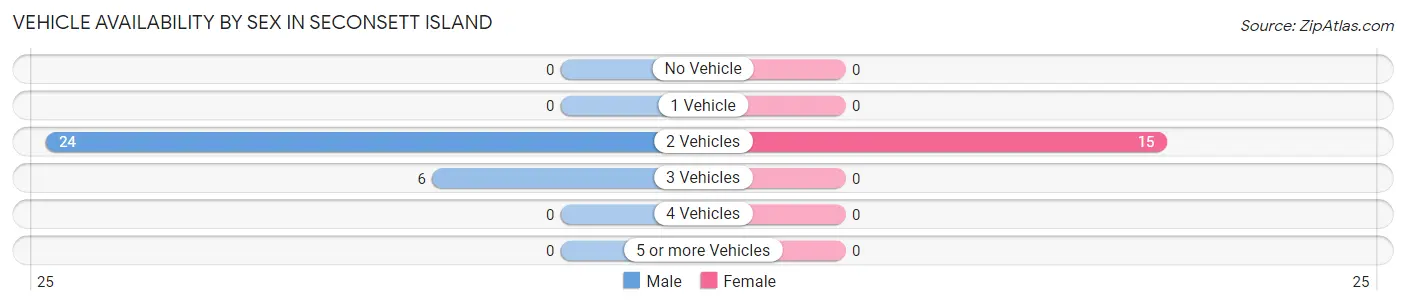
| Vehicles Available | Male | Female |
| No Vehicle | 0 (0.0%) | 0 (0.0%) |
| 1 Vehicle | 0 (0.0%) | 0 (0.0%) |
| 2 Vehicles | 24 (80.0%) | 15 (100.0%) |
| 3 Vehicles | 6 (20.0%) | 0 (0.0%) |
| 4 Vehicles | 0 (0.0%) | 0 (0.0%) |
| 5 or more Vehicles | 0 (0.0%) | 0 (0.0%) |
| Total | 30 (100.0%) | 15 (100.0%) |
Commute Time in Seconsett Island
The most frequently occuring commute durations in Seconsett Island are 25 to 29 minutes (12 commuters, 30.8%), 90 or more minutes (10 commuters, 25.6%), and 10 to 14 minutes (9 commuters, 23.1%).
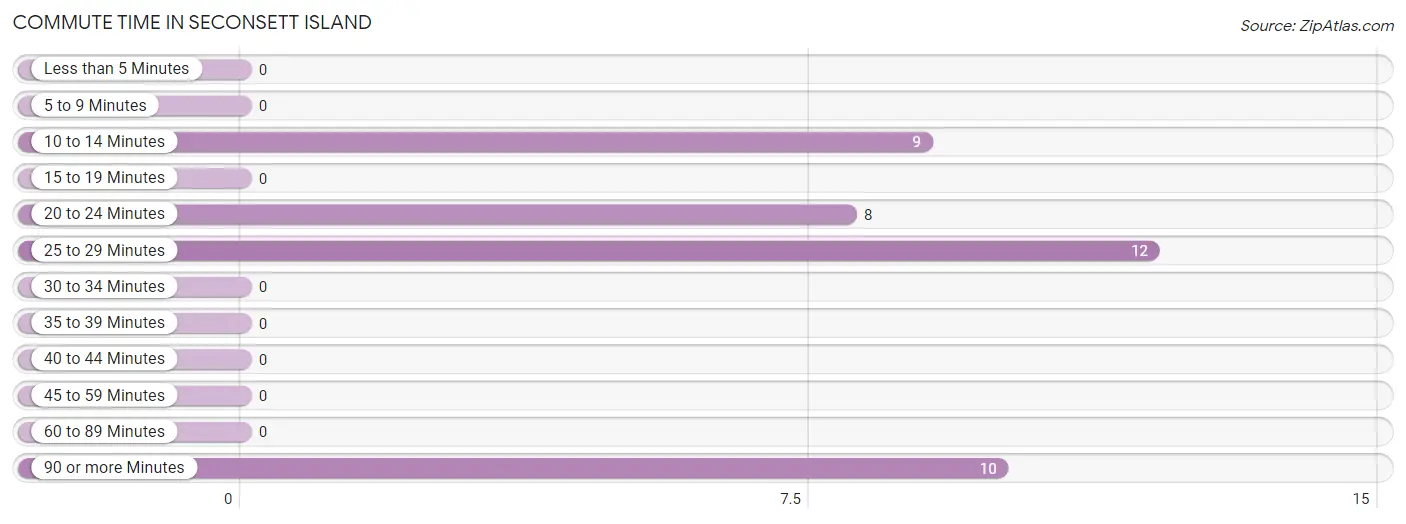
| Commute Time | # Commuters | % Commuters |
| Less than 5 Minutes | 0 | 0.0% |
| 5 to 9 Minutes | 0 | 0.0% |
| 10 to 14 Minutes | 9 | 23.1% |
| 15 to 19 Minutes | 0 | 0.0% |
| 20 to 24 Minutes | 8 | 20.5% |
| 25 to 29 Minutes | 12 | 30.8% |
| 30 to 34 Minutes | 0 | 0.0% |
| 35 to 39 Minutes | 0 | 0.0% |
| 40 to 44 Minutes | 0 | 0.0% |
| 45 to 59 Minutes | 0 | 0.0% |
| 60 to 89 Minutes | 0 | 0.0% |
| 90 or more Minutes | 10 | 25.6% |
Commute Time by Sex in Seconsett Island
The most common commute times in Seconsett Island are 90 or more minutes (10 commuters, 41.7%) for males and 10 to 14 minutes (9 commuters, 60.0%) for females.
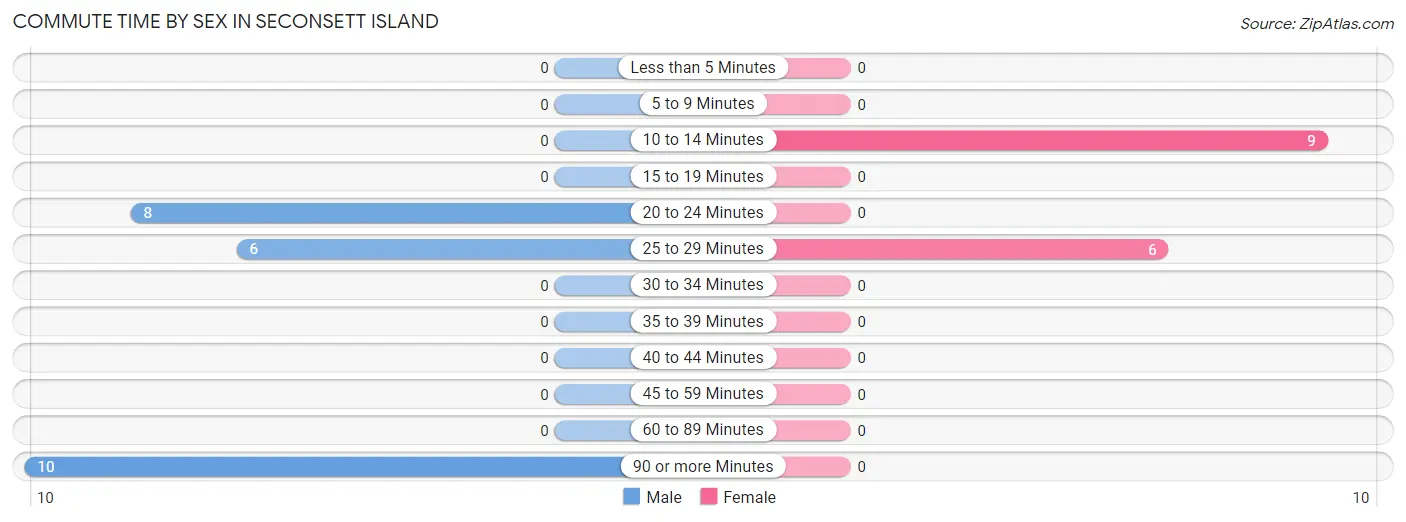
| Commute Time | Male | Female |
| Less than 5 Minutes | 0 (0.0%) | 0 (0.0%) |
| 5 to 9 Minutes | 0 (0.0%) | 0 (0.0%) |
| 10 to 14 Minutes | 0 (0.0%) | 9 (60.0%) |
| 15 to 19 Minutes | 0 (0.0%) | 0 (0.0%) |
| 20 to 24 Minutes | 8 (33.3%) | 0 (0.0%) |
| 25 to 29 Minutes | 6 (25.0%) | 6 (40.0%) |
| 30 to 34 Minutes | 0 (0.0%) | 0 (0.0%) |
| 35 to 39 Minutes | 0 (0.0%) | 0 (0.0%) |
| 40 to 44 Minutes | 0 (0.0%) | 0 (0.0%) |
| 45 to 59 Minutes | 0 (0.0%) | 0 (0.0%) |
| 60 to 89 Minutes | 0 (0.0%) | 0 (0.0%) |
| 90 or more Minutes | 10 (41.7%) | 0 (0.0%) |
Time of Departure to Work by Sex in Seconsett Island
The most frequent times of departure to work in Seconsett Island are 6:00 AM to 6:29 AM (10, 41.7%) for males and 6:30 AM to 6:59 AM (9, 60.0%) for females.
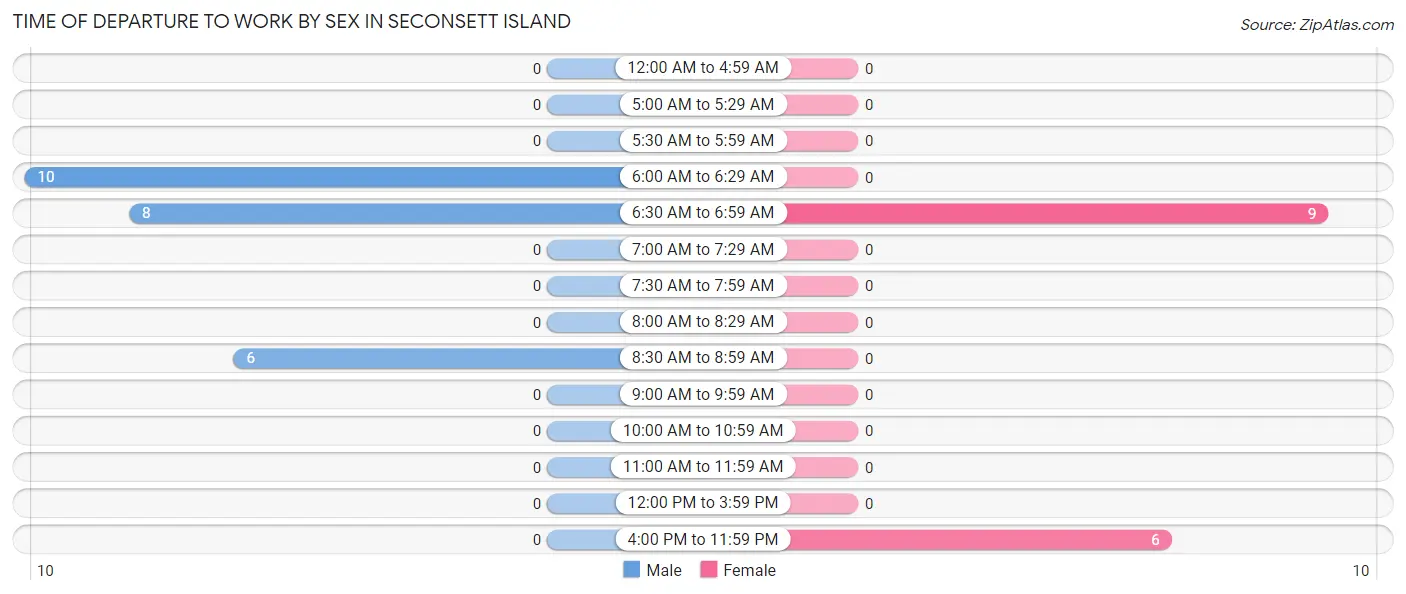
| Time of Departure | Male | Female |
| 12:00 AM to 4:59 AM | 0 (0.0%) | 0 (0.0%) |
| 5:00 AM to 5:29 AM | 0 (0.0%) | 0 (0.0%) |
| 5:30 AM to 5:59 AM | 0 (0.0%) | 0 (0.0%) |
| 6:00 AM to 6:29 AM | 10 (41.7%) | 0 (0.0%) |
| 6:30 AM to 6:59 AM | 8 (33.3%) | 9 (60.0%) |
| 7:00 AM to 7:29 AM | 0 (0.0%) | 0 (0.0%) |
| 7:30 AM to 7:59 AM | 0 (0.0%) | 0 (0.0%) |
| 8:00 AM to 8:29 AM | 0 (0.0%) | 0 (0.0%) |
| 8:30 AM to 8:59 AM | 6 (25.0%) | 0 (0.0%) |
| 9:00 AM to 9:59 AM | 0 (0.0%) | 0 (0.0%) |
| 10:00 AM to 10:59 AM | 0 (0.0%) | 0 (0.0%) |
| 11:00 AM to 11:59 AM | 0 (0.0%) | 0 (0.0%) |
| 12:00 PM to 3:59 PM | 0 (0.0%) | 0 (0.0%) |
| 4:00 PM to 11:59 PM | 0 (0.0%) | 6 (40.0%) |
| Total | 24 (100.0%) | 15 (100.0%) |
Housing Occupancy in Seconsett Island
Occupancy by Ownership in Seconsett Island
Of the total 54 dwellings in Seconsett Island, owner-occupied units account for 44 (81.5%), while renter-occupied units make up 10 (18.5%).
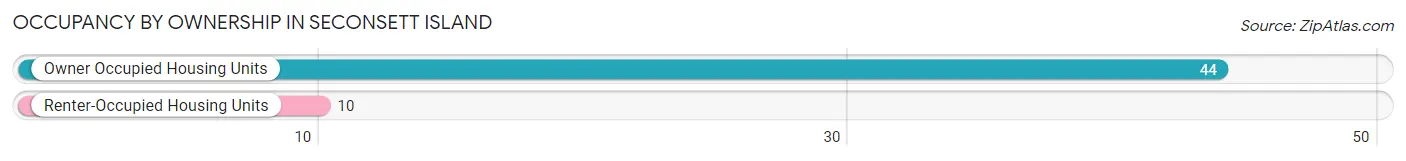
| Occupancy | # Housing Units | % Housing Units |
| Owner Occupied Housing Units | 44 | 81.5% |
| Renter-Occupied Housing Units | 10 | 18.5% |
| Total Occupied Housing Units | 54 | 100.0% |
Occupancy by Household Size in Seconsett Island
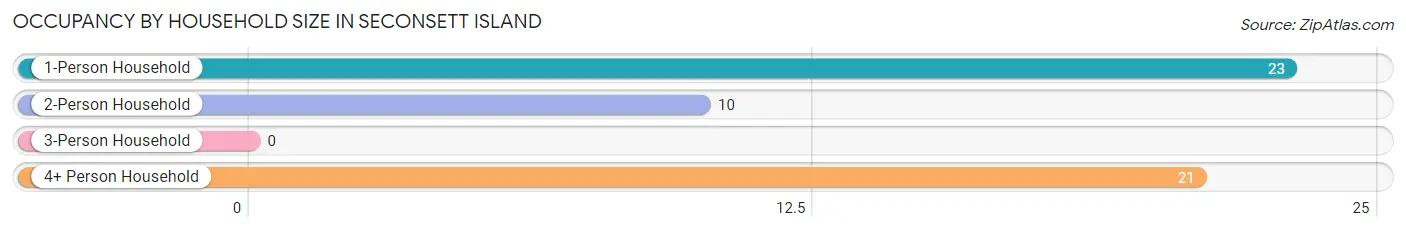
| Household Size | # Housing Units | % Housing Units |
| 1-Person Household | 23 | 42.6% |
| 2-Person Household | 10 | 18.5% |
| 3-Person Household | 0 | 0.0% |
| 4+ Person Household | 21 | 38.9% |
| Total Housing Units | 54 | 100.0% |
Occupancy by Ownership by Household Size in Seconsett Island
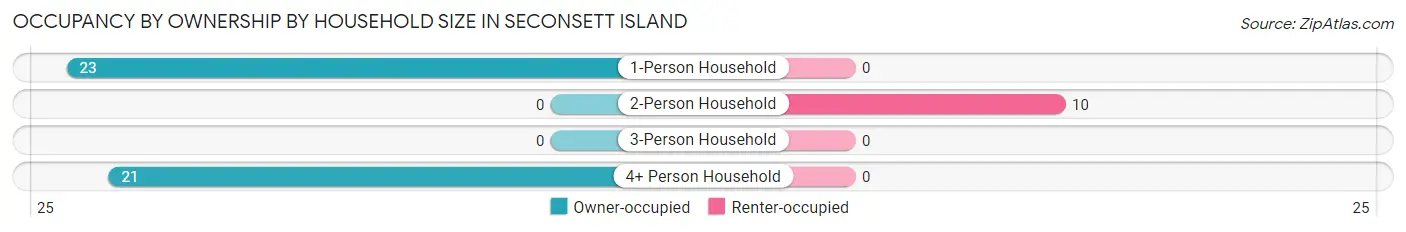
| Household Size | Owner-occupied | Renter-occupied |
| 1-Person Household | 23 (100.0%) | 0 (0.0%) |
| 2-Person Household | 0 (0.0%) | 10 (100.0%) |
| 3-Person Household | 0 (0.0%) | 0 (0.0%) |
| 4+ Person Household | 21 (100.0%) | 0 (0.0%) |
| Total Housing Units | 44 (81.5%) | 10 (18.5%) |
Occupancy by Educational Attainment in Seconsett Island
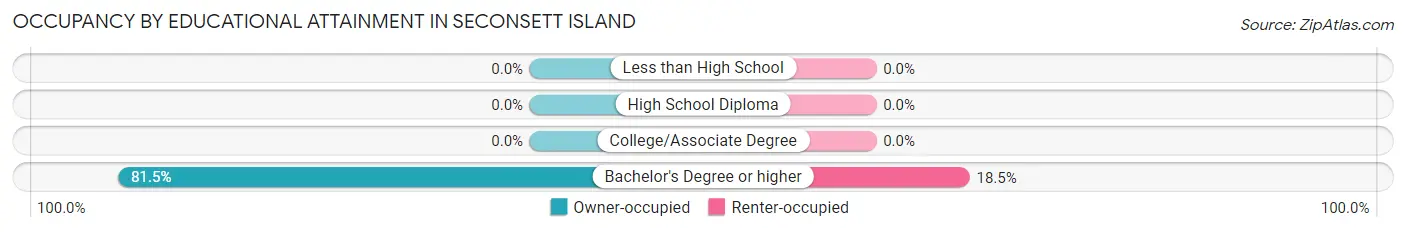
| Household Size | Owner-occupied | Renter-occupied |
| Less than High School | 0 (0.0%) | 0 (0.0%) |
| High School Diploma | 0 (0.0%) | 0 (0.0%) |
| College/Associate Degree | 0 (0.0%) | 0 (0.0%) |
| Bachelor's Degree or higher | 44 (81.5%) | 10 (18.5%) |
Occupancy by Age of Householder in Seconsett Island
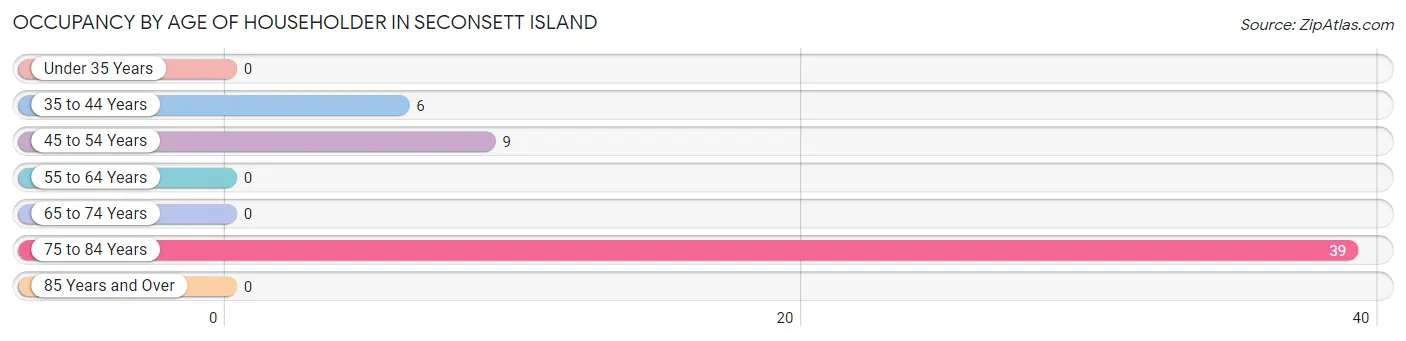
| Age Bracket | # Households | % Households |
| Under 35 Years | 0 | 0.0% |
| 35 to 44 Years | 6 | 11.1% |
| 45 to 54 Years | 9 | 16.7% |
| 55 to 64 Years | 0 | 0.0% |
| 65 to 74 Years | 0 | 0.0% |
| 75 to 84 Years | 39 | 72.2% |
| 85 Years and Over | 0 | 0.0% |
| Total | 54 | 100.0% |
Housing Finances in Seconsett Island
Median Income by Occupancy in Seconsett Island
| Occupancy Type | # Households | Median Income |
| Owner-Occupied | 44 (81.5%) | $0 |
| Renter-Occupied | 10 (18.5%) | $0 |
| Average | 54 (100.0%) | $0 |
Occupancy by Householder Income Bracket in Seconsett Island
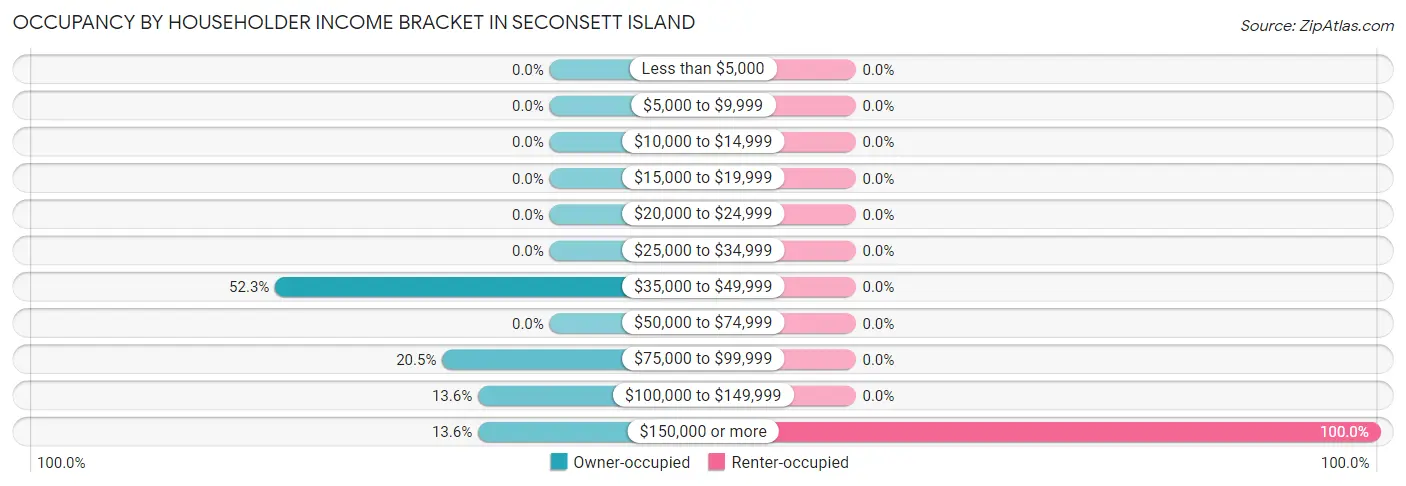
| Income Bracket | Owner-occupied | Renter-occupied |
| Less than $5,000 | 0 (0.0%) | 0 (0.0%) |
| $5,000 to $9,999 | 0 (0.0%) | 0 (0.0%) |
| $10,000 to $14,999 | 0 (0.0%) | 0 (0.0%) |
| $15,000 to $19,999 | 0 (0.0%) | 0 (0.0%) |
| $20,000 to $24,999 | 0 (0.0%) | 0 (0.0%) |
| $25,000 to $34,999 | 0 (0.0%) | 0 (0.0%) |
| $35,000 to $49,999 | 23 (52.3%) | 0 (0.0%) |
| $50,000 to $74,999 | 0 (0.0%) | 0 (0.0%) |
| $75,000 to $99,999 | 9 (20.4%) | 0 (0.0%) |
| $100,000 to $149,999 | 6 (13.6%) | 0 (0.0%) |
| $150,000 or more | 6 (13.6%) | 10 (100.0%) |
| Total | 44 (100.0%) | 10 (100.0%) |
Monthly Housing Cost Tiers in Seconsett Island
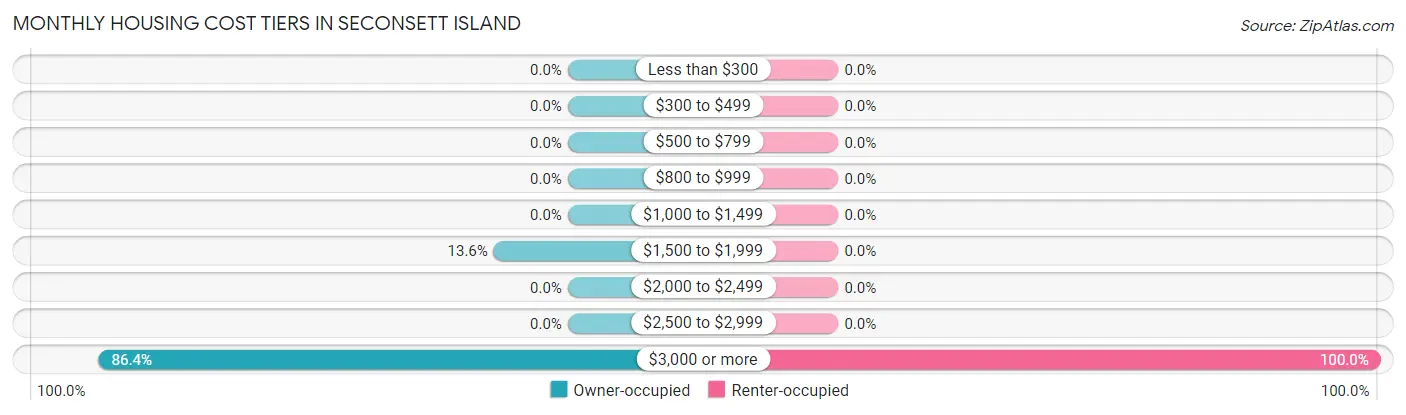
| Monthly Cost | Owner-occupied | Renter-occupied |
| Less than $300 | 0 (0.0%) | 0 (0.0%) |
| $300 to $499 | 0 (0.0%) | 0 (0.0%) |
| $500 to $799 | 0 (0.0%) | 0 (0.0%) |
| $800 to $999 | 0 (0.0%) | 0 (0.0%) |
| $1,000 to $1,499 | 0 (0.0%) | 0 (0.0%) |
| $1,500 to $1,999 | 6 (13.6%) | 0 (0.0%) |
| $2,000 to $2,499 | 0 (0.0%) | 0 (0.0%) |
| $2,500 to $2,999 | 0 (0.0%) | 0 (0.0%) |
| $3,000 or more | 38 (86.4%) | 10 (100.0%) |
| Total | 44 (100.0%) | 10 (100.0%) |
Physical Housing Characteristics in Seconsett Island
Housing Structures in Seconsett Island
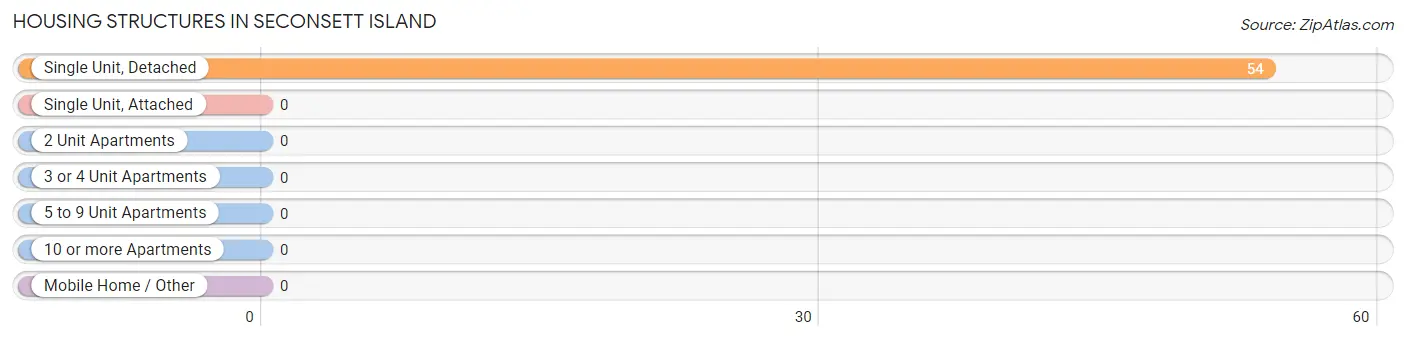
| Structure Type | # Housing Units | % Housing Units |
| Single Unit, Detached | 54 | 100.0% |
| Single Unit, Attached | 0 | 0.0% |
| 2 Unit Apartments | 0 | 0.0% |
| 3 or 4 Unit Apartments | 0 | 0.0% |
| 5 to 9 Unit Apartments | 0 | 0.0% |
| 10 or more Apartments | 0 | 0.0% |
| Mobile Home / Other | 0 | 0.0% |
| Total | 54 | 100.0% |
Housing Structures by Occupancy in Seconsett Island
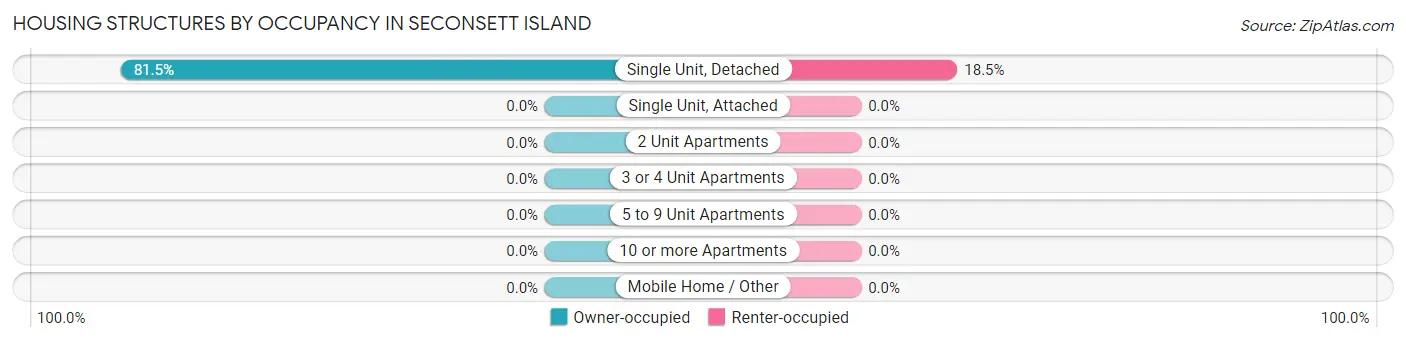
| Structure Type | Owner-occupied | Renter-occupied |
| Single Unit, Detached | 44 (81.5%) | 10 (18.5%) |
| Single Unit, Attached | 0 (0.0%) | 0 (0.0%) |
| 2 Unit Apartments | 0 (0.0%) | 0 (0.0%) |
| 3 or 4 Unit Apartments | 0 (0.0%) | 0 (0.0%) |
| 5 to 9 Unit Apartments | 0 (0.0%) | 0 (0.0%) |
| 10 or more Apartments | 0 (0.0%) | 0 (0.0%) |
| Mobile Home / Other | 0 (0.0%) | 0 (0.0%) |
| Total | 44 (81.5%) | 10 (18.5%) |
Housing Structures by Number of Rooms in Seconsett Island
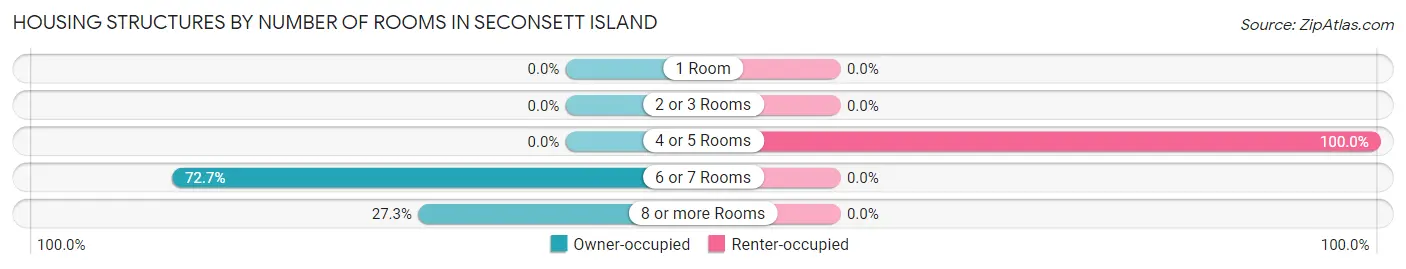
| Number of Rooms | Owner-occupied | Renter-occupied |
| 1 Room | 0 (0.0%) | 0 (0.0%) |
| 2 or 3 Rooms | 0 (0.0%) | 0 (0.0%) |
| 4 or 5 Rooms | 0 (0.0%) | 10 (100.0%) |
| 6 or 7 Rooms | 32 (72.7%) | 0 (0.0%) |
| 8 or more Rooms | 12 (27.3%) | 0 (0.0%) |
| Total | 44 (100.0%) | 10 (100.0%) |
Housing Structure by Heating Type in Seconsett Island
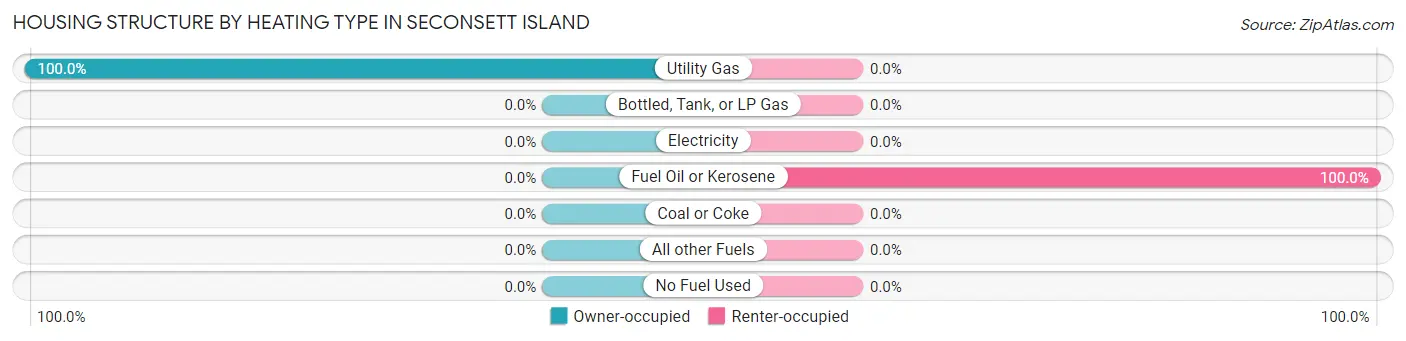
| Heating Type | Owner-occupied | Renter-occupied |
| Utility Gas | 44 (100.0%) | 0 (0.0%) |
| Bottled, Tank, or LP Gas | 0 (0.0%) | 0 (0.0%) |
| Electricity | 0 (0.0%) | 0 (0.0%) |
| Fuel Oil or Kerosene | 0 (0.0%) | 10 (100.0%) |
| Coal or Coke | 0 (0.0%) | 0 (0.0%) |
| All other Fuels | 0 (0.0%) | 0 (0.0%) |
| No Fuel Used | 0 (0.0%) | 0 (0.0%) |
| Total | 44 (100.0%) | 10 (100.0%) |
Household Vehicle Usage in Seconsett Island
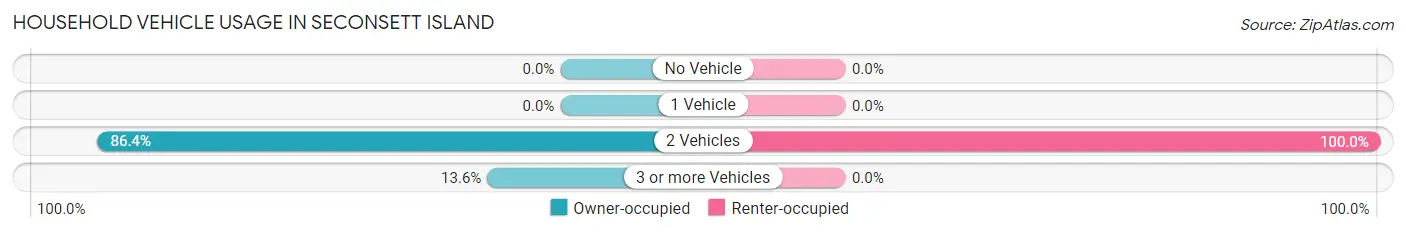
| Vehicles per Household | Owner-occupied | Renter-occupied |
| No Vehicle | 0 (0.0%) | 0 (0.0%) |
| 1 Vehicle | 0 (0.0%) | 0 (0.0%) |
| 2 Vehicles | 38 (86.4%) | 10 (100.0%) |
| 3 or more Vehicles | 6 (13.6%) | 0 (0.0%) |
| Total | 44 (100.0%) | 10 (100.0%) |
Real Estate & Mortgages in Seconsett Island
Real Estate and Mortgage Overview in Seconsett Island
| Characteristic | Without Mortgage | With Mortgage |
| Housing Units | 35 | 9 |
| Median Property Value | - | - |
| Median Household Income | - | - |
| Monthly Housing Costs | $1,501 | $9 |
| Real Estate Taxes | $10,001 | $0 |
Property Value by Mortgage Status in Seconsett Island
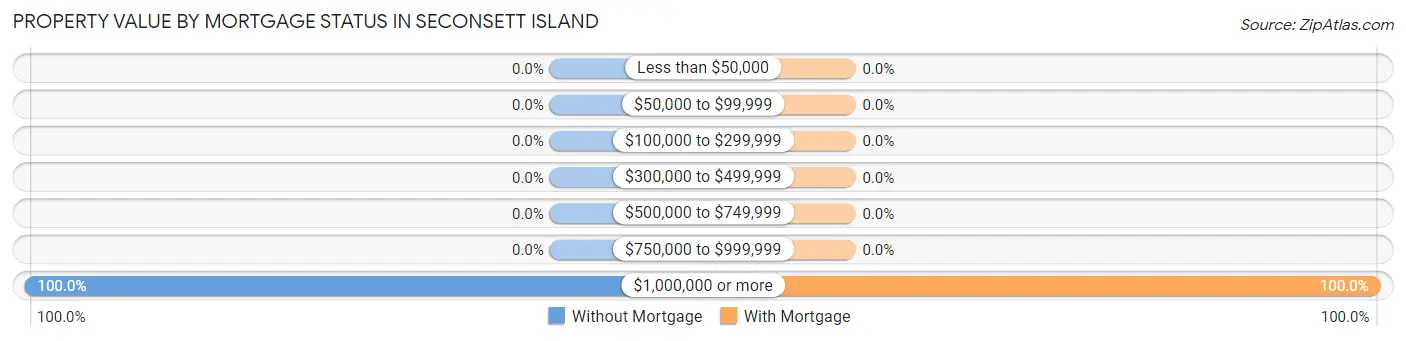
| Property Value | Without Mortgage | With Mortgage |
| Less than $50,000 | 0 (0.0%) | 0 (0.0%) |
| $50,000 to $99,999 | 0 (0.0%) | 0 (0.0%) |
| $100,000 to $299,999 | 0 (0.0%) | 0 (0.0%) |
| $300,000 to $499,999 | 0 (0.0%) | 0 (0.0%) |
| $500,000 to $749,999 | 0 (0.0%) | 0 (0.0%) |
| $750,000 to $999,999 | 0 (0.0%) | 0 (0.0%) |
| $1,000,000 or more | 35 (100.0%) | 9 (100.0%) |
| Total | 35 (100.0%) | 9 (100.0%) |
Household Income by Mortgage Status in Seconsett Island
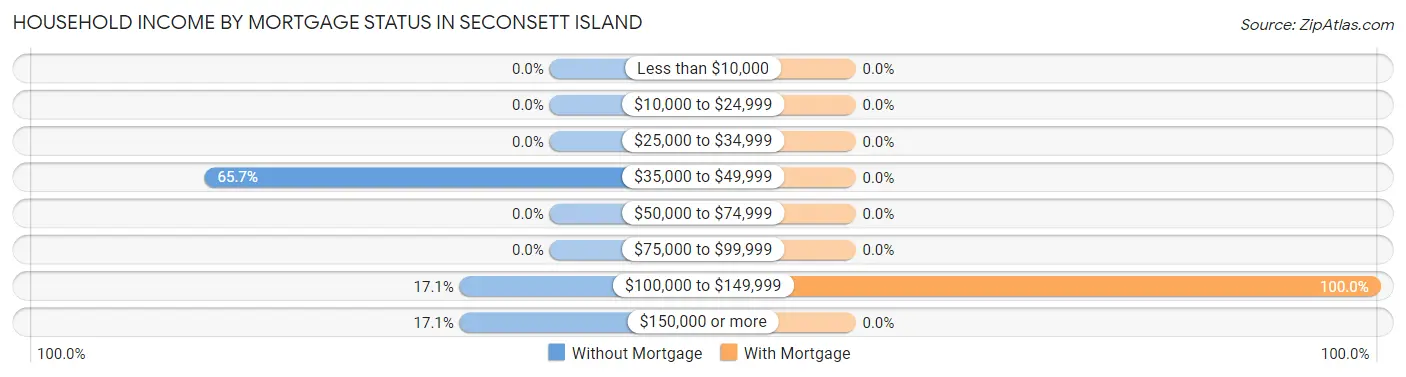
| Household Income | Without Mortgage | With Mortgage |
| Less than $10,000 | 0 (0.0%) | 0 (0.0%) |
| $10,000 to $24,999 | 0 (0.0%) | 0 (0.0%) |
| $25,000 to $34,999 | 0 (0.0%) | 0 (0.0%) |
| $35,000 to $49,999 | 23 (65.7%) | 0 (0.0%) |
| $50,000 to $74,999 | 0 (0.0%) | 0 (0.0%) |
| $75,000 to $99,999 | 0 (0.0%) | 0 (0.0%) |
| $100,000 to $149,999 | 6 (17.1%) | 9 (100.0%) |
| $150,000 or more | 6 (17.1%) | 0 (0.0%) |
| Total | 35 (100.0%) | 9 (100.0%) |
Property Value to Household Income Ratio in Seconsett Island
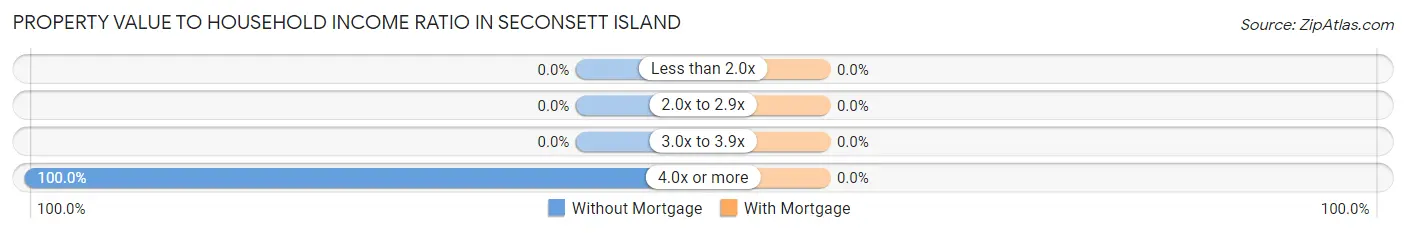
| Value-to-Income Ratio | Without Mortgage | With Mortgage |
| Less than 2.0x | 0 (0.0%) | 0 (0.0%) |
| 2.0x to 2.9x | 0 (0.0%) | 0 (0.0%) |
| 3.0x to 3.9x | 0 (0.0%) | 0 (0.0%) |
| 4.0x or more | 35 (100.0%) | 0 (0.0%) |
| Total | 35 (100.0%) | 9 (100.0%) |
Real Estate Taxes by Mortgage Status in Seconsett Island
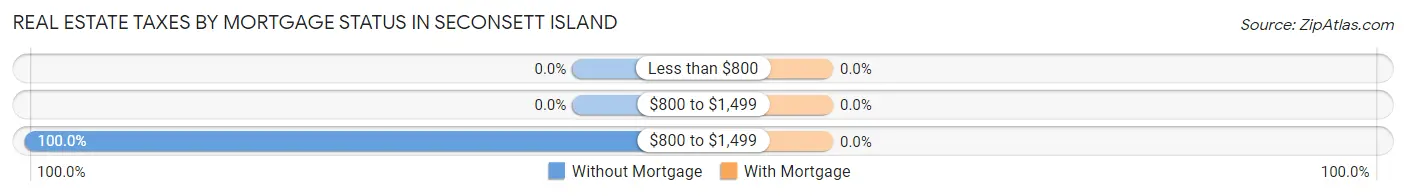
| Property Taxes | Without Mortgage | With Mortgage |
| Less than $800 | 0 (0.0%) | 0 (0.0%) |
| $800 to $1,499 | 0 (0.0%) | 0 (0.0%) |
| $800 to $1,499 | 35 (100.0%) | 0 (0.0%) |
| Total | 35 (100.0%) | 9 (100.0%) |
Health & Disability in Seconsett Island
Health Insurance Coverage by Age in Seconsett Island
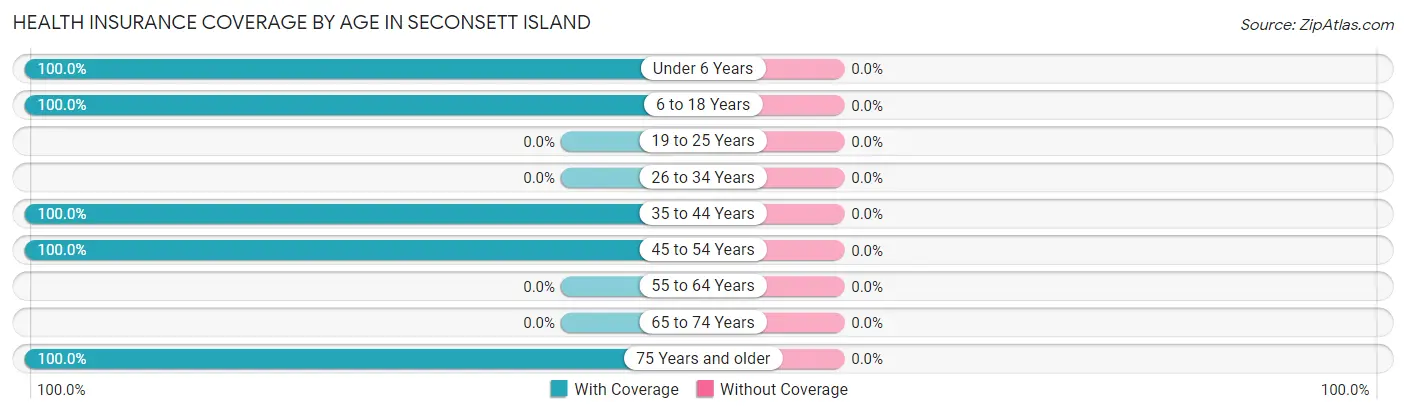
| Age Bracket | With Coverage | Without Coverage |
| Under 6 Years | 21 (100.0%) | 0 (0.0%) |
| 6 to 18 Years | 24 (100.0%) | 0 (0.0%) |
| 19 to 25 Years | 0 (0.0%) | 0 (0.0%) |
| 26 to 34 Years | 0 (0.0%) | 0 (0.0%) |
| 35 to 44 Years | 14 (100.0%) | 0 (0.0%) |
| 45 to 54 Years | 23 (100.0%) | 0 (0.0%) |
| 55 to 64 Years | 0 (0.0%) | 0 (0.0%) |
| 65 to 74 Years | 0 (0.0%) | 0 (0.0%) |
| 75 Years and older | 55 (100.0%) | 0 (0.0%) |
| Total | 137 (100.0%) | 0 (0.0%) |
Health Insurance Coverage by Citizenship Status in Seconsett Island
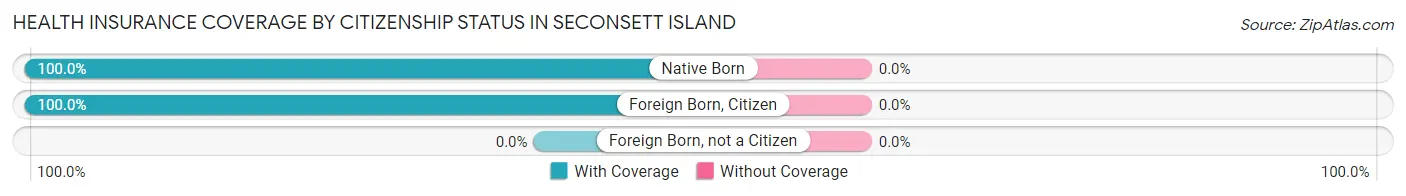
| Citizenship Status | With Coverage | Without Coverage |
| Native Born | 21 (100.0%) | 0 (0.0%) |
| Foreign Born, Citizen | 24 (100.0%) | 0 (0.0%) |
| Foreign Born, not a Citizen | 0 (0.0%) | 0 (0.0%) |
Health Insurance Coverage by Household Income in Seconsett Island
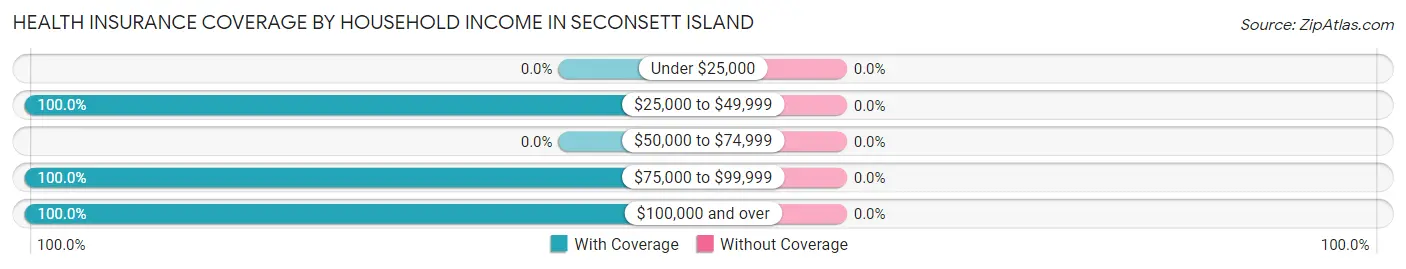
| Household Income | With Coverage | Without Coverage |
| Under $25,000 | 0 (0.0%) | 0 (0.0%) |
| $25,000 to $49,999 | 23 (100.0%) | 0 (0.0%) |
| $50,000 to $74,999 | 0 (0.0%) | 0 (0.0%) |
| $75,000 to $99,999 | 35 (100.0%) | 0 (0.0%) |
| $100,000 and over | 79 (100.0%) | 0 (0.0%) |
Public vs Private Health Insurance Coverage by Age in Seconsett Island
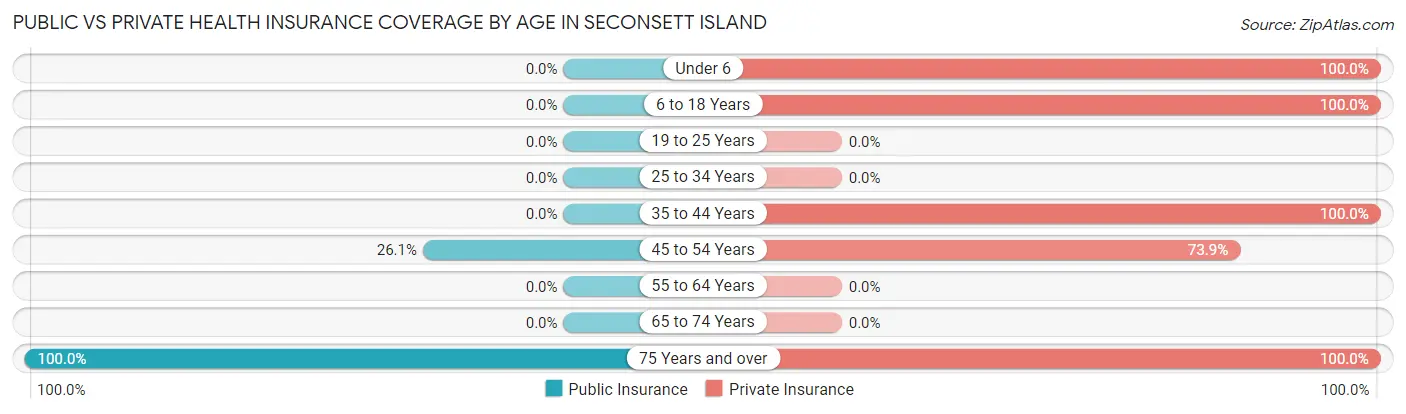
| Age Bracket | Public Insurance | Private Insurance |
| Under 6 | 0 (0.0%) | 21 (100.0%) |
| 6 to 18 Years | 0 (0.0%) | 24 (100.0%) |
| 19 to 25 Years | 0 (0.0%) | 0 (0.0%) |
| 25 to 34 Years | 0 (0.0%) | 0 (0.0%) |
| 35 to 44 Years | 0 (0.0%) | 14 (100.0%) |
| 45 to 54 Years | 6 (26.1%) | 17 (73.9%) |
| 55 to 64 Years | 0 (0.0%) | 0 (0.0%) |
| 65 to 74 Years | 0 (0.0%) | 0 (0.0%) |
| 75 Years and over | 55 (100.0%) | 55 (100.0%) |
| Total | 61 (44.5%) | 131 (95.6%) |
Disability Status by Sex by Age in Seconsett Island
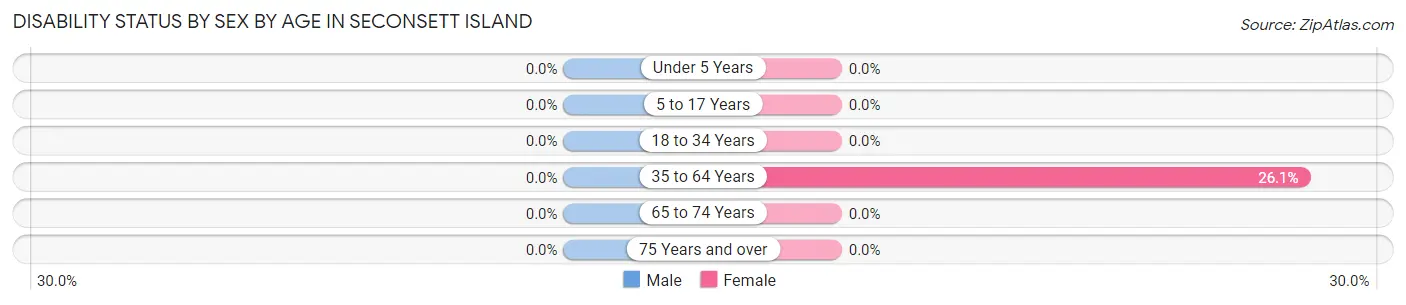
| Age Bracket | Male | Female |
| Under 5 Years | 0 (0.0%) | 0 (0.0%) |
| 5 to 17 Years | 0 (0.0%) | 0 (0.0%) |
| 18 to 34 Years | 0 (0.0%) | 0 (0.0%) |
| 35 to 64 Years | 0 (0.0%) | 6 (26.1%) |
| 65 to 74 Years | 0 (0.0%) | 0 (0.0%) |
| 75 Years and over | 0 (0.0%) | 0 (0.0%) |
Disability Class by Sex by Age in Seconsett Island
Disability Class: Hearing Difficulty
| Age Bracket | Male | Female |
| Under 5 Years | 0 (0.0%) | 0 (0.0%) |
| 5 to 17 Years | 0 (0.0%) | 0 (0.0%) |
| 18 to 34 Years | 0 (0.0%) | 0 (0.0%) |
| 35 to 64 Years | 0 (0.0%) | 0 (0.0%) |
| 65 to 74 Years | 0 (0.0%) | 0 (0.0%) |
| 75 Years and over | 0 (0.0%) | 0 (0.0%) |
Disability Class: Vision Difficulty
| Age Bracket | Male | Female |
| Under 5 Years | 0 (0.0%) | 0 (0.0%) |
| 5 to 17 Years | 0 (0.0%) | 0 (0.0%) |
| 18 to 34 Years | 0 (0.0%) | 0 (0.0%) |
| 35 to 64 Years | 0 (0.0%) | 0 (0.0%) |
| 65 to 74 Years | 0 (0.0%) | 0 (0.0%) |
| 75 Years and over | 0 (0.0%) | 0 (0.0%) |
Disability Class: Cognitive Difficulty
| Age Bracket | Male | Female |
| 5 to 17 Years | 0 (0.0%) | 0 (0.0%) |
| 18 to 34 Years | 0 (0.0%) | 0 (0.0%) |
| 35 to 64 Years | 0 (0.0%) | 0 (0.0%) |
| 65 to 74 Years | 0 (0.0%) | 0 (0.0%) |
| 75 Years and over | 0 (0.0%) | 0 (0.0%) |
Disability Class: Ambulatory Difficulty
| Age Bracket | Male | Female |
| 5 to 17 Years | 0 (0.0%) | 0 (0.0%) |
| 18 to 34 Years | 0 (0.0%) | 0 (0.0%) |
| 35 to 64 Years | 0 (0.0%) | 0 (0.0%) |
| 65 to 74 Years | 0 (0.0%) | 0 (0.0%) |
| 75 Years and over | 0 (0.0%) | 0 (0.0%) |
Disability Class: Self-Care Difficulty
| Age Bracket | Male | Female |
| 5 to 17 Years | 0 (0.0%) | 0 (0.0%) |
| 18 to 34 Years | 0 (0.0%) | 0 (0.0%) |
| 35 to 64 Years | 0 (0.0%) | 0 (0.0%) |
| 65 to 74 Years | 0 (0.0%) | 0 (0.0%) |
| 75 Years and over | 0 (0.0%) | 0 (0.0%) |
Technology Access in Seconsett Island
Computing Device Access in Seconsett Island
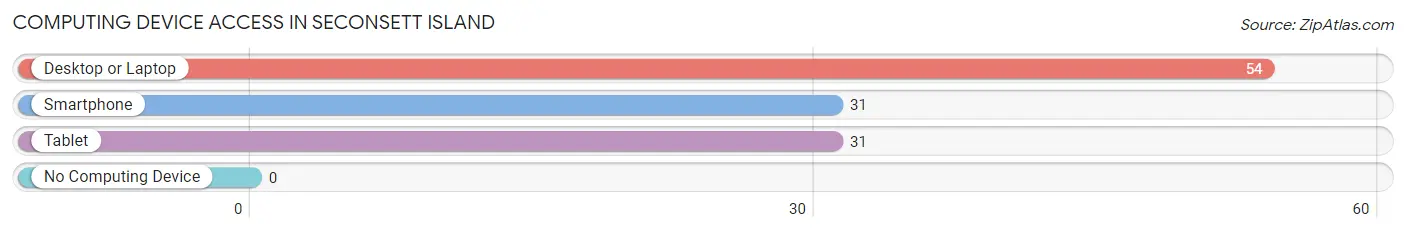
| Device Type | # Households | % Households |
| Desktop or Laptop | 54 | 100.0% |
| Smartphone | 31 | 57.4% |
| Tablet | 31 | 57.4% |
| No Computing Device | 0 | 0.0% |
| Total | 54 | 100.0% |
Internet Access in Seconsett Island
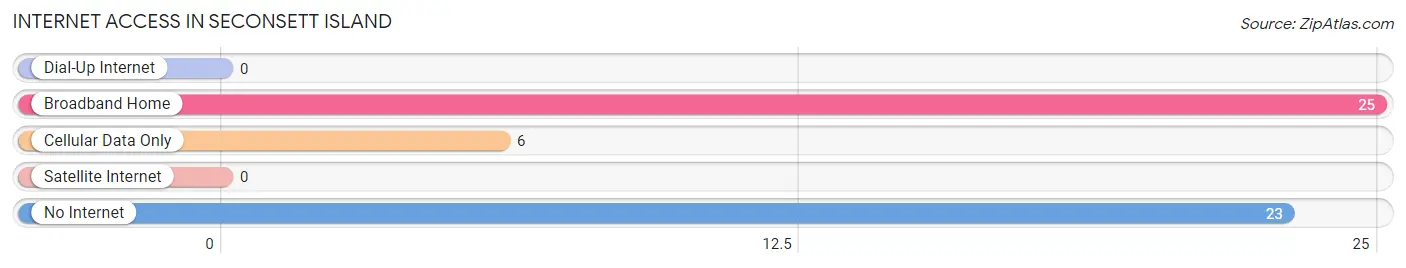
| Internet Type | # Households | % Households |
| Dial-Up Internet | 0 | 0.0% |
| Broadband Home | 25 | 46.3% |
| Cellular Data Only | 6 | 11.1% |
| Satellite Internet | 0 | 0.0% |
| No Internet | 23 | 42.6% |
| Total | 54 | 100.0% |
Seconsett Island Summary
Seconsett Island is a small island located in the town of Harwich, Massachusetts. It is located in the Nantucket Sound, off the coast of Cape Cod. The island is approximately 1.5 miles long and 0.5 miles wide, and is home to about 200 year-round residents.
History
Seconsett Island was first settled in the early 1700s by the Seconsett family, who were of English descent. The island was originally used for farming and fishing, and the Seconsetts were known for their shipbuilding skills. In the late 1800s, the island began to be developed as a summer resort destination. The Seconsetts built a hotel, a casino, and a dance hall, and the island became a popular destination for wealthy vacationers.
In the early 1900s, the island was sold to a developer who built a number of summer homes. The island was also used as a military base during World War II, and the military presence on the island continued until the late 1950s.
Geography
Seconsett Island is located in the Nantucket Sound, off the coast of Cape Cod. The island is approximately 1.5 miles long and 0.5 miles wide. The island is surrounded by shallow waters, and is connected to the mainland by a causeway. The island is mostly flat, with some hills in the center. The highest point on the island is about 40 feet above sea level.
The island is home to a number of beaches, including South Beach, East Beach, and West Beach. The island also has a number of ponds, including Little Pond, Great Pond, and Long Pond.
Economy
The economy of Seconsett Island is largely based on tourism. The island is a popular destination for vacationers, and there are a number of hotels, restaurants, and shops on the island. The island is also home to a number of marinas, which provide services to boaters.
The island is also home to a number of businesses, including a boatyard, a seafood market, and a number of small shops. The island is also home to a number of art galleries, which feature the work of local artists.
Demographics
As of the 2010 census, the population of Seconsett Island was 197. The population is largely white (94.4%), with a small percentage of African Americans (2.5%) and Hispanics (2.5%). The median household income is $68,750, and the median age is 48.
Conclusion
Seconsett Island is a small island located in the town of Harwich, Massachusetts. It is located in the Nantucket Sound, off the coast of Cape Cod. The island is approximately 1.5 miles long and 0.5 miles wide, and is home to about 200 year-round residents. The economy of Seconsett Island is largely based on tourism, and the population is largely white. The island is a popular destination for vacationers, and there are a number of hotels, restaurants, and shops on the island.
Common Questions
What is Per Capita Income in Seconsett Island?
Per Capita income in Seconsett Island is $37,686.
What is the Median Family Income in Seconsett Island?
Median Family Income in Seconsett Island is $122,708.
What is Inequality or Gini Index in Seconsett Island?
Inequality or Gini Index in Seconsett Island is 0.31.
What is the Total Population of Seconsett Island?
Total Population of Seconsett Island is 137.
What is the Total Male Population of Seconsett Island?
Total Male Population of Seconsett Island is 45.
What is the Total Female Population of Seconsett Island?
Total Female Population of Seconsett Island is 92.
What is the Ratio of Males per 100 Females in Seconsett Island?
There are 48.91 Males per 100 Females in Seconsett Island.
What is the Ratio of Females per 100 Males in Seconsett Island?
There are 204.44 Females per 100 Males in Seconsett Island.
What is the Median Population Age in Seconsett Island?
Median Population Age in Seconsett Island is 50.4 Years.
What is the Average Family Size in Seconsett Island
Average Family Size in Seconsett Island is 3.5 People.
What is the Average Household Size in Seconsett Island
Average Household Size in Seconsett Island is 2.5 People.
How Large is the Labor Force in Seconsett Island?
There are 53 People in the Labor Forcein in Seconsett Island.
What is the Percentage of People in the Labor Force in Seconsett Island?
52.5% of People are in the Labor Force in Seconsett Island.
What is the Unemployment Rate in Seconsett Island?
Unemployment Rate in Seconsett Island is 15.1%.