Zip Codes with the Highest Percentage of Population Employed in Accommodation & Food Services in Arlington, MA
RELATED REPORTS & OPTIONS
Accommodation & Food Services
Arlington
Compare Zip Codes
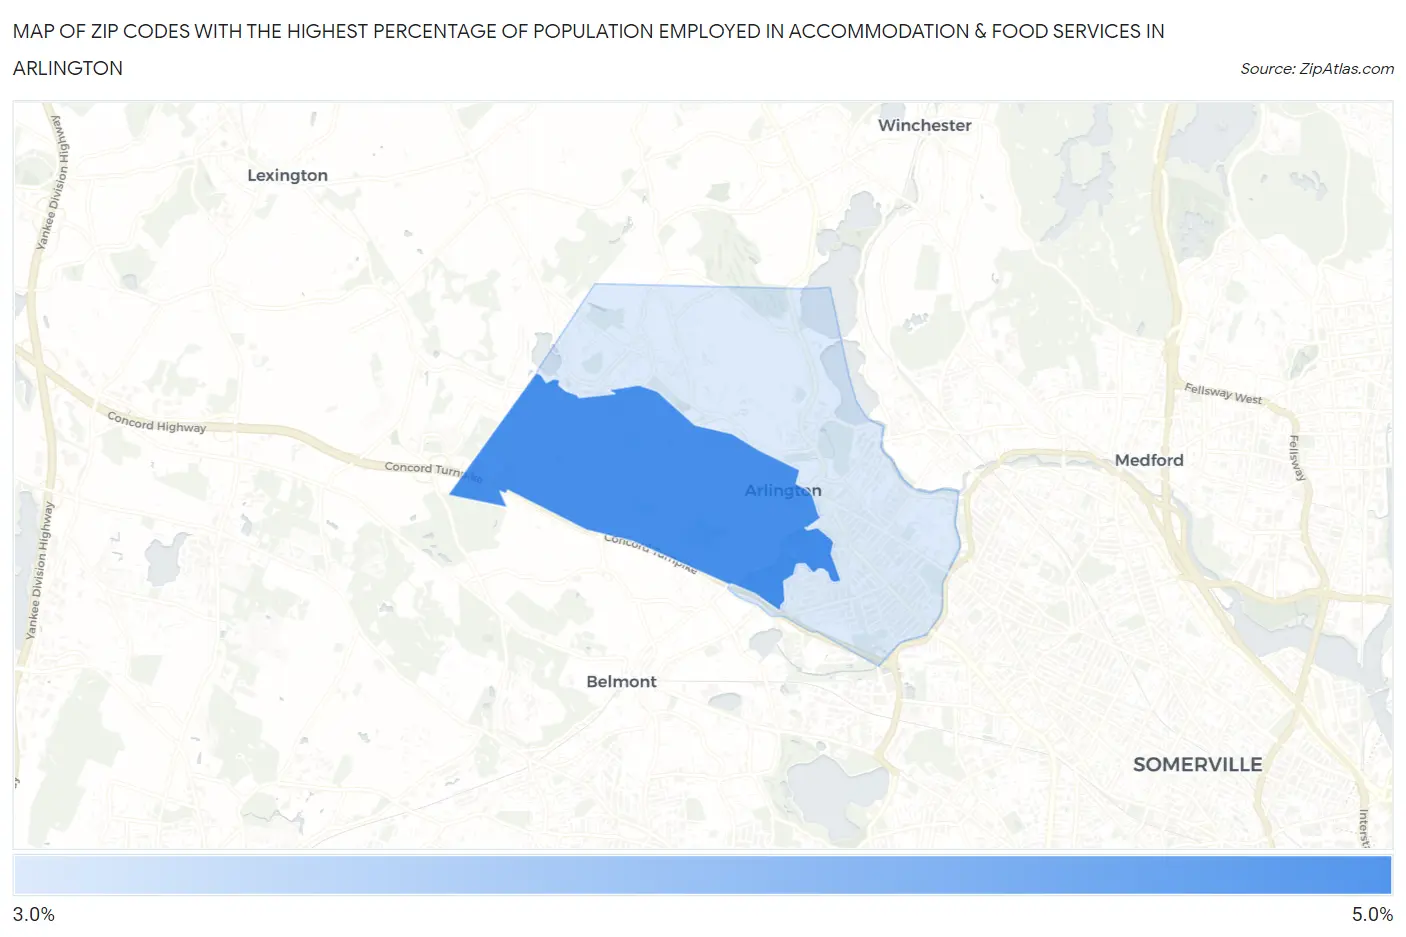
Map of Zip Codes with the Highest Percentage of Population Employed in Accommodation & Food Services in Arlington
3.1%
4.5%
Zip Codes with the Highest Percentage of Population Employed in Accommodation & Food Services in Arlington, MA
| Zip Code | % Employed | vs State | vs National | |
| 1. | 02476 | 4.5% | 5.8%(-1.25)#285 | 6.9%(-2.37)#18,465 |
| 2. | 02474 | 3.1% | 5.8%(-2.68)#411 | 6.9%(-3.80)#23,003 |
1
Common Questions
What are the Top Zip Codes with the Highest Percentage of Population Employed in Accommodation & Food Services in Arlington, MA?
Top Zip Codes with the Highest Percentage of Population Employed in Accommodation & Food Services in Arlington, MA are:
What zip code has the Highest Percentage of Population Employed in Accommodation & Food Services in Arlington, MA?
02476 has the Highest Percentage of Population Employed in Accommodation & Food Services in Arlington, MA with 4.5%.
What is the Percentage of Population Employed in Accommodation & Food Services in Arlington, MA?
Percentage of Population Employed in Accommodation & Food Services in Arlington is 3.6%.
What is the Percentage of Population Employed in Accommodation & Food Services in Massachusetts?
Percentage of Population Employed in Accommodation & Food Services in Massachusetts is 5.8%.
What is the Percentage of Population Employed in Accommodation & Food Services in the United States?
Percentage of Population Employed in Accommodation & Food Services in the United States is 6.9%.