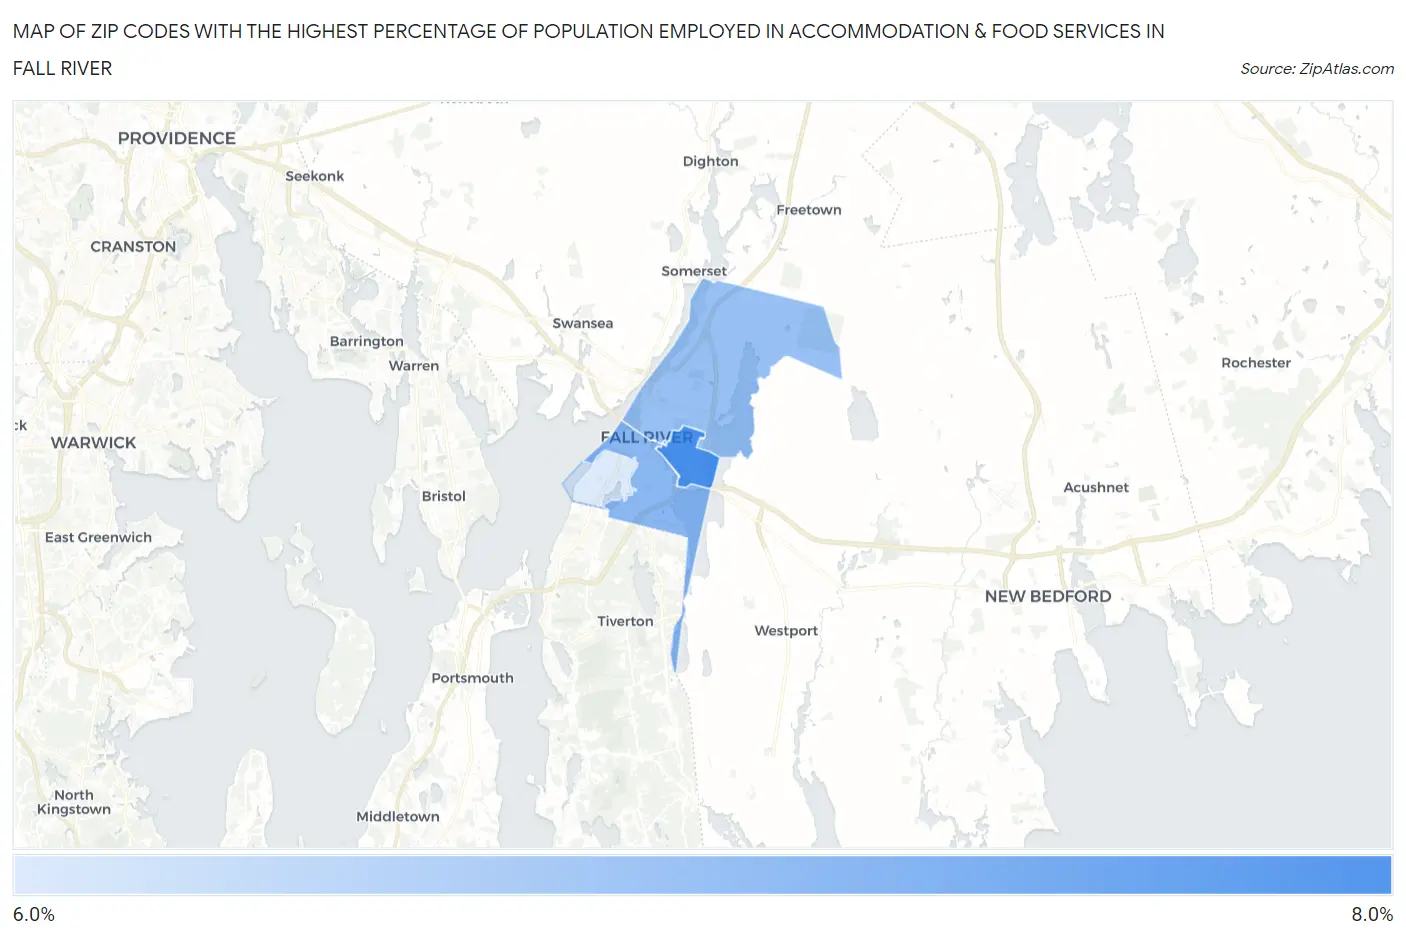
Zip Codes with the Highest Percentage of Population Employed in Accommodation & Food Services in Fall River, MA
RELATED REPORTS & OPTIONS
Accommodation & Food Services
Fall River
Compare Zip Codes
Map of Zip Codes with the Highest Percentage of Population Employed in Accommodation & Food Services in Fall River
6.1%
7.4%
Zip Codes with the Highest Percentage of Population Employed in Accommodation & Food Services in Fall River, MA
| Zip Code | % Employed | vs State | vs National | |
| 1. | 02723 | 7.4% | 5.8%(+1.66)#118 | 6.9%(+0.545)#9,186 |
| 2. | 02721 | 6.9% | 5.8%(+1.09)#148 | 6.9%(-0.031)#10,722 |
| 3. | 02720 | 6.7% | 5.8%(+0.971)#151 | 6.9%(-0.147)#11,100 |
| 4. | 02724 | 6.1% | 5.8%(+0.376)#181 | 6.9%(-0.743)#13,004 |
1
Common Questions
What are the Top 3 Zip Codes with the Highest Percentage of Population Employed in Accommodation & Food Services in Fall River, MA?
Top 3 Zip Codes with the Highest Percentage of Population Employed in Accommodation & Food Services in Fall River, MA are:
What zip code has the Highest Percentage of Population Employed in Accommodation & Food Services in Fall River, MA?
02723 has the Highest Percentage of Population Employed in Accommodation & Food Services in Fall River, MA with 7.4%.
What is the Percentage of Population Employed in Accommodation & Food Services in Fall River, MA?
Percentage of Population Employed in Accommodation & Food Services in Fall River is 6.7%.
What is the Percentage of Population Employed in Accommodation & Food Services in Massachusetts?
Percentage of Population Employed in Accommodation & Food Services in Massachusetts is 5.8%.
What is the Percentage of Population Employed in Accommodation & Food Services in the United States?
Percentage of Population Employed in Accommodation & Food Services in the United States is 6.9%.