Zip Codes with the Highest Percentage of Population Employed in Accommodation & Food Services in North Easton, MA
RELATED REPORTS & OPTIONS
Accommodation & Food Services
North Easton
Compare Zip Codes
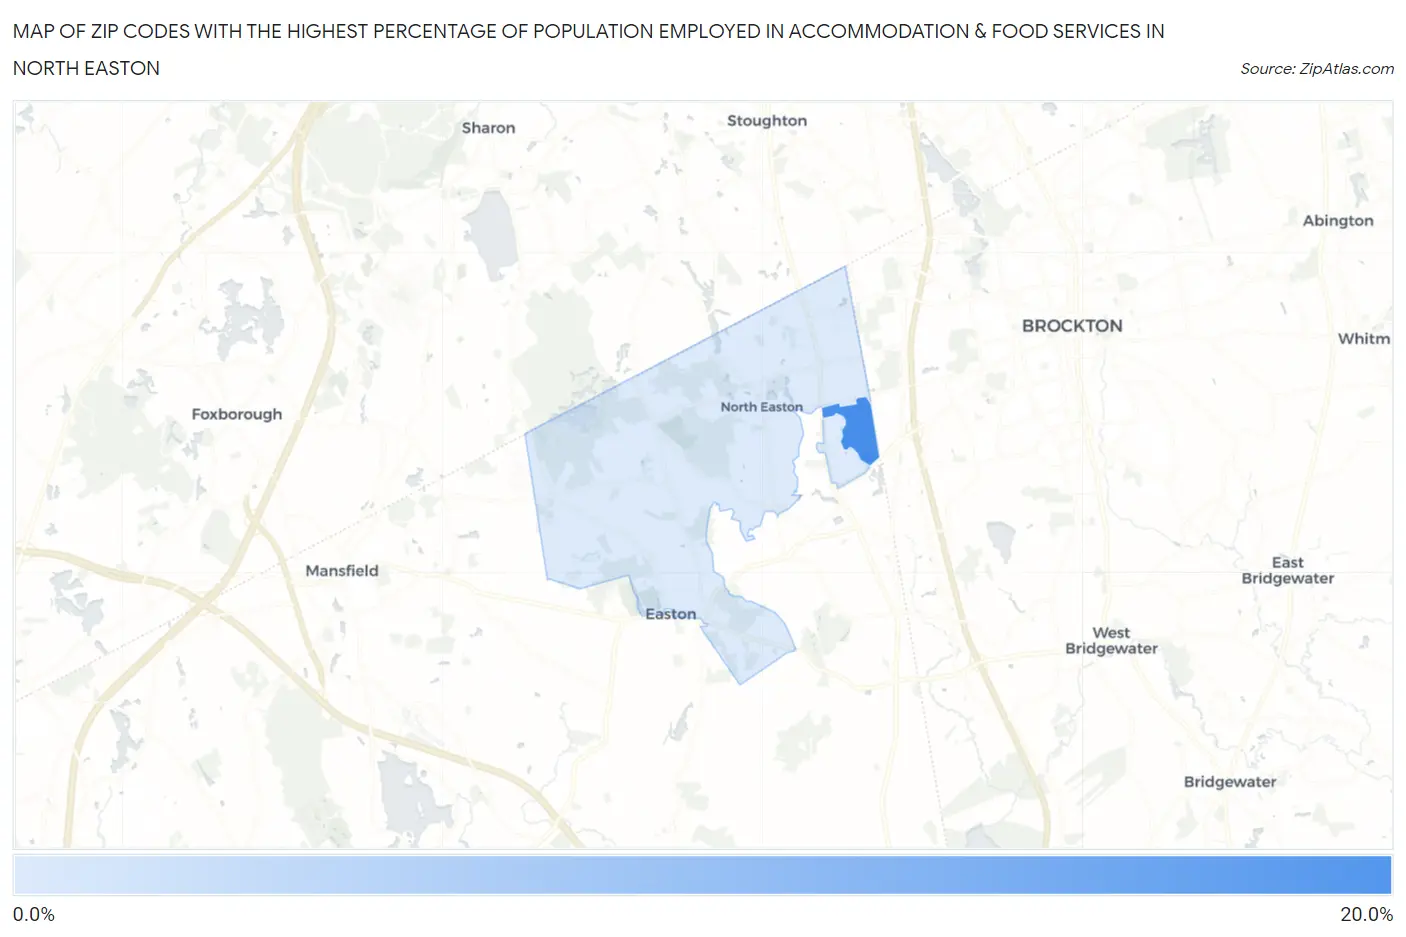
Map of Zip Codes with the Highest Percentage of Population Employed in Accommodation & Food Services in North Easton
2.8%
19.4%
Zip Codes with the Highest Percentage of Population Employed in Accommodation & Food Services in North Easton, MA
| Zip Code | % Employed | vs State | vs National | |
| 1. | 02357 | 19.4% | 5.8%(+13.6)#8 | 6.9%(+12.5)#898 |
| 2. | 02356 | 2.8% | 5.8%(-2.94)#422 | 6.9%(-4.06)#23,671 |
1
Common Questions
What are the Top Zip Codes with the Highest Percentage of Population Employed in Accommodation & Food Services in North Easton, MA?
Top Zip Codes with the Highest Percentage of Population Employed in Accommodation & Food Services in North Easton, MA are:
What zip code has the Highest Percentage of Population Employed in Accommodation & Food Services in North Easton, MA?
02357 has the Highest Percentage of Population Employed in Accommodation & Food Services in North Easton, MA with 19.4%.
What is the Percentage of Population Employed in Accommodation & Food Services in Massachusetts?
Percentage of Population Employed in Accommodation & Food Services in Massachusetts is 5.8%.
What is the Percentage of Population Employed in Accommodation & Food Services in the United States?
Percentage of Population Employed in Accommodation & Food Services in the United States is 6.9%.