Zip Codes with the Highest Poverty Level Among Children Under the Age of 5 in Massachusetts
RELATED REPORTS & OPTIONS
Highest Poverty | Child 0-5
Massachusetts
Compare Zip Codes
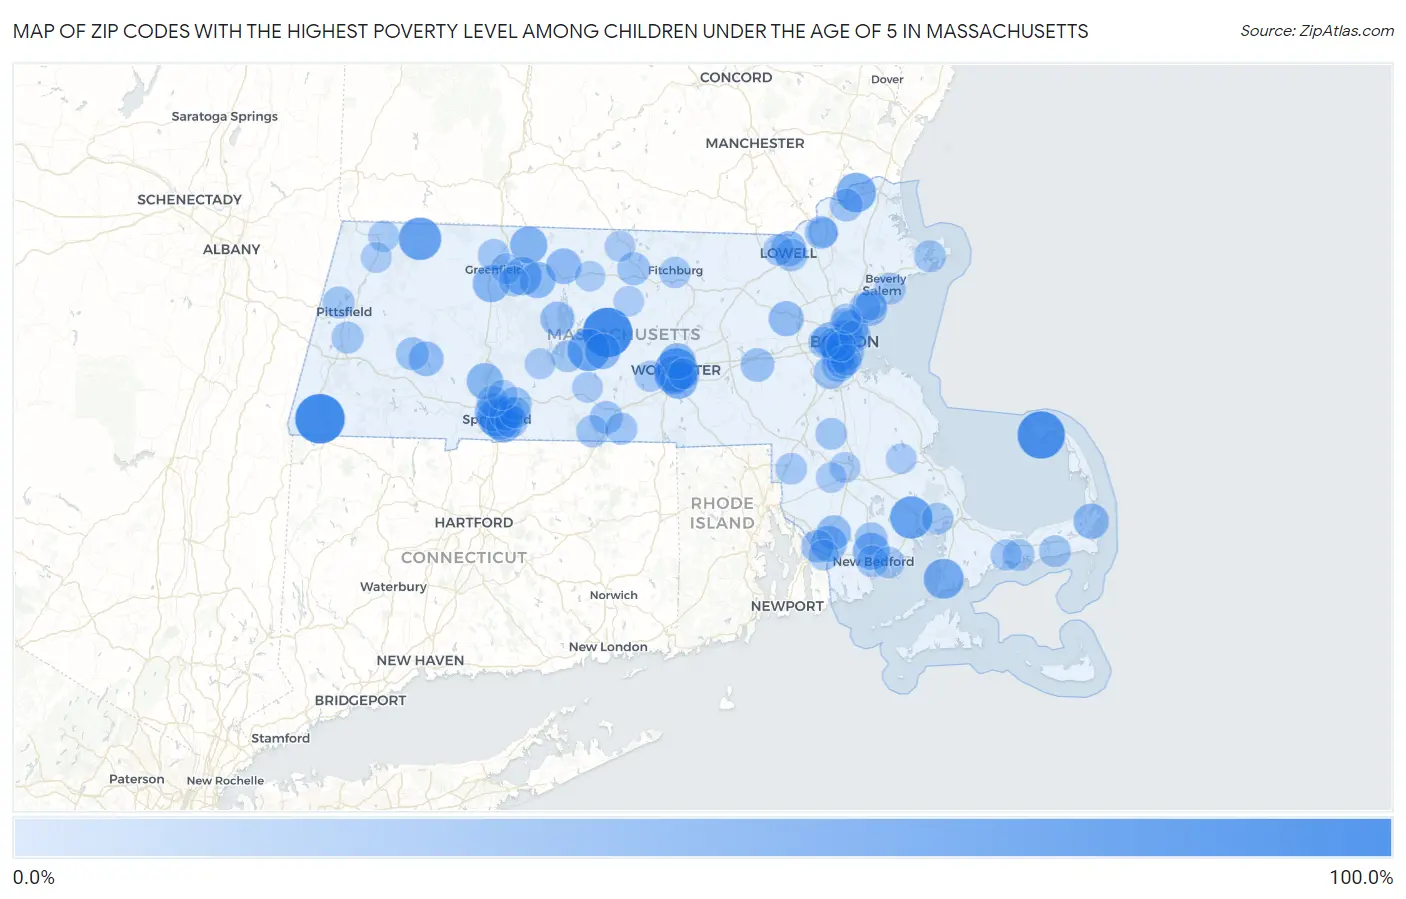
Map of Zip Codes with the Highest Poverty Level Among Children Under the Age of 5 in Massachusetts
0.0%
100.0%
Zip Codes with the Highest Poverty Level Among Children Under the Age of 5 in Massachusetts
| Zip Code | Child Poverty | vs State | vs National | |
| 1. | 01257 | 100.0% | 12.6%(+87.4)#1 | 18.1%(+81.9)#19 |
| 2. | 01074 | 100.0% | 12.6%(+87.4)#2 | 18.1%(+81.9)#159 |
| 3. | 02657 | 90.6% | 12.6%(+78.0)#3 | 18.1%(+72.6)#632 |
| 4. | 01608 | 72.2% | 12.6%(+59.6)#4 | 18.1%(+54.1)#1,078 |
| 5. | 01367 | 69.2% | 12.6%(+56.6)#5 | 18.1%(+51.2)#1,184 |
| 6. | 02576 | 67.9% | 12.6%(+55.3)#6 | 18.1%(+49.8)#1,232 |
| 7. | 01031 | 67.4% | 12.6%(+54.8)#7 | 18.1%(+49.3)#1,260 |
| 8. | 02540 | 58.3% | 12.6%(+45.7)#8 | 18.1%(+40.3)#1,804 |
| 9. | 01860 | 56.1% | 12.6%(+43.5)#9 | 18.1%(+38.0)#1,982 |
| 10. | 01105 | 54.7% | 12.6%(+42.1)#10 | 18.1%(+36.7)#2,089 |
| 11. | 01610 | 50.7% | 12.6%(+38.2)#11 | 18.1%(+32.7)#2,449 |
| 12. | 01103 | 50.5% | 12.6%(+38.0)#12 | 18.1%(+32.5)#2,479 |
| 13. | 01349 | 48.9% | 12.6%(+36.3)#13 | 18.1%(+30.9)#2,701 |
| 14. | 01607 | 48.4% | 12.6%(+35.8)#14 | 18.1%(+30.3)#2,767 |
| 15. | 01107 | 48.1% | 12.6%(+35.5)#15 | 18.1%(+30.1)#2,795 |
| 16. | 01360 | 45.8% | 12.6%(+33.2)#16 | 18.1%(+27.7)#3,082 |
| 17. | 02746 | 44.7% | 12.6%(+32.1)#17 | 18.1%(+26.6)#3,227 |
| 18. | 01342 | 44.6% | 12.6%(+32.0)#18 | 18.1%(+26.5)#3,235 |
| 19. | 01040 | 43.1% | 12.6%(+30.5)#19 | 18.1%(+25.1)#3,459 |
| 20. | 01379 | 42.1% | 12.6%(+29.5)#20 | 18.1%(+24.0)#3,644 |
| 21. | 01605 | 41.3% | 12.6%(+28.7)#21 | 18.1%(+23.2)#3,789 |
| 22. | 02723 | 40.8% | 12.6%(+28.2)#22 | 18.1%(+22.7)#3,876 |
| 23. | 01531 | 39.3% | 12.6%(+26.7)#23 | 18.1%(+21.2)#4,154 |
| 24. | 01364 | 38.8% | 12.6%(+26.2)#24 | 18.1%(+20.7)#4,250 |
| 25. | 02125 | 38.6% | 12.6%(+26.1)#25 | 18.1%(+20.6)#4,273 |
| 26. | 02134 | 38.4% | 12.6%(+25.8)#26 | 18.1%(+20.3)#4,327 |
| 27. | 02653 | 38.2% | 12.6%(+25.6)#27 | 18.1%(+20.1)#4,372 |
| 28. | 01108 | 37.9% | 12.6%(+25.3)#28 | 18.1%(+19.8)#4,438 |
| 29. | 02113 | 37.1% | 12.6%(+24.5)#29 | 18.1%(+19.0)#4,583 |
| 30. | 01773 | 36.9% | 12.6%(+24.3)#30 | 18.1%(+18.8)#4,613 |
| 31. | 01850 | 36.8% | 12.6%(+24.2)#31 | 18.1%(+18.7)#4,632 |
| 32. | 01050 | 35.0% | 12.6%(+22.4)#32 | 18.1%(+17.0)#5,053 |
| 33. | 01901 | 34.1% | 12.6%(+21.6)#33 | 18.1%(+16.1)#5,266 |
| 34. | 02720 | 33.8% | 12.6%(+21.2)#34 | 18.1%(+15.7)#5,353 |
| 35. | 02150 | 33.7% | 12.6%(+21.2)#35 | 18.1%(+15.7)#5,359 |
| 36. | 01109 | 33.7% | 12.6%(+21.1)#36 | 18.1%(+15.7)#5,365 |
| 37. | 01355 | 33.3% | 12.6%(+20.7)#37 | 18.1%(+15.3)#5,471 |
| 38. | 02126 | 33.1% | 12.6%(+20.5)#38 | 18.1%(+15.0)#5,579 |
| 39. | 02119 | 31.5% | 12.6%(+18.9)#39 | 18.1%(+13.4)#5,963 |
| 40. | 02121 | 30.8% | 12.6%(+18.2)#40 | 18.1%(+12.8)#6,138 |
| 41. | 01702 | 30.3% | 12.6%(+17.7)#41 | 18.1%(+12.3)#6,257 |
| 42. | 01151 | 29.6% | 12.6%(+17.0)#42 | 18.1%(+11.5)#6,485 |
| 43. | 02120 | 29.4% | 12.6%(+16.8)#43 | 18.1%(+11.3)#6,545 |
| 44. | 02136 | 28.7% | 12.6%(+16.1)#44 | 18.1%(+10.7)#6,727 |
| 45. | 02149 | 28.6% | 12.6%(+16.1)#45 | 18.1%(+10.6)#6,756 |
| 46. | 01841 | 28.3% | 12.6%(+15.7)#46 | 18.1%(+10.3)#6,875 |
| 47. | 01011 | 28.2% | 12.6%(+15.6)#47 | 18.1%(+10.1)#6,912 |
| 48. | 01440 | 28.0% | 12.6%(+15.4)#48 | 18.1%(+9.97)#6,958 |
| 49. | 01118 | 27.8% | 12.6%(+15.2)#49 | 18.1%(+9.71)#7,025 |
| 50. | 01830 | 27.4% | 12.6%(+14.8)#50 | 18.1%(+9.29)#7,183 |
| 51. | 01518 | 27.3% | 12.6%(+14.7)#51 | 18.1%(+9.21)#7,210 |
| 52. | 01852 | 26.9% | 12.6%(+14.3)#52 | 18.1%(+8.82)#7,343 |
| 53. | 02724 | 26.8% | 12.6%(+14.3)#53 | 18.1%(+8.78)#7,356 |
| 54. | 02745 | 26.5% | 12.6%(+13.9)#54 | 18.1%(+8.46)#7,470 |
| 55. | 01521 | 25.3% | 12.6%(+12.7)#55 | 18.1%(+7.24)#7,882 |
| 56. | 02124 | 24.5% | 12.6%(+12.0)#56 | 18.1%(+6.48)#8,162 |
| 57. | 01550 | 24.3% | 12.6%(+11.7)#57 | 18.1%(+6.26)#8,240 |
| 58. | 02215 | 23.9% | 12.6%(+11.3)#58 | 18.1%(+5.81)#8,408 |
| 59. | 01240 | 23.3% | 12.6%(+10.7)#59 | 18.1%(+5.24)#8,647 |
| 60. | 01930 | 23.2% | 12.6%(+10.6)#60 | 18.1%(+5.17)#8,669 |
| 61. | 01201 | 23.1% | 12.6%(+10.5)#61 | 18.1%(+5.04)#8,725 |
| 62. | 02639 | 22.9% | 12.6%(+10.3)#62 | 18.1%(+4.79)#8,809 |
| 63. | 01119 | 22.8% | 12.6%(+10.3)#63 | 18.1%(+4.77)#8,825 |
| 64. | 02740 | 22.8% | 12.6%(+10.2)#64 | 18.1%(+4.75)#8,832 |
| 65. | 02538 | 22.8% | 12.6%(+10.2)#65 | 18.1%(+4.74)#8,840 |
| 66. | 01301 | 22.6% | 12.6%(+9.97)#66 | 18.1%(+4.49)#8,940 |
| 67. | 02601 | 22.6% | 12.6%(+9.97)#67 | 18.1%(+4.49)#8,941 |
| 68. | 02356 | 22.5% | 12.6%(+9.90)#68 | 18.1%(+4.42)#8,971 |
| 69. | 02128 | 22.4% | 12.6%(+9.85)#69 | 18.1%(+4.37)#8,993 |
| 70. | 01082 | 22.4% | 12.6%(+9.82)#70 | 18.1%(+4.34)#9,004 |
| 71. | 01013 | 22.0% | 12.6%(+9.42)#71 | 18.1%(+3.94)#9,191 |
| 72. | 02719 | 22.0% | 12.6%(+9.41)#72 | 18.1%(+3.93)#9,198 |
| 73. | 01970 | 21.9% | 12.6%(+9.32)#73 | 18.1%(+3.84)#9,233 |
| 74. | 02703 | 21.6% | 12.6%(+9.06)#74 | 18.1%(+3.58)#9,336 |
| 75. | 01420 | 20.8% | 12.6%(+8.18)#75 | 18.1%(+2.70)#9,699 |
| 76. | 02122 | 20.6% | 12.6%(+8.06)#76 | 18.1%(+2.58)#9,740 |
| 77. | 01905 | 20.5% | 12.6%(+7.96)#77 | 18.1%(+2.49)#9,784 |
| 78. | 02135 | 20.5% | 12.6%(+7.95)#78 | 18.1%(+2.47)#9,789 |
| 79. | 01604 | 20.4% | 12.6%(+7.77)#79 | 18.1%(+2.30)#9,862 |
| 80. | 01854 | 20.1% | 12.6%(+7.52)#80 | 18.1%(+2.04)#9,973 |
| 81. | 02632 | 20.1% | 12.6%(+7.49)#81 | 18.1%(+2.01)#9,986 |
| 82. | 01524 | 19.8% | 12.6%(+7.17)#82 | 18.1%(+1.70)#10,152 |
| 83. | 01247 | 19.7% | 12.6%(+7.09)#83 | 18.1%(+1.62)#10,187 |
| 84. | 01902 | 19.4% | 12.6%(+6.83)#84 | 18.1%(+1.36)#10,301 |
| 85. | 02721 | 19.1% | 12.6%(+6.50)#85 | 18.1%(+1.03)#10,462 |
| 86. | 01376 | 19.1% | 12.6%(+6.50)#86 | 18.1%(+1.02)#10,463 |
| 87. | 01475 | 18.6% | 12.6%(+5.98)#87 | 18.1%(+0.503)#10,697 |
| 88. | 01220 | 18.4% | 12.6%(+5.84)#88 | 18.1%(+0.366)#10,754 |
| 89. | 02767 | 18.4% | 12.6%(+5.82)#89 | 18.1%(+0.342)#10,765 |
| 90. | 01007 | 18.3% | 12.6%(+5.69)#90 | 18.1%(+0.210)#10,816 |
| 91. | 02367 | 17.9% | 12.6%(+5.30)#91 | 18.1%(-0.177)#11,010 |
| 92. | 02780 | 17.9% | 12.6%(+5.29)#92 | 18.1%(-0.190)#11,016 |
| 93. | 01840 | 17.8% | 12.6%(+5.23)#93 | 18.1%(-0.248)#11,048 |
| 94. | 01083 | 17.6% | 12.6%(+5.02)#94 | 18.1%(-0.453)#11,152 |
| 95. | 02118 | 17.3% | 12.6%(+4.67)#95 | 18.1%(-0.808)#11,295 |
| 96. | 01452 | 17.2% | 12.6%(+4.60)#96 | 18.1%(-0.875)#11,339 |
| 97. | 01351 | 17.1% | 12.6%(+4.56)#97 | 18.1%(-0.920)#11,356 |
| 98. | 01331 | 16.9% | 12.6%(+4.35)#98 | 18.1%(-1.13)#11,452 |
| 99. | 02148 | 16.9% | 12.6%(+4.32)#99 | 18.1%(-1.16)#11,463 |
| 100. | 01020 | 16.4% | 12.6%(+3.77)#100 | 18.1%(-1.70)#11,719 |
Common Questions
What are the Top 10 Zip Codes with the Highest Poverty Level Among Children Under the Age of 5 in Massachusetts?
Top 10 Zip Codes with the Highest Poverty Level Among Children Under the Age of 5 in Massachusetts are:
What zip code has the Highest Poverty Level Among Children Under the Age of 5 in Massachusetts?
01257 has the Highest Poverty Level Among Children Under the Age of 5 in Massachusetts with 100.0%.
What is the Poverty Level Among Children Under the Age of 5 in the State of Massachusetts?
Poverty Level Among Children Under the Age of 5 in Massachusetts is 12.6%.
What is the Poverty Level Among Children Under the Age of 5 in the United States?
Poverty Level Among Children Under the Age of 5 in the United States is 18.1%.