Keenes, IL Map & Demographics
Keenes Map
Keenes Overview
$32,253
PER CAPITA INCOME
$68,125
AVG FAMILY INCOME
$54,545
AVG HOUSEHOLD INCOME
42.6%
WAGE / INCOME GAP [ % ]
57.4¢/ $1
WAGE / INCOME GAP [ $ ]
0.17
INEQUALITY / GINI INDEX
60
TOTAL POPULATION
32
MALE POPULATION
28
FEMALE POPULATION
114.29
MALES / 100 FEMALES
87.50
FEMALES / 100 MALES
51.0
MEDIAN AGE
2.5
AVG FAMILY SIZE
1.9
AVG HOUSEHOLD SIZE
26
LABOR FORCE [ PEOPLE ]
45.6%
PERCENT IN LABOR FORCE
Keenes Zip Codes
Keenes Area Codes
Income in Keenes
Income Overview in Keenes
Per Capita Income in Keenes is $32,253, while median incomes of families and households are $68,125 and $54,545 respectively.
| Characteristic | Number | Measure |
| Per Capita Income | 60 | $32,253 |
| Median Family Income | 17 | $68,125 |
| Mean Family Income | 17 | $65,524 |
| Median Household Income | 32 | $54,545 |
| Mean Household Income | 32 | $60,763 |
| Income Deficit | 17 | $0 |
| Wage / Income Gap (%) | 60 | 42.57% |
| Wage / Income Gap ($) | 60 | 57.43¢ per $1 |
| Gini / Inequality Index | 60 | 0.17 |
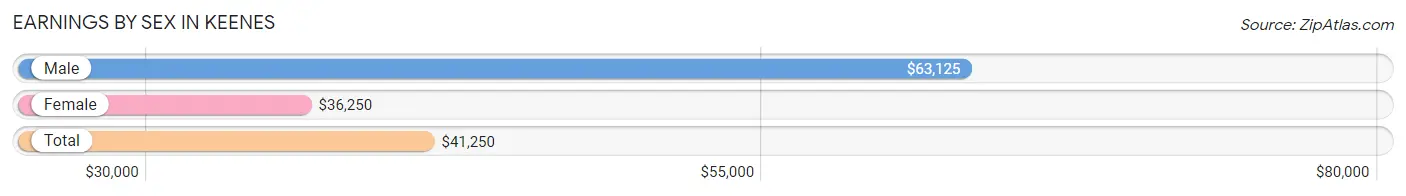
Earnings by Sex in Keenes
Average Earnings in Keenes are $41,250, $63,125 for men and $36,250 for women, a difference of 42.6%.
| Sex | Number | Average Earnings |
| Male | 15 (50.0%) | $63,125 |
| Female | 15 (50.0%) | $36,250 |
| Total | 30 (100.0%) | $41,250 |
Earnings by Sex by Income Bracket in Keenes
The most common earnings brackets in Keenes are $55,000 to $64,999 for men (6 | 40.0%) and $45,000 to $49,999 for women (4 | 26.7%).

| Income | Male | Female |
| $2,499 or less | 4 (26.7%) | 0 (0.0%) |
| $2,500 to $4,999 | 0 (0.0%) | 0 (0.0%) |
| $5,000 to $7,499 | 0 (0.0%) | 0 (0.0%) |
| $7,500 to $9,999 | 0 (0.0%) | 0 (0.0%) |
| $10,000 to $12,499 | 0 (0.0%) | 3 (20.0%) |
| $12,500 to $14,999 | 0 (0.0%) | 0 (0.0%) |
| $15,000 to $17,499 | 0 (0.0%) | 0 (0.0%) |
| $17,500 to $19,999 | 0 (0.0%) | 0 (0.0%) |
| $20,000 to $22,499 | 0 (0.0%) | 0 (0.0%) |
| $22,500 to $24,999 | 0 (0.0%) | 0 (0.0%) |
| $25,000 to $29,999 | 1 (6.7%) | 0 (0.0%) |
| $30,000 to $34,999 | 1 (6.7%) | 3 (20.0%) |
| $35,000 to $39,999 | 0 (0.0%) | 3 (20.0%) |
| $40,000 to $44,999 | 0 (0.0%) | 0 (0.0%) |
| $45,000 to $49,999 | 0 (0.0%) | 4 (26.7%) |
| $50,000 to $54,999 | 0 (0.0%) | 1 (6.7%) |
| $55,000 to $64,999 | 6 (40.0%) | 0 (0.0%) |
| $65,000 to $74,999 | 0 (0.0%) | 0 (0.0%) |
| $75,000 to $99,999 | 3 (20.0%) | 0 (0.0%) |
| $100,000+ | 0 (0.0%) | 1 (6.7%) |
| Total | 15 (100.0%) | 15 (100.0%) |
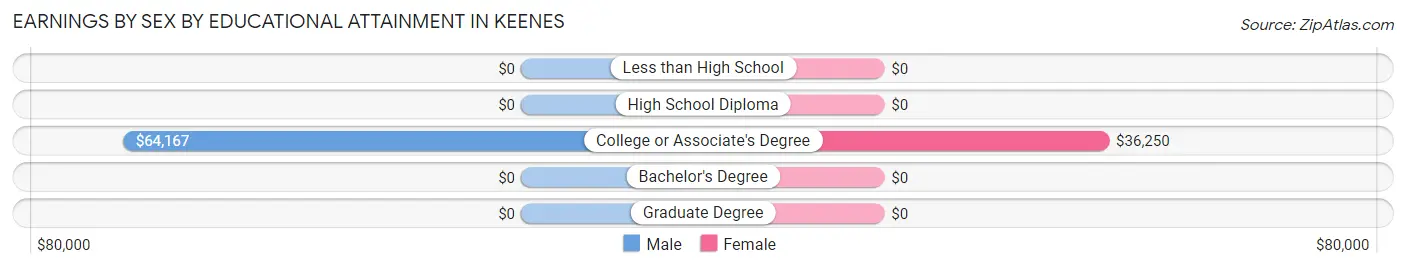
Earnings by Sex by Educational Attainment in Keenes
Average earnings in Keenes are $63,333 for men and $36,250 for women, a difference of 42.8%. Men with an educational attainment of college or associate's degree enjoy the highest average annual earnings of $64,167, while those with college or associate's degree education earn the least with $64,167. Women with an educational attainment of college or associate's degree earn the most with the average annual earnings of $36,250, while those with college or associate's degree education have the smallest earnings of $36,250.
| Educational Attainment | Male Income | Female Income |
| Less than High School | - | - |
| High School Diploma | - | - |
| College or Associate's Degree | $64,167 | $36,250 |
| Bachelor's Degree | - | - |
| Graduate Degree | - | - |
| Total | $63,333 | $36,250 |
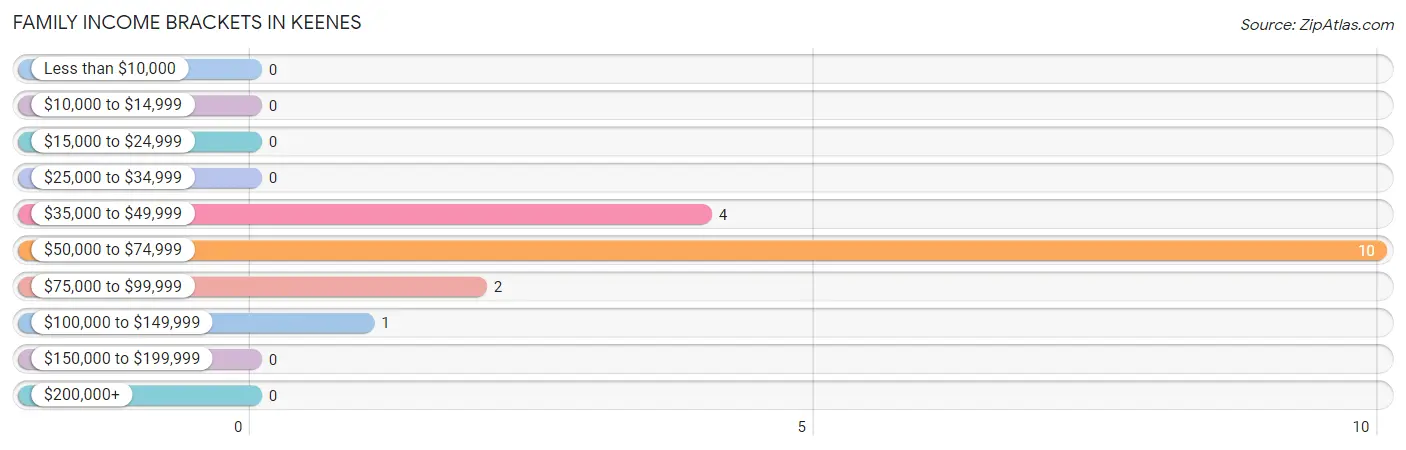
Family Income in Keenes
Family Income Brackets in Keenes
According to the Keenes family income data, there are 10 families falling into the $50,000 to $74,999 income range, which is the most common income bracket and makes up 58.8% of all families.
| Income Bracket | # Families | % Families |
| Less than $10,000 | 0 | 0.0% |
| $10,000 to $14,999 | 0 | 0.0% |
| $15,000 to $24,999 | 0 | 0.0% |
| $25,000 to $34,999 | 0 | 0.0% |
| $35,000 to $49,999 | 4 | 23.5% |
| $50,000 to $74,999 | 10 | 58.8% |
| $75,000 to $99,999 | 2 | 11.8% |
| $100,000 to $149,999 | 1 | 5.9% |
| $150,000 to $199,999 | 0 | 0.0% |
| $200,000+ | 0 | 0.0% |
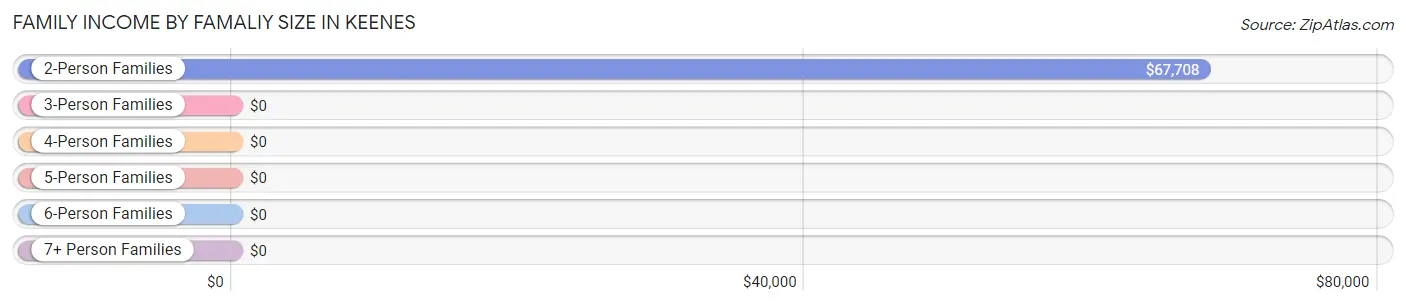
Family Income by Famaliy Size in Keenes
2-person families (15 | 88.2%) account for the highest median family income in Keenes with $67,708 per family, while 2-person families (15 | 88.2%) have the highest median income of $33,854 per family member.
| Income Bracket | # Families | Median Income |
| 2-Person Families | 15 (88.2%) | $67,708 |
| 3-Person Families | 1 (5.9%) | $0 |
| 4-Person Families | 1 (5.9%) | $0 |
| 5-Person Families | 0 (0.0%) | $0 |
| 6-Person Families | 0 (0.0%) | $0 |
| 7+ Person Families | 0 (0.0%) | $0 |
| Total | 17 (100.0%) | $68,125 |
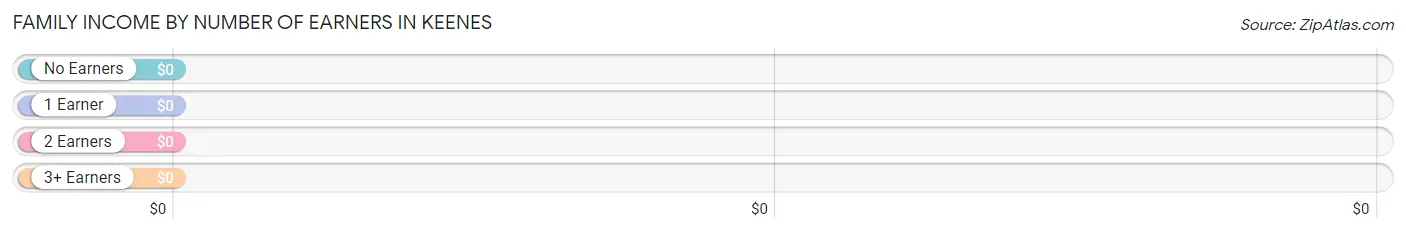
Family Income by Number of Earners in Keenes
| Number of Earners | # Families | Median Income |
| No Earners | 5 (29.4%) | $0 |
| 1 Earner | 7 (41.2%) | $0 |
| 2 Earners | 4 (23.5%) | $0 |
| 3+ Earners | 1 (5.9%) | $0 |
| Total | 17 (100.0%) | $68,125 |
Household Income in Keenes
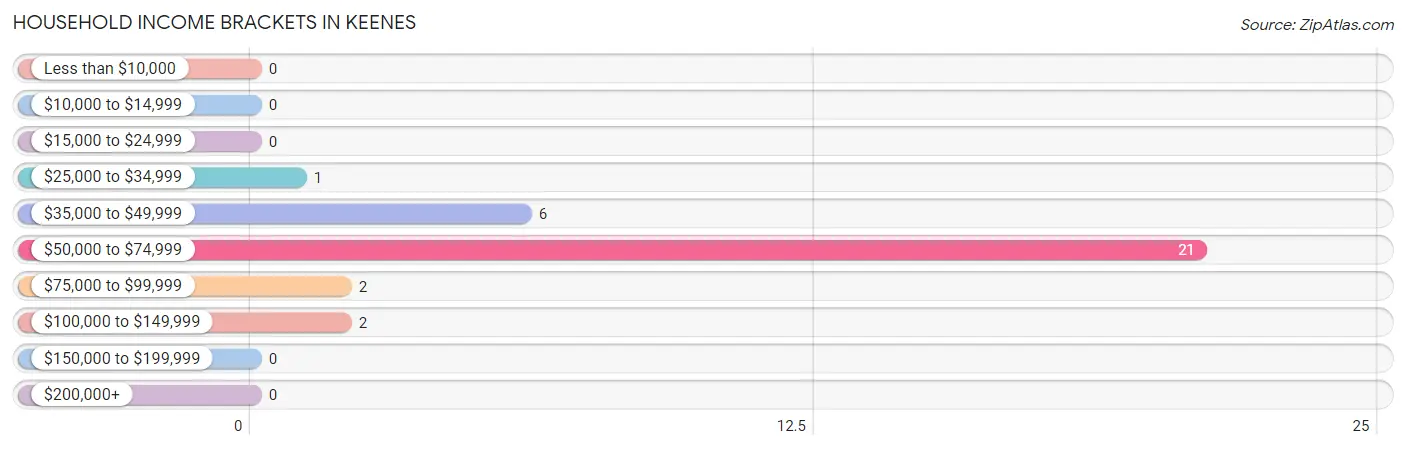
Household Income Brackets in Keenes
With 21 households falling in the category, the $50,000 to $74,999 income range is the most frequent in Keenes, accounting for 65.6% of all households.
| Income Bracket | # Households | % Households |
| Less than $10,000 | 0 | 0.0% |
| $10,000 to $14,999 | 0 | 0.0% |
| $15,000 to $24,999 | 0 | 0.0% |
| $25,000 to $34,999 | 1 | 3.1% |
| $35,000 to $49,999 | 6 | 18.8% |
| $50,000 to $74,999 | 21 | 65.6% |
| $75,000 to $99,999 | 2 | 6.3% |
| $100,000 to $149,999 | 2 | 6.3% |
| $150,000 to $199,999 | 0 | 0.0% |
| $200,000+ | 0 | 0.0% |
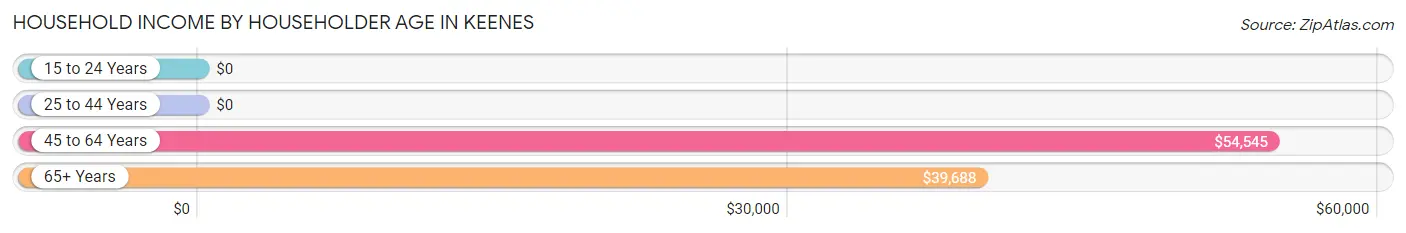
Household Income by Householder Age in Keenes
The median household income in Keenes is $54,545, with the highest median household income of $54,545 found in the 45 to 64 years age bracket for the primary householder. A total of 22 households (68.8%) fall into this category. Meanwhile, the 15 to 24 years age bracket for the primary householder has the lowest median household income of $0, with 1 households (3.1%) in this group.
| Income Bracket | # Households | Median Income |
| 15 to 24 Years | 1 (3.1%) | $0 |
| 25 to 44 Years | 0 (0.0%) | $0 |
| 45 to 64 Years | 22 (68.8%) | $54,545 |
| 65+ Years | 9 (28.1%) | $39,688 |
| Total | 32 (100.0%) | $54,545 |
Poverty in Keenes
Income Below Poverty by Sex and Age in Keenes
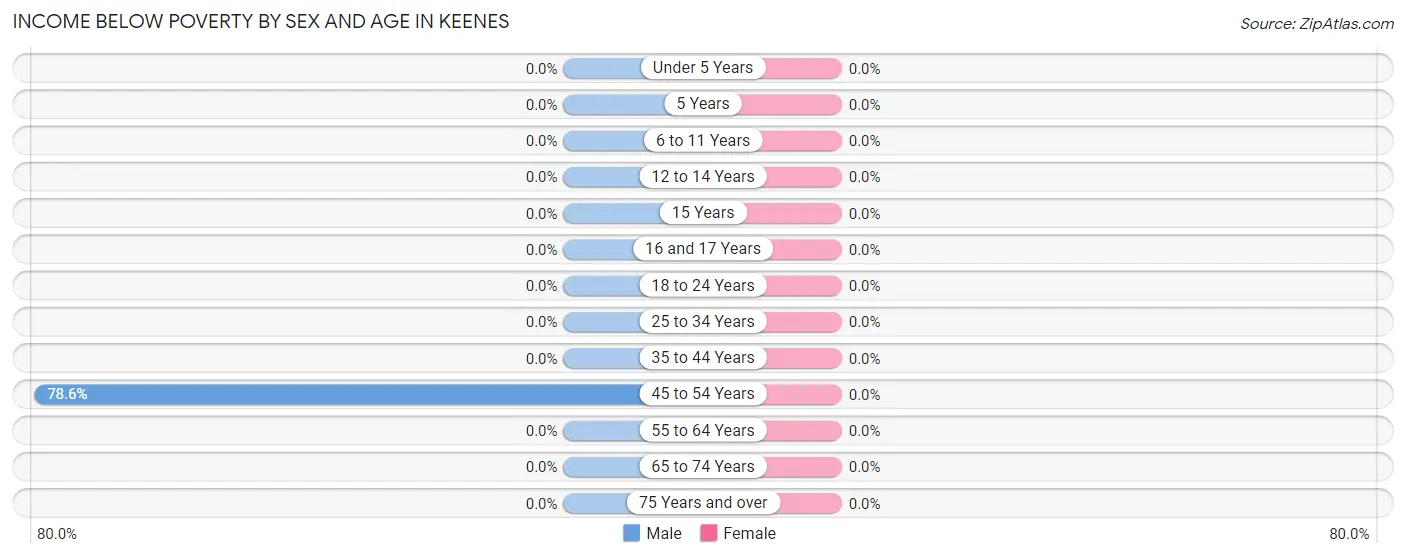
| Age Bracket | Male | Female |
| Under 5 Years | 0 (0.0%) | 0 (0.0%) |
| 5 Years | 0 (0.0%) | 0 (0.0%) |
| 6 to 11 Years | 0 (0.0%) | 0 (0.0%) |
| 12 to 14 Years | 0 (0.0%) | 0 (0.0%) |
| 15 Years | 0 (0.0%) | 0 (0.0%) |
| 16 and 17 Years | 0 (0.0%) | 0 (0.0%) |
| 18 to 24 Years | 0 (0.0%) | 0 (0.0%) |
| 25 to 34 Years | 0 (0.0%) | 0 (0.0%) |
| 35 to 44 Years | 0 (0.0%) | 0 (0.0%) |
| 45 to 54 Years | 11 (78.6%) | 0 (0.0%) |
| 55 to 64 Years | 0 (0.0%) | 0 (0.0%) |
| 65 to 74 Years | 0 (0.0%) | 0 (0.0%) |
| 75 Years and over | 0 (0.0%) | 0 (0.0%) |
| Total | 11 (34.4%) | 0 (0.0%) |
Income Above Poverty by Sex and Age in Keenes
According to the poverty statistics in Keenes, males aged 18 to 24 years and females aged under 5 years are the age groups that are most secure financially, with 100.0% of males and 100.0% of females in these age groups living above the poverty line.
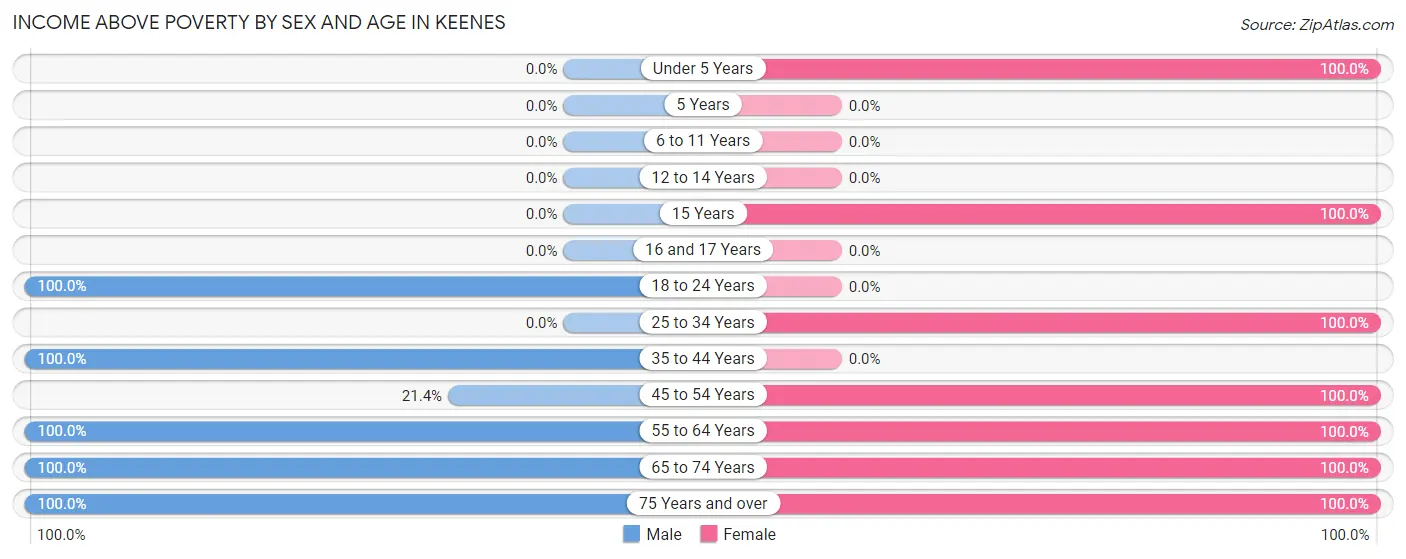
| Age Bracket | Male | Female |
| Under 5 Years | 0 (0.0%) | 1 (100.0%) |
| 5 Years | 0 (0.0%) | 0 (0.0%) |
| 6 to 11 Years | 0 (0.0%) | 0 (0.0%) |
| 12 to 14 Years | 0 (0.0%) | 0 (0.0%) |
| 15 Years | 0 (0.0%) | 2 (100.0%) |
| 16 and 17 Years | 0 (0.0%) | 0 (0.0%) |
| 18 to 24 Years | 1 (100.0%) | 0 (0.0%) |
| 25 to 34 Years | 0 (0.0%) | 3 (100.0%) |
| 35 to 44 Years | 4 (100.0%) | 0 (0.0%) |
| 45 to 54 Years | 3 (21.4%) | 8 (100.0%) |
| 55 to 64 Years | 8 (100.0%) | 1 (100.0%) |
| 65 to 74 Years | 1 (100.0%) | 2 (100.0%) |
| 75 Years and over | 4 (100.0%) | 11 (100.0%) |
| Total | 21 (65.6%) | 28 (100.0%) |
Income Below Poverty Among Married-Couple Families in Keenes
| Children | Above Poverty | Below Poverty |
| No Children | 12 (100.0%) | 0 (0.0%) |
| 1 or 2 Children | 1 (100.0%) | 0 (0.0%) |
| 3 or 4 Children | 0 (0.0%) | 0 (0.0%) |
| 5 or more Children | 0 (0.0%) | 0 (0.0%) |
| Total | 13 (100.0%) | 0 (0.0%) |
Income Below Poverty Among Single-Parent Households in Keenes
| Children | Single Father | Single Mother |
| No Children | 0 (0.0%) | 0 (0.0%) |
| 1 or 2 Children | 0 (0.0%) | 0 (0.0%) |
| 3 or 4 Children | 0 (0.0%) | 0 (0.0%) |
| 5 or more Children | 0 (0.0%) | 0 (0.0%) |
| Total | 0 (0.0%) | 0 (0.0%) |
Income Below Poverty Among Married-Couple vs Single-Parent Households in Keenes
| Children | Married-Couple Families | Single-Parent Households |
| No Children | 0 (0.0%) | 0 (0.0%) |
| 1 or 2 Children | 0 (0.0%) | 0 (0.0%) |
| 3 or 4 Children | 0 (0.0%) | 0 (0.0%) |
| 5 or more Children | 0 (0.0%) | 0 (0.0%) |
| Total | 0 (0.0%) | 0 (0.0%) |
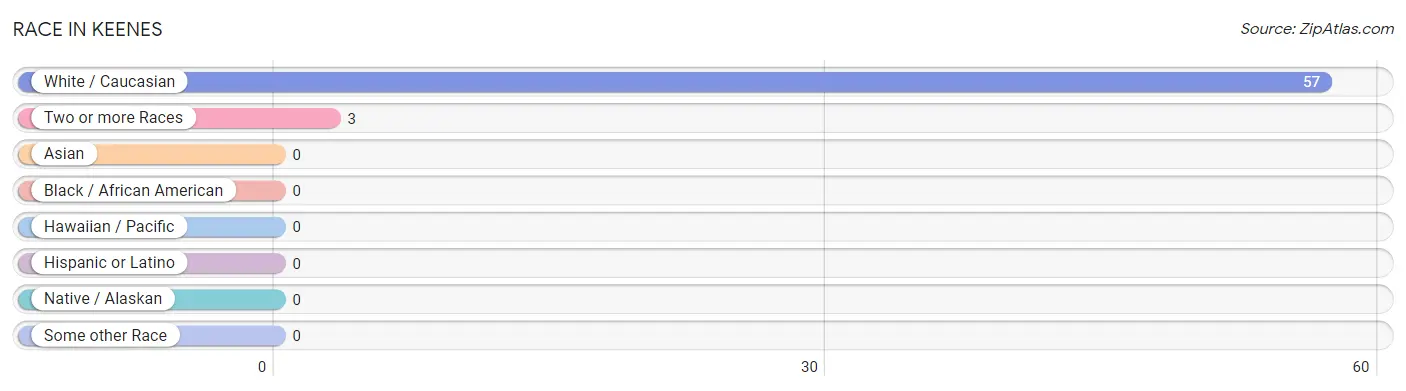
Race in Keenes
The most populous races in Keenes are White / Caucasian (57 | 95.0%), and Two or more Races (3 | 5.0%).
| Race | # Population | % Population |
| Asian | 0 | 0.0% |
| Black / African American | 0 | 0.0% |
| Hawaiian / Pacific | 0 | 0.0% |
| Hispanic or Latino | 0 | 0.0% |
| Native / Alaskan | 0 | 0.0% |
| White / Caucasian | 57 | 95.0% |
| Two or more Races | 3 | 5.0% |
| Some other Race | 0 | 0.0% |
| Total | 60 | 100.0% |
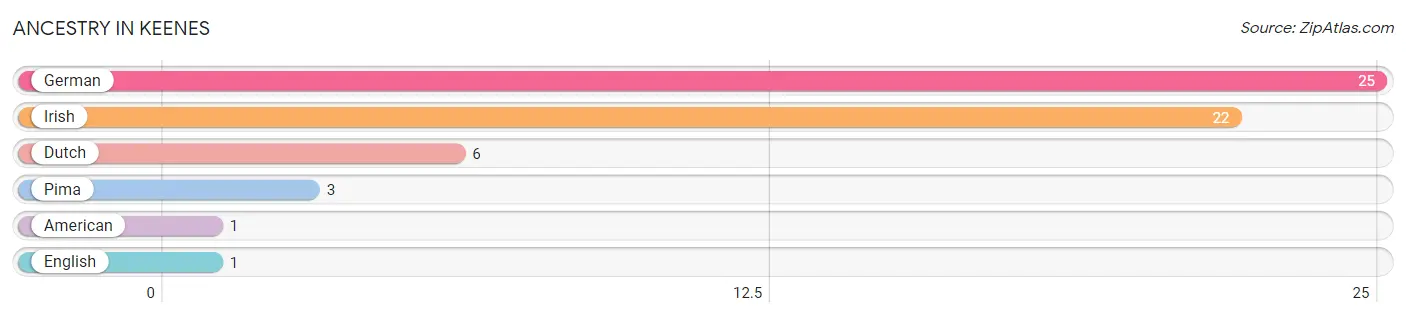
Ancestry in Keenes
The most populous ancestries reported in Keenes are German (25 | 41.7%), Irish (22 | 36.7%), Dutch (6 | 10.0%), Pima (3 | 5.0%), and American (1 | 1.7%), together accounting for 95.0% of all Keenes residents.
| Ancestry | # Population | % Population |
| American | 1 | 1.7% |
| Dutch | 6 | 10.0% |
| English | 1 | 1.7% |
| German | 25 | 41.7% |
| Irish | 22 | 36.7% |
| Pima | 3 | 5.0% | View All 6 Rows |
Immigrants in Keenes

| Immigration Origin | # Population | % Population | View All 0 Rows |
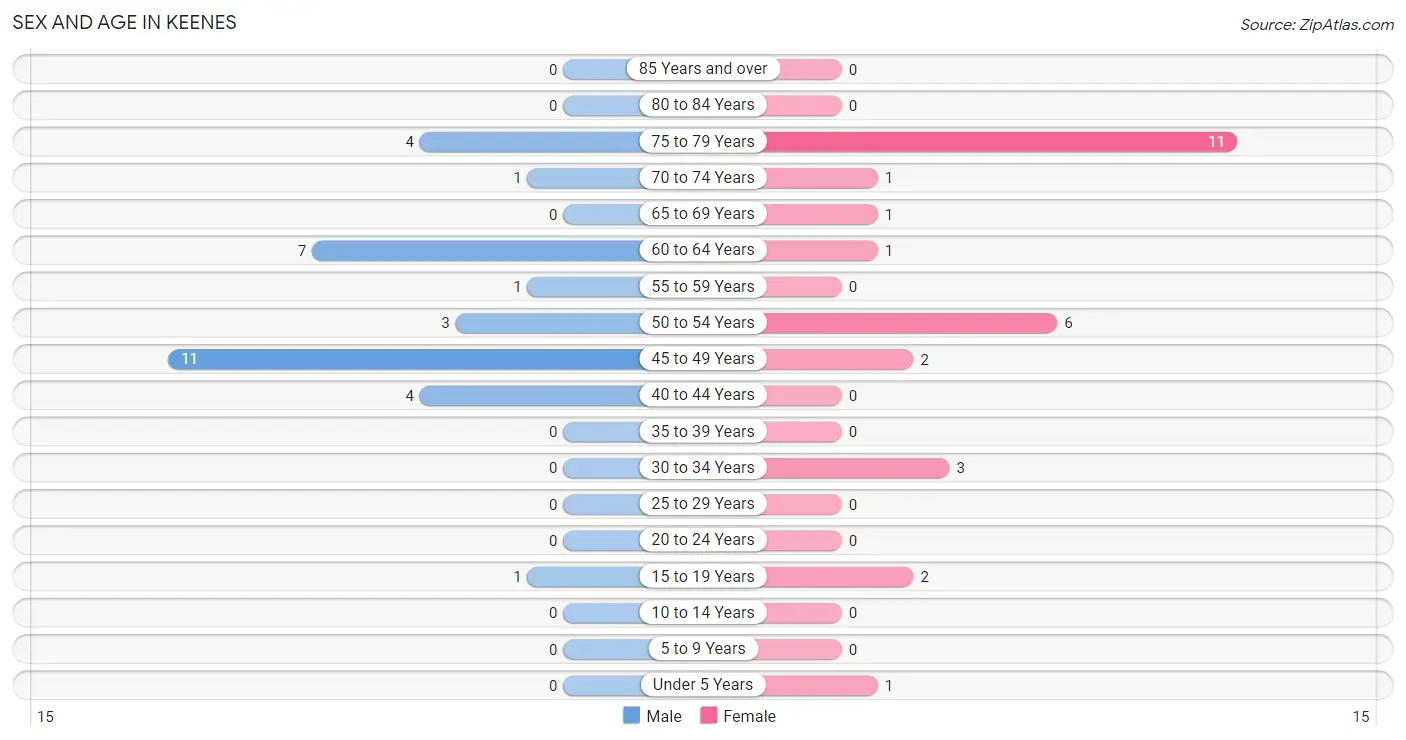
Sex and Age in Keenes
Sex and Age in Keenes
The most populous age groups in Keenes are 45 to 49 Years (11 | 34.4%) for men and 75 to 79 Years (11 | 39.3%) for women.
| Age Bracket | Male | Female |
| Under 5 Years | 0 (0.0%) | 1 (3.6%) |
| 5 to 9 Years | 0 (0.0%) | 0 (0.0%) |
| 10 to 14 Years | 0 (0.0%) | 0 (0.0%) |
| 15 to 19 Years | 1 (3.1%) | 2 (7.1%) |
| 20 to 24 Years | 0 (0.0%) | 0 (0.0%) |
| 25 to 29 Years | 0 (0.0%) | 0 (0.0%) |
| 30 to 34 Years | 0 (0.0%) | 3 (10.7%) |
| 35 to 39 Years | 0 (0.0%) | 0 (0.0%) |
| 40 to 44 Years | 4 (12.5%) | 0 (0.0%) |
| 45 to 49 Years | 11 (34.4%) | 2 (7.1%) |
| 50 to 54 Years | 3 (9.4%) | 6 (21.4%) |
| 55 to 59 Years | 1 (3.1%) | 0 (0.0%) |
| 60 to 64 Years | 7 (21.9%) | 1 (3.6%) |
| 65 to 69 Years | 0 (0.0%) | 1 (3.6%) |
| 70 to 74 Years | 1 (3.1%) | 1 (3.6%) |
| 75 to 79 Years | 4 (12.5%) | 11 (39.3%) |
| 80 to 84 Years | 0 (0.0%) | 0 (0.0%) |
| 85 Years and over | 0 (0.0%) | 0 (0.0%) |
| Total | 32 (100.0%) | 28 (100.0%) |
Families and Households in Keenes
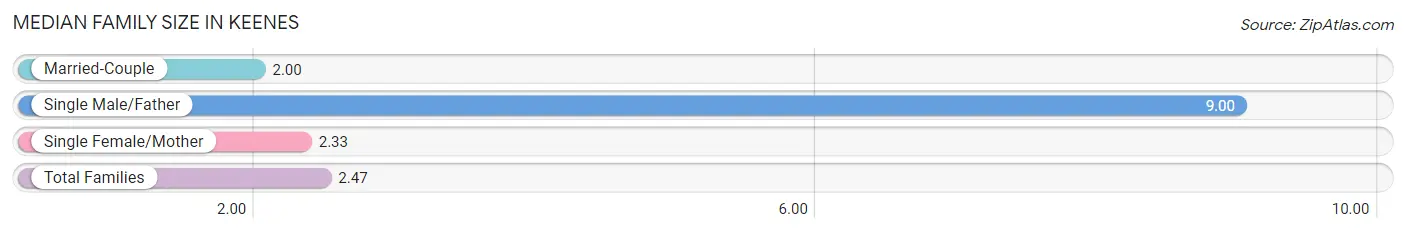
Median Family Size in Keenes
The median family size in Keenes is 2.47 persons per family, with single male/father families (1 | 5.9%) accounting for the largest median family size of 9 persons per family. On the other hand, married-couple families (13 | 76.5%) represent the smallest median family size with 2.00 persons per family.
| Family Type | # Families | Family Size |
| Married-Couple | 13 (76.5%) | 2.00 |
| Single Male/Father | 1 (5.9%) | 9.00 |
| Single Female/Mother | 3 (17.6%) | 2.33 |
| Total Families | 17 (100.0%) | 2.47 |
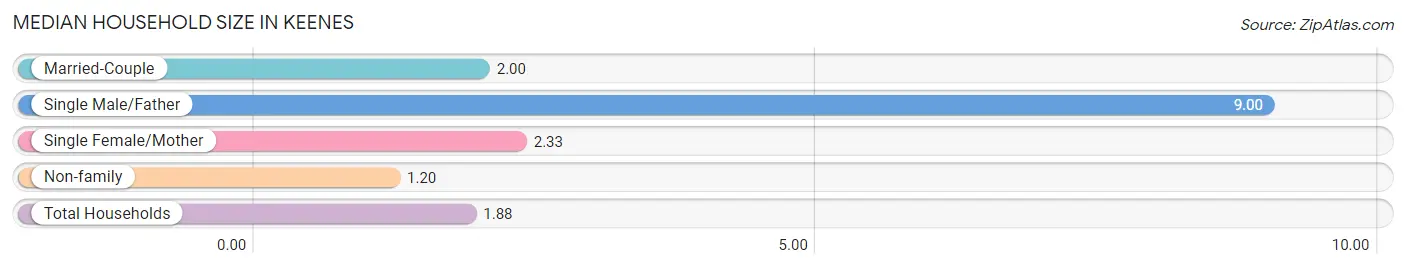
Median Household Size in Keenes
The median household size in Keenes is 1.88 persons per household, with single male/father households (1 | 3.1%) accounting for the largest median household size of 9 persons per household. non-family households (15 | 46.9%) represent the smallest median household size with 1.20 persons per household.
| Household Type | # Households | Household Size |
| Married-Couple | 13 (40.6%) | 2.00 |
| Single Male/Father | 1 (3.1%) | 9.00 |
| Single Female/Mother | 3 (9.4%) | 2.33 |
| Non-family | 15 (46.9%) | 1.20 |
| Total Households | 32 (100.0%) | 1.88 |
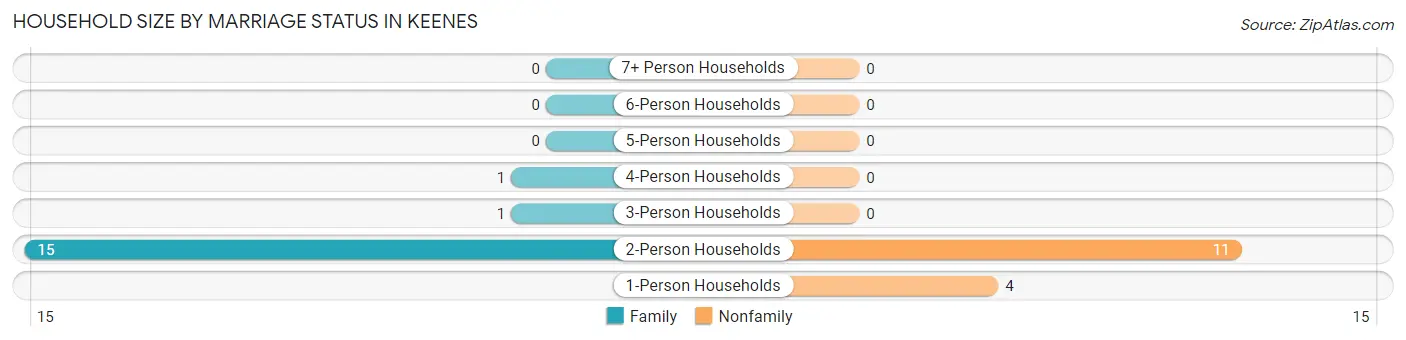
Household Size by Marriage Status in Keenes
Out of a total of 32 households in Keenes, 17 (53.1%) are family households, while 15 (46.9%) are nonfamily households. The most numerous type of family households are 2-person households, comprising 15, and the most common type of nonfamily households are 2-person households, comprising 11.
| Household Size | Family Households | Nonfamily Households |
| 1-Person Households | - | 4 (12.5%) |
| 2-Person Households | 15 (46.9%) | 11 (34.4%) |
| 3-Person Households | 1 (3.1%) | 0 (0.0%) |
| 4-Person Households | 1 (3.1%) | 0 (0.0%) |
| 5-Person Households | 0 (0.0%) | 0 (0.0%) |
| 6-Person Households | 0 (0.0%) | 0 (0.0%) |
| 7+ Person Households | 0 (0.0%) | 0 (0.0%) |
| Total | 17 (53.1%) | 15 (46.9%) |
Female Fertility in Keenes
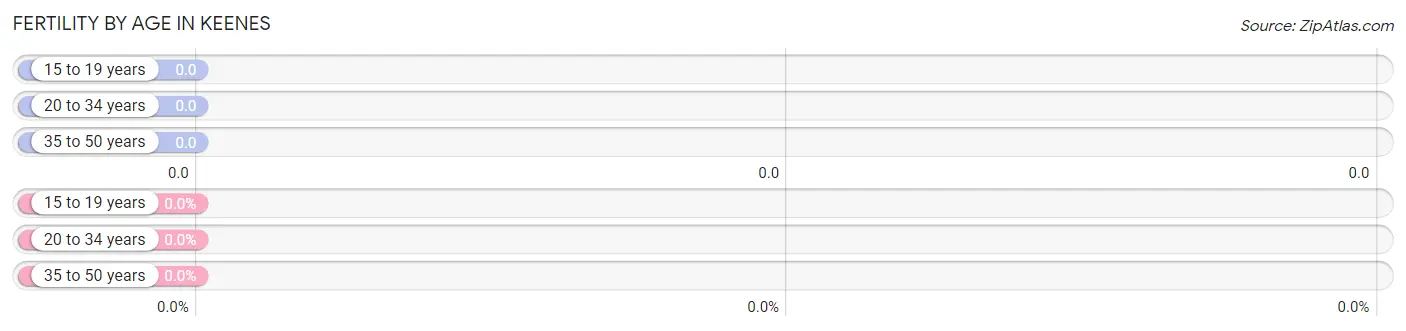
Fertility by Age in Keenes
| Age Bracket | Women with Births | Births / 1,000 Women |
| 15 to 19 years | 0 (0.0%) | 0.0 |
| 20 to 34 years | 0 (0.0%) | 0.0 |
| 35 to 50 years | 0 (0.0%) | 0.0 |
| Total | 0 (0.0%) | 0.0 |
Fertility by Age by Marriage Status in Keenes
| Age Bracket | Married | Unmarried |
| 15 to 19 years | 0 (0.0%) | 0 (0.0%) |
| 20 to 34 years | 0 (0.0%) | 0 (0.0%) |
| 35 to 50 years | 0 (0.0%) | 0 (0.0%) |
| Total | 0 (0.0%) | 0 (0.0%) |
Fertility by Education in Keenes
| Educational Attainment | Women with Births | Births / 1,000 Women |
| Less than High School | 0 (0.0%) | 0.0 |
| High School Diploma | 0 (0.0%) | 0.0 |
| College or Associate's Degree | 0 (0.0%) | 0.0 |
| Bachelor's Degree | 0 (0.0%) | 0.0 |
| Graduate Degree | 0 (0.0%) | 0.0 |
| Total | 0 (0.0%) | 0.0 |
Fertility by Education by Marriage Status in Keenes
| Educational Attainment | Married | Unmarried |
| Less than High School | 0 (0.0%) | 0 (0.0%) |
| High School Diploma | 0 (0.0%) | 0 (0.0%) |
| College or Associate's Degree | 0 (0.0%) | 0 (0.0%) |
| Bachelor's Degree | 0 (0.0%) | 0 (0.0%) |
| Graduate Degree | 0 (0.0%) | 0 (0.0%) |
| Total | 0 (0.0%) | 0 (0.0%) |
Employment Characteristics in Keenes
Employment by Class of Employer in Keenes
Among the 26 employed individuals in Keenes, private company employees (14 | 53.8%), self-employed (not incorporated) (9 | 34.6%), and local government employees (3 | 11.5%) make up the most common classes of employment.
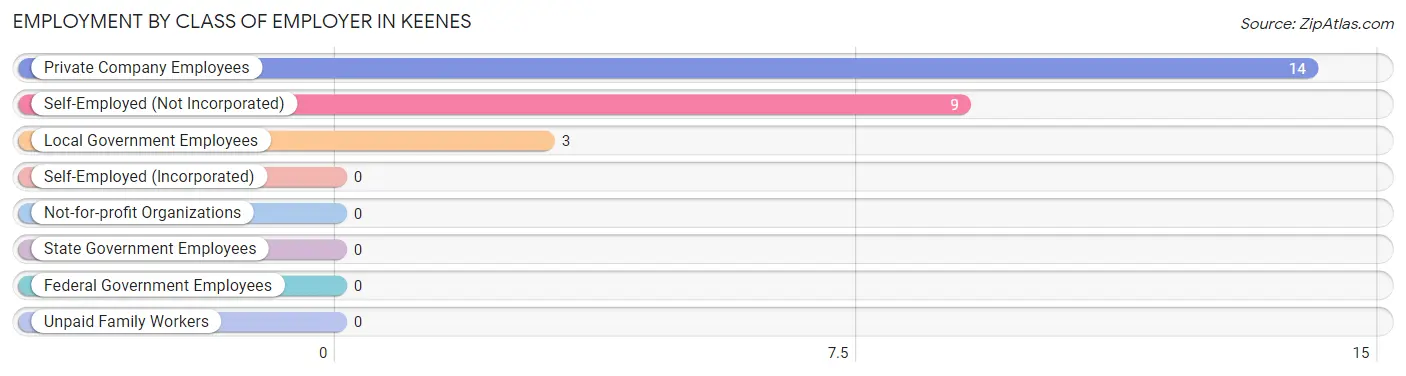
| Employer Class | # Employees | % Employees |
| Private Company Employees | 14 | 53.8% |
| Self-Employed (Incorporated) | 0 | 0.0% |
| Self-Employed (Not Incorporated) | 9 | 34.6% |
| Not-for-profit Organizations | 0 | 0.0% |
| Local Government Employees | 3 | 11.5% |
| State Government Employees | 0 | 0.0% |
| Federal Government Employees | 0 | 0.0% |
| Unpaid Family Workers | 0 | 0.0% |
| Total | 26 | 100.0% |
Employment Status by Age in Keenes
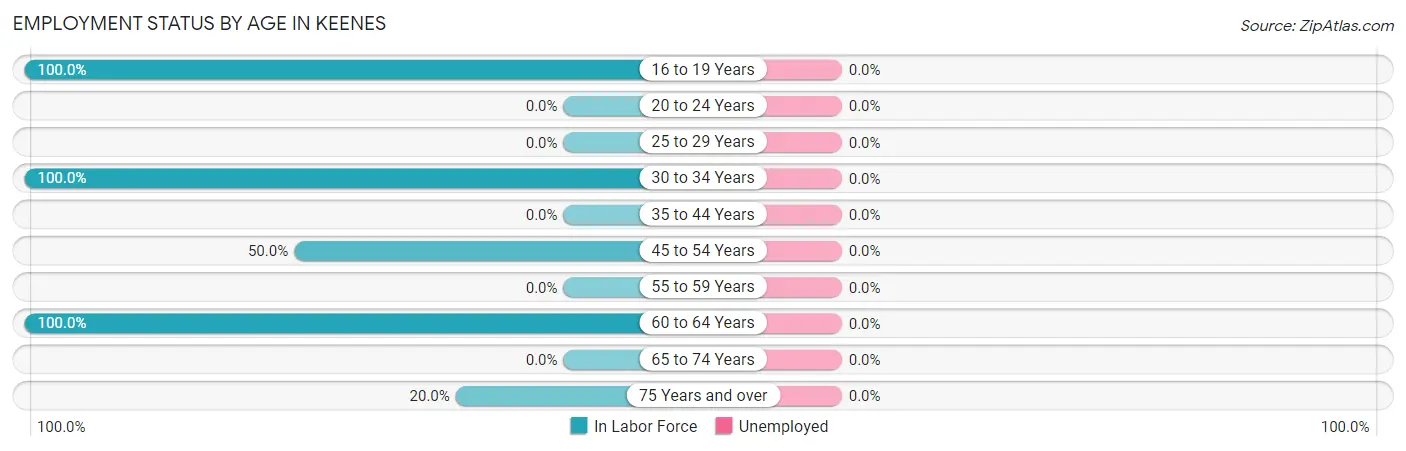
| Age Bracket | In Labor Force | Unemployed |
| 16 to 19 Years | 1 (100.0%) | 0 (0.0%) |
| 20 to 24 Years | 0 (0.0%) | 0 (0.0%) |
| 25 to 29 Years | 0 (0.0%) | 0 (0.0%) |
| 30 to 34 Years | 3 (100.0%) | 0 (0.0%) |
| 35 to 44 Years | 0 (0.0%) | 0 (0.0%) |
| 45 to 54 Years | 11 (50.0%) | 0 (0.0%) |
| 55 to 59 Years | 0 (0.0%) | 0 (0.0%) |
| 60 to 64 Years | 8 (100.0%) | 0 (0.0%) |
| 65 to 74 Years | 0 (0.0%) | 0 (0.0%) |
| 75 Years and over | 3 (20.0%) | 0 (0.0%) |
| Total | 26 (45.6%) | 0 (0.0%) |
Employment Status by Educational Attainment in Keenes
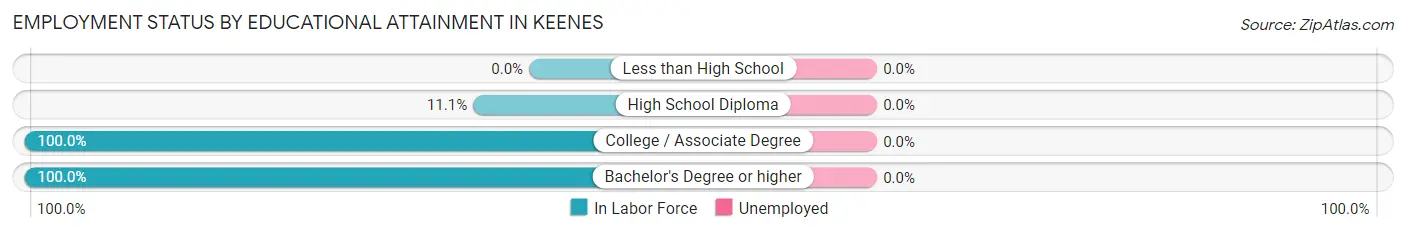
| Educational Attainment | In Labor Force | Unemployed |
| Less than High School | 0 (0.0%) | 0 (0.0%) |
| High School Diploma | 2 (11.1%) | 0 (0.0%) |
| College / Associate Degree | 19 (100.0%) | 0 (0.0%) |
| Bachelor's Degree or higher | 1 (100.0%) | 0 (0.0%) |
| Total | 22 (57.9%) | 0 (0.0%) |
Employment Occupations by Sex in Keenes
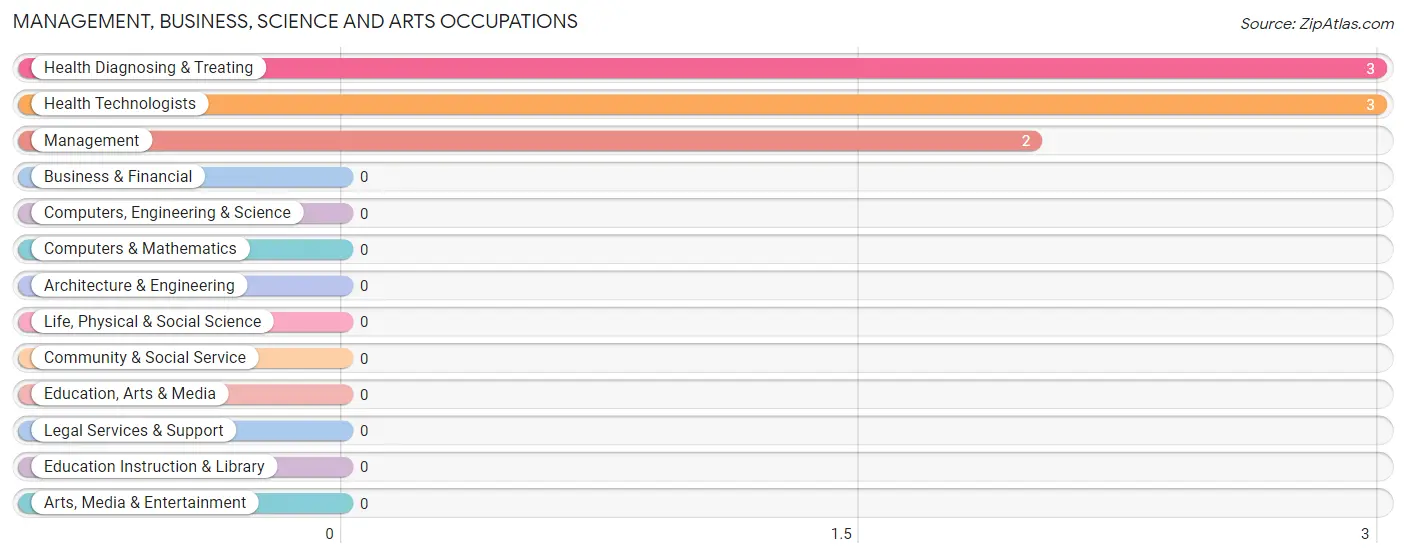
Management, Business, Science and Arts Occupations
The most common Management, Business, Science and Arts occupations in Keenes are Health Diagnosing & Treating (3 | 11.5%), Health Technologists (3 | 11.5%), and Management (2 | 7.7%).
Management, Business, Science and Arts Occupations by Sex
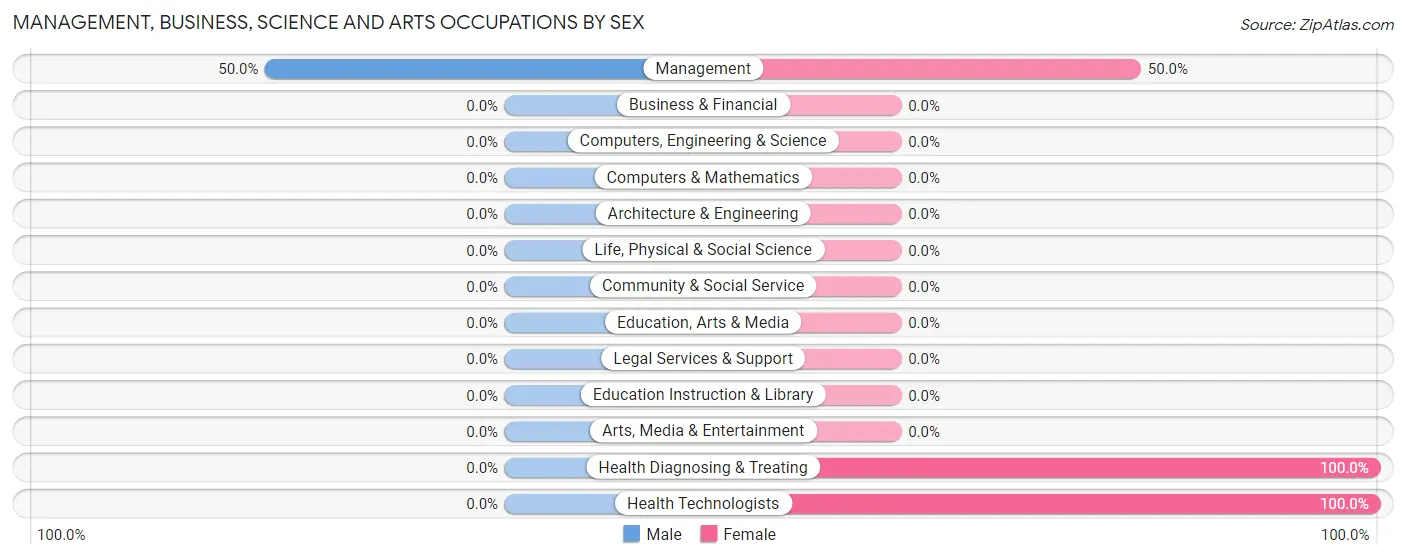
| Occupation | Male | Female |
| Management | 1 (50.0%) | 1 (50.0%) |
| Business & Financial | 0 (0.0%) | 0 (0.0%) |
| Computers, Engineering & Science | 0 (0.0%) | 0 (0.0%) |
| Computers & Mathematics | 0 (0.0%) | 0 (0.0%) |
| Architecture & Engineering | 0 (0.0%) | 0 (0.0%) |
| Life, Physical & Social Science | 0 (0.0%) | 0 (0.0%) |
| Community & Social Service | 0 (0.0%) | 0 (0.0%) |
| Education, Arts & Media | 0 (0.0%) | 0 (0.0%) |
| Legal Services & Support | 0 (0.0%) | 0 (0.0%) |
| Education Instruction & Library | 0 (0.0%) | 0 (0.0%) |
| Arts, Media & Entertainment | 0 (0.0%) | 0 (0.0%) |
| Health Diagnosing & Treating | 0 (0.0%) | 3 (100.0%) |
| Health Technologists | 0 (0.0%) | 3 (100.0%) |
| Total (Category) | 1 (20.0%) | 4 (80.0%) |
| Total (Overall) | 11 (42.3%) | 15 (57.7%) |
Services Occupations
Services Occupations by Sex
| Occupation | Male | Female |
| Healthcare Support | 0 (0.0%) | 0 (0.0%) |
| Security & Protection | 0 (0.0%) | 0 (0.0%) |
| Firefighting & Prevention | 0 (0.0%) | 0 (0.0%) |
| Law Enforcement | 0 (0.0%) | 0 (0.0%) |
| Food Preparation & Serving | 0 (0.0%) | 0 (0.0%) |
| Cleaning & Maintenance | 0 (0.0%) | 0 (0.0%) |
| Personal Care & Service | 0 (0.0%) | 0 (0.0%) |
| Total (Category) | 0 (0.0%) | 0 (0.0%) |
| Total (Overall) | 11 (42.3%) | 15 (57.7%) |
Sales and Office Occupations
The most common Sales and Office occupations in Keenes are Sales & Related (7 | 26.9%), and Office & Administration (3 | 11.5%).
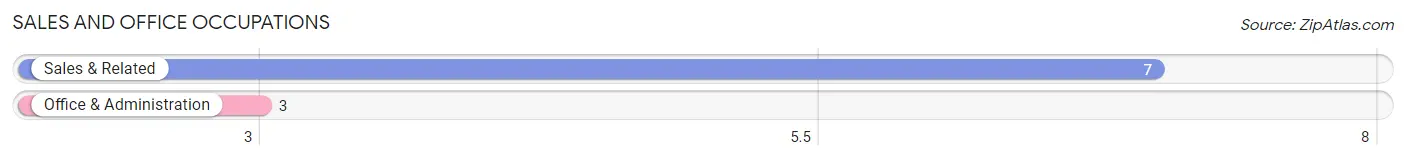
Sales and Office Occupations by Sex
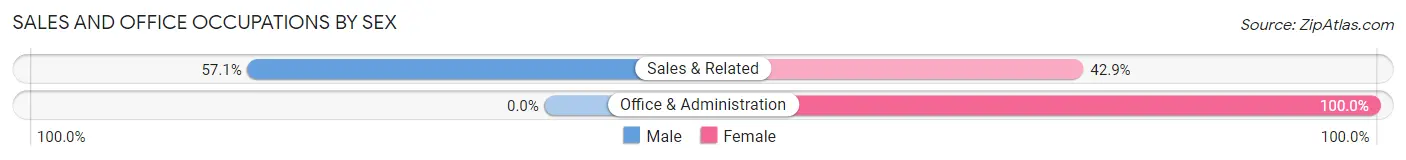
| Occupation | Male | Female |
| Sales & Related | 4 (57.1%) | 3 (42.9%) |
| Office & Administration | 0 (0.0%) | 3 (100.0%) |
| Total (Category) | 4 (40.0%) | 6 (60.0%) |
| Total (Overall) | 11 (42.3%) | 15 (57.7%) |
Natural Resources, Construction and Maintenance Occupations
Natural Resources, Construction and Maintenance Occupations by Sex
| Occupation | Male | Female |
| Farming, Fishing & Forestry | 0 (0.0%) | 0 (0.0%) |
| Construction & Extraction | 0 (0.0%) | 0 (0.0%) |
| Installation, Maintenance & Repair | 0 (0.0%) | 0 (0.0%) |
| Total (Category) | 0 (0.0%) | 0 (0.0%) |
| Total (Overall) | 11 (42.3%) | 15 (57.7%) |
Production, Transportation and Moving Occupations
The most common Production, Transportation and Moving occupations in Keenes are Transportation (9 | 34.6%), and Production (2 | 7.7%).
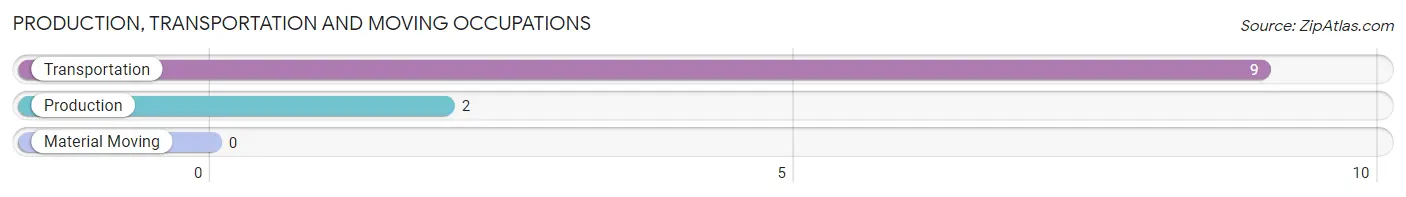
Production, Transportation and Moving Occupations by Sex
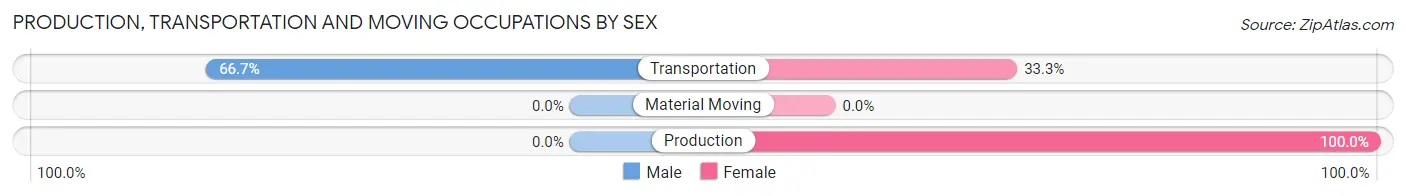
| Occupation | Male | Female |
| Production | 0 (0.0%) | 2 (100.0%) |
| Transportation | 6 (66.7%) | 3 (33.3%) |
| Material Moving | 0 (0.0%) | 0 (0.0%) |
| Total (Category) | 6 (54.5%) | 5 (45.5%) |
| Total (Overall) | 11 (42.3%) | 15 (57.7%) |
Employment Industries by Sex in Keenes
Employment Industries in Keenes
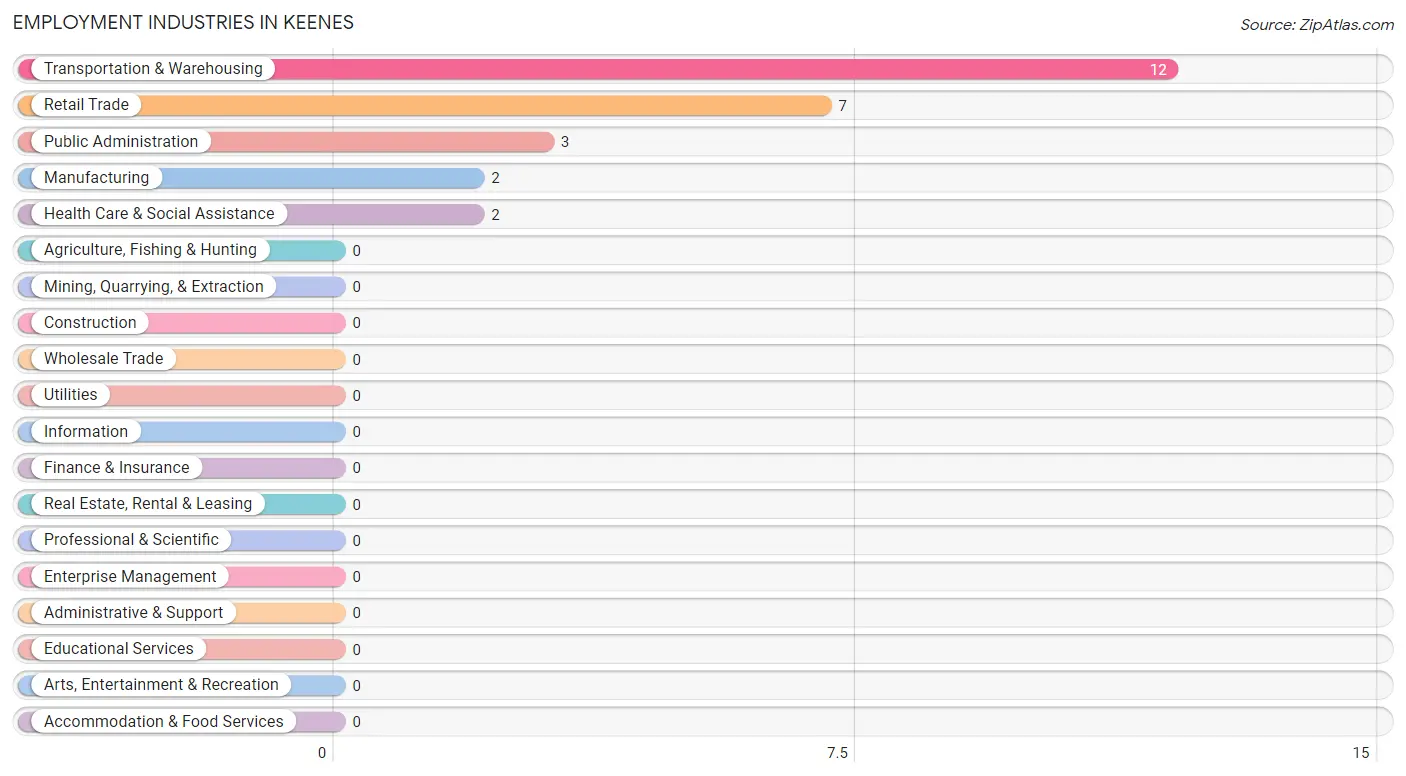
The major employment industries in Keenes include Transportation & Warehousing (12 | 46.2%), Retail Trade (7 | 26.9%), Public Administration (3 | 11.5%), Manufacturing (2 | 7.7%), and Health Care & Social Assistance (2 | 7.7%).
Employment Industries by Sex in Keenes
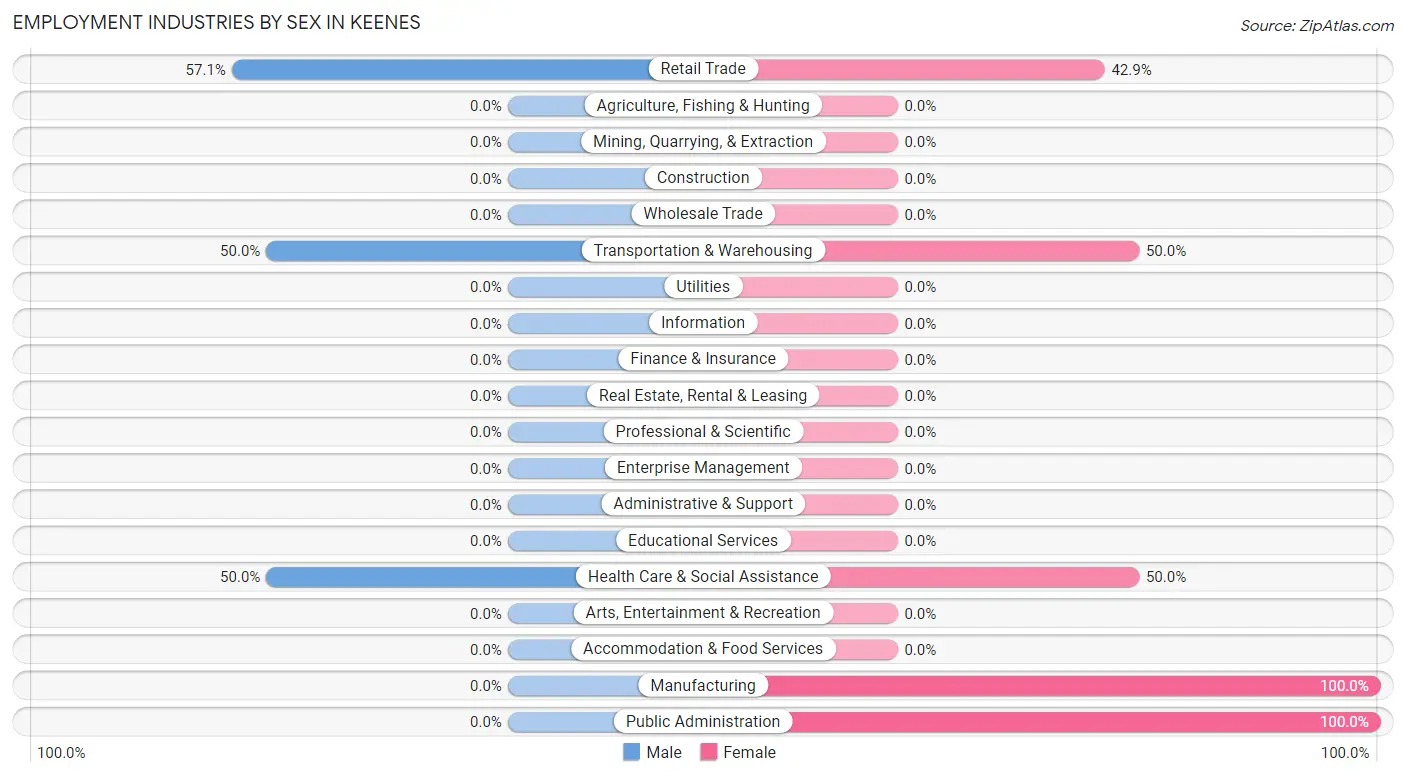
The Keenes industries that see more men than women are Retail Trade (57.1%), Transportation & Warehousing (50.0%), and Health Care & Social Assistance (50.0%), whereas the industries that tend to have a higher number of women are Manufacturing (100.0%), Public Administration (100.0%), and Transportation & Warehousing (50.0%).
| Industry | Male | Female |
| Agriculture, Fishing & Hunting | 0 (0.0%) | 0 (0.0%) |
| Mining, Quarrying, & Extraction | 0 (0.0%) | 0 (0.0%) |
| Construction | 0 (0.0%) | 0 (0.0%) |
| Manufacturing | 0 (0.0%) | 2 (100.0%) |
| Wholesale Trade | 0 (0.0%) | 0 (0.0%) |
| Retail Trade | 4 (57.1%) | 3 (42.9%) |
| Transportation & Warehousing | 6 (50.0%) | 6 (50.0%) |
| Utilities | 0 (0.0%) | 0 (0.0%) |
| Information | 0 (0.0%) | 0 (0.0%) |
| Finance & Insurance | 0 (0.0%) | 0 (0.0%) |
| Real Estate, Rental & Leasing | 0 (0.0%) | 0 (0.0%) |
| Professional & Scientific | 0 (0.0%) | 0 (0.0%) |
| Enterprise Management | 0 (0.0%) | 0 (0.0%) |
| Administrative & Support | 0 (0.0%) | 0 (0.0%) |
| Educational Services | 0 (0.0%) | 0 (0.0%) |
| Health Care & Social Assistance | 1 (50.0%) | 1 (50.0%) |
| Arts, Entertainment & Recreation | 0 (0.0%) | 0 (0.0%) |
| Accommodation & Food Services | 0 (0.0%) | 0 (0.0%) |
| Public Administration | 0 (0.0%) | 3 (100.0%) |
| Total | 11 (42.3%) | 15 (57.7%) |
Education in Keenes
School Enrollment in Keenes
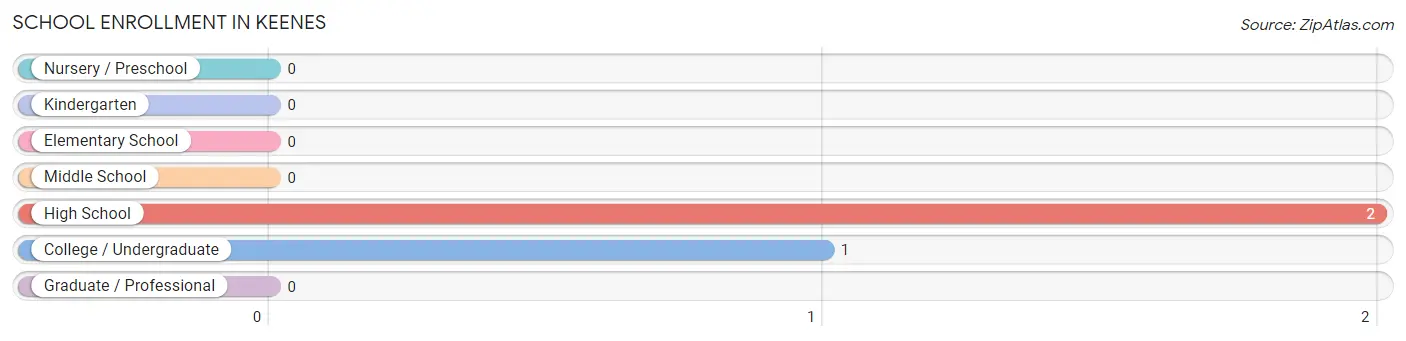
The most common levels of schooling among the 3 students in Keenes are high school (2 | 66.7%), and college / undergraduate (1 | 33.3%).
| School Level | # Students | % Students |
| Nursery / Preschool | 0 | 0.0% |
| Kindergarten | 0 | 0.0% |
| Elementary School | 0 | 0.0% |
| Middle School | 0 | 0.0% |
| High School | 2 | 66.7% |
| College / Undergraduate | 1 | 33.3% |
| Graduate / Professional | 0 | 0.0% |
| Total | 3 | 100.0% |
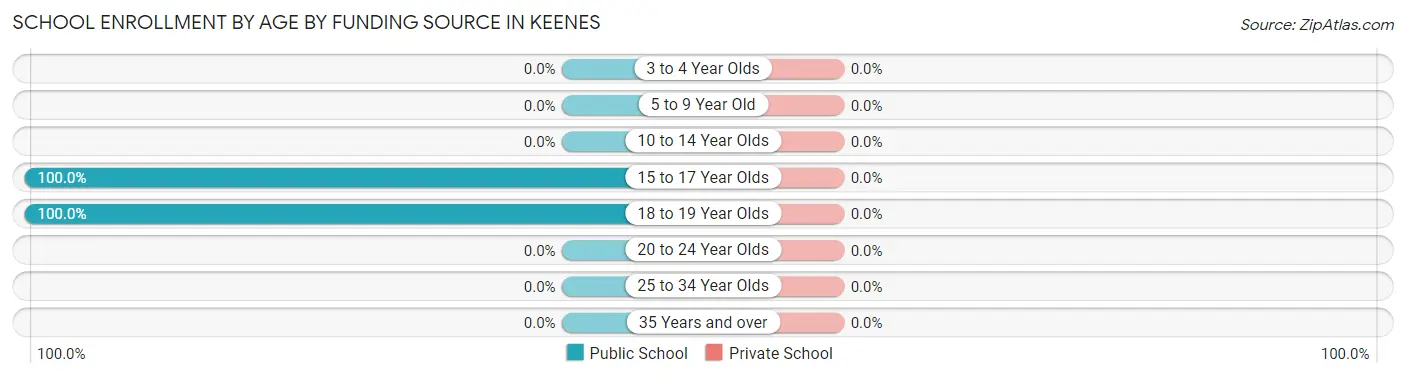
School Enrollment by Age by Funding Source in Keenes
| Age Bracket | Public School | Private School |
| 3 to 4 Year Olds | 0 (0.0%) | 0 (0.0%) |
| 5 to 9 Year Old | 0 (0.0%) | 0 (0.0%) |
| 10 to 14 Year Olds | 0 (0.0%) | 0 (0.0%) |
| 15 to 17 Year Olds | 2 (100.0%) | 0 (0.0%) |
| 18 to 19 Year Olds | 1 (100.0%) | 0 (0.0%) |
| 20 to 24 Year Olds | 0 (0.0%) | 0 (0.0%) |
| 25 to 34 Year Olds | 0 (0.0%) | 0 (0.0%) |
| 35 Years and over | 0 (0.0%) | 0 (0.0%) |
| Total | 3 (100.0%) | 0 (0.0%) |
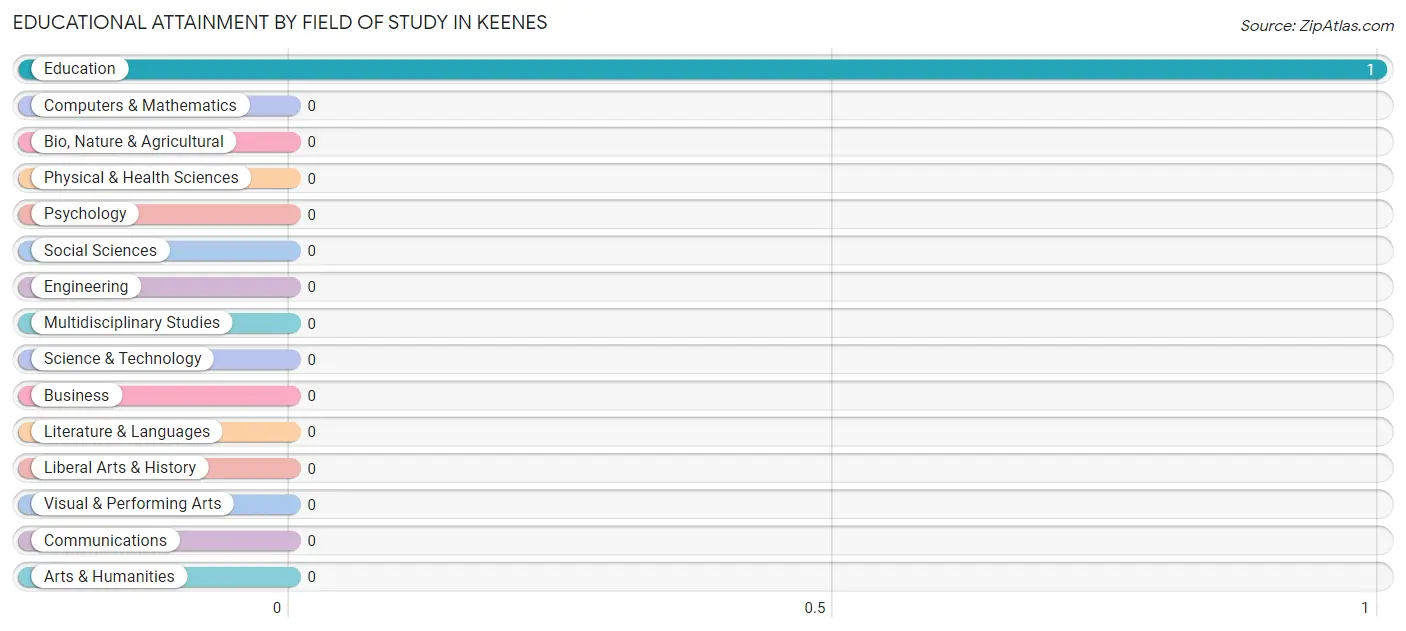
Educational Attainment by Field of Study in Keenes
, and education (1 | 100.0%) are the most common fields of study among 1 individuals in Keenes who have obtained a bachelor's degree or higher.
| Field of Study | # Graduates | % Graduates |
| Computers & Mathematics | 0 | 0.0% |
| Bio, Nature & Agricultural | 0 | 0.0% |
| Physical & Health Sciences | 0 | 0.0% |
| Psychology | 0 | 0.0% |
| Social Sciences | 0 | 0.0% |
| Engineering | 0 | 0.0% |
| Multidisciplinary Studies | 0 | 0.0% |
| Science & Technology | 0 | 0.0% |
| Business | 0 | 0.0% |
| Education | 1 | 100.0% |
| Literature & Languages | 0 | 0.0% |
| Liberal Arts & History | 0 | 0.0% |
| Visual & Performing Arts | 0 | 0.0% |
| Communications | 0 | 0.0% |
| Arts & Humanities | 0 | 0.0% |
| Total | 1 | 100.0% |
Transportation & Commute in Keenes
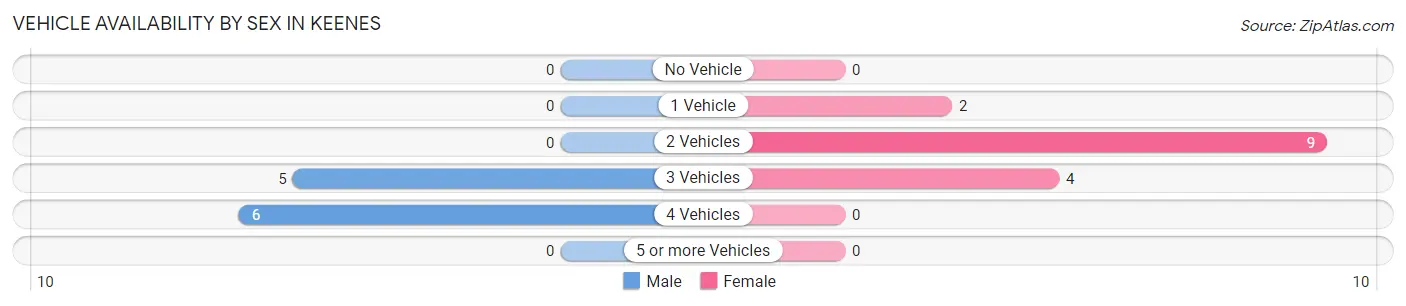
Vehicle Availability by Sex in Keenes
The most prevalent vehicle ownership categories in Keenes are males with 4 vehicles (6, accounting for 54.5%) and females with 4 vehicles (0, making up 40.0%).
| Vehicles Available | Male | Female |
| No Vehicle | 0 (0.0%) | 0 (0.0%) |
| 1 Vehicle | 0 (0.0%) | 2 (13.3%) |
| 2 Vehicles | 0 (0.0%) | 9 (60.0%) |
| 3 Vehicles | 5 (45.5%) | 4 (26.7%) |
| 4 Vehicles | 6 (54.5%) | 0 (0.0%) |
| 5 or more Vehicles | 0 (0.0%) | 0 (0.0%) |
| Total | 11 (100.0%) | 15 (100.0%) |
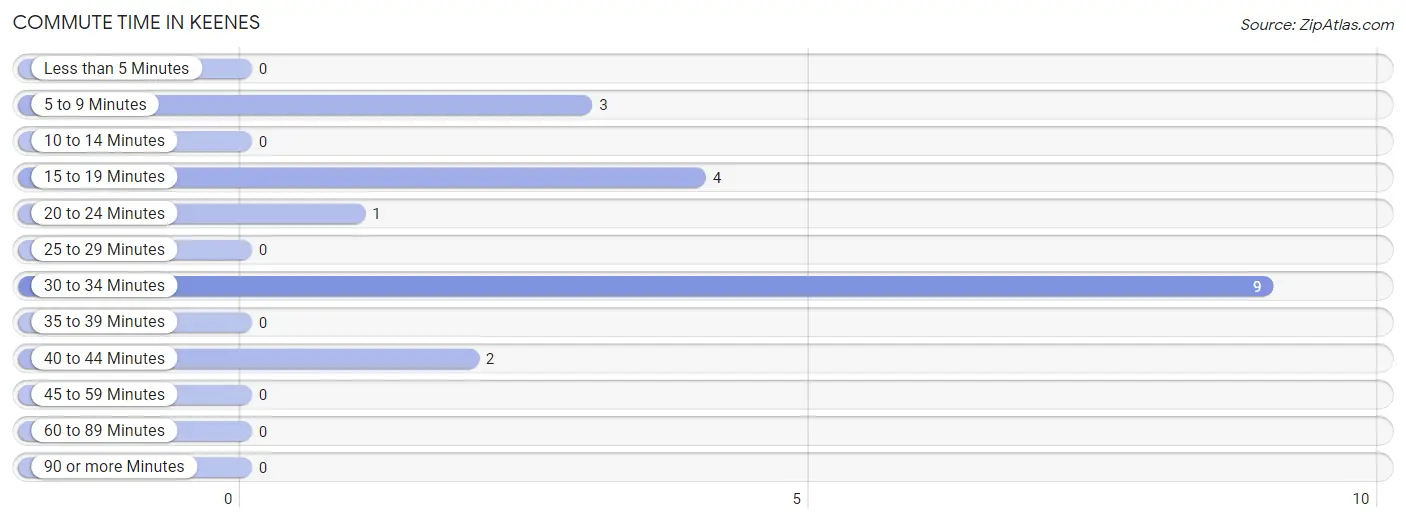
Commute Time in Keenes
The most frequently occuring commute durations in Keenes are 30 to 34 minutes (9 commuters, 47.4%), 15 to 19 minutes (4 commuters, 21.0%), and 5 to 9 minutes (3 commuters, 15.8%).
| Commute Time | # Commuters | % Commuters |
| Less than 5 Minutes | 0 | 0.0% |
| 5 to 9 Minutes | 3 | 15.8% |
| 10 to 14 Minutes | 0 | 0.0% |
| 15 to 19 Minutes | 4 | 21.0% |
| 20 to 24 Minutes | 1 | 5.3% |
| 25 to 29 Minutes | 0 | 0.0% |
| 30 to 34 Minutes | 9 | 47.4% |
| 35 to 39 Minutes | 0 | 0.0% |
| 40 to 44 Minutes | 2 | 10.5% |
| 45 to 59 Minutes | 0 | 0.0% |
| 60 to 89 Minutes | 0 | 0.0% |
| 90 or more Minutes | 0 | 0.0% |
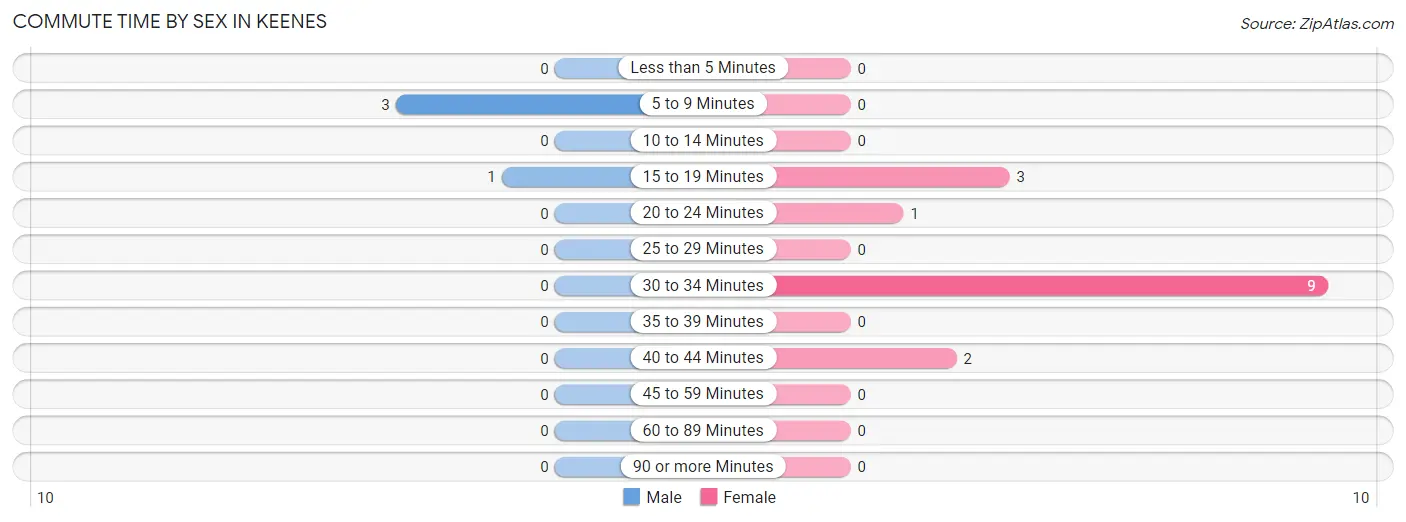
Commute Time by Sex in Keenes
The most common commute times in Keenes are 5 to 9 minutes (3 commuters, 75.0%) for males and 30 to 34 minutes (9 commuters, 60.0%) for females.
| Commute Time | Male | Female |
| Less than 5 Minutes | 0 (0.0%) | 0 (0.0%) |
| 5 to 9 Minutes | 3 (75.0%) | 0 (0.0%) |
| 10 to 14 Minutes | 0 (0.0%) | 0 (0.0%) |
| 15 to 19 Minutes | 1 (25.0%) | 3 (20.0%) |
| 20 to 24 Minutes | 0 (0.0%) | 1 (6.7%) |
| 25 to 29 Minutes | 0 (0.0%) | 0 (0.0%) |
| 30 to 34 Minutes | 0 (0.0%) | 9 (60.0%) |
| 35 to 39 Minutes | 0 (0.0%) | 0 (0.0%) |
| 40 to 44 Minutes | 0 (0.0%) | 2 (13.3%) |
| 45 to 59 Minutes | 0 (0.0%) | 0 (0.0%) |
| 60 to 89 Minutes | 0 (0.0%) | 0 (0.0%) |
| 90 or more Minutes | 0 (0.0%) | 0 (0.0%) |
Time of Departure to Work by Sex in Keenes
The most frequent times of departure to work in Keenes are 6:30 AM to 6:59 AM (3, 75.0%) for males and 6:00 AM to 6:29 AM (3, 20.0%) for females.
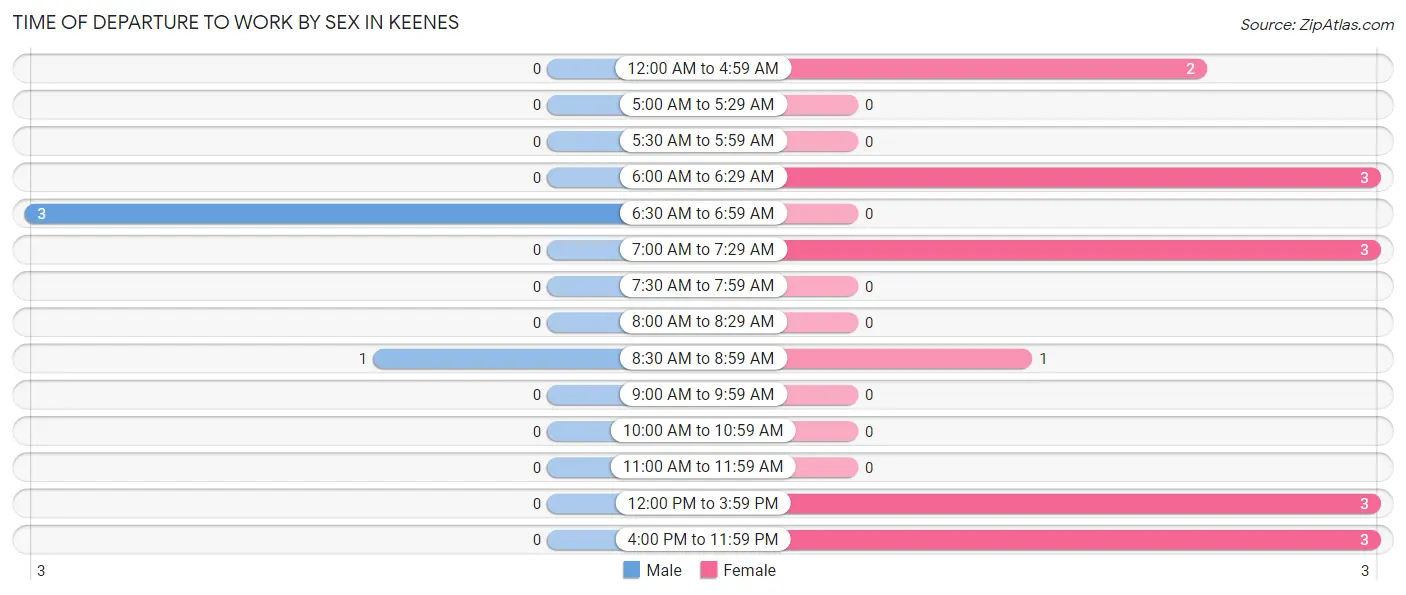
| Time of Departure | Male | Female |
| 12:00 AM to 4:59 AM | 0 (0.0%) | 2 (13.3%) |
| 5:00 AM to 5:29 AM | 0 (0.0%) | 0 (0.0%) |
| 5:30 AM to 5:59 AM | 0 (0.0%) | 0 (0.0%) |
| 6:00 AM to 6:29 AM | 0 (0.0%) | 3 (20.0%) |
| 6:30 AM to 6:59 AM | 3 (75.0%) | 0 (0.0%) |
| 7:00 AM to 7:29 AM | 0 (0.0%) | 3 (20.0%) |
| 7:30 AM to 7:59 AM | 0 (0.0%) | 0 (0.0%) |
| 8:00 AM to 8:29 AM | 0 (0.0%) | 0 (0.0%) |
| 8:30 AM to 8:59 AM | 1 (25.0%) | 1 (6.7%) |
| 9:00 AM to 9:59 AM | 0 (0.0%) | 0 (0.0%) |
| 10:00 AM to 10:59 AM | 0 (0.0%) | 0 (0.0%) |
| 11:00 AM to 11:59 AM | 0 (0.0%) | 0 (0.0%) |
| 12:00 PM to 3:59 PM | 0 (0.0%) | 3 (20.0%) |
| 4:00 PM to 11:59 PM | 0 (0.0%) | 3 (20.0%) |
| Total | 4 (100.0%) | 15 (100.0%) |
Housing Occupancy in Keenes
Occupancy by Ownership in Keenes
Of the total 32 dwellings in Keenes, owner-occupied units account for 32 (100.0%), while renter-occupied units make up 0 (0.0%).
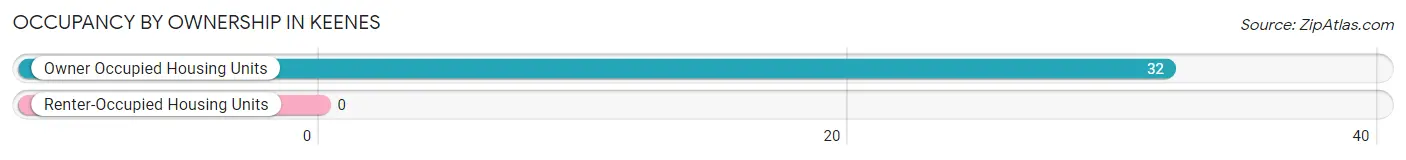
| Occupancy | # Housing Units | % Housing Units |
| Owner Occupied Housing Units | 32 | 100.0% |
| Renter-Occupied Housing Units | 0 | 0.0% |
| Total Occupied Housing Units | 32 | 100.0% |
Occupancy by Household Size in Keenes
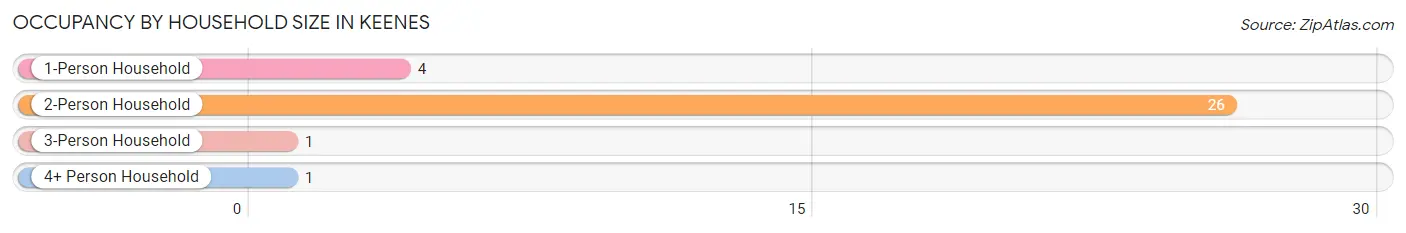
| Household Size | # Housing Units | % Housing Units |
| 1-Person Household | 4 | 12.5% |
| 2-Person Household | 26 | 81.2% |
| 3-Person Household | 1 | 3.1% |
| 4+ Person Household | 1 | 3.1% |
| Total Housing Units | 32 | 100.0% |
Occupancy by Ownership by Household Size in Keenes
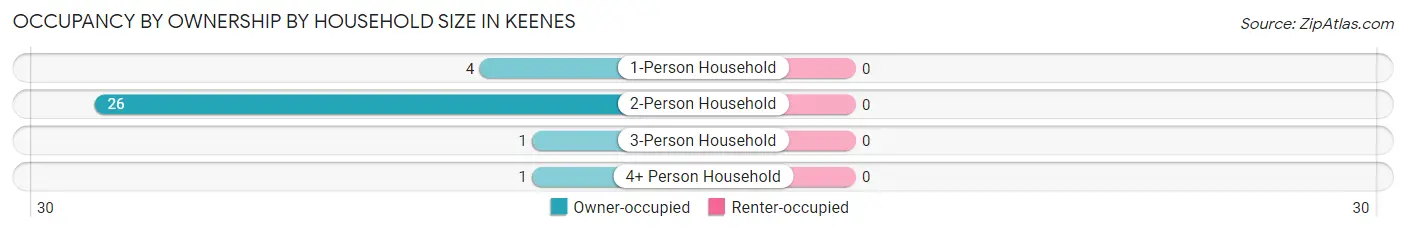
| Household Size | Owner-occupied | Renter-occupied |
| 1-Person Household | 4 (100.0%) | 0 (0.0%) |
| 2-Person Household | 26 (100.0%) | 0 (0.0%) |
| 3-Person Household | 1 (100.0%) | 0 (0.0%) |
| 4+ Person Household | 1 (100.0%) | 0 (0.0%) |
| Total Housing Units | 32 (100.0%) | 0 (0.0%) |
Occupancy by Educational Attainment in Keenes
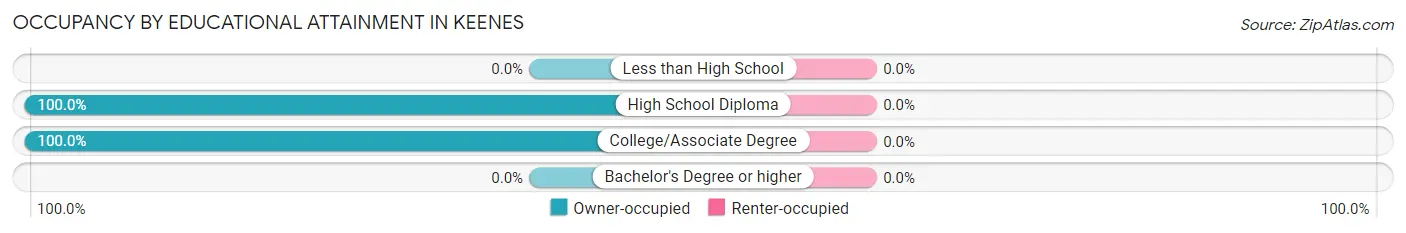
| Household Size | Owner-occupied | Renter-occupied |
| Less than High School | 0 (0.0%) | 0 (0.0%) |
| High School Diploma | 20 (100.0%) | 0 (0.0%) |
| College/Associate Degree | 12 (100.0%) | 0 (0.0%) |
| Bachelor's Degree or higher | 0 (0.0%) | 0 (0.0%) |
Occupancy by Age of Householder in Keenes
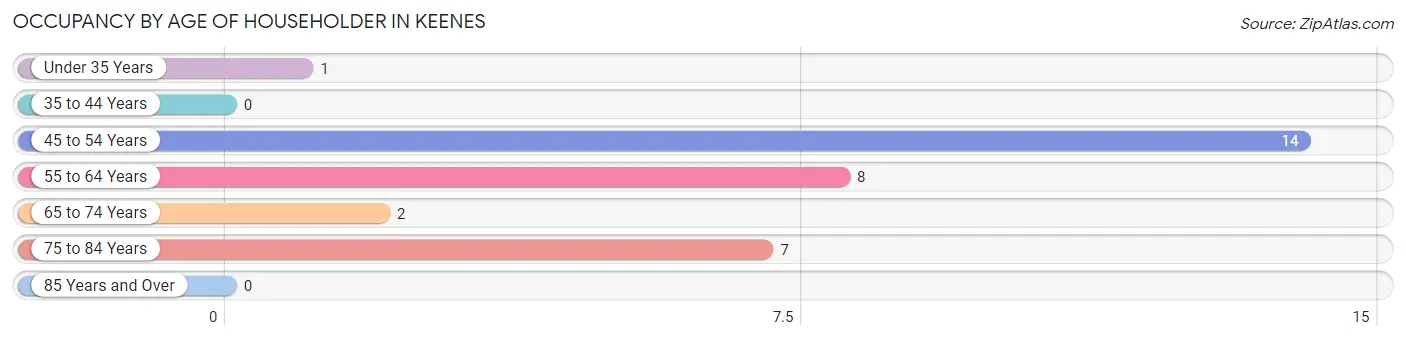
| Age Bracket | # Households | % Households |
| Under 35 Years | 1 | 3.1% |
| 35 to 44 Years | 0 | 0.0% |
| 45 to 54 Years | 14 | 43.8% |
| 55 to 64 Years | 8 | 25.0% |
| 65 to 74 Years | 2 | 6.2% |
| 75 to 84 Years | 7 | 21.9% |
| 85 Years and Over | 0 | 0.0% |
| Total | 32 | 100.0% |
Housing Finances in Keenes
Median Income by Occupancy in Keenes
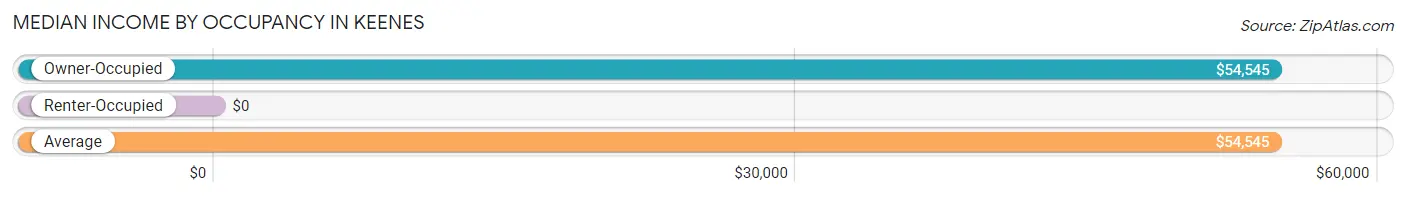
| Occupancy Type | # Households | Median Income |
| Owner-Occupied | 32 (100.0%) | $54,545 |
| Renter-Occupied | 0 (0.0%) | $0 |
| Average | 32 (100.0%) | $54,545 |
Occupancy by Householder Income Bracket in Keenes
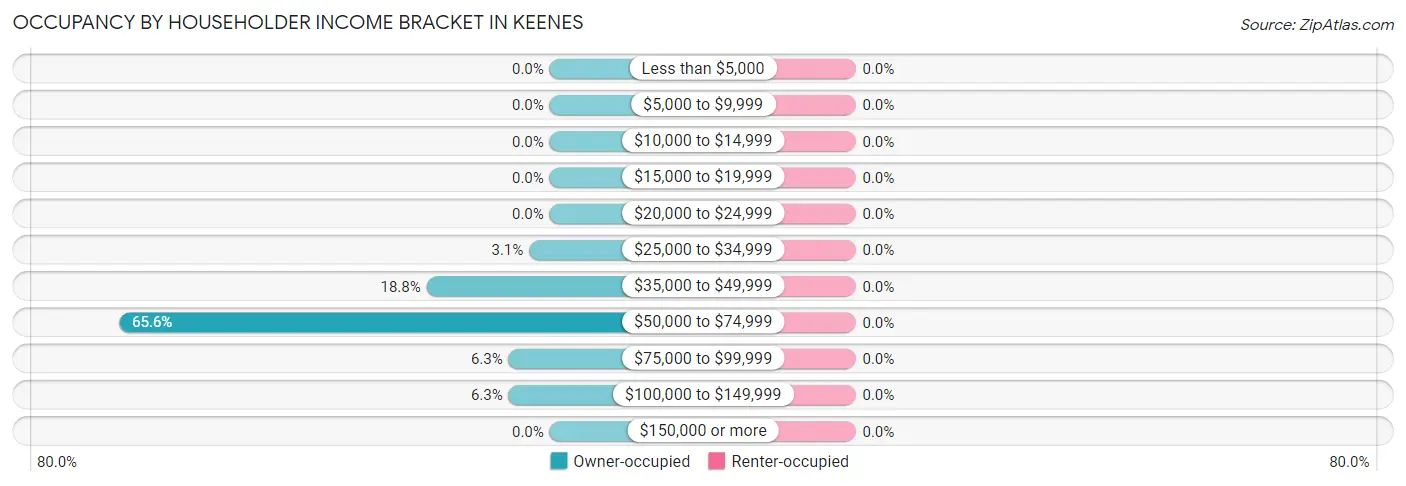
| Income Bracket | Owner-occupied | Renter-occupied |
| Less than $5,000 | 0 (0.0%) | 0 (0.0%) |
| $5,000 to $9,999 | 0 (0.0%) | 0 (0.0%) |
| $10,000 to $14,999 | 0 (0.0%) | 0 (0.0%) |
| $15,000 to $19,999 | 0 (0.0%) | 0 (0.0%) |
| $20,000 to $24,999 | 0 (0.0%) | 0 (0.0%) |
| $25,000 to $34,999 | 1 (3.1%) | 0 (0.0%) |
| $35,000 to $49,999 | 6 (18.8%) | 0 (0.0%) |
| $50,000 to $74,999 | 21 (65.6%) | 0 (0.0%) |
| $75,000 to $99,999 | 2 (6.2%) | 0 (0.0%) |
| $100,000 to $149,999 | 2 (6.2%) | 0 (0.0%) |
| $150,000 or more | 0 (0.0%) | 0 (0.0%) |
| Total | 32 (100.0%) | 0 (0.0%) |
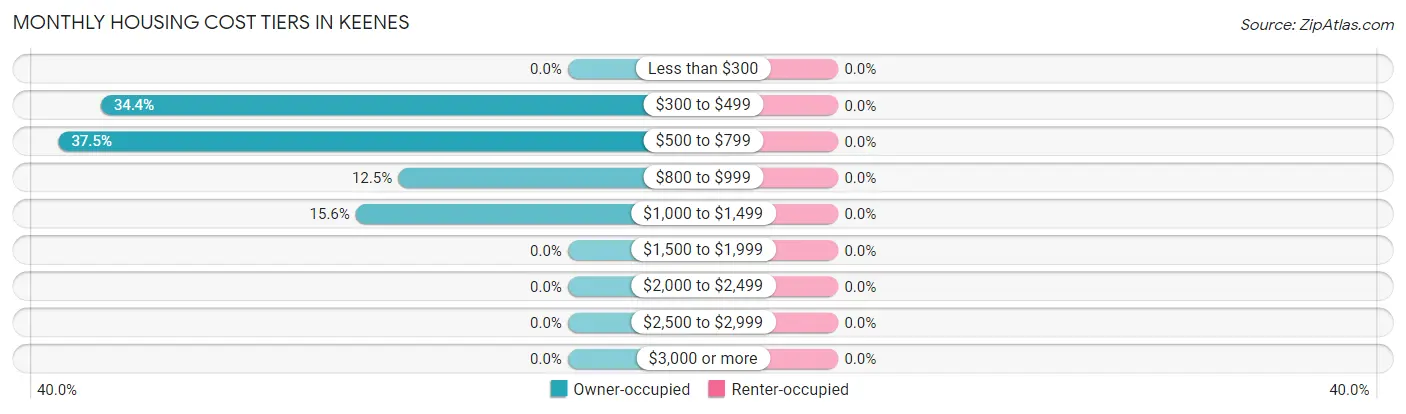
Monthly Housing Cost Tiers in Keenes
| Monthly Cost | Owner-occupied | Renter-occupied |
| Less than $300 | 0 (0.0%) | 0 (0.0%) |
| $300 to $499 | 11 (34.4%) | 0 (0.0%) |
| $500 to $799 | 12 (37.5%) | 0 (0.0%) |
| $800 to $999 | 4 (12.5%) | 0 (0.0%) |
| $1,000 to $1,499 | 5 (15.6%) | 0 (0.0%) |
| $1,500 to $1,999 | 0 (0.0%) | 0 (0.0%) |
| $2,000 to $2,499 | 0 (0.0%) | 0 (0.0%) |
| $2,500 to $2,999 | 0 (0.0%) | 0 (0.0%) |
| $3,000 or more | 0 (0.0%) | 0 (0.0%) |
| Total | 32 (100.0%) | 0 (0.0%) |
Physical Housing Characteristics in Keenes
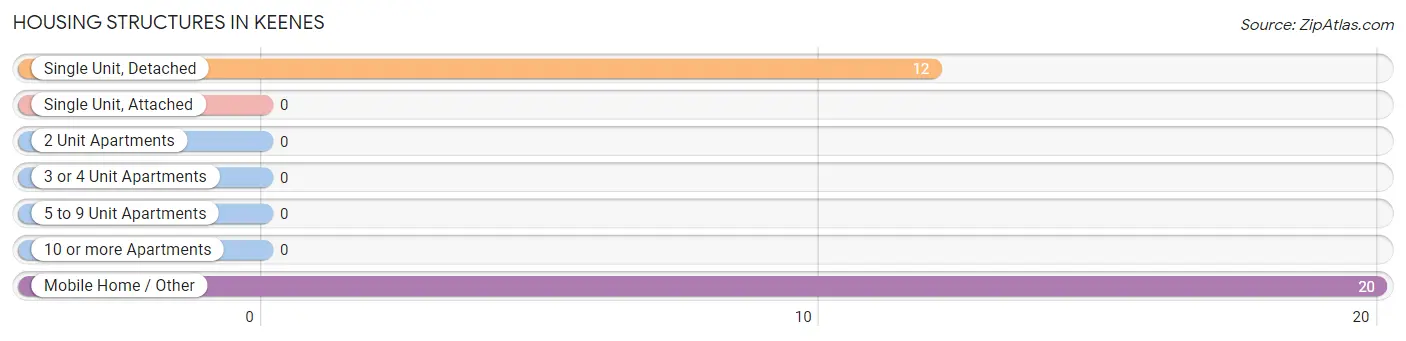
Housing Structures in Keenes
| Structure Type | # Housing Units | % Housing Units |
| Single Unit, Detached | 12 | 37.5% |
| Single Unit, Attached | 0 | 0.0% |
| 2 Unit Apartments | 0 | 0.0% |
| 3 or 4 Unit Apartments | 0 | 0.0% |
| 5 to 9 Unit Apartments | 0 | 0.0% |
| 10 or more Apartments | 0 | 0.0% |
| Mobile Home / Other | 20 | 62.5% |
| Total | 32 | 100.0% |
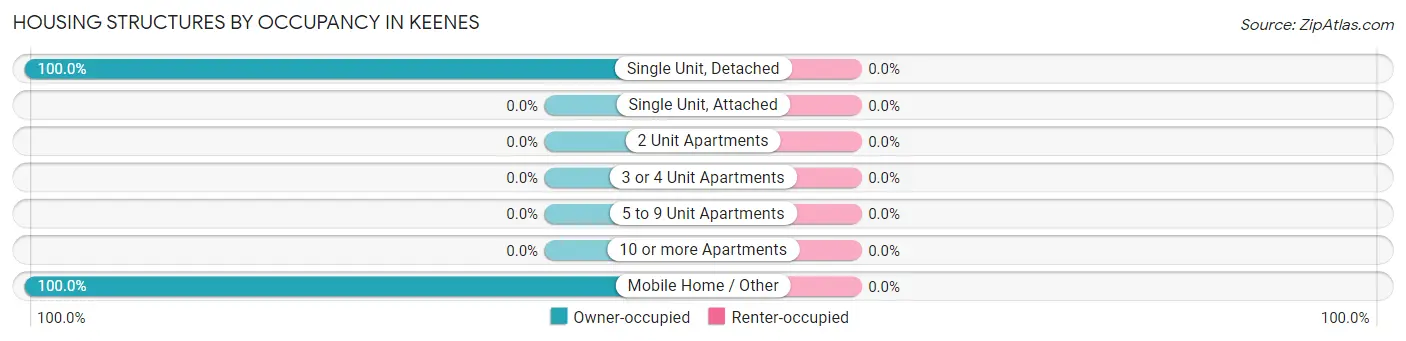
Housing Structures by Occupancy in Keenes
| Structure Type | Owner-occupied | Renter-occupied |
| Single Unit, Detached | 12 (100.0%) | 0 (0.0%) |
| Single Unit, Attached | 0 (0.0%) | 0 (0.0%) |
| 2 Unit Apartments | 0 (0.0%) | 0 (0.0%) |
| 3 or 4 Unit Apartments | 0 (0.0%) | 0 (0.0%) |
| 5 to 9 Unit Apartments | 0 (0.0%) | 0 (0.0%) |
| 10 or more Apartments | 0 (0.0%) | 0 (0.0%) |
| Mobile Home / Other | 20 (100.0%) | 0 (0.0%) |
| Total | 32 (100.0%) | 0 (0.0%) |
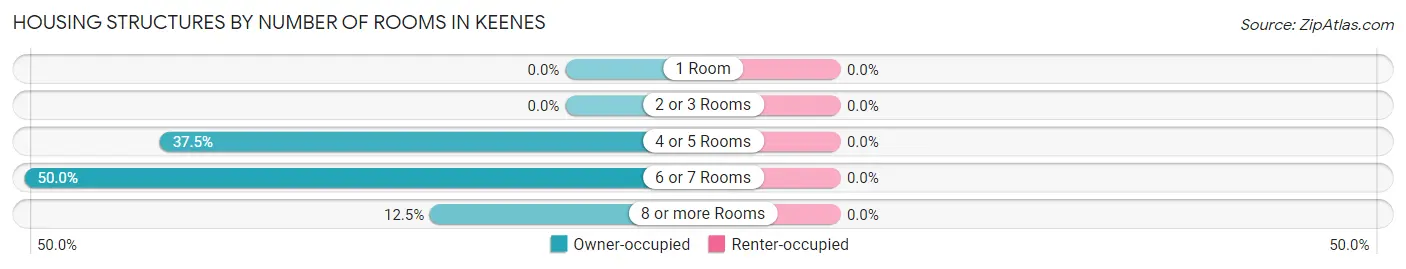
Housing Structures by Number of Rooms in Keenes
| Number of Rooms | Owner-occupied | Renter-occupied |
| 1 Room | 0 (0.0%) | 0 (0.0%) |
| 2 or 3 Rooms | 0 (0.0%) | 0 (0.0%) |
| 4 or 5 Rooms | 12 (37.5%) | 0 (0.0%) |
| 6 or 7 Rooms | 16 (50.0%) | 0 (0.0%) |
| 8 or more Rooms | 4 (12.5%) | 0 (0.0%) |
| Total | 32 (100.0%) | 0 (0.0%) |
Housing Structure by Heating Type in Keenes
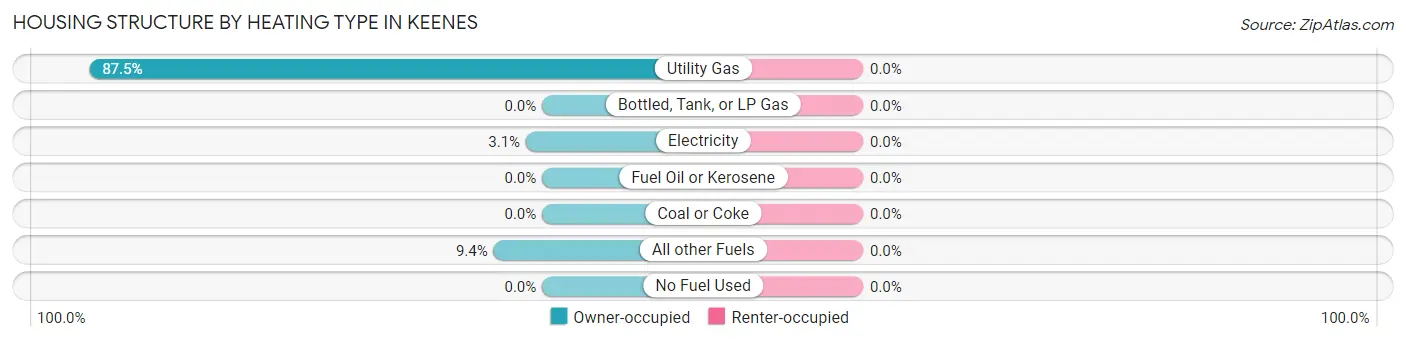
| Heating Type | Owner-occupied | Renter-occupied |
| Utility Gas | 28 (87.5%) | 0 (0.0%) |
| Bottled, Tank, or LP Gas | 0 (0.0%) | 0 (0.0%) |
| Electricity | 1 (3.1%) | 0 (0.0%) |
| Fuel Oil or Kerosene | 0 (0.0%) | 0 (0.0%) |
| Coal or Coke | 0 (0.0%) | 0 (0.0%) |
| All other Fuels | 3 (9.4%) | 0 (0.0%) |
| No Fuel Used | 0 (0.0%) | 0 (0.0%) |
| Total | 32 (100.0%) | 0 (0.0%) |
Household Vehicle Usage in Keenes
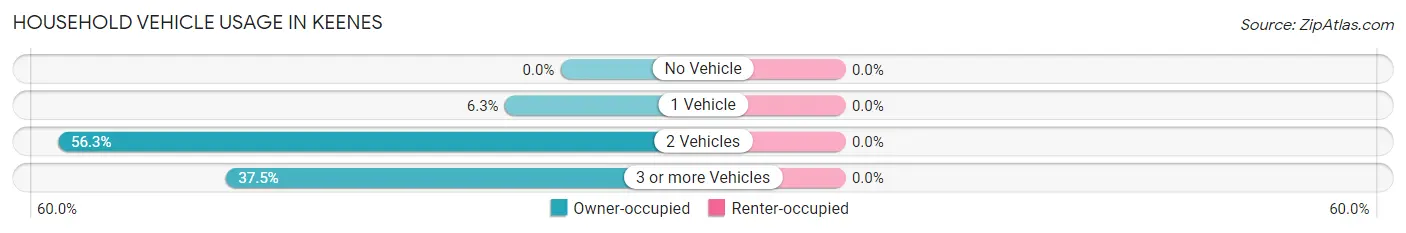
| Vehicles per Household | Owner-occupied | Renter-occupied |
| No Vehicle | 0 (0.0%) | 0 (0.0%) |
| 1 Vehicle | 2 (6.2%) | 0 (0.0%) |
| 2 Vehicles | 18 (56.2%) | 0 (0.0%) |
| 3 or more Vehicles | 12 (37.5%) | 0 (0.0%) |
| Total | 32 (100.0%) | 0 (0.0%) |
Real Estate & Mortgages in Keenes
Real Estate and Mortgage Overview in Keenes
| Characteristic | Without Mortgage | With Mortgage |
| Housing Units | 16 | 16 |
| Median Property Value | $108,300 | $0 |
| Median Household Income | $62,500 | $0 |
| Monthly Housing Costs | $473 | $0 |
| Real Estate Taxes | - | - |
Property Value by Mortgage Status in Keenes
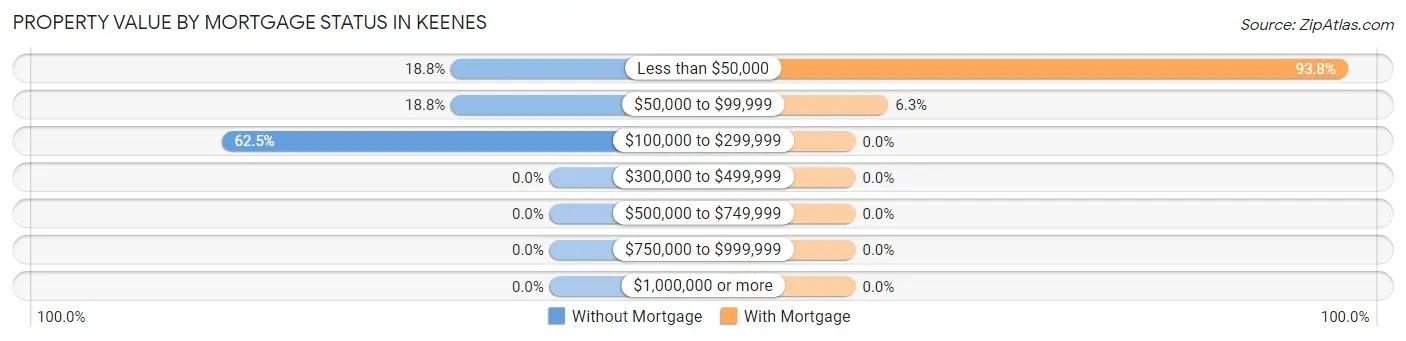
| Property Value | Without Mortgage | With Mortgage |
| Less than $50,000 | 3 (18.8%) | 15 (93.8%) |
| $50,000 to $99,999 | 3 (18.8%) | 1 (6.2%) |
| $100,000 to $299,999 | 10 (62.5%) | 0 (0.0%) |
| $300,000 to $499,999 | 0 (0.0%) | 0 (0.0%) |
| $500,000 to $749,999 | 0 (0.0%) | 0 (0.0%) |
| $750,000 to $999,999 | 0 (0.0%) | 0 (0.0%) |
| $1,000,000 or more | 0 (0.0%) | 0 (0.0%) |
| Total | 16 (100.0%) | 16 (100.0%) |
Household Income by Mortgage Status in Keenes
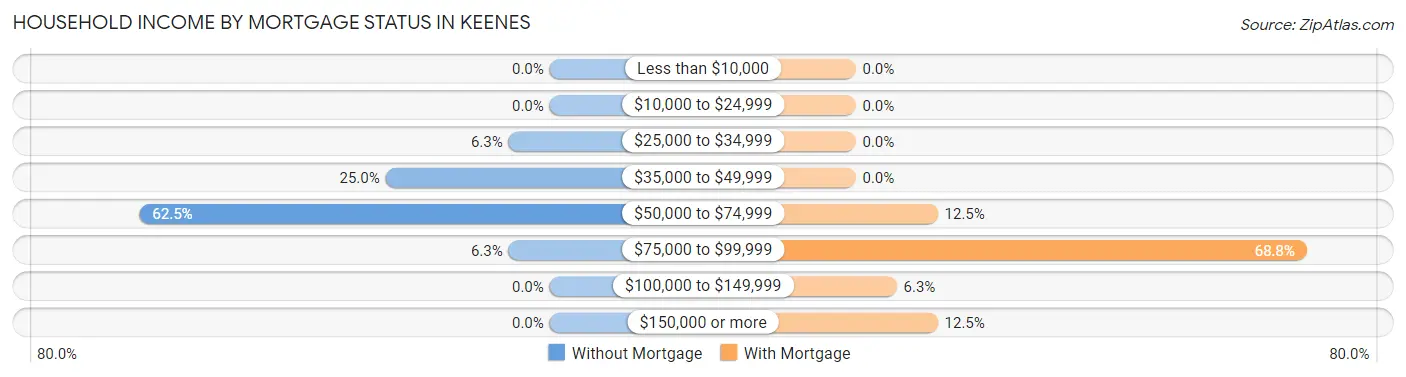
| Household Income | Without Mortgage | With Mortgage |
| Less than $10,000 | 0 (0.0%) | 0 (0.0%) |
| $10,000 to $24,999 | 0 (0.0%) | 0 (0.0%) |
| $25,000 to $34,999 | 1 (6.2%) | 0 (0.0%) |
| $35,000 to $49,999 | 4 (25.0%) | 0 (0.0%) |
| $50,000 to $74,999 | 10 (62.5%) | 2 (12.5%) |
| $75,000 to $99,999 | 1 (6.2%) | 11 (68.8%) |
| $100,000 to $149,999 | 0 (0.0%) | 1 (6.2%) |
| $150,000 or more | 0 (0.0%) | 2 (12.5%) |
| Total | 16 (100.0%) | 16 (100.0%) |
Property Value to Household Income Ratio in Keenes
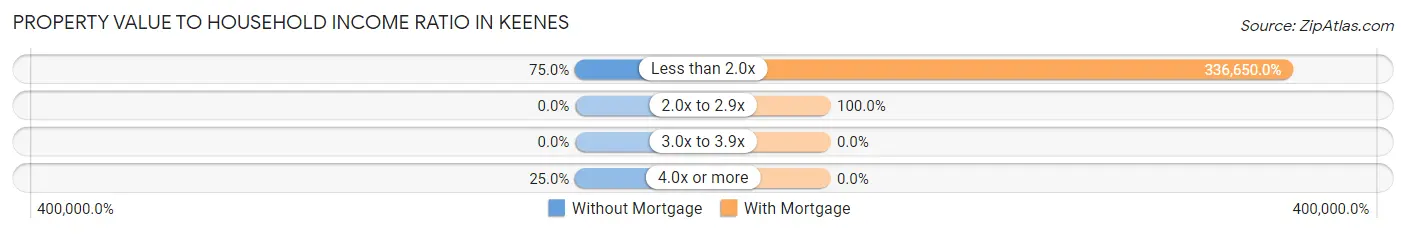
| Value-to-Income Ratio | Without Mortgage | With Mortgage |
| Less than 2.0x | 12 (75.0%) | 53,864 (336,650.0%) |
| 2.0x to 2.9x | 0 (0.0%) | 16 (100.0%) |
| 3.0x to 3.9x | 0 (0.0%) | 0 (0.0%) |
| 4.0x or more | 4 (25.0%) | 0 (0.0%) |
| Total | 16 (100.0%) | 16 (100.0%) |
Real Estate Taxes by Mortgage Status in Keenes
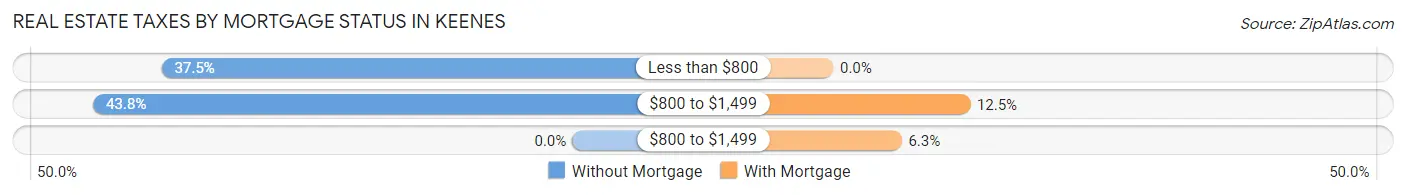
| Property Taxes | Without Mortgage | With Mortgage |
| Less than $800 | 6 (37.5%) | 0 (0.0%) |
| $800 to $1,499 | 7 (43.8%) | 2 (12.5%) |
| $800 to $1,499 | 0 (0.0%) | 1 (6.2%) |
| Total | 16 (100.0%) | 16 (100.0%) |
Health & Disability in Keenes
Health Insurance Coverage by Age in Keenes
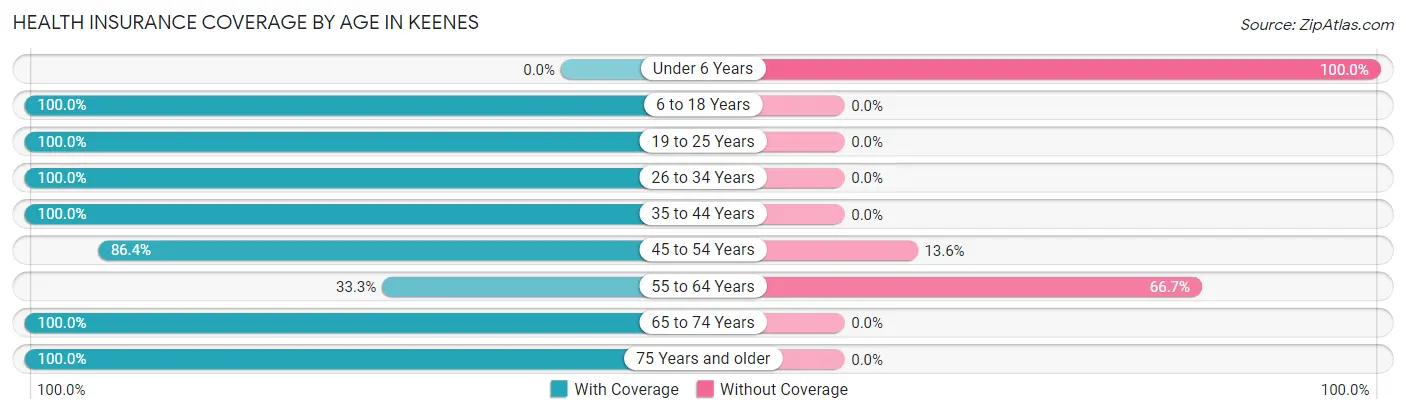
| Age Bracket | With Coverage | Without Coverage |
| Under 6 Years | 0 (0.0%) | 1 (100.0%) |
| 6 to 18 Years | 2 (100.0%) | 0 (0.0%) |
| 19 to 25 Years | 1 (100.0%) | 0 (0.0%) |
| 26 to 34 Years | 3 (100.0%) | 0 (0.0%) |
| 35 to 44 Years | 4 (100.0%) | 0 (0.0%) |
| 45 to 54 Years | 19 (86.4%) | 3 (13.6%) |
| 55 to 64 Years | 3 (33.3%) | 6 (66.7%) |
| 65 to 74 Years | 3 (100.0%) | 0 (0.0%) |
| 75 Years and older | 15 (100.0%) | 0 (0.0%) |
| Total | 50 (83.3%) | 10 (16.7%) |
Health Insurance Coverage by Citizenship Status in Keenes
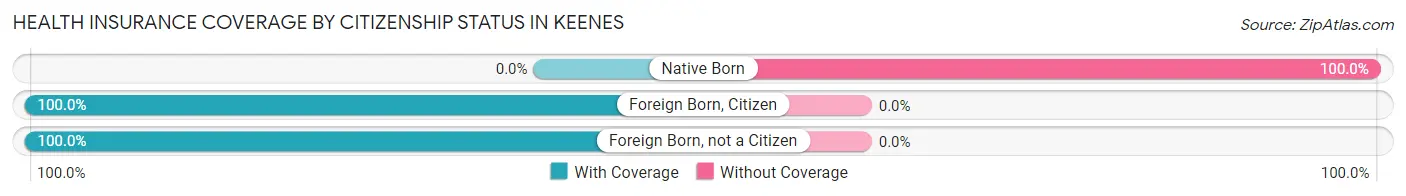
| Citizenship Status | With Coverage | Without Coverage |
| Native Born | 0 (0.0%) | 1 (100.0%) |
| Foreign Born, Citizen | 2 (100.0%) | 0 (0.0%) |
| Foreign Born, not a Citizen | 1 (100.0%) | 0 (0.0%) |
Health Insurance Coverage by Household Income in Keenes
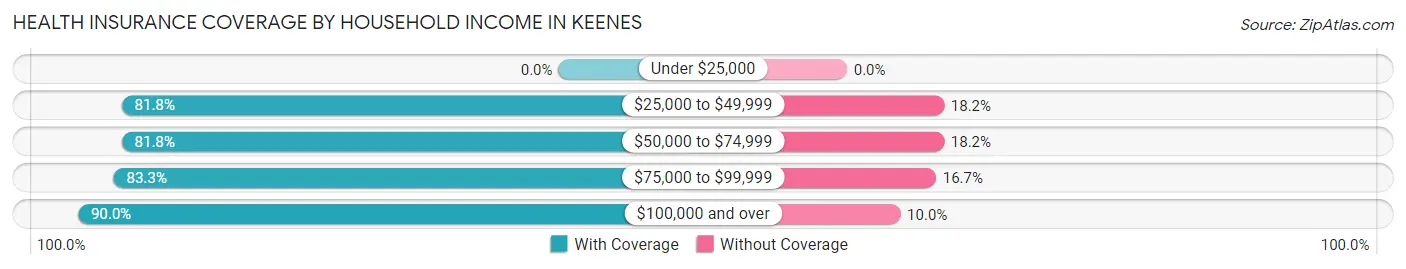
| Household Income | With Coverage | Without Coverage |
| Under $25,000 | 0 (0.0%) | 0 (0.0%) |
| $25,000 to $49,999 | 9 (81.8%) | 2 (18.2%) |
| $50,000 to $74,999 | 27 (81.8%) | 6 (18.2%) |
| $75,000 to $99,999 | 5 (83.3%) | 1 (16.7%) |
| $100,000 and over | 9 (90.0%) | 1 (10.0%) |
Public vs Private Health Insurance Coverage by Age in Keenes
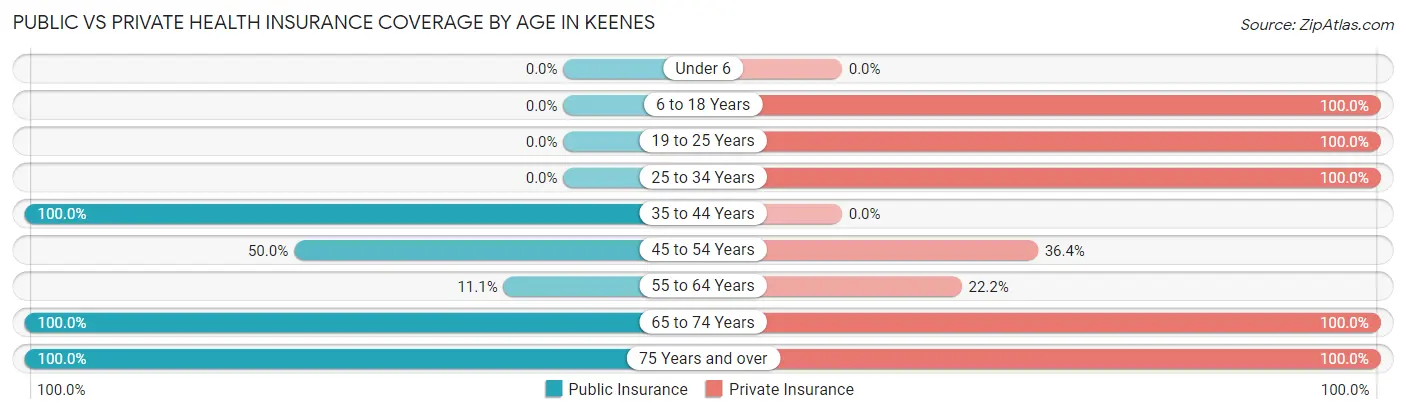
| Age Bracket | Public Insurance | Private Insurance |
| Under 6 | 0 (0.0%) | 0 (0.0%) |
| 6 to 18 Years | 0 (0.0%) | 2 (100.0%) |
| 19 to 25 Years | 0 (0.0%) | 1 (100.0%) |
| 25 to 34 Years | 0 (0.0%) | 3 (100.0%) |
| 35 to 44 Years | 4 (100.0%) | 0 (0.0%) |
| 45 to 54 Years | 11 (50.0%) | 8 (36.4%) |
| 55 to 64 Years | 1 (11.1%) | 2 (22.2%) |
| 65 to 74 Years | 3 (100.0%) | 3 (100.0%) |
| 75 Years and over | 15 (100.0%) | 15 (100.0%) |
| Total | 34 (56.7%) | 34 (56.7%) |
Disability Status by Sex by Age in Keenes
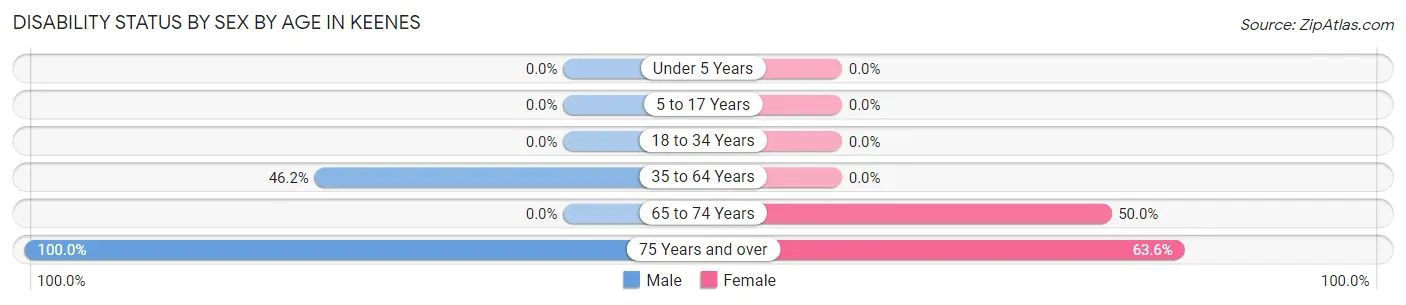
| Age Bracket | Male | Female |
| Under 5 Years | 0 (0.0%) | 0 (0.0%) |
| 5 to 17 Years | 0 (0.0%) | 0 (0.0%) |
| 18 to 34 Years | 0 (0.0%) | 0 (0.0%) |
| 35 to 64 Years | 12 (46.2%) | 0 (0.0%) |
| 65 to 74 Years | 0 (0.0%) | 1 (50.0%) |
| 75 Years and over | 4 (100.0%) | 7 (63.6%) |
Disability Class by Sex by Age in Keenes
Disability Class: Hearing Difficulty
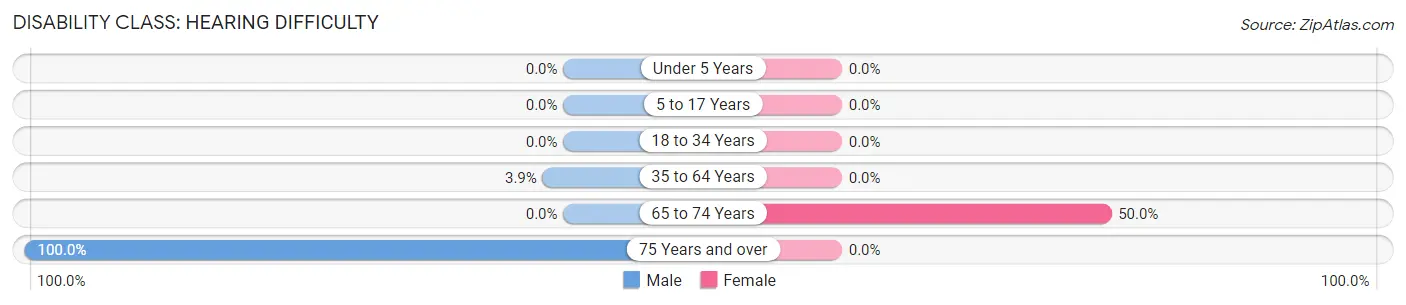
| Age Bracket | Male | Female |
| Under 5 Years | 0 (0.0%) | 0 (0.0%) |
| 5 to 17 Years | 0 (0.0%) | 0 (0.0%) |
| 18 to 34 Years | 0 (0.0%) | 0 (0.0%) |
| 35 to 64 Years | 1 (3.8%) | 0 (0.0%) |
| 65 to 74 Years | 0 (0.0%) | 1 (50.0%) |
| 75 Years and over | 4 (100.0%) | 0 (0.0%) |
Disability Class: Vision Difficulty
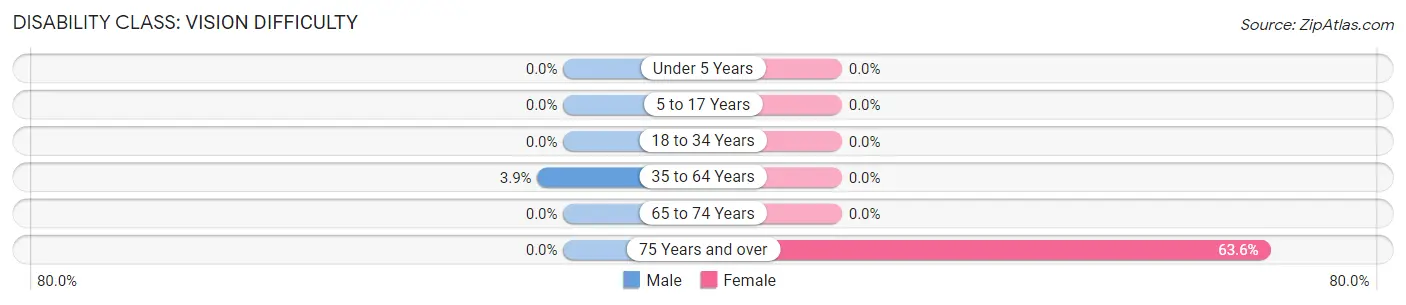
| Age Bracket | Male | Female |
| Under 5 Years | 0 (0.0%) | 0 (0.0%) |
| 5 to 17 Years | 0 (0.0%) | 0 (0.0%) |
| 18 to 34 Years | 0 (0.0%) | 0 (0.0%) |
| 35 to 64 Years | 1 (3.8%) | 0 (0.0%) |
| 65 to 74 Years | 0 (0.0%) | 0 (0.0%) |
| 75 Years and over | 0 (0.0%) | 7 (63.6%) |
Disability Class: Cognitive Difficulty
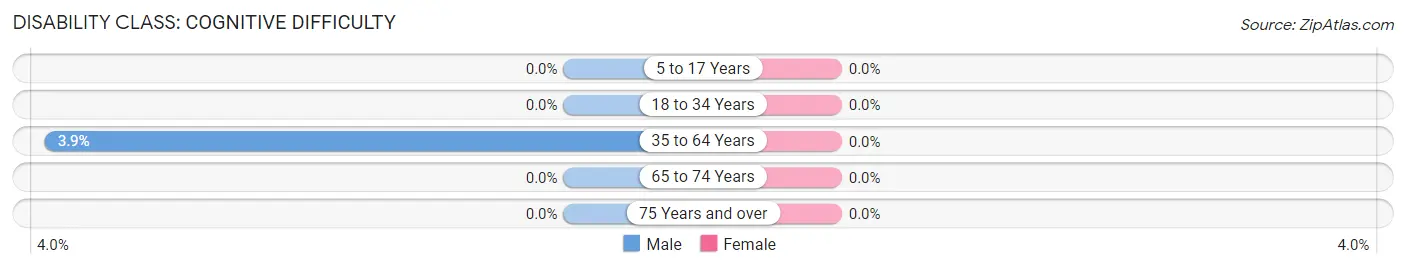
| Age Bracket | Male | Female |
| 5 to 17 Years | 0 (0.0%) | 0 (0.0%) |
| 18 to 34 Years | 0 (0.0%) | 0 (0.0%) |
| 35 to 64 Years | 1 (3.8%) | 0 (0.0%) |
| 65 to 74 Years | 0 (0.0%) | 0 (0.0%) |
| 75 Years and over | 0 (0.0%) | 0 (0.0%) |
Disability Class: Ambulatory Difficulty
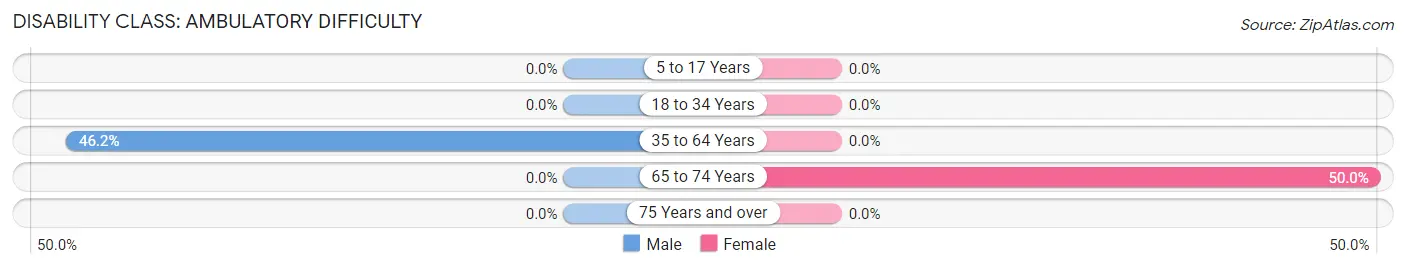
| Age Bracket | Male | Female |
| 5 to 17 Years | 0 (0.0%) | 0 (0.0%) |
| 18 to 34 Years | 0 (0.0%) | 0 (0.0%) |
| 35 to 64 Years | 12 (46.2%) | 0 (0.0%) |
| 65 to 74 Years | 0 (0.0%) | 1 (50.0%) |
| 75 Years and over | 0 (0.0%) | 0 (0.0%) |
Disability Class: Self-Care Difficulty
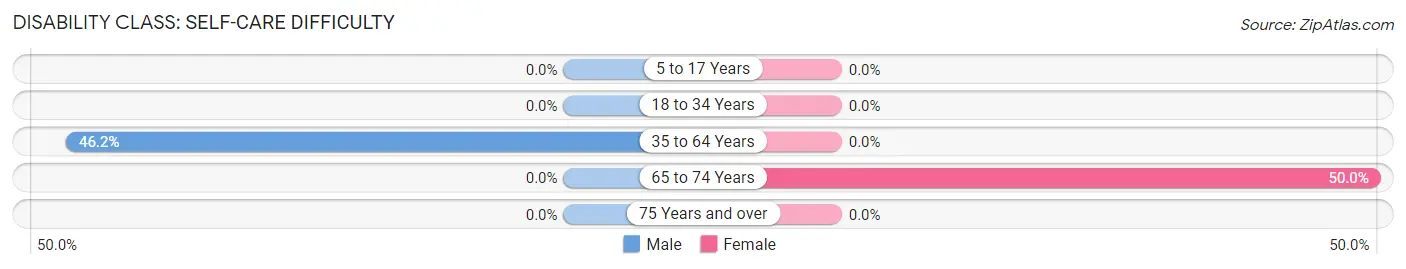
| Age Bracket | Male | Female |
| 5 to 17 Years | 0 (0.0%) | 0 (0.0%) |
| 18 to 34 Years | 0 (0.0%) | 0 (0.0%) |
| 35 to 64 Years | 12 (46.2%) | 0 (0.0%) |
| 65 to 74 Years | 0 (0.0%) | 1 (50.0%) |
| 75 Years and over | 0 (0.0%) | 0 (0.0%) |
Technology Access in Keenes
Computing Device Access in Keenes
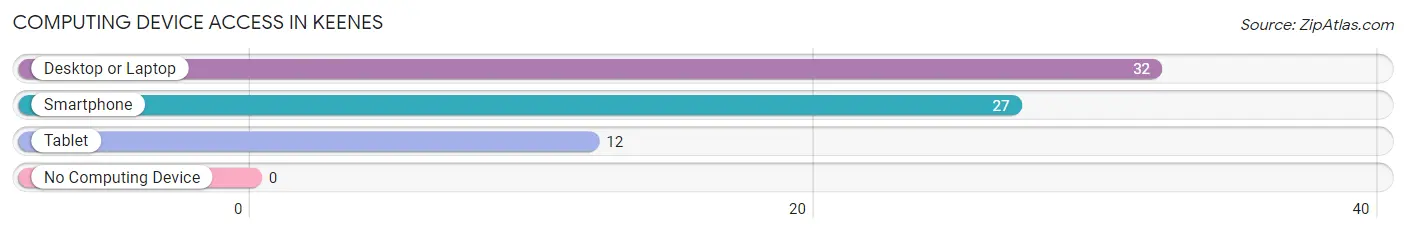
| Device Type | # Households | % Households |
| Desktop or Laptop | 32 | 100.0% |
| Smartphone | 27 | 84.4% |
| Tablet | 12 | 37.5% |
| No Computing Device | 0 | 0.0% |
| Total | 32 | 100.0% |
Internet Access in Keenes
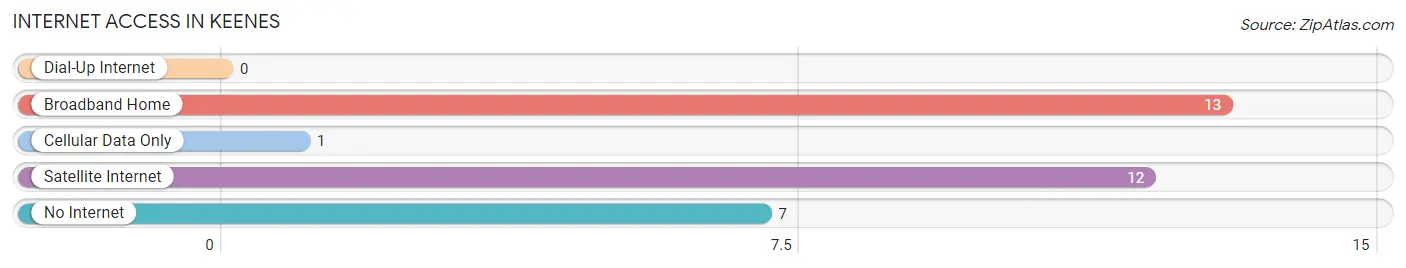
| Internet Type | # Households | % Households |
| Dial-Up Internet | 0 | 0.0% |
| Broadband Home | 13 | 40.6% |
| Cellular Data Only | 1 | 3.1% |
| Satellite Internet | 12 | 37.5% |
| No Internet | 7 | 21.9% |
| Total | 32 | 100.0% |
Keenes Summary
Keenes is a small village located in Wabash County, Illinois. It is situated in the southeastern part of the state, about 25 miles from the Indiana border. The village has a population of approximately 1,000 people and is part of the Mount Carmel Township.
History
Keenes was founded in 1854 by a group of settlers from Ohio. The village was named after the Keene family, who were among the first settlers. The Keene family had a large farm in the area and the village was built around it.
The village was originally a farming community, but in the late 19th century, the railroad came to the area and the village began to grow. The railroad brought new businesses and industries to the area, and the village began to prosper.
In the early 20th century, the village was home to several factories, including a flour mill, a brickyard, and a furniture factory. The village also had a number of stores, including a general store, a drug store, and a hardware store.
Geography
Keenes is located in the southeastern part of Illinois, about 25 miles from the Indiana border. The village is situated in the Wabash Valley, which is part of the larger Illinois River Valley. The village is surrounded by rolling hills and farmland.
The village is located near several major highways, including Interstate 64, US Route 45, and US Route 50. The nearest major city is Mount Carmel, which is about 10 miles away.
Economy
Keenes is a small, rural village with a population of about 1,000 people. The village is primarily a farming community, with many of the residents working in the agricultural industry. The village also has a few small businesses, including a grocery store, a hardware store, and a few restaurants.
The village is also home to a few manufacturing companies, including a furniture factory and a brickyard. The village also has a few small service businesses, such as a gas station and a car repair shop.
Demographics
Keenes is a small village with a population of about 1,000 people. The village is predominantly white, with about 95% of the population being white. The remaining 5% of the population is made up of African Americans, Hispanics, and other ethnicities.
The median household income in the village is about $35,000, which is slightly lower than the national average. The village has a poverty rate of about 15%, which is slightly higher than the national average.
Conclusion
Keenes is a small village located in Wabash County, Illinois. The village has a population of about 1,000 people and is primarily a farming community. The village has a few small businesses, including a grocery store, a hardware store, and a few restaurants. The village is also home to a few manufacturing companies, including a furniture factory and a brickyard. The village is predominantly white, with about 95% of the population being white. The median household income in the village is about $35,000, and the poverty rate is about 15%.
Common Questions
What is Per Capita Income in Keenes?
Per Capita income in Keenes is $32,253.
What is the Median Family Income in Keenes?
Median Family Income in Keenes is $68,125.
What is the Median Household income in Keenes?
Median Household Income in Keenes is $54,545.
What is Income or Wage Gap in Keenes?
Income or Wage Gap in Keenes is 42.6%.
Women in Keenes earn 57.4 cents for every dollar earned by a man.
What is Inequality or Gini Index in Keenes?
Inequality or Gini Index in Keenes is 0.17.
What is the Total Population of Keenes?
Total Population of Keenes is 60.
What is the Total Male Population of Keenes?
Total Male Population of Keenes is 32.
What is the Total Female Population of Keenes?
Total Female Population of Keenes is 28.
What is the Ratio of Males per 100 Females in Keenes?
There are 114.29 Males per 100 Females in Keenes.
What is the Ratio of Females per 100 Males in Keenes?
There are 87.50 Females per 100 Males in Keenes.
What is the Median Population Age in Keenes?
Median Population Age in Keenes is 51.0 Years.
What is the Average Family Size in Keenes
Average Family Size in Keenes is 2.5 People.
What is the Average Household Size in Keenes
Average Household Size in Keenes is 1.9 People.
How Large is the Labor Force in Keenes?
There are 26 People in the Labor Forcein in Keenes.
What is the Percentage of People in the Labor Force in Keenes?
45.6% of People are in the Labor Force in Keenes.