Panola, IL Map & Demographics
Panola Map
Panola Overview
$45,796
PER CAPITA INCOME
$103,750
AVG FAMILY INCOME
0.35
INEQUALITY / GINI INDEX
25
TOTAL POPULATION
16
MALE POPULATION
9
FEMALE POPULATION
177.78
MALES / 100 FEMALES
56.25
FEMALES / 100 MALES
62.8
MEDIAN AGE
2.4
AVG FAMILY SIZE
1.7
AVG HOUSEHOLD SIZE
10
LABOR FORCE [ PEOPLE ]
43.5%
PERCENT IN LABOR FORCE
Panola Area Codes
Income in Panola
Income Overview in Panola
| Characteristic | Number | Measure |
| Per Capita Income | 25 | $45,796 |
| Median Family Income | 7 | $103,750 |
| Mean Family Income | 7 | $110,657 |
| Median Household Income | 15 | $0 |
| Mean Household Income | 15 | $76,100 |
| Income Deficit | 7 | $0 |
| Wage / Income Gap (%) | 25 | 0.00% |
| Wage / Income Gap ($) | 25 | 100.00¢ per $1 |
| Gini / Inequality Index | 25 | 0.35 |
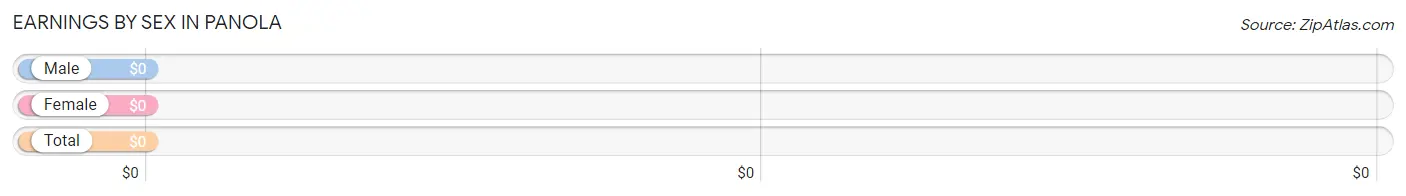
Earnings by Sex in Panola
| Sex | Number | Average Earnings |
| Male | 5 (41.7%) | $0 |
| Female | 7 (58.3%) | $0 |
| Total | 12 (100.0%) | $0 |
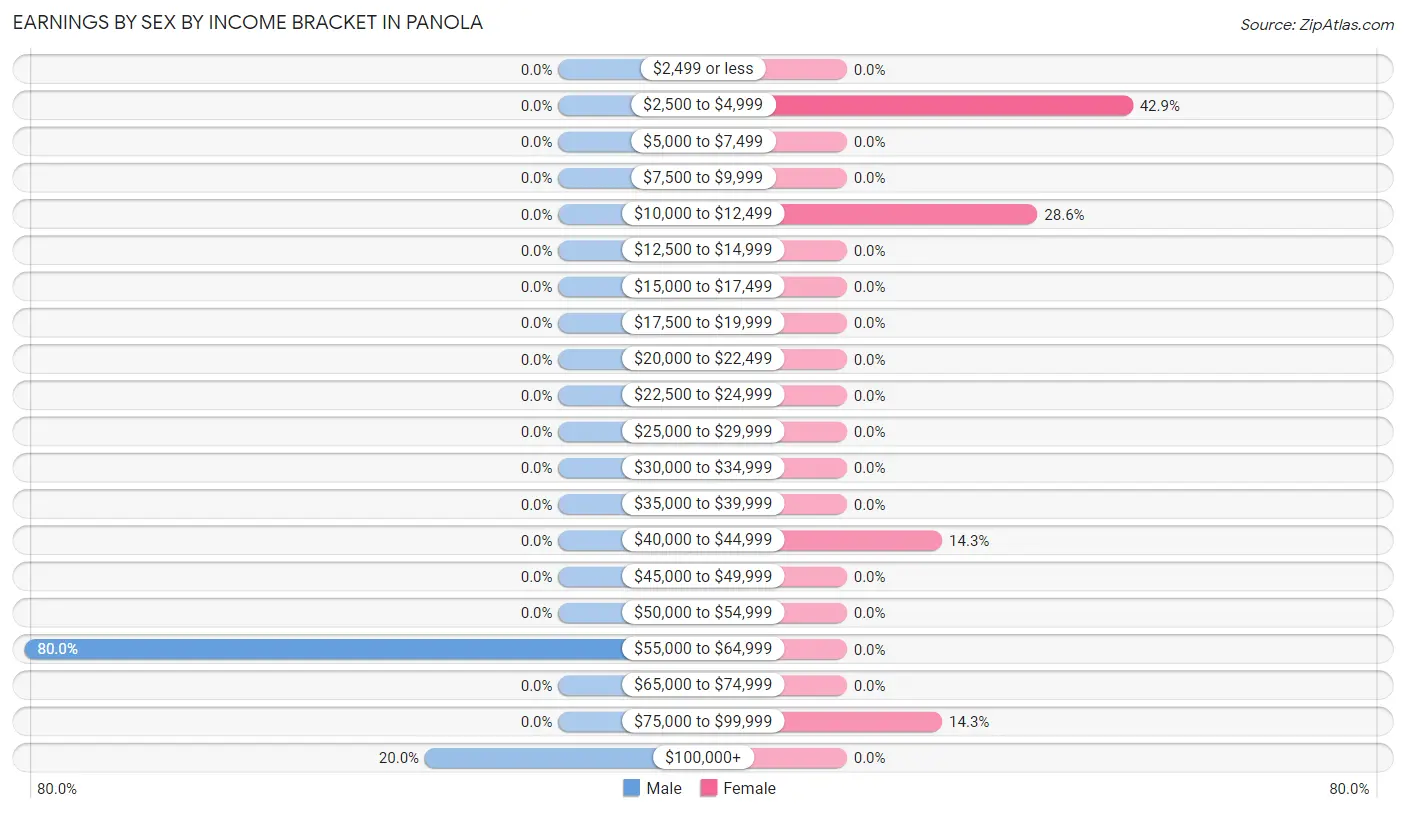
Earnings by Sex by Income Bracket in Panola
The most common earnings brackets in Panola are $55,000 to $64,999 for men (4 | 80.0%) and $2,500 to $4,999 for women (3 | 42.9%).
| Income | Male | Female |
| $2,499 or less | 0 (0.0%) | 0 (0.0%) |
| $2,500 to $4,999 | 0 (0.0%) | 3 (42.9%) |
| $5,000 to $7,499 | 0 (0.0%) | 0 (0.0%) |
| $7,500 to $9,999 | 0 (0.0%) | 0 (0.0%) |
| $10,000 to $12,499 | 0 (0.0%) | 2 (28.6%) |
| $12,500 to $14,999 | 0 (0.0%) | 0 (0.0%) |
| $15,000 to $17,499 | 0 (0.0%) | 0 (0.0%) |
| $17,500 to $19,999 | 0 (0.0%) | 0 (0.0%) |
| $20,000 to $22,499 | 0 (0.0%) | 0 (0.0%) |
| $22,500 to $24,999 | 0 (0.0%) | 0 (0.0%) |
| $25,000 to $29,999 | 0 (0.0%) | 0 (0.0%) |
| $30,000 to $34,999 | 0 (0.0%) | 0 (0.0%) |
| $35,000 to $39,999 | 0 (0.0%) | 0 (0.0%) |
| $40,000 to $44,999 | 0 (0.0%) | 1 (14.3%) |
| $45,000 to $49,999 | 0 (0.0%) | 0 (0.0%) |
| $50,000 to $54,999 | 0 (0.0%) | 0 (0.0%) |
| $55,000 to $64,999 | 4 (80.0%) | 0 (0.0%) |
| $65,000 to $74,999 | 0 (0.0%) | 0 (0.0%) |
| $75,000 to $99,999 | 0 (0.0%) | 1 (14.3%) |
| $100,000+ | 1 (20.0%) | 0 (0.0%) |
| Total | 5 (100.0%) | 7 (100.0%) |
Earnings by Sex by Educational Attainment in Panola
| Educational Attainment | Male Income | Female Income |
| Less than High School | - | - |
| High School Diploma | - | - |
| College or Associate's Degree | - | - |
| Bachelor's Degree | - | - |
| Graduate Degree | - | - |
| Total | - | - |
Family Income in Panola
Family Income Brackets in Panola
According to the Panola family income data, there are 3 families falling into the $100,000 to $149,999 income range, which is the most common income bracket and makes up 42.9% of all families.
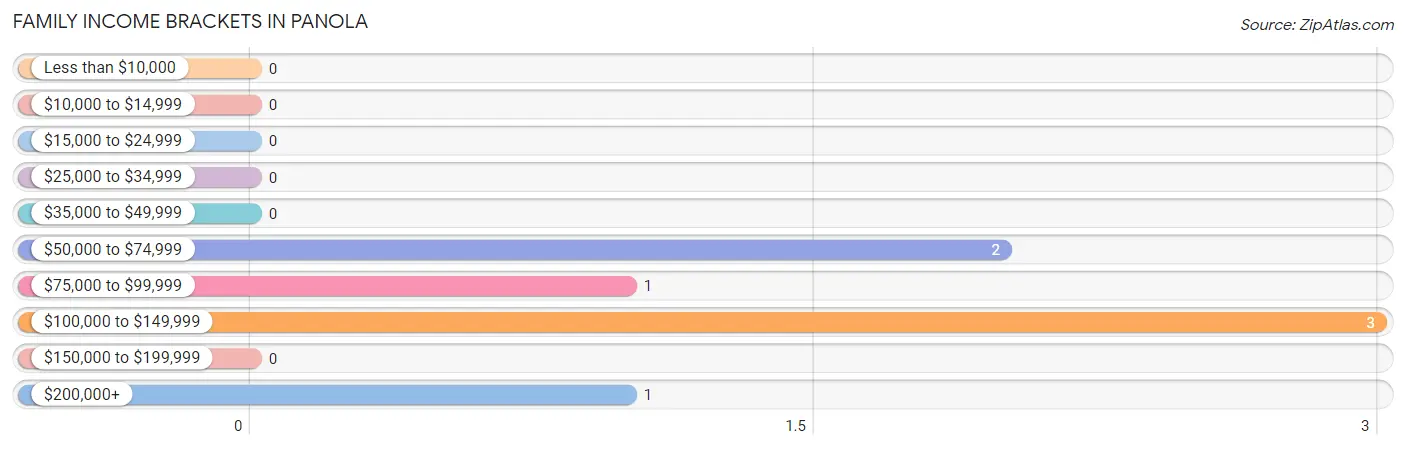
| Income Bracket | # Families | % Families |
| Less than $10,000 | 0 | 0.0% |
| $10,000 to $14,999 | 0 | 0.0% |
| $15,000 to $24,999 | 0 | 0.0% |
| $25,000 to $34,999 | 0 | 0.0% |
| $35,000 to $49,999 | 0 | 0.0% |
| $50,000 to $74,999 | 2 | 28.6% |
| $75,000 to $99,999 | 1 | 14.3% |
| $100,000 to $149,999 | 3 | 42.9% |
| $150,000 to $199,999 | 0 | 0.0% |
| $200,000+ | 1 | 14.3% |
Family Income by Famaliy Size in Panola
2-person families (4 | 57.1%) account for the highest median family income in Panola with $106,250 per family, while 2-person families (4 | 57.1%) have the highest median income of $53,125 per family member.
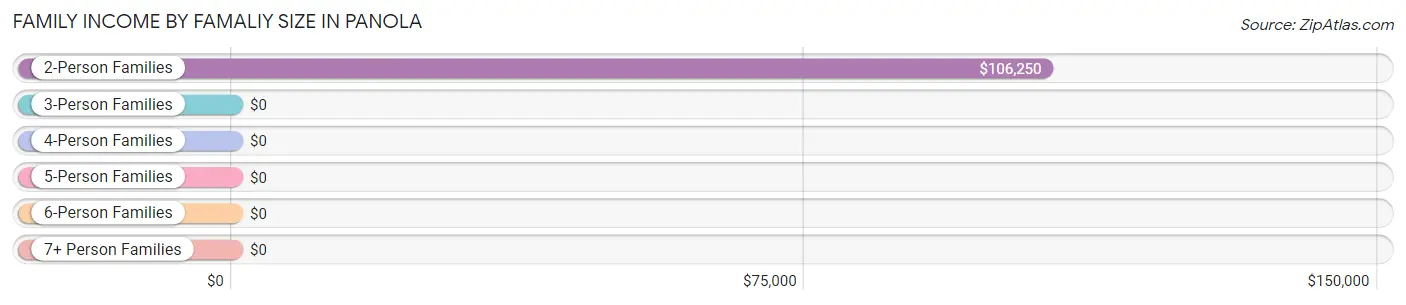
| Income Bracket | # Families | Median Income |
| 2-Person Families | 4 (57.1%) | $106,250 |
| 3-Person Families | 3 (42.9%) | $0 |
| 4-Person Families | 0 (0.0%) | $0 |
| 5-Person Families | 0 (0.0%) | $0 |
| 6-Person Families | 0 (0.0%) | $0 |
| 7+ Person Families | 0 (0.0%) | $0 |
| Total | 7 (100.0%) | $103,750 |
Family Income by Number of Earners in Panola
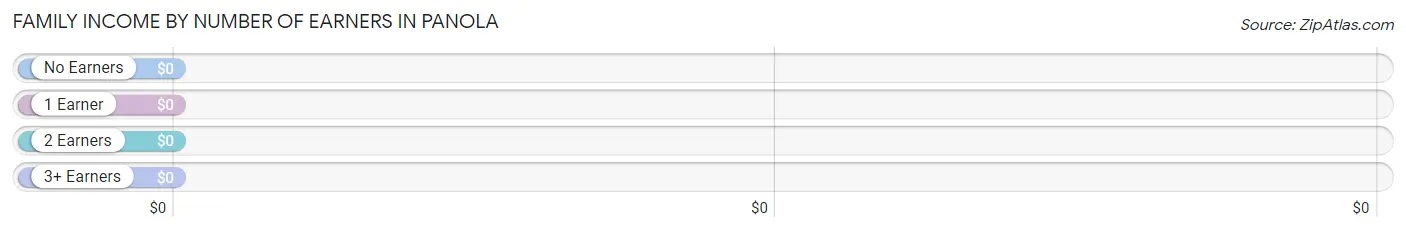
| Number of Earners | # Families | Median Income |
| No Earners | 1 (14.3%) | $0 |
| 1 Earner | 2 (28.6%) | $0 |
| 2 Earners | 4 (57.1%) | $0 |
| 3+ Earners | 0 (0.0%) | $0 |
| Total | 7 (100.0%) | $103,750 |
Household Income in Panola
Household Income Brackets in Panola
With 7 households falling in the category, the $25,000 to $34,999 income range is the most frequent in Panola, accounting for 46.7% of all households.
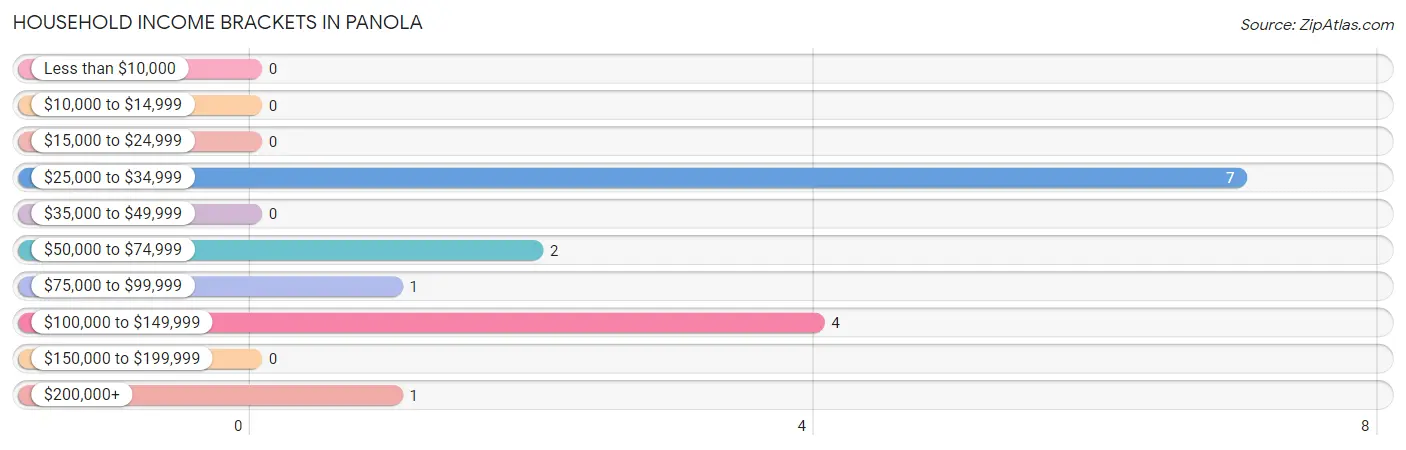
| Income Bracket | # Households | % Households |
| Less than $10,000 | 0 | 0.0% |
| $10,000 to $14,999 | 0 | 0.0% |
| $15,000 to $24,999 | 0 | 0.0% |
| $25,000 to $34,999 | 7 | 46.7% |
| $35,000 to $49,999 | 0 | 0.0% |
| $50,000 to $74,999 | 2 | 13.3% |
| $75,000 to $99,999 | 1 | 6.7% |
| $100,000 to $149,999 | 4 | 26.7% |
| $150,000 to $199,999 | 0 | 0.0% |
| $200,000+ | 1 | 6.7% |
Household Income by Householder Age in Panola
| Income Bracket | # Households | Median Income |
| 15 to 24 Years | 0 (0.0%) | $0 |
| 25 to 44 Years | 2 (13.3%) | $0 |
| 45 to 64 Years | 11 (73.3%) | $0 |
| 65+ Years | 2 (13.3%) | $0 |
| Total | 15 (100.0%) | $0 |
Poverty in Panola
Income Below Poverty by Sex and Age in Panola
| Age Bracket | Male | Female |
| Under 5 Years | 0 (0.0%) | 0 (0.0%) |
| 5 Years | 0 (0.0%) | 0 (0.0%) |
| 6 to 11 Years | 0 (0.0%) | 0 (0.0%) |
| 12 to 14 Years | 0 (0.0%) | 0 (0.0%) |
| 15 Years | 0 (0.0%) | 0 (0.0%) |
| 16 and 17 Years | 0 (0.0%) | 0 (0.0%) |
| 18 to 24 Years | 0 (0.0%) | 0 (0.0%) |
| 25 to 34 Years | 0 (0.0%) | 0 (0.0%) |
| 35 to 44 Years | 0 (0.0%) | 0 (0.0%) |
| 45 to 54 Years | 0 (0.0%) | 0 (0.0%) |
| 55 to 64 Years | 0 (0.0%) | 0 (0.0%) |
| 65 to 74 Years | 0 (0.0%) | 0 (0.0%) |
| 75 Years and over | 0 (0.0%) | 0 (0.0%) |
| Total | 0 (0.0%) | 0 (0.0%) |
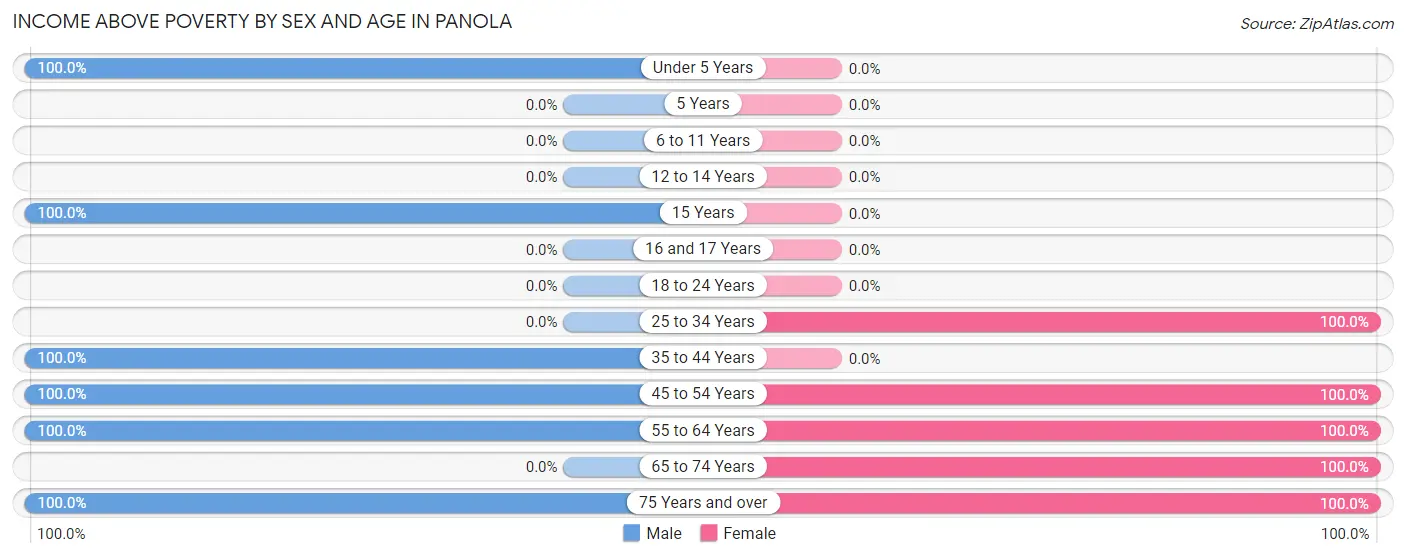
Income Above Poverty by Sex and Age in Panola
According to the poverty statistics in Panola, males aged under 5 years and females aged 25 to 34 years are the age groups that are most secure financially, with 100.0% of males and 100.0% of females in these age groups living above the poverty line.
| Age Bracket | Male | Female |
| Under 5 Years | 1 (100.0%) | 0 (0.0%) |
| 5 Years | 0 (0.0%) | 0 (0.0%) |
| 6 to 11 Years | 0 (0.0%) | 0 (0.0%) |
| 12 to 14 Years | 0 (0.0%) | 0 (0.0%) |
| 15 Years | 1 (100.0%) | 0 (0.0%) |
| 16 and 17 Years | 0 (0.0%) | 0 (0.0%) |
| 18 to 24 Years | 0 (0.0%) | 0 (0.0%) |
| 25 to 34 Years | 0 (0.0%) | 3 (100.0%) |
| 35 to 44 Years | 2 (100.0%) | 0 (0.0%) |
| 45 to 54 Years | 1 (100.0%) | 1 (100.0%) |
| 55 to 64 Years | 9 (100.0%) | 2 (100.0%) |
| 65 to 74 Years | 0 (0.0%) | 1 (100.0%) |
| 75 Years and over | 2 (100.0%) | 2 (100.0%) |
| Total | 16 (100.0%) | 9 (100.0%) |
Income Below Poverty Among Married-Couple Families in Panola
| Children | Above Poverty | Below Poverty |
| No Children | 4 (100.0%) | 0 (0.0%) |
| 1 or 2 Children | 2 (100.0%) | 0 (0.0%) |
| 3 or 4 Children | 0 (0.0%) | 0 (0.0%) |
| 5 or more Children | 0 (0.0%) | 0 (0.0%) |
| Total | 6 (100.0%) | 0 (0.0%) |
Income Below Poverty Among Single-Parent Households in Panola
| Children | Single Father | Single Mother |
| No Children | 0 (0.0%) | 0 (0.0%) |
| 1 or 2 Children | 0 (0.0%) | 0 (0.0%) |
| 3 or 4 Children | 0 (0.0%) | 0 (0.0%) |
| 5 or more Children | 0 (0.0%) | 0 (0.0%) |
| Total | 0 (0.0%) | 0 (0.0%) |
Income Below Poverty Among Married-Couple vs Single-Parent Households in Panola
| Children | Married-Couple Families | Single-Parent Households |
| No Children | 0 (0.0%) | 0 (0.0%) |
| 1 or 2 Children | 0 (0.0%) | 0 (0.0%) |
| 3 or 4 Children | 0 (0.0%) | 0 (0.0%) |
| 5 or more Children | 0 (0.0%) | 0 (0.0%) |
| Total | 0 (0.0%) | 0 (0.0%) |
Race in Panola
The most populous races in Panola are , and White / Caucasian (25 | 100.0%).
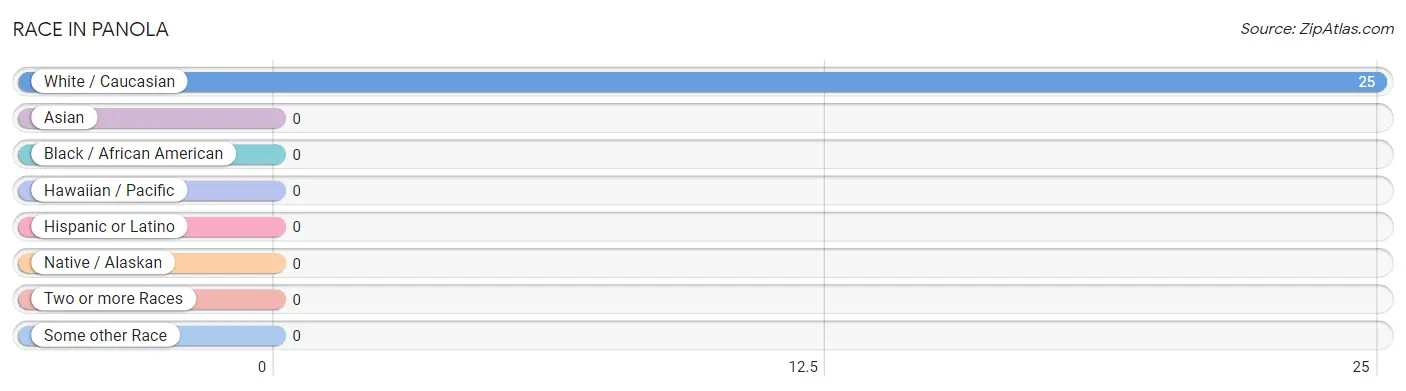
| Race | # Population | % Population |
| Asian | 0 | 0.0% |
| Black / African American | 0 | 0.0% |
| Hawaiian / Pacific | 0 | 0.0% |
| Hispanic or Latino | 0 | 0.0% |
| Native / Alaskan | 0 | 0.0% |
| White / Caucasian | 25 | 100.0% |
| Two or more Races | 0 | 0.0% |
| Some other Race | 0 | 0.0% |
| Total | 25 | 100.0% |
Ancestry in Panola
The most populous ancestries reported in Panola are German (15 | 60.0%), Dutch (7 | 28.0%), Swedish (3 | 12.0%), Scottish (2 | 8.0%), and English (1 | 4.0%), together accounting for 112.0% of all Panola residents.
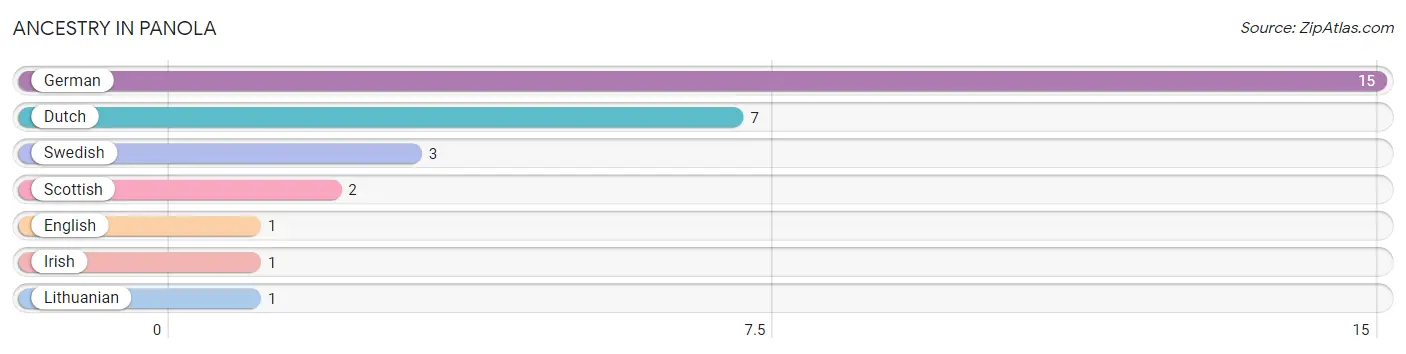
| Ancestry | # Population | % Population |
| Dutch | 7 | 28.0% |
| English | 1 | 4.0% |
| German | 15 | 60.0% |
| Irish | 1 | 4.0% |
| Lithuanian | 1 | 4.0% |
| Scottish | 2 | 8.0% |
| Swedish | 3 | 12.0% | View All 7 Rows |
Immigrants in Panola

| Immigration Origin | # Population | % Population | View All 0 Rows |
Sex and Age in Panola
Sex and Age in Panola
The most populous age groups in Panola are 60 to 64 Years (9 | 56.2%) for men and 30 to 34 Years (3 | 33.3%) for women.
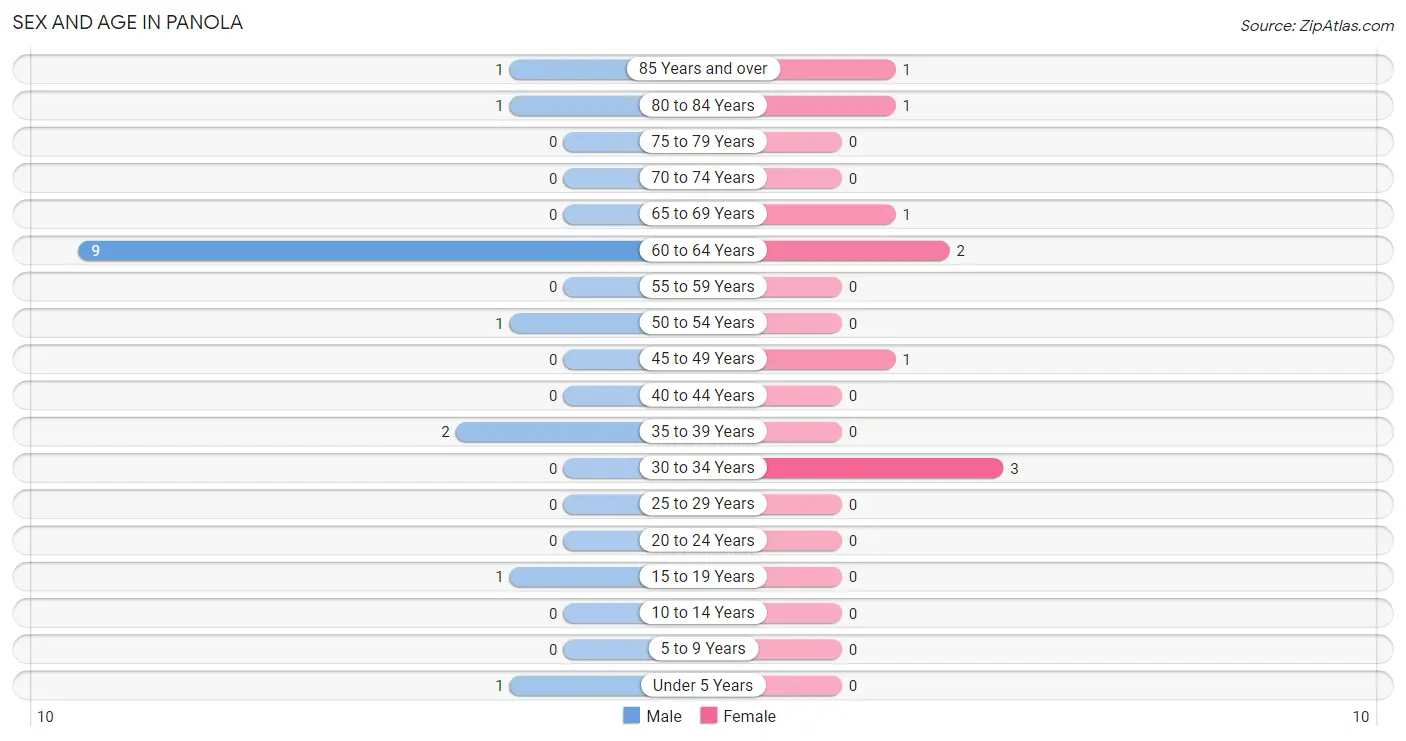
| Age Bracket | Male | Female |
| Under 5 Years | 1 (6.2%) | 0 (0.0%) |
| 5 to 9 Years | 0 (0.0%) | 0 (0.0%) |
| 10 to 14 Years | 0 (0.0%) | 0 (0.0%) |
| 15 to 19 Years | 1 (6.2%) | 0 (0.0%) |
| 20 to 24 Years | 0 (0.0%) | 0 (0.0%) |
| 25 to 29 Years | 0 (0.0%) | 0 (0.0%) |
| 30 to 34 Years | 0 (0.0%) | 3 (33.3%) |
| 35 to 39 Years | 2 (12.5%) | 0 (0.0%) |
| 40 to 44 Years | 0 (0.0%) | 0 (0.0%) |
| 45 to 49 Years | 0 (0.0%) | 1 (11.1%) |
| 50 to 54 Years | 1 (6.2%) | 0 (0.0%) |
| 55 to 59 Years | 0 (0.0%) | 0 (0.0%) |
| 60 to 64 Years | 9 (56.2%) | 2 (22.2%) |
| 65 to 69 Years | 0 (0.0%) | 1 (11.1%) |
| 70 to 74 Years | 0 (0.0%) | 0 (0.0%) |
| 75 to 79 Years | 0 (0.0%) | 0 (0.0%) |
| 80 to 84 Years | 1 (6.2%) | 1 (11.1%) |
| 85 Years and over | 1 (6.2%) | 1 (11.1%) |
| Total | 16 (100.0%) | 9 (100.0%) |
Families and Households in Panola
Median Family Size in Panola
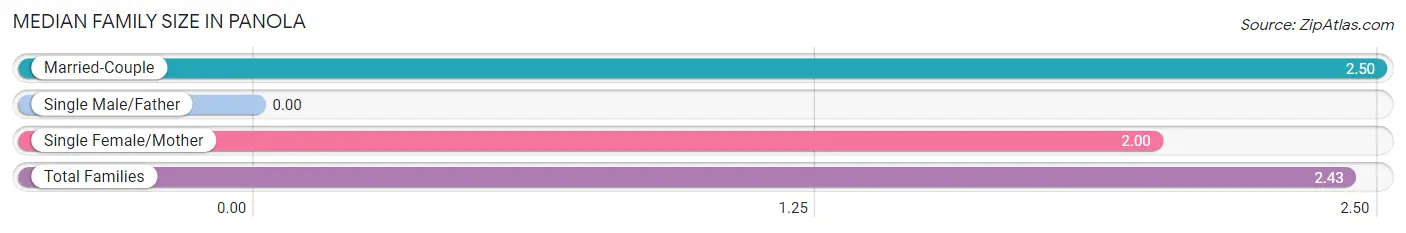
| Family Type | # Families | Family Size |
| Married-Couple | 6 (85.7%) | 2.50 |
| Single Male/Father | 0 (0.0%) | - |
| Single Female/Mother | 1 (14.3%) | 2.00 |
| Total Families | 7 (100.0%) | 2.43 |
Median Household Size in Panola
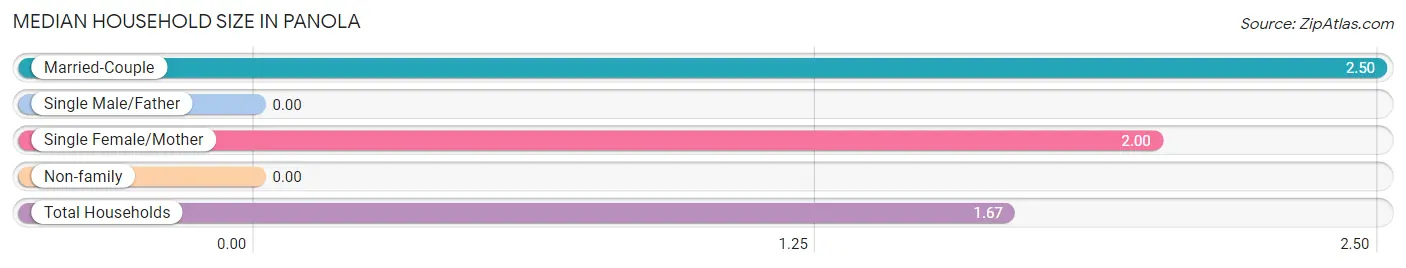
| Household Type | # Households | Household Size |
| Married-Couple | 6 (40.0%) | 2.50 |
| Single Male/Father | 0 (0.0%) | - |
| Single Female/Mother | 1 (6.7%) | 2.00 |
| Non-family | 8 (53.3%) | - |
| Total Households | 15 (100.0%) | 1.67 |
Household Size by Marriage Status in Panola
Out of a total of 15 households in Panola, 7 (46.7%) are family households, while 8 (53.3%) are nonfamily households. The most numerous type of family households are 2-person households, comprising 4, and the most common type of nonfamily households are 1-person households, comprising 8.
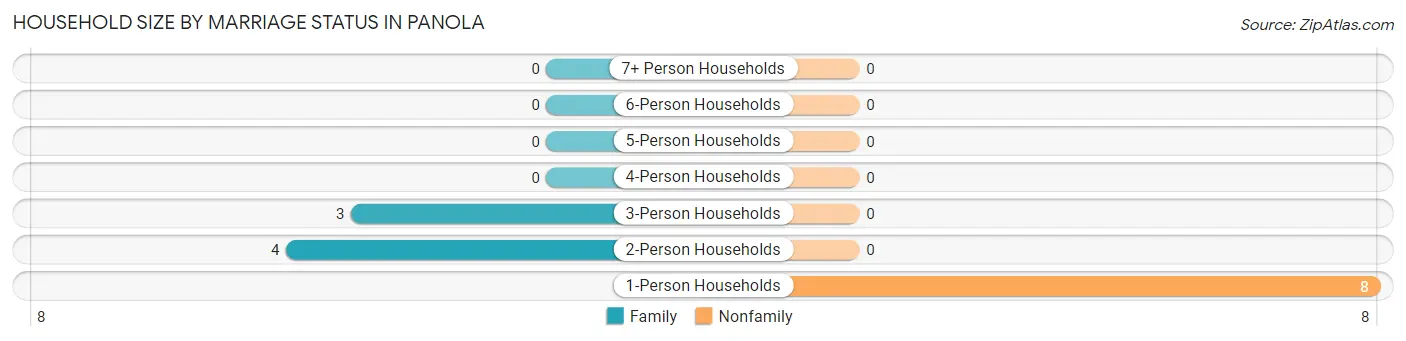
| Household Size | Family Households | Nonfamily Households |
| 1-Person Households | - | 8 (53.3%) |
| 2-Person Households | 4 (26.7%) | 0 (0.0%) |
| 3-Person Households | 3 (20.0%) | 0 (0.0%) |
| 4-Person Households | 0 (0.0%) | 0 (0.0%) |
| 5-Person Households | 0 (0.0%) | 0 (0.0%) |
| 6-Person Households | 0 (0.0%) | 0 (0.0%) |
| 7+ Person Households | 0 (0.0%) | 0 (0.0%) |
| Total | 7 (46.7%) | 8 (53.3%) |
Female Fertility in Panola
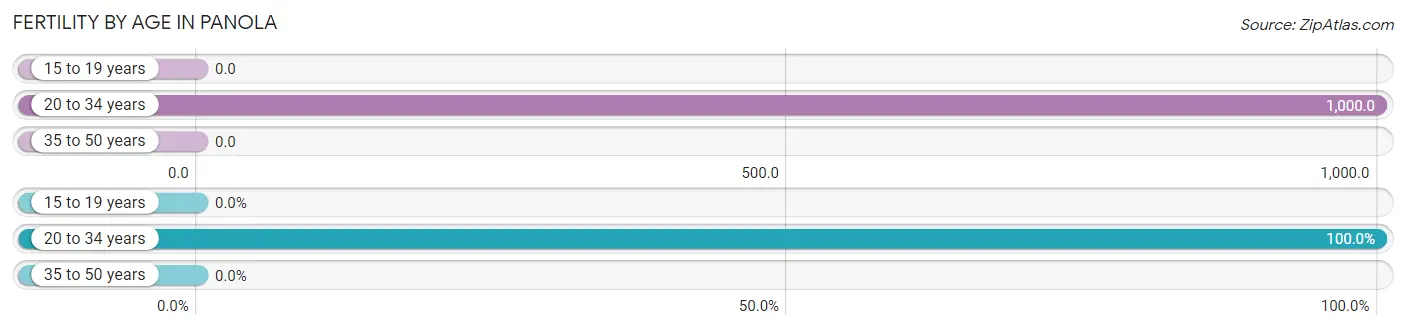
Fertility by Age in Panola
Average fertility rate in Panola is 750.0 births per 1,000 women. Women in the age bracket of 20 to 34 years have the highest fertility rate with 1,000.0 births per 1,000 women. Women in the age bracket of 20 to 34 years acount for 100.0% of all women with births.
| Age Bracket | Women with Births | Births / 1,000 Women |
| 15 to 19 years | 0 (0.0%) | 0.0 |
| 20 to 34 years | 3 (100.0%) | 1,000.0 |
| 35 to 50 years | 0 (0.0%) | 0.0 |
| Total | 3 (100.0%) | 750.0 |
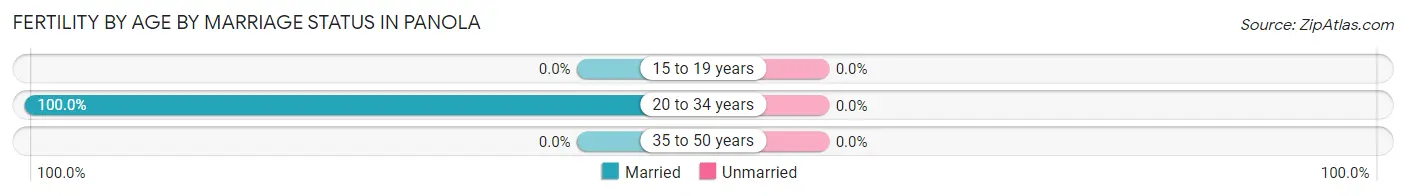
Fertility by Age by Marriage Status in Panola
| Age Bracket | Married | Unmarried |
| 15 to 19 years | 0 (0.0%) | 0 (0.0%) |
| 20 to 34 years | 3 (100.0%) | 0 (0.0%) |
| 35 to 50 years | 0 (0.0%) | 0 (0.0%) |
| Total | 3 (100.0%) | 0 (0.0%) |
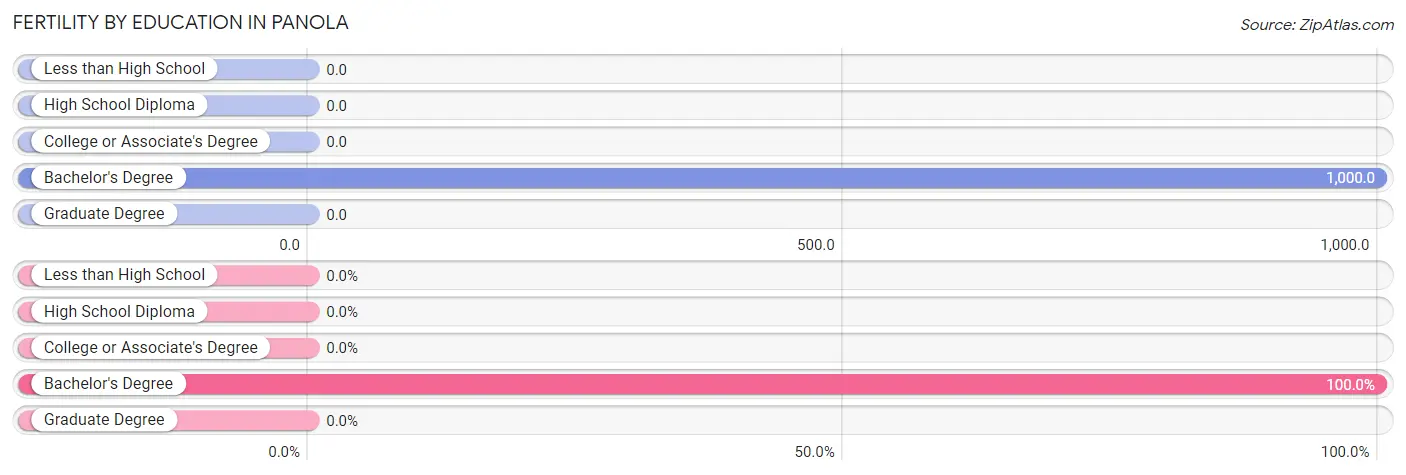
Fertility by Education in Panola
| Educational Attainment | Women with Births | Births / 1,000 Women |
| Less than High School | 0 (0.0%) | 0.0 |
| High School Diploma | 0 (0.0%) | 0.0 |
| College or Associate's Degree | 0 (0.0%) | 0.0 |
| Bachelor's Degree | 3 (100.0%) | 1,000.0 |
| Graduate Degree | 0 (0.0%) | 0.0 |
| Total | 3 (100.0%) | 750.0 |
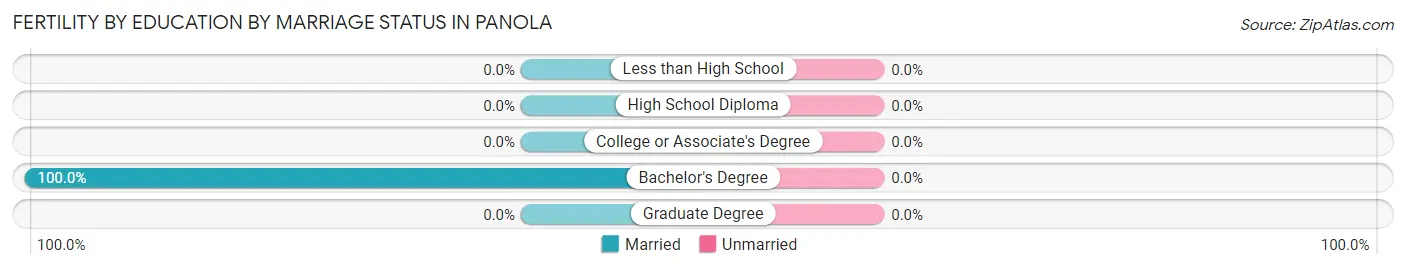
Fertility by Education by Marriage Status in Panola
| Educational Attainment | Married | Unmarried |
| Less than High School | 0 (0.0%) | 0 (0.0%) |
| High School Diploma | 0 (0.0%) | 0 (0.0%) |
| College or Associate's Degree | 0 (0.0%) | 0 (0.0%) |
| Bachelor's Degree | 3 (100.0%) | 0 (0.0%) |
| Graduate Degree | 0 (0.0%) | 0 (0.0%) |
| Total | 3 (100.0%) | 0 (0.0%) |
Employment Characteristics in Panola
Employment by Class of Employer in Panola
Among the 10 employed individuals in Panola, private company employees (6 | 60.0%), not-for-profit organizations (3 | 30.0%), and state government employees (1 | 10.0%) make up the most common classes of employment.
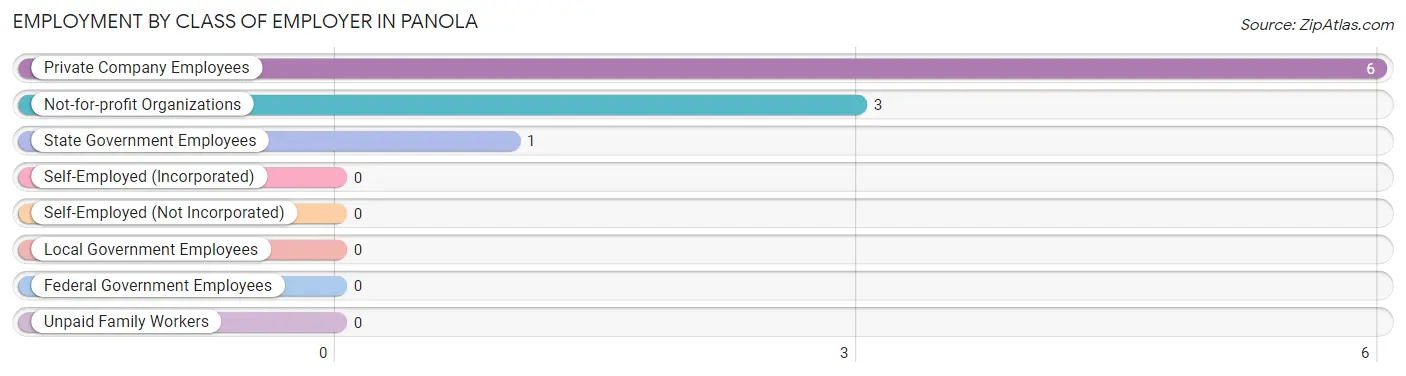
| Employer Class | # Employees | % Employees |
| Private Company Employees | 6 | 60.0% |
| Self-Employed (Incorporated) | 0 | 0.0% |
| Self-Employed (Not Incorporated) | 0 | 0.0% |
| Not-for-profit Organizations | 3 | 30.0% |
| Local Government Employees | 0 | 0.0% |
| State Government Employees | 1 | 10.0% |
| Federal Government Employees | 0 | 0.0% |
| Unpaid Family Workers | 0 | 0.0% |
| Total | 10 | 100.0% |
Employment Status by Age in Panola
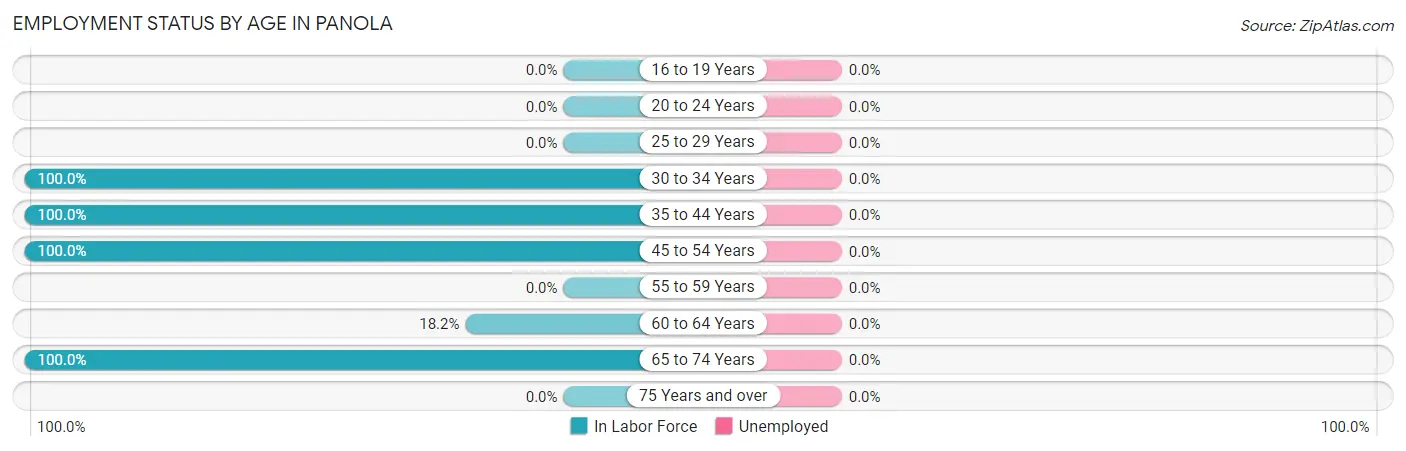
| Age Bracket | In Labor Force | Unemployed |
| 16 to 19 Years | 0 (0.0%) | 0 (0.0%) |
| 20 to 24 Years | 0 (0.0%) | 0 (0.0%) |
| 25 to 29 Years | 0 (0.0%) | 0 (0.0%) |
| 30 to 34 Years | 3 (100.0%) | 0 (0.0%) |
| 35 to 44 Years | 2 (100.0%) | 0 (0.0%) |
| 45 to 54 Years | 2 (100.0%) | 0 (0.0%) |
| 55 to 59 Years | 0 (0.0%) | 0 (0.0%) |
| 60 to 64 Years | 2 (18.2%) | 0 (0.0%) |
| 65 to 74 Years | 1 (100.0%) | 0 (0.0%) |
| 75 Years and over | 0 (0.0%) | 0 (0.0%) |
| Total | 10 (43.5%) | 0 (0.0%) |
Employment Status by Educational Attainment in Panola
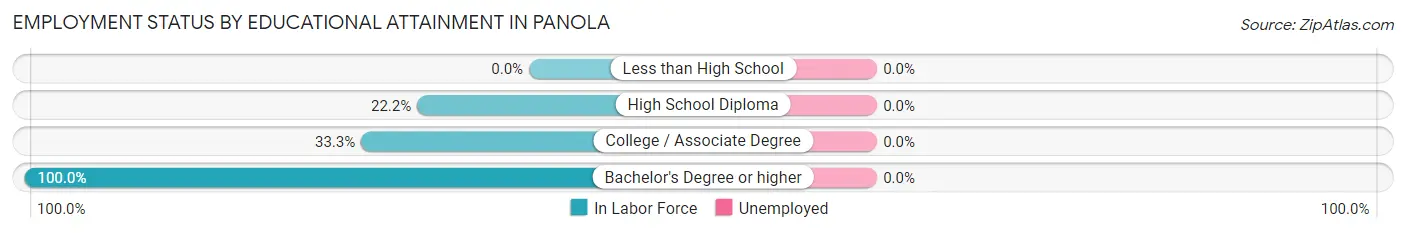
| Educational Attainment | In Labor Force | Unemployed |
| Less than High School | 0 (0.0%) | 0 (0.0%) |
| High School Diploma | 2 (22.2%) | 0 (0.0%) |
| College / Associate Degree | 1 (33.3%) | 0 (0.0%) |
| Bachelor's Degree or higher | 6 (100.0%) | 0 (0.0%) |
| Total | 9 (50.0%) | 0 (0.0%) |
Employment Occupations by Sex in Panola
Management, Business, Science and Arts Occupations
The most common Management, Business, Science and Arts occupations in Panola are Community & Social Service (3 | 30.0%), Education Instruction & Library (3 | 30.0%), Management (1 | 10.0%), Health Diagnosing & Treating (1 | 10.0%), and Health Technologists (1 | 10.0%).
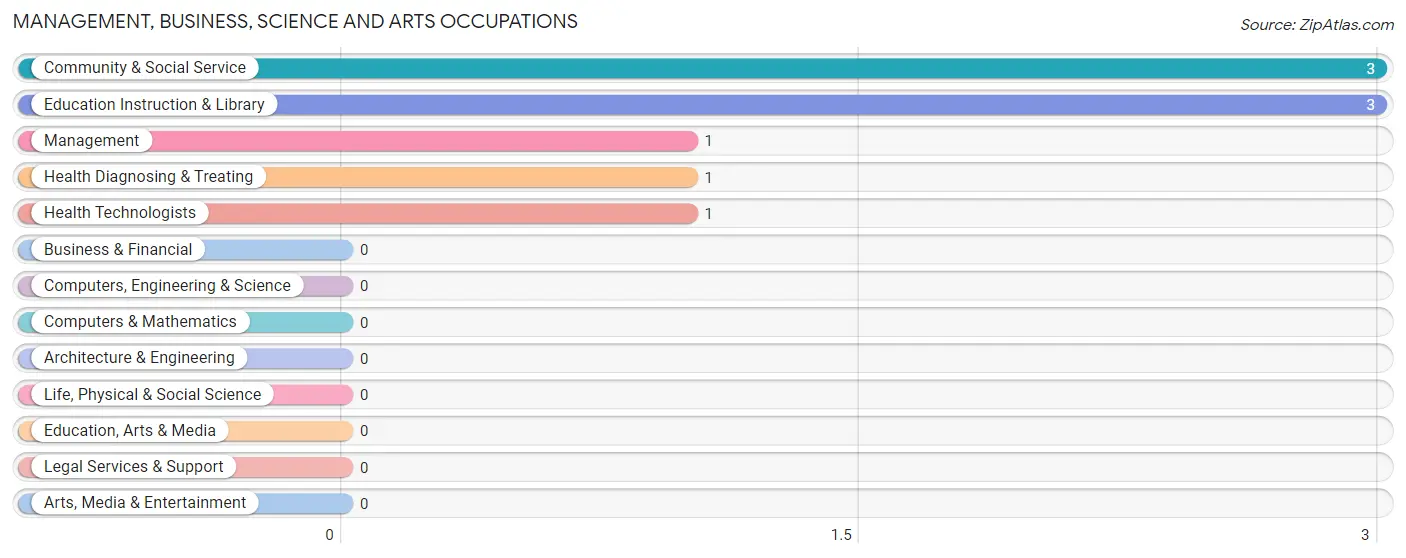
Management, Business, Science and Arts Occupations by Sex
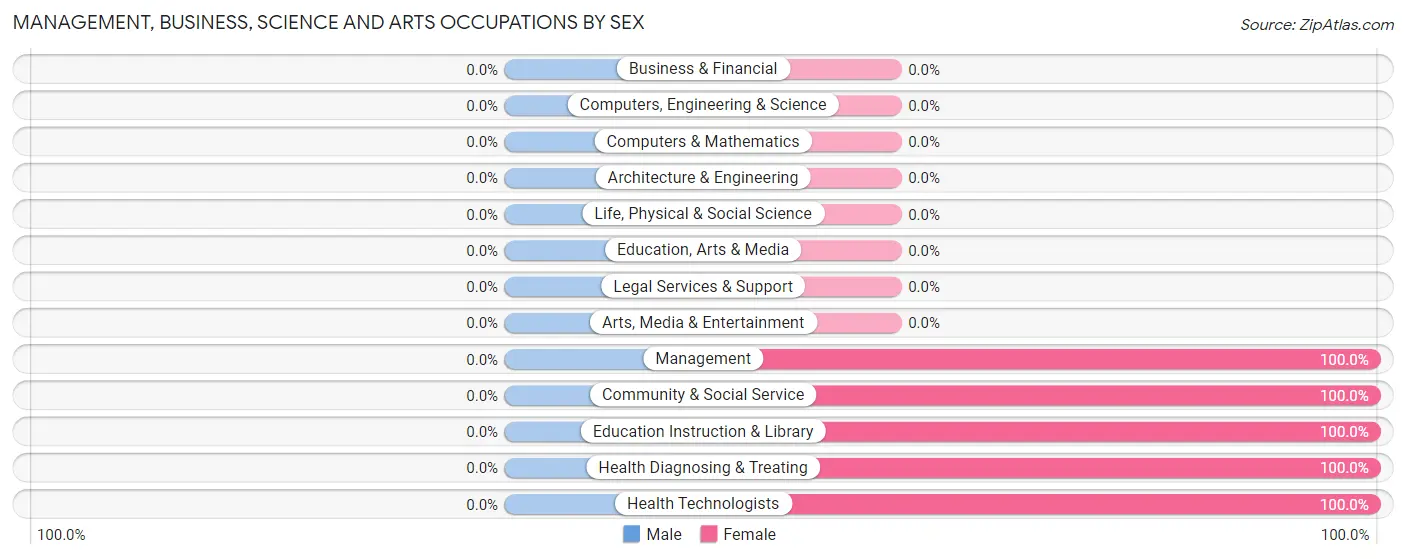
| Occupation | Male | Female |
| Management | 0 (0.0%) | 1 (100.0%) |
| Business & Financial | 0 (0.0%) | 0 (0.0%) |
| Computers, Engineering & Science | 0 (0.0%) | 0 (0.0%) |
| Computers & Mathematics | 0 (0.0%) | 0 (0.0%) |
| Architecture & Engineering | 0 (0.0%) | 0 (0.0%) |
| Life, Physical & Social Science | 0 (0.0%) | 0 (0.0%) |
| Community & Social Service | 0 (0.0%) | 3 (100.0%) |
| Education, Arts & Media | 0 (0.0%) | 0 (0.0%) |
| Legal Services & Support | 0 (0.0%) | 0 (0.0%) |
| Education Instruction & Library | 0 (0.0%) | 3 (100.0%) |
| Arts, Media & Entertainment | 0 (0.0%) | 0 (0.0%) |
| Health Diagnosing & Treating | 0 (0.0%) | 1 (100.0%) |
| Health Technologists | 0 (0.0%) | 1 (100.0%) |
| Total (Category) | 0 (0.0%) | 5 (100.0%) |
| Total (Overall) | 5 (50.0%) | 5 (50.0%) |
Services Occupations
Services Occupations by Sex
| Occupation | Male | Female |
| Healthcare Support | 0 (0.0%) | 0 (0.0%) |
| Security & Protection | 0 (0.0%) | 0 (0.0%) |
| Firefighting & Prevention | 0 (0.0%) | 0 (0.0%) |
| Law Enforcement | 0 (0.0%) | 0 (0.0%) |
| Food Preparation & Serving | 0 (0.0%) | 0 (0.0%) |
| Cleaning & Maintenance | 0 (0.0%) | 0 (0.0%) |
| Personal Care & Service | 0 (0.0%) | 0 (0.0%) |
| Total (Category) | 0 (0.0%) | 0 (0.0%) |
| Total (Overall) | 5 (50.0%) | 5 (50.0%) |
Sales and Office Occupations

Sales and Office Occupations by Sex
| Occupation | Male | Female |
| Sales & Related | 0 (0.0%) | 0 (0.0%) |
| Office & Administration | 0 (0.0%) | 0 (0.0%) |
| Total (Category) | 0 (0.0%) | 0 (0.0%) |
| Total (Overall) | 5 (50.0%) | 5 (50.0%) |
Natural Resources, Construction and Maintenance Occupations
The most common Natural Resources, Construction and Maintenance occupations in Panola are , and Construction & Extraction (3 | 30.0%).
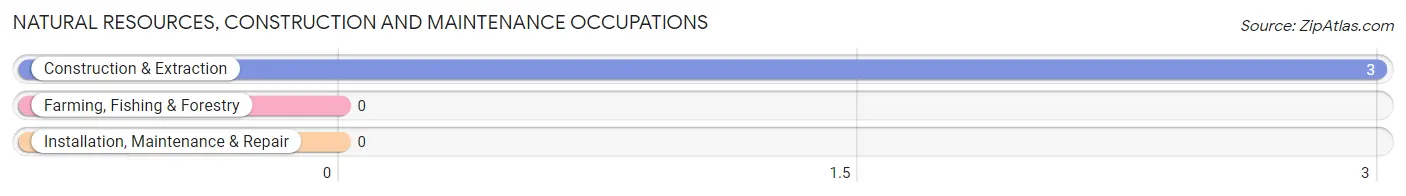
Natural Resources, Construction and Maintenance Occupations by Sex
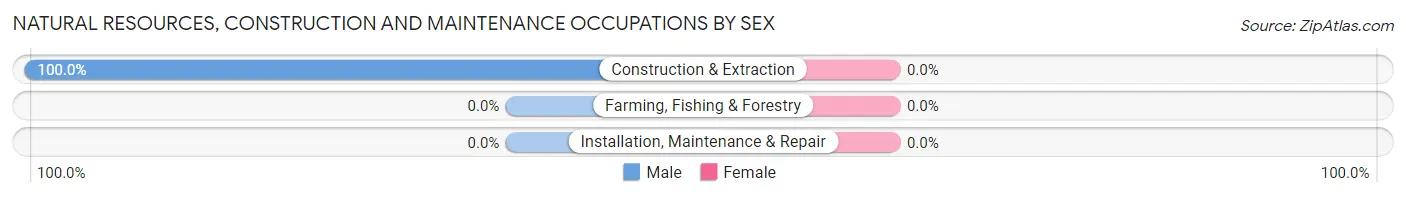
| Occupation | Male | Female |
| Farming, Fishing & Forestry | 0 (0.0%) | 0 (0.0%) |
| Construction & Extraction | 3 (100.0%) | 0 (0.0%) |
| Installation, Maintenance & Repair | 0 (0.0%) | 0 (0.0%) |
| Total (Category) | 3 (100.0%) | 0 (0.0%) |
| Total (Overall) | 5 (50.0%) | 5 (50.0%) |
Production, Transportation and Moving Occupations
The most common Production, Transportation and Moving occupations in Panola are , and Transportation (2 | 20.0%).
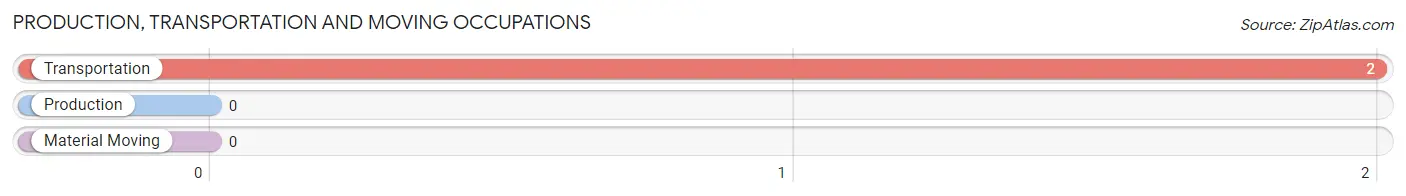
Production, Transportation and Moving Occupations by Sex
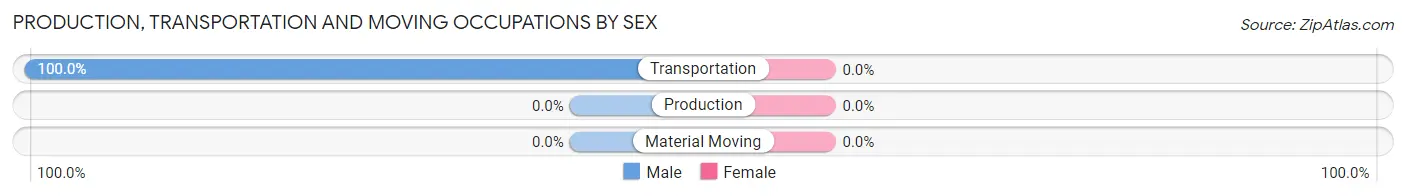
| Occupation | Male | Female |
| Production | 0 (0.0%) | 0 (0.0%) |
| Transportation | 2 (100.0%) | 0 (0.0%) |
| Material Moving | 0 (0.0%) | 0 (0.0%) |
| Total (Category) | 2 (100.0%) | 0 (0.0%) |
| Total (Overall) | 5 (50.0%) | 5 (50.0%) |
Employment Industries by Sex in Panola
Employment Industries in Panola
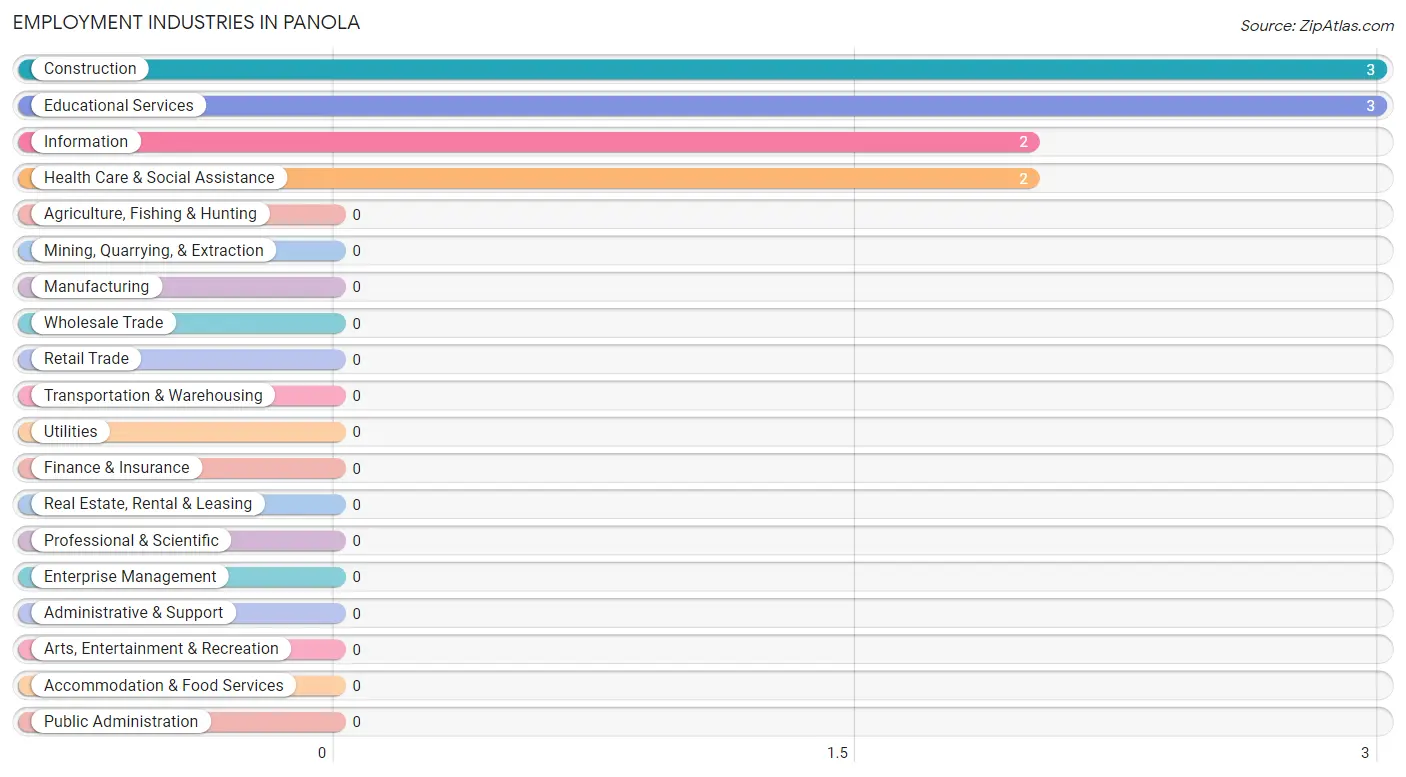
The major employment industries in Panola include Construction (3 | 30.0%), Educational Services (3 | 30.0%), Information (2 | 20.0%), and Health Care & Social Assistance (2 | 20.0%).
Employment Industries by Sex in Panola
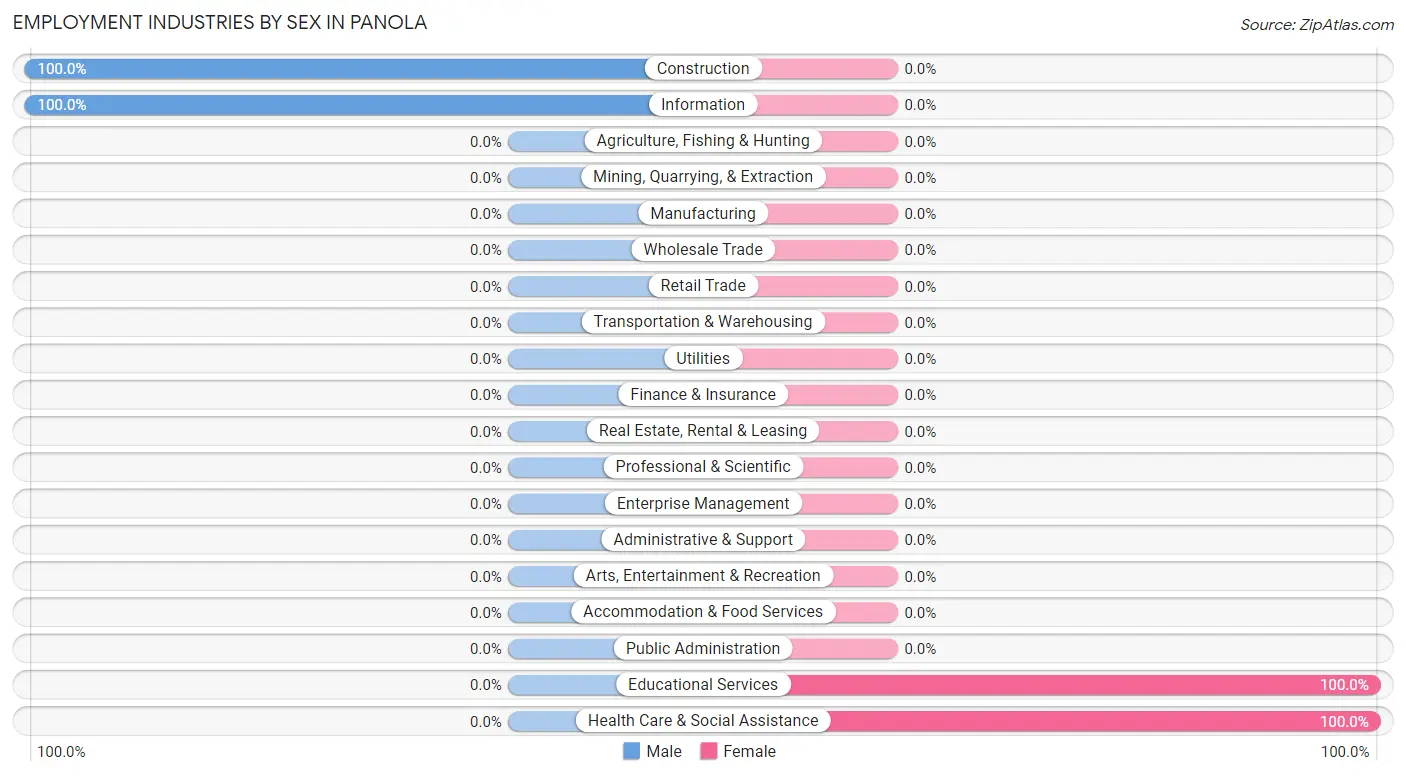
The Panola industries that see more men than women are Construction (100.0%), and Information (100.0%), whereas the industries that tend to have a higher number of women are Educational Services (100.0%), and Health Care & Social Assistance (100.0%).
| Industry | Male | Female |
| Agriculture, Fishing & Hunting | 0 (0.0%) | 0 (0.0%) |
| Mining, Quarrying, & Extraction | 0 (0.0%) | 0 (0.0%) |
| Construction | 3 (100.0%) | 0 (0.0%) |
| Manufacturing | 0 (0.0%) | 0 (0.0%) |
| Wholesale Trade | 0 (0.0%) | 0 (0.0%) |
| Retail Trade | 0 (0.0%) | 0 (0.0%) |
| Transportation & Warehousing | 0 (0.0%) | 0 (0.0%) |
| Utilities | 0 (0.0%) | 0 (0.0%) |
| Information | 2 (100.0%) | 0 (0.0%) |
| Finance & Insurance | 0 (0.0%) | 0 (0.0%) |
| Real Estate, Rental & Leasing | 0 (0.0%) | 0 (0.0%) |
| Professional & Scientific | 0 (0.0%) | 0 (0.0%) |
| Enterprise Management | 0 (0.0%) | 0 (0.0%) |
| Administrative & Support | 0 (0.0%) | 0 (0.0%) |
| Educational Services | 0 (0.0%) | 3 (100.0%) |
| Health Care & Social Assistance | 0 (0.0%) | 2 (100.0%) |
| Arts, Entertainment & Recreation | 0 (0.0%) | 0 (0.0%) |
| Accommodation & Food Services | 0 (0.0%) | 0 (0.0%) |
| Public Administration | 0 (0.0%) | 0 (0.0%) |
| Total | 5 (50.0%) | 5 (50.0%) |
Education in Panola
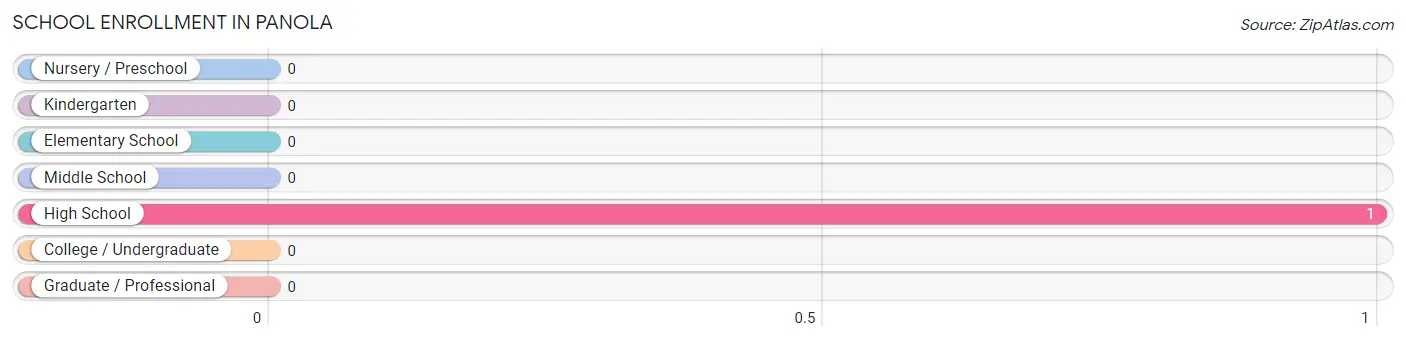
School Enrollment in Panola
| School Level | # Students | % Students |
| Nursery / Preschool | 0 | 0.0% |
| Kindergarten | 0 | 0.0% |
| Elementary School | 0 | 0.0% |
| Middle School | 0 | 0.0% |
| High School | 1 | 100.0% |
| College / Undergraduate | 0 | 0.0% |
| Graduate / Professional | 0 | 0.0% |
| Total | 1 | 100.0% |
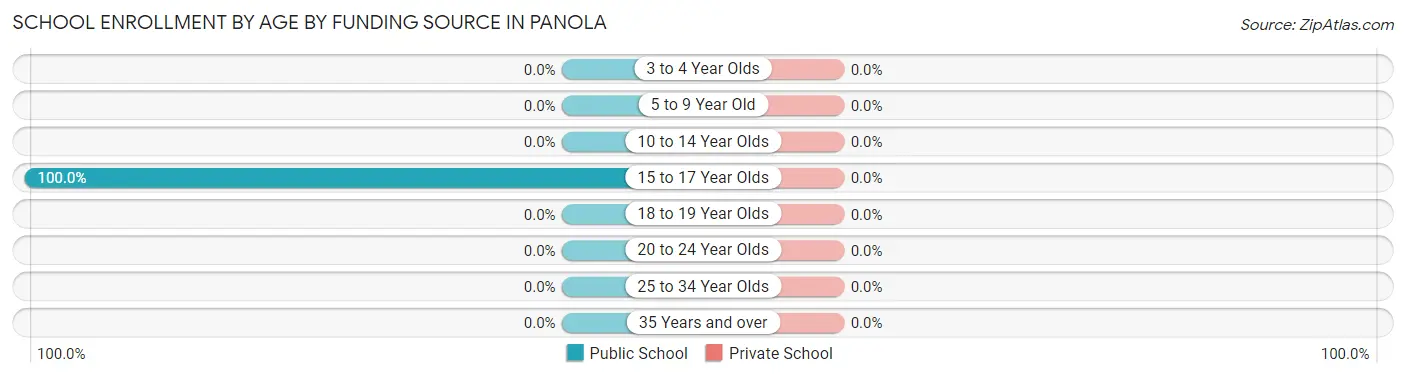
School Enrollment by Age by Funding Source in Panola
| Age Bracket | Public School | Private School |
| 3 to 4 Year Olds | 0 (0.0%) | 0 (0.0%) |
| 5 to 9 Year Old | 0 (0.0%) | 0 (0.0%) |
| 10 to 14 Year Olds | 0 (0.0%) | 0 (0.0%) |
| 15 to 17 Year Olds | 1 (100.0%) | 0 (0.0%) |
| 18 to 19 Year Olds | 0 (0.0%) | 0 (0.0%) |
| 20 to 24 Year Olds | 0 (0.0%) | 0 (0.0%) |
| 25 to 34 Year Olds | 0 (0.0%) | 0 (0.0%) |
| 35 Years and over | 0 (0.0%) | 0 (0.0%) |
| Total | 1 (100.0%) | 0 (0.0%) |
Educational Attainment by Field of Study in Panola
Education (6 | 66.7%), bio, nature & agricultural (2 | 22.2%), and engineering (1 | 11.1%) are the most common fields of study among 9 individuals in Panola who have obtained a bachelor's degree or higher.
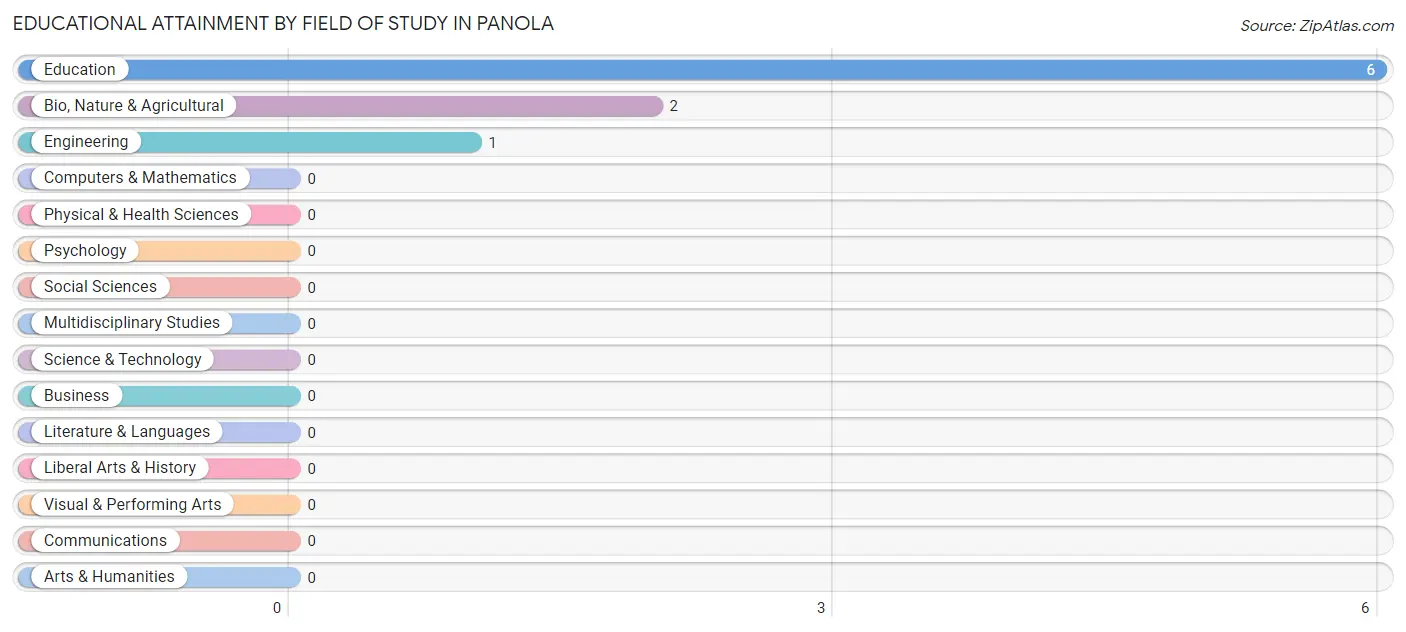
| Field of Study | # Graduates | % Graduates |
| Computers & Mathematics | 0 | 0.0% |
| Bio, Nature & Agricultural | 2 | 22.2% |
| Physical & Health Sciences | 0 | 0.0% |
| Psychology | 0 | 0.0% |
| Social Sciences | 0 | 0.0% |
| Engineering | 1 | 11.1% |
| Multidisciplinary Studies | 0 | 0.0% |
| Science & Technology | 0 | 0.0% |
| Business | 0 | 0.0% |
| Education | 6 | 66.7% |
| Literature & Languages | 0 | 0.0% |
| Liberal Arts & History | 0 | 0.0% |
| Visual & Performing Arts | 0 | 0.0% |
| Communications | 0 | 0.0% |
| Arts & Humanities | 0 | 0.0% |
| Total | 9 | 100.0% |
Transportation & Commute in Panola
Vehicle Availability by Sex in Panola
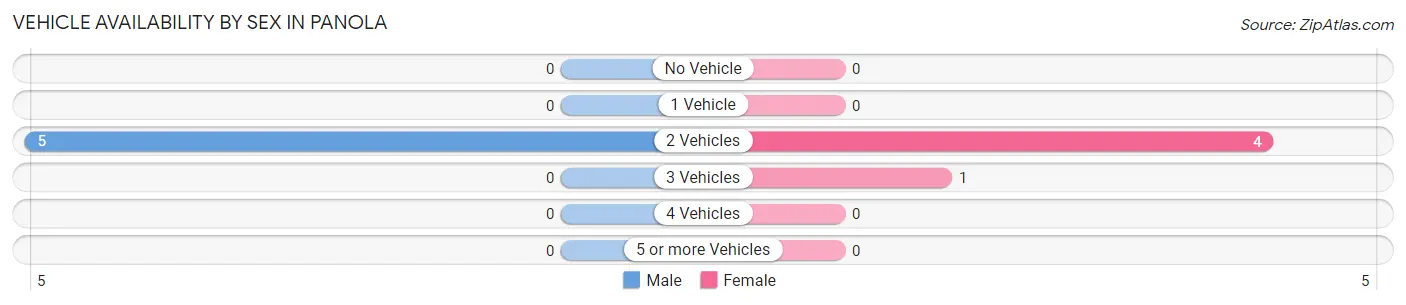
The most prevalent vehicle ownership categories in Panola are males with 2 vehicles (5, accounting for 100.0%) and females with 2 vehicles (4, making up 100.0%).
| Vehicles Available | Male | Female |
| No Vehicle | 0 (0.0%) | 0 (0.0%) |
| 1 Vehicle | 0 (0.0%) | 0 (0.0%) |
| 2 Vehicles | 5 (100.0%) | 4 (80.0%) |
| 3 Vehicles | 0 (0.0%) | 1 (20.0%) |
| 4 Vehicles | 0 (0.0%) | 0 (0.0%) |
| 5 or more Vehicles | 0 (0.0%) | 0 (0.0%) |
| Total | 5 (100.0%) | 5 (100.0%) |
Commute Time in Panola
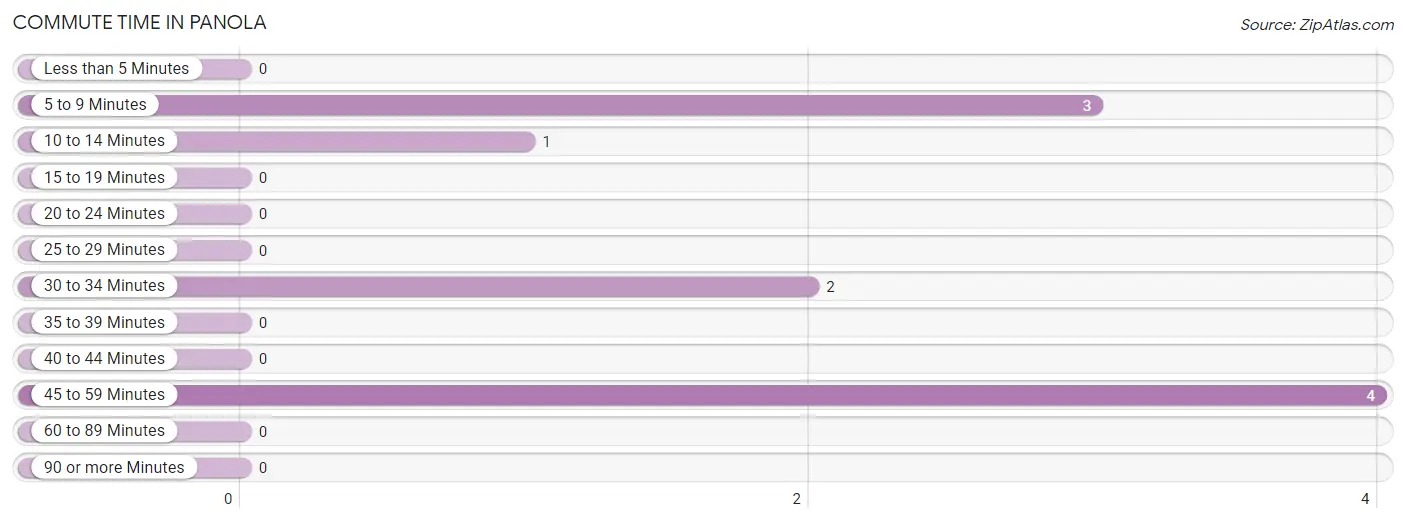
The most frequently occuring commute durations in Panola are 45 to 59 minutes (4 commuters, 40.0%), 5 to 9 minutes (3 commuters, 30.0%), and 30 to 34 minutes (2 commuters, 20.0%).
| Commute Time | # Commuters | % Commuters |
| Less than 5 Minutes | 0 | 0.0% |
| 5 to 9 Minutes | 3 | 30.0% |
| 10 to 14 Minutes | 1 | 10.0% |
| 15 to 19 Minutes | 0 | 0.0% |
| 20 to 24 Minutes | 0 | 0.0% |
| 25 to 29 Minutes | 0 | 0.0% |
| 30 to 34 Minutes | 2 | 20.0% |
| 35 to 39 Minutes | 0 | 0.0% |
| 40 to 44 Minutes | 0 | 0.0% |
| 45 to 59 Minutes | 4 | 40.0% |
| 60 to 89 Minutes | 0 | 0.0% |
| 90 or more Minutes | 0 | 0.0% |
Commute Time by Sex in Panola
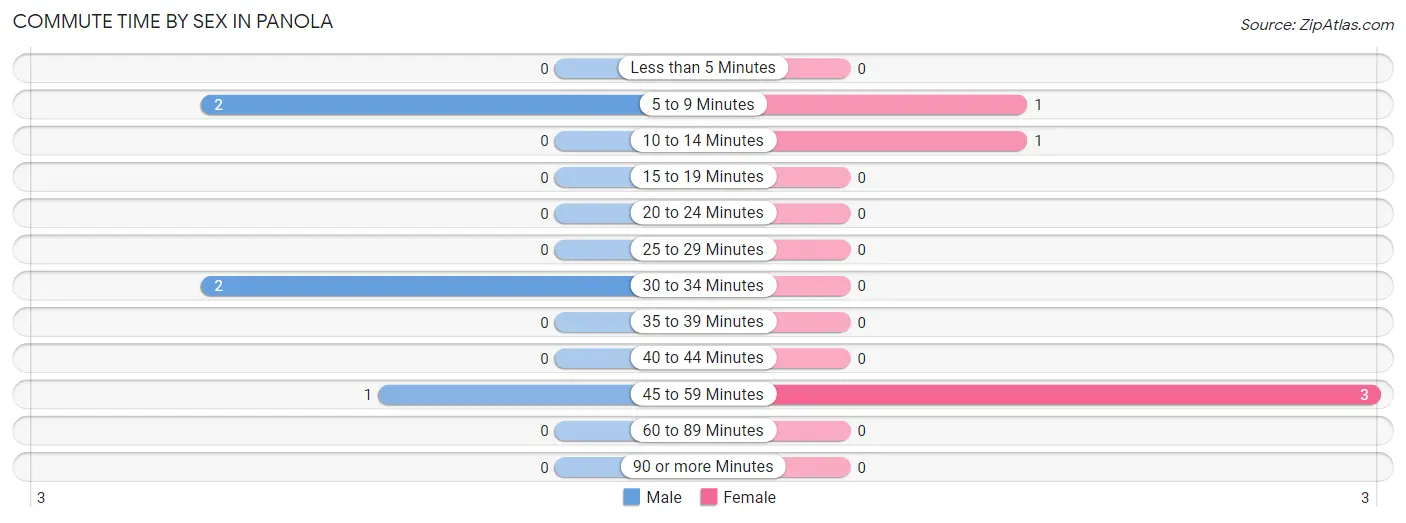
The most common commute times in Panola are 5 to 9 minutes (2 commuters, 40.0%) for males and 45 to 59 minutes (3 commuters, 60.0%) for females.
| Commute Time | Male | Female |
| Less than 5 Minutes | 0 (0.0%) | 0 (0.0%) |
| 5 to 9 Minutes | 2 (40.0%) | 1 (20.0%) |
| 10 to 14 Minutes | 0 (0.0%) | 1 (20.0%) |
| 15 to 19 Minutes | 0 (0.0%) | 0 (0.0%) |
| 20 to 24 Minutes | 0 (0.0%) | 0 (0.0%) |
| 25 to 29 Minutes | 0 (0.0%) | 0 (0.0%) |
| 30 to 34 Minutes | 2 (40.0%) | 0 (0.0%) |
| 35 to 39 Minutes | 0 (0.0%) | 0 (0.0%) |
| 40 to 44 Minutes | 0 (0.0%) | 0 (0.0%) |
| 45 to 59 Minutes | 1 (20.0%) | 3 (60.0%) |
| 60 to 89 Minutes | 0 (0.0%) | 0 (0.0%) |
| 90 or more Minutes | 0 (0.0%) | 0 (0.0%) |
Time of Departure to Work by Sex in Panola
The most frequent times of departure to work in Panola are 6:30 AM to 6:59 AM (2, 40.0%) for males and 7:30 AM to 7:59 AM (3, 60.0%) for females.
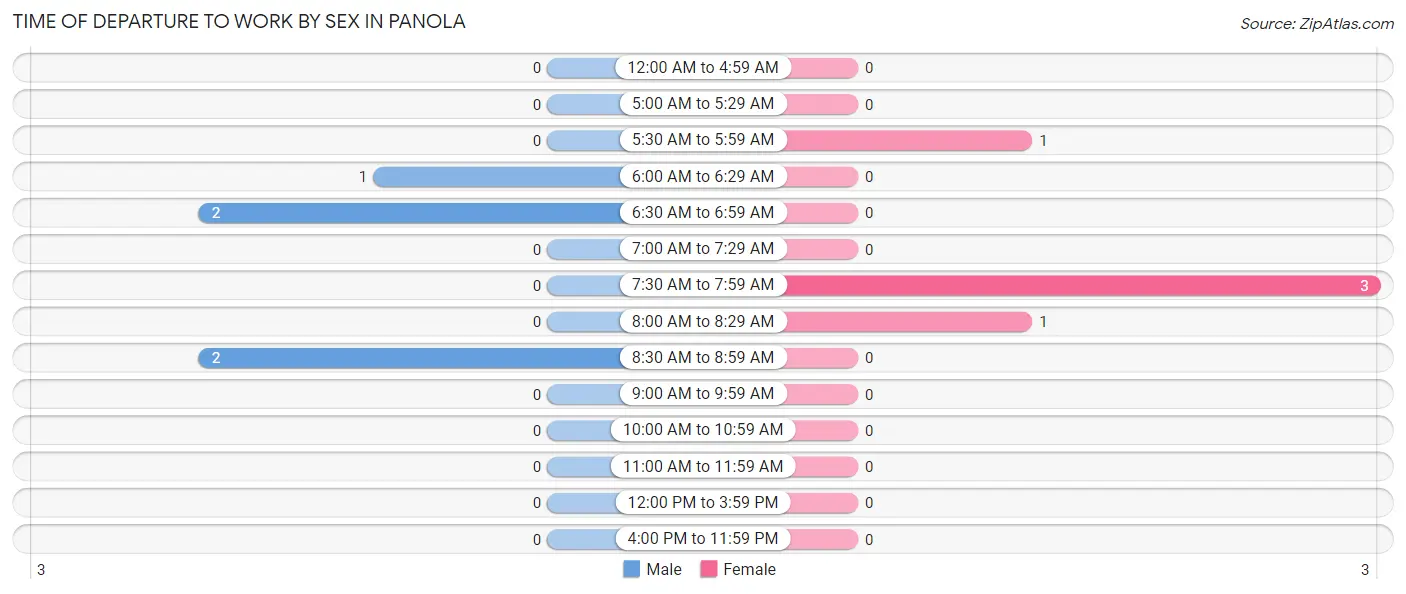
| Time of Departure | Male | Female |
| 12:00 AM to 4:59 AM | 0 (0.0%) | 0 (0.0%) |
| 5:00 AM to 5:29 AM | 0 (0.0%) | 0 (0.0%) |
| 5:30 AM to 5:59 AM | 0 (0.0%) | 1 (20.0%) |
| 6:00 AM to 6:29 AM | 1 (20.0%) | 0 (0.0%) |
| 6:30 AM to 6:59 AM | 2 (40.0%) | 0 (0.0%) |
| 7:00 AM to 7:29 AM | 0 (0.0%) | 0 (0.0%) |
| 7:30 AM to 7:59 AM | 0 (0.0%) | 3 (60.0%) |
| 8:00 AM to 8:29 AM | 0 (0.0%) | 1 (20.0%) |
| 8:30 AM to 8:59 AM | 2 (40.0%) | 0 (0.0%) |
| 9:00 AM to 9:59 AM | 0 (0.0%) | 0 (0.0%) |
| 10:00 AM to 10:59 AM | 0 (0.0%) | 0 (0.0%) |
| 11:00 AM to 11:59 AM | 0 (0.0%) | 0 (0.0%) |
| 12:00 PM to 3:59 PM | 0 (0.0%) | 0 (0.0%) |
| 4:00 PM to 11:59 PM | 0 (0.0%) | 0 (0.0%) |
| Total | 5 (100.0%) | 5 (100.0%) |
Housing Occupancy in Panola
Occupancy by Ownership in Panola
Of the total 15 dwellings in Panola, owner-occupied units account for 15 (100.0%), while renter-occupied units make up 0 (0.0%).
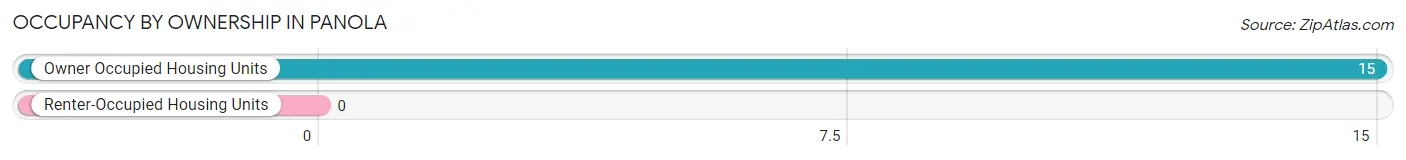
| Occupancy | # Housing Units | % Housing Units |
| Owner Occupied Housing Units | 15 | 100.0% |
| Renter-Occupied Housing Units | 0 | 0.0% |
| Total Occupied Housing Units | 15 | 100.0% |
Occupancy by Household Size in Panola
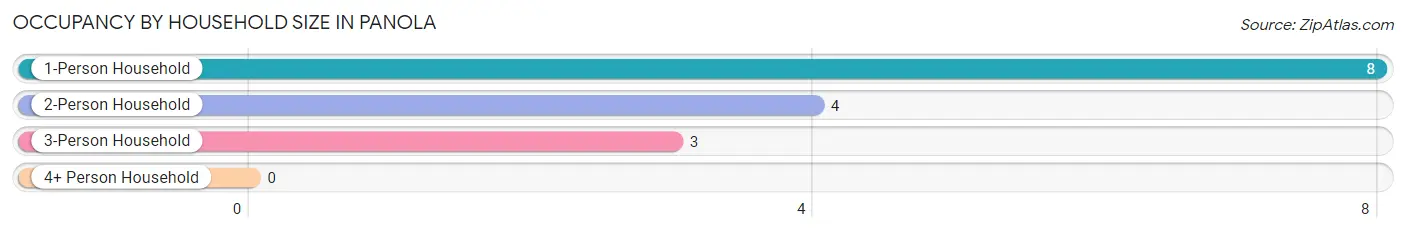
| Household Size | # Housing Units | % Housing Units |
| 1-Person Household | 8 | 53.3% |
| 2-Person Household | 4 | 26.7% |
| 3-Person Household | 3 | 20.0% |
| 4+ Person Household | 0 | 0.0% |
| Total Housing Units | 15 | 100.0% |
Occupancy by Ownership by Household Size in Panola
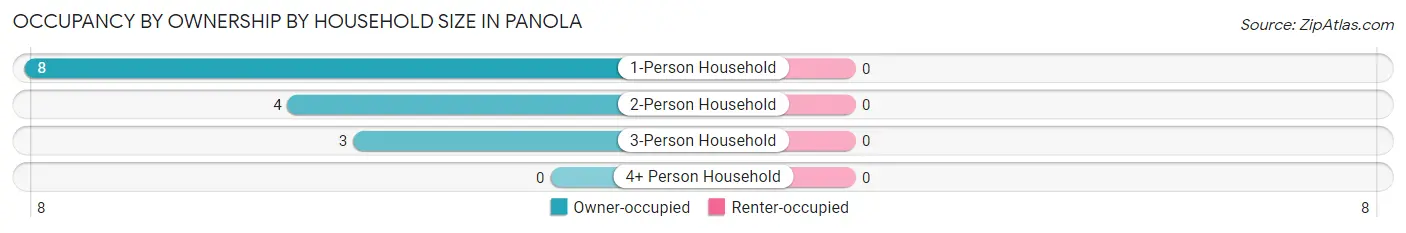
| Household Size | Owner-occupied | Renter-occupied |
| 1-Person Household | 8 (100.0%) | 0 (0.0%) |
| 2-Person Household | 4 (100.0%) | 0 (0.0%) |
| 3-Person Household | 3 (100.0%) | 0 (0.0%) |
| 4+ Person Household | 0 (0.0%) | 0 (0.0%) |
| Total Housing Units | 15 (100.0%) | 0 (0.0%) |
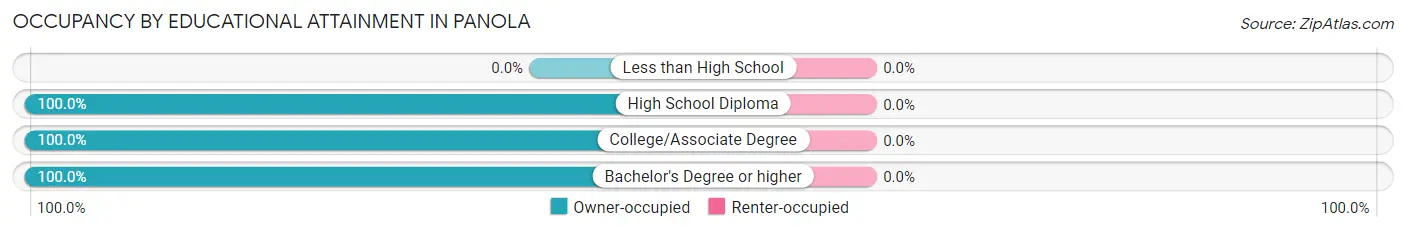
Occupancy by Educational Attainment in Panola
| Household Size | Owner-occupied | Renter-occupied |
| Less than High School | 0 (0.0%) | 0 (0.0%) |
| High School Diploma | 8 (100.0%) | 0 (0.0%) |
| College/Associate Degree | 3 (100.0%) | 0 (0.0%) |
| Bachelor's Degree or higher | 4 (100.0%) | 0 (0.0%) |
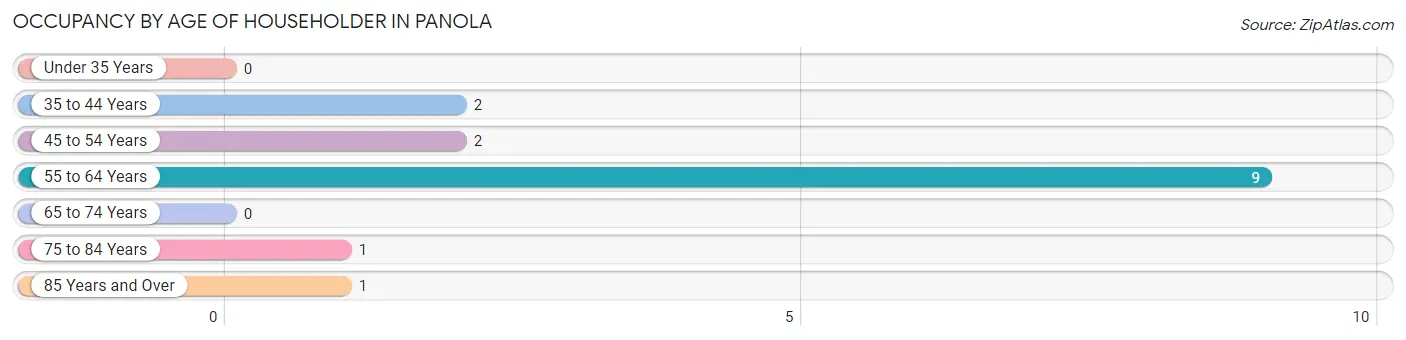
Occupancy by Age of Householder in Panola
| Age Bracket | # Households | % Households |
| Under 35 Years | 0 | 0.0% |
| 35 to 44 Years | 2 | 13.3% |
| 45 to 54 Years | 2 | 13.3% |
| 55 to 64 Years | 9 | 60.0% |
| 65 to 74 Years | 0 | 0.0% |
| 75 to 84 Years | 1 | 6.7% |
| 85 Years and Over | 1 | 6.7% |
| Total | 15 | 100.0% |
Housing Finances in Panola
Median Income by Occupancy in Panola
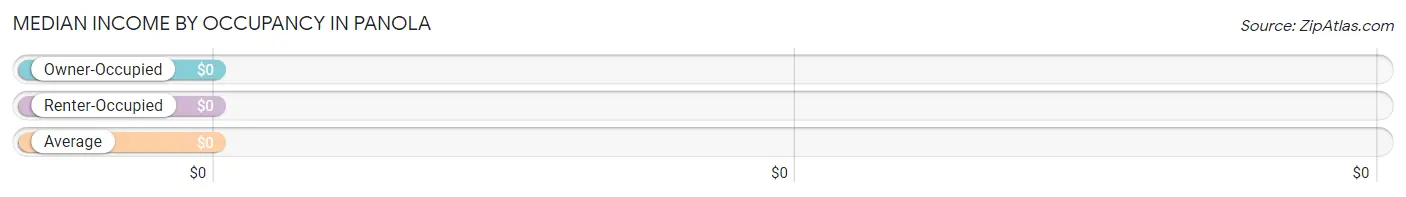
| Occupancy Type | # Households | Median Income |
| Owner-Occupied | 15 (100.0%) | $0 |
| Renter-Occupied | 0 (0.0%) | $0 |
| Average | 15 (100.0%) | $0 |
Occupancy by Householder Income Bracket in Panola
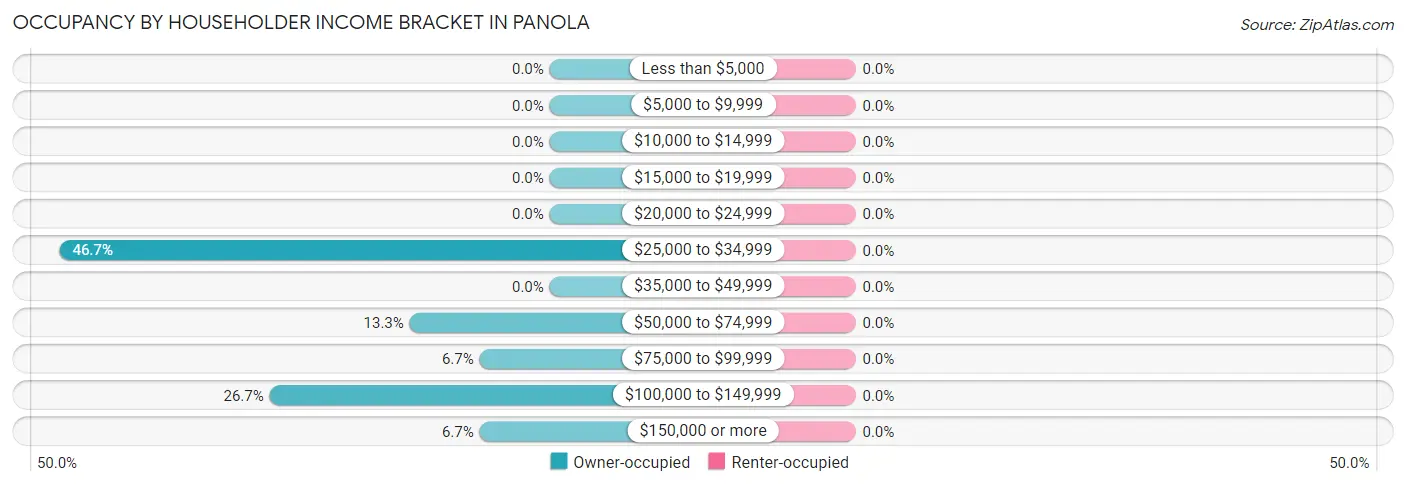
| Income Bracket | Owner-occupied | Renter-occupied |
| Less than $5,000 | 0 (0.0%) | 0 (0.0%) |
| $5,000 to $9,999 | 0 (0.0%) | 0 (0.0%) |
| $10,000 to $14,999 | 0 (0.0%) | 0 (0.0%) |
| $15,000 to $19,999 | 0 (0.0%) | 0 (0.0%) |
| $20,000 to $24,999 | 0 (0.0%) | 0 (0.0%) |
| $25,000 to $34,999 | 7 (46.7%) | 0 (0.0%) |
| $35,000 to $49,999 | 0 (0.0%) | 0 (0.0%) |
| $50,000 to $74,999 | 2 (13.3%) | 0 (0.0%) |
| $75,000 to $99,999 | 1 (6.7%) | 0 (0.0%) |
| $100,000 to $149,999 | 4 (26.7%) | 0 (0.0%) |
| $150,000 or more | 1 (6.7%) | 0 (0.0%) |
| Total | 15 (100.0%) | 0 (0.0%) |
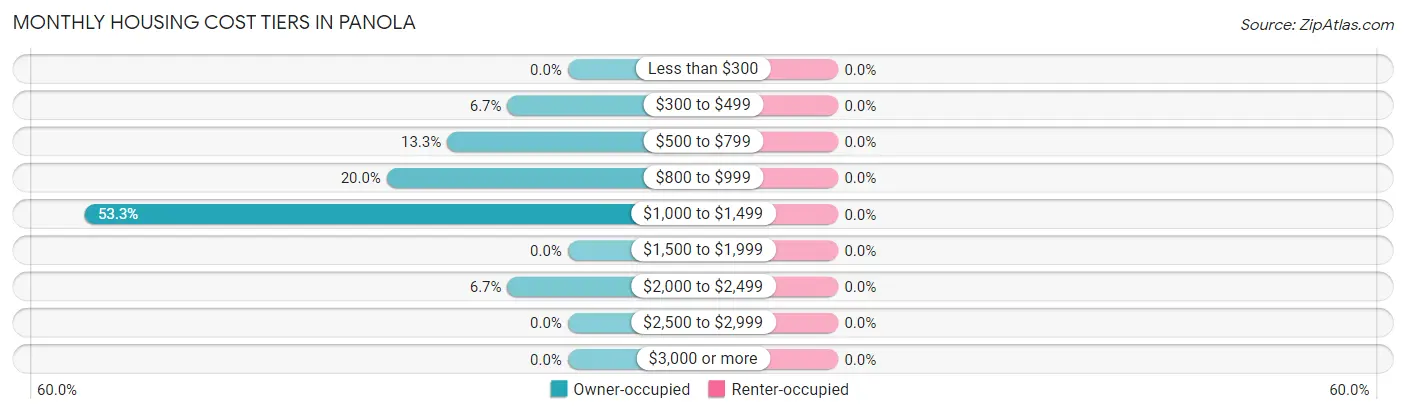
Monthly Housing Cost Tiers in Panola
| Monthly Cost | Owner-occupied | Renter-occupied |
| Less than $300 | 0 (0.0%) | 0 (0.0%) |
| $300 to $499 | 1 (6.7%) | 0 (0.0%) |
| $500 to $799 | 2 (13.3%) | 0 (0.0%) |
| $800 to $999 | 3 (20.0%) | 0 (0.0%) |
| $1,000 to $1,499 | 8 (53.3%) | 0 (0.0%) |
| $1,500 to $1,999 | 0 (0.0%) | 0 (0.0%) |
| $2,000 to $2,499 | 1 (6.7%) | 0 (0.0%) |
| $2,500 to $2,999 | 0 (0.0%) | 0 (0.0%) |
| $3,000 or more | 0 (0.0%) | 0 (0.0%) |
| Total | 15 (100.0%) | 0 (0.0%) |
Physical Housing Characteristics in Panola
Housing Structures in Panola
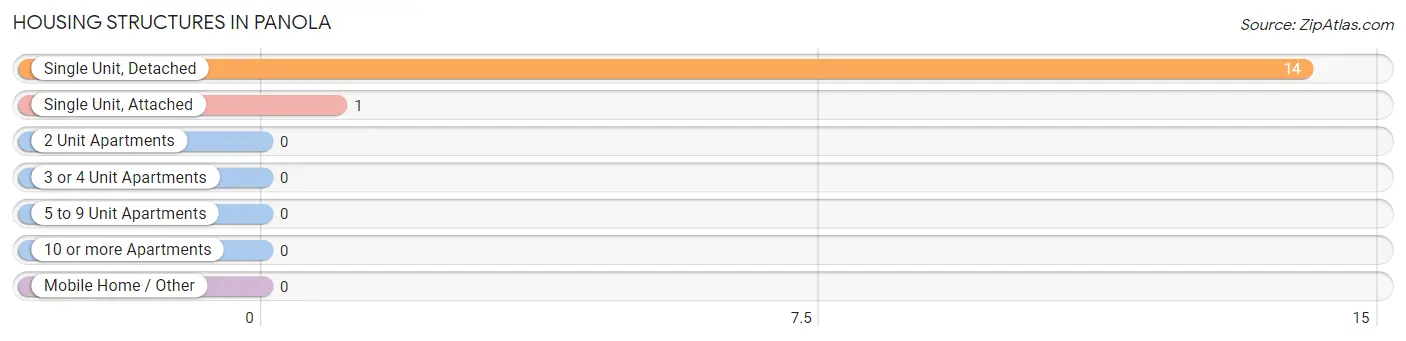
| Structure Type | # Housing Units | % Housing Units |
| Single Unit, Detached | 14 | 93.3% |
| Single Unit, Attached | 1 | 6.7% |
| 2 Unit Apartments | 0 | 0.0% |
| 3 or 4 Unit Apartments | 0 | 0.0% |
| 5 to 9 Unit Apartments | 0 | 0.0% |
| 10 or more Apartments | 0 | 0.0% |
| Mobile Home / Other | 0 | 0.0% |
| Total | 15 | 100.0% |
Housing Structures by Occupancy in Panola
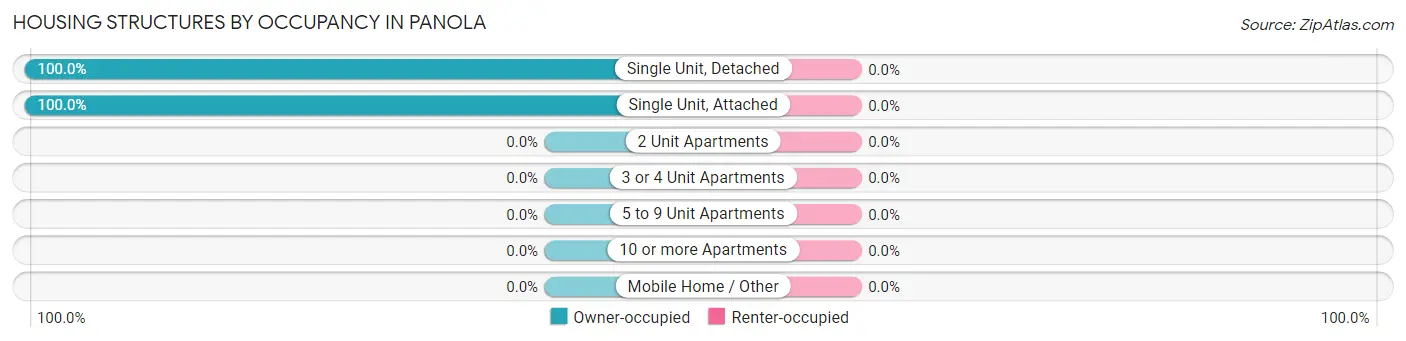
| Structure Type | Owner-occupied | Renter-occupied |
| Single Unit, Detached | 14 (100.0%) | 0 (0.0%) |
| Single Unit, Attached | 1 (100.0%) | 0 (0.0%) |
| 2 Unit Apartments | 0 (0.0%) | 0 (0.0%) |
| 3 or 4 Unit Apartments | 0 (0.0%) | 0 (0.0%) |
| 5 to 9 Unit Apartments | 0 (0.0%) | 0 (0.0%) |
| 10 or more Apartments | 0 (0.0%) | 0 (0.0%) |
| Mobile Home / Other | 0 (0.0%) | 0 (0.0%) |
| Total | 15 (100.0%) | 0 (0.0%) |
Housing Structures by Number of Rooms in Panola
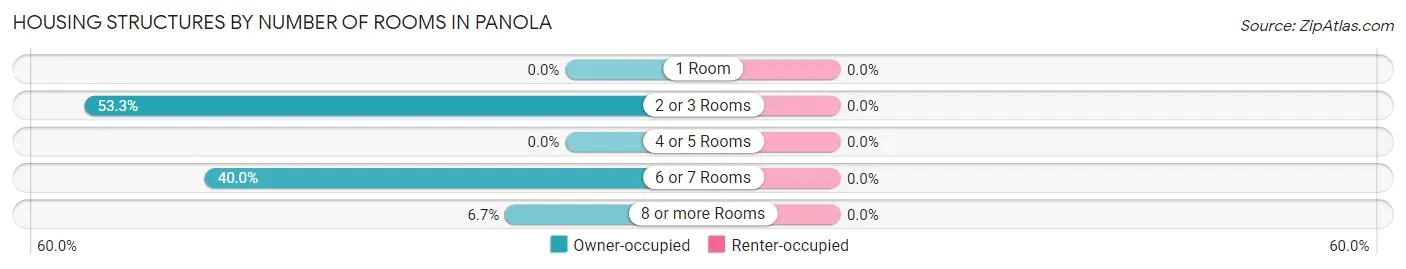
| Number of Rooms | Owner-occupied | Renter-occupied |
| 1 Room | 0 (0.0%) | 0 (0.0%) |
| 2 or 3 Rooms | 8 (53.3%) | 0 (0.0%) |
| 4 or 5 Rooms | 0 (0.0%) | 0 (0.0%) |
| 6 or 7 Rooms | 6 (40.0%) | 0 (0.0%) |
| 8 or more Rooms | 1 (6.7%) | 0 (0.0%) |
| Total | 15 (100.0%) | 0 (0.0%) |
Housing Structure by Heating Type in Panola
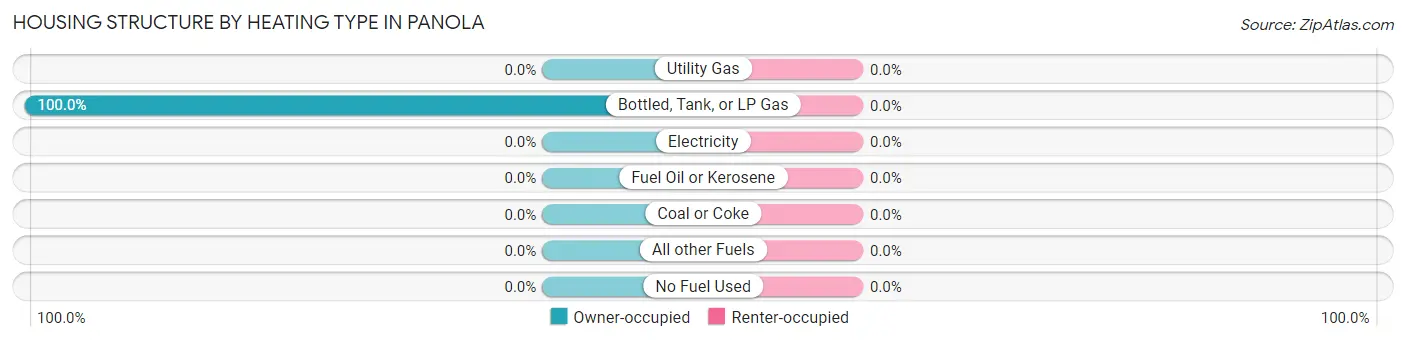
| Heating Type | Owner-occupied | Renter-occupied |
| Utility Gas | 0 (0.0%) | 0 (0.0%) |
| Bottled, Tank, or LP Gas | 15 (100.0%) | 0 (0.0%) |
| Electricity | 0 (0.0%) | 0 (0.0%) |
| Fuel Oil or Kerosene | 0 (0.0%) | 0 (0.0%) |
| Coal or Coke | 0 (0.0%) | 0 (0.0%) |
| All other Fuels | 0 (0.0%) | 0 (0.0%) |
| No Fuel Used | 0 (0.0%) | 0 (0.0%) |
| Total | 15 (100.0%) | 0 (0.0%) |
Household Vehicle Usage in Panola
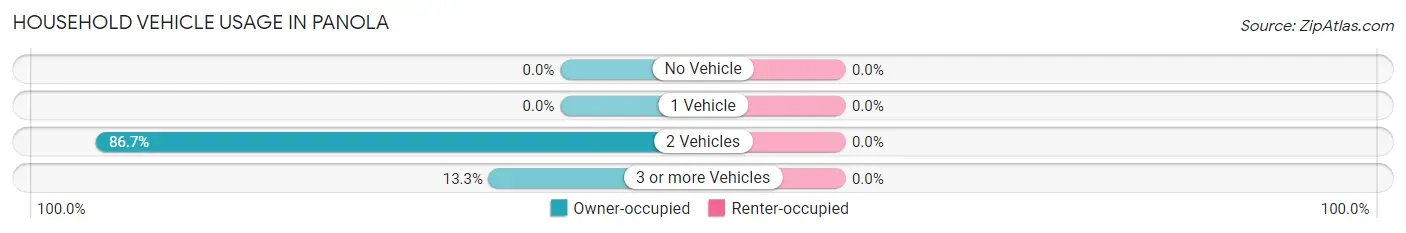
| Vehicles per Household | Owner-occupied | Renter-occupied |
| No Vehicle | 0 (0.0%) | 0 (0.0%) |
| 1 Vehicle | 0 (0.0%) | 0 (0.0%) |
| 2 Vehicles | 13 (86.7%) | 0 (0.0%) |
| 3 or more Vehicles | 2 (13.3%) | 0 (0.0%) |
| Total | 15 (100.0%) | 0 (0.0%) |
Real Estate & Mortgages in Panola
Real Estate and Mortgage Overview in Panola
| Characteristic | Without Mortgage | With Mortgage |
| Housing Units | 4 | 11 |
| Median Property Value | $191,700 | $112,500 |
| Median Household Income | - | - |
| Monthly Housing Costs | $650 | $0 |
| Real Estate Taxes | $1,500 | $0 |
Property Value by Mortgage Status in Panola
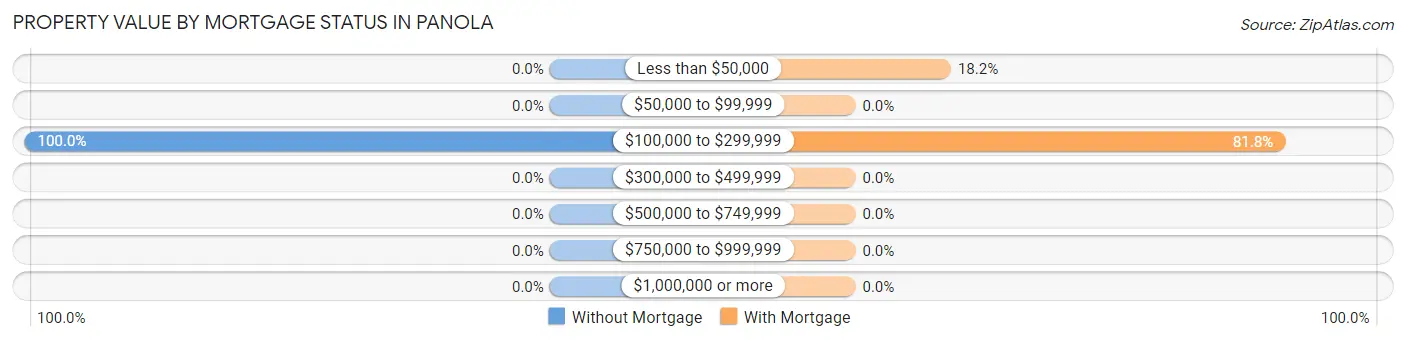
| Property Value | Without Mortgage | With Mortgage |
| Less than $50,000 | 0 (0.0%) | 2 (18.2%) |
| $50,000 to $99,999 | 0 (0.0%) | 0 (0.0%) |
| $100,000 to $299,999 | 4 (100.0%) | 9 (81.8%) |
| $300,000 to $499,999 | 0 (0.0%) | 0 (0.0%) |
| $500,000 to $749,999 | 0 (0.0%) | 0 (0.0%) |
| $750,000 to $999,999 | 0 (0.0%) | 0 (0.0%) |
| $1,000,000 or more | 0 (0.0%) | 0 (0.0%) |
| Total | 4 (100.0%) | 11 (100.0%) |
Household Income by Mortgage Status in Panola
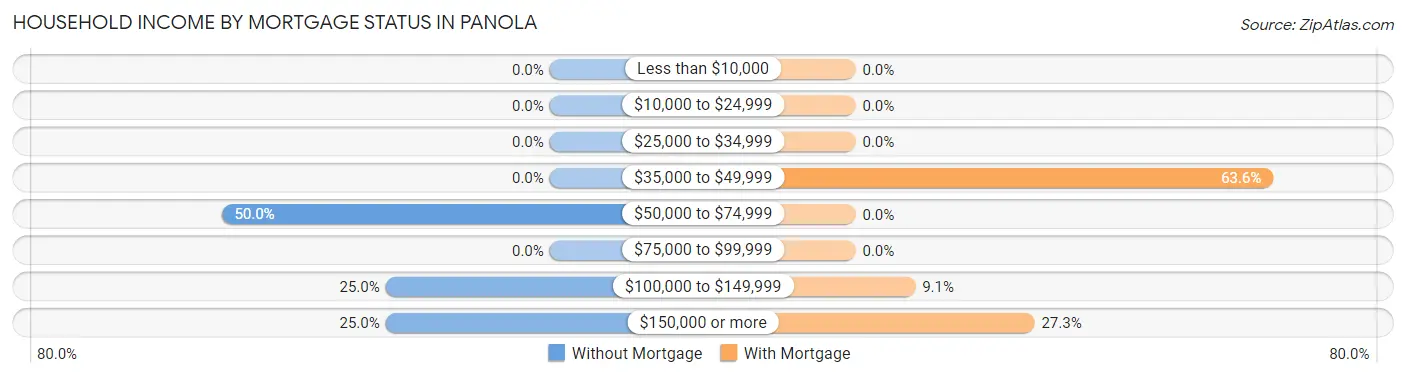
| Household Income | Without Mortgage | With Mortgage |
| Less than $10,000 | 0 (0.0%) | 0 (0.0%) |
| $10,000 to $24,999 | 0 (0.0%) | 0 (0.0%) |
| $25,000 to $34,999 | 0 (0.0%) | 0 (0.0%) |
| $35,000 to $49,999 | 0 (0.0%) | 7 (63.6%) |
| $50,000 to $74,999 | 2 (50.0%) | 0 (0.0%) |
| $75,000 to $99,999 | 0 (0.0%) | 0 (0.0%) |
| $100,000 to $149,999 | 1 (25.0%) | 1 (9.1%) |
| $150,000 or more | 1 (25.0%) | 3 (27.3%) |
| Total | 4 (100.0%) | 11 (100.0%) |
Property Value to Household Income Ratio in Panola
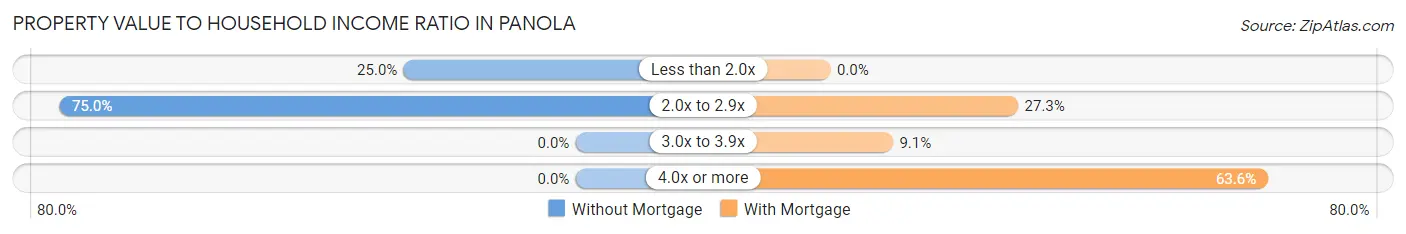
| Value-to-Income Ratio | Without Mortgage | With Mortgage |
| Less than 2.0x | 1 (25.0%) | 0 (0.0%) |
| 2.0x to 2.9x | 3 (75.0%) | 3 (27.3%) |
| 3.0x to 3.9x | 0 (0.0%) | 1 (9.1%) |
| 4.0x or more | 0 (0.0%) | 7 (63.6%) |
| Total | 4 (100.0%) | 11 (100.0%) |
Real Estate Taxes by Mortgage Status in Panola
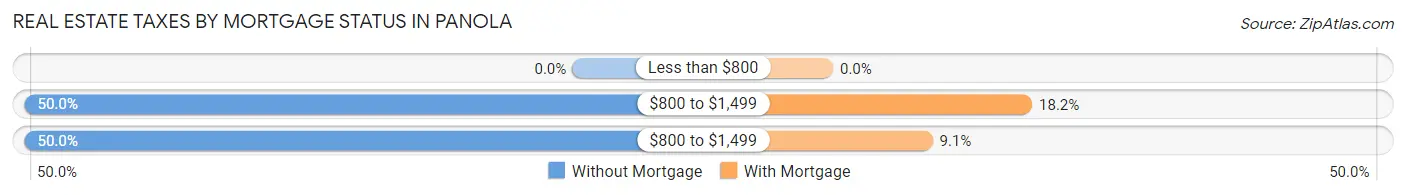
| Property Taxes | Without Mortgage | With Mortgage |
| Less than $800 | 0 (0.0%) | 0 (0.0%) |
| $800 to $1,499 | 2 (50.0%) | 2 (18.2%) |
| $800 to $1,499 | 2 (50.0%) | 1 (9.1%) |
| Total | 4 (100.0%) | 11 (100.0%) |
Health & Disability in Panola
Health Insurance Coverage by Age in Panola
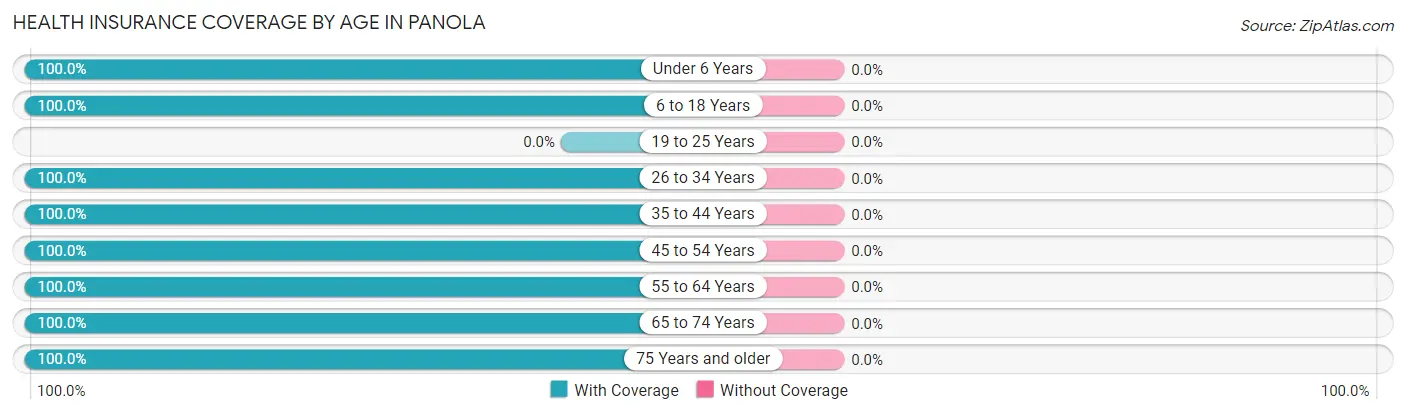
| Age Bracket | With Coverage | Without Coverage |
| Under 6 Years | 1 (100.0%) | 0 (0.0%) |
| 6 to 18 Years | 1 (100.0%) | 0 (0.0%) |
| 19 to 25 Years | 0 (0.0%) | 0 (0.0%) |
| 26 to 34 Years | 3 (100.0%) | 0 (0.0%) |
| 35 to 44 Years | 2 (100.0%) | 0 (0.0%) |
| 45 to 54 Years | 2 (100.0%) | 0 (0.0%) |
| 55 to 64 Years | 11 (100.0%) | 0 (0.0%) |
| 65 to 74 Years | 1 (100.0%) | 0 (0.0%) |
| 75 Years and older | 4 (100.0%) | 0 (0.0%) |
| Total | 25 (100.0%) | 0 (0.0%) |
Health Insurance Coverage by Citizenship Status in Panola
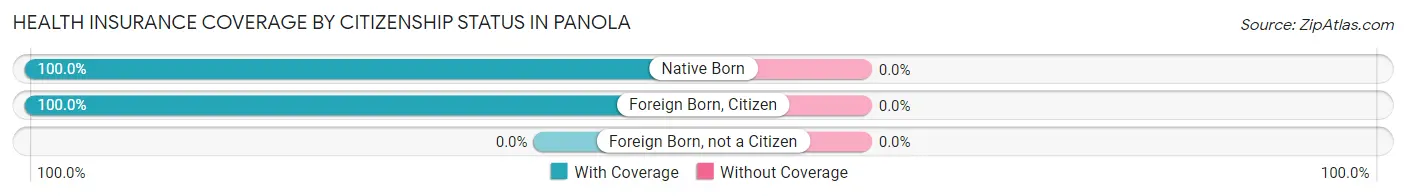
| Citizenship Status | With Coverage | Without Coverage |
| Native Born | 1 (100.0%) | 0 (0.0%) |
| Foreign Born, Citizen | 1 (100.0%) | 0 (0.0%) |
| Foreign Born, not a Citizen | 0 (0.0%) | 0 (0.0%) |
Health Insurance Coverage by Household Income in Panola
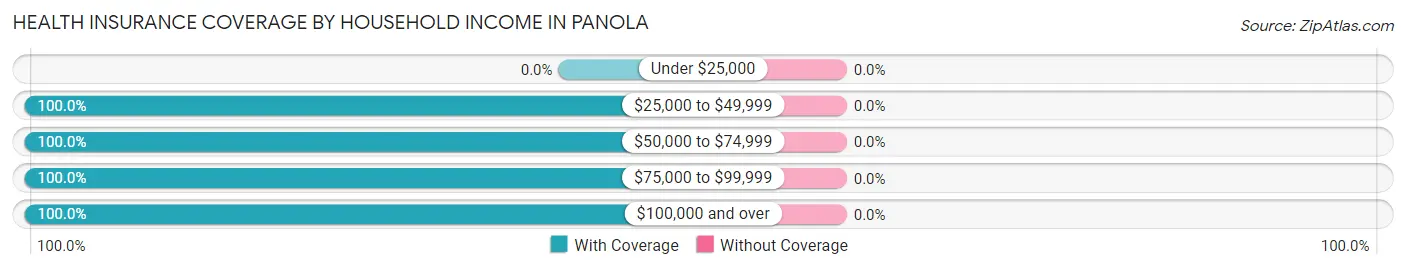
| Household Income | With Coverage | Without Coverage |
| Under $25,000 | 0 (0.0%) | 0 (0.0%) |
| $25,000 to $49,999 | 7 (100.0%) | 0 (0.0%) |
| $50,000 to $74,999 | 6 (100.0%) | 0 (0.0%) |
| $75,000 to $99,999 | 2 (100.0%) | 0 (0.0%) |
| $100,000 and over | 10 (100.0%) | 0 (0.0%) |
Public vs Private Health Insurance Coverage by Age in Panola
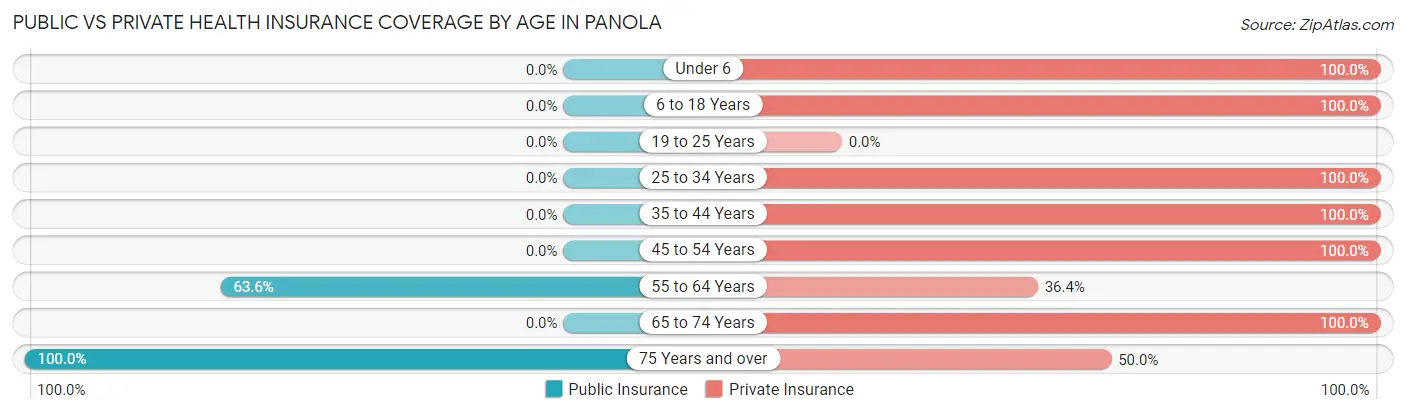
| Age Bracket | Public Insurance | Private Insurance |
| Under 6 | 0 (0.0%) | 1 (100.0%) |
| 6 to 18 Years | 0 (0.0%) | 1 (100.0%) |
| 19 to 25 Years | 0 (0.0%) | 0 (0.0%) |
| 25 to 34 Years | 0 (0.0%) | 3 (100.0%) |
| 35 to 44 Years | 0 (0.0%) | 2 (100.0%) |
| 45 to 54 Years | 0 (0.0%) | 2 (100.0%) |
| 55 to 64 Years | 7 (63.6%) | 4 (36.4%) |
| 65 to 74 Years | 0 (0.0%) | 1 (100.0%) |
| 75 Years and over | 4 (100.0%) | 2 (50.0%) |
| Total | 11 (44.0%) | 16 (64.0%) |
Disability Status by Sex by Age in Panola
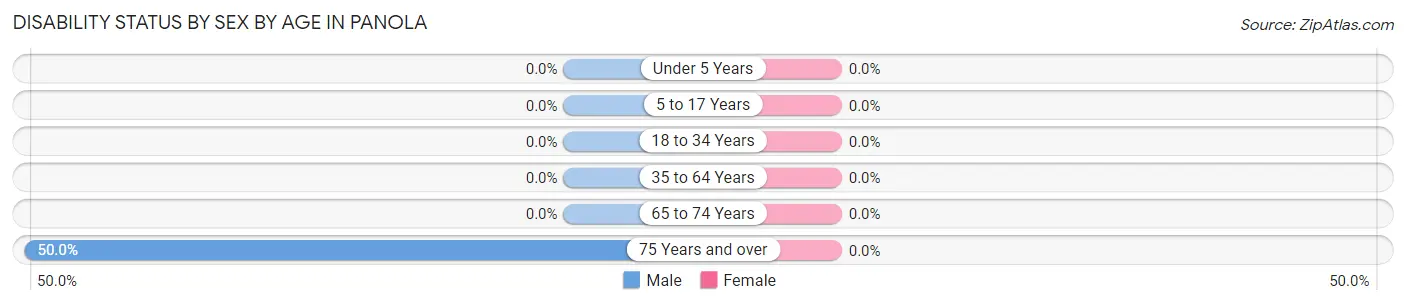
| Age Bracket | Male | Female |
| Under 5 Years | 0 (0.0%) | 0 (0.0%) |
| 5 to 17 Years | 0 (0.0%) | 0 (0.0%) |
| 18 to 34 Years | 0 (0.0%) | 0 (0.0%) |
| 35 to 64 Years | 0 (0.0%) | 0 (0.0%) |
| 65 to 74 Years | 0 (0.0%) | 0 (0.0%) |
| 75 Years and over | 1 (50.0%) | 0 (0.0%) |
Disability Class by Sex by Age in Panola
Disability Class: Hearing Difficulty
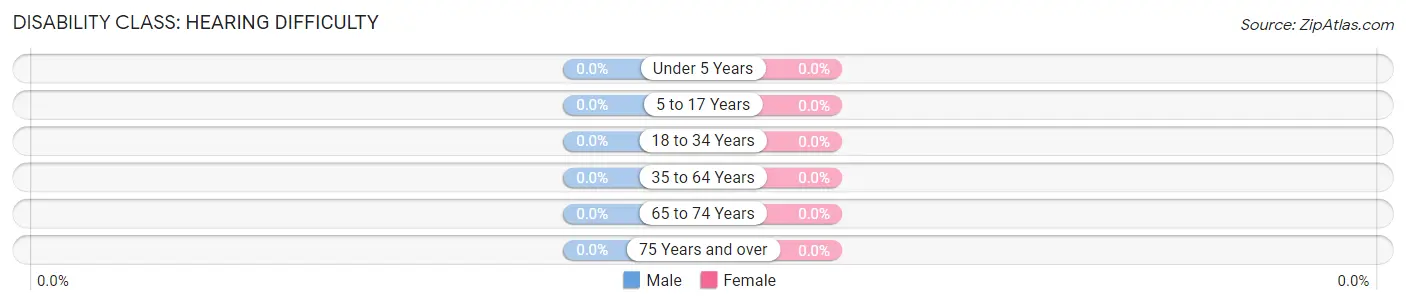
| Age Bracket | Male | Female |
| Under 5 Years | 0 (0.0%) | 0 (0.0%) |
| 5 to 17 Years | 0 (0.0%) | 0 (0.0%) |
| 18 to 34 Years | 0 (0.0%) | 0 (0.0%) |
| 35 to 64 Years | 0 (0.0%) | 0 (0.0%) |
| 65 to 74 Years | 0 (0.0%) | 0 (0.0%) |
| 75 Years and over | 0 (0.0%) | 0 (0.0%) |
Disability Class: Vision Difficulty
| Age Bracket | Male | Female |
| Under 5 Years | 0 (0.0%) | 0 (0.0%) |
| 5 to 17 Years | 0 (0.0%) | 0 (0.0%) |
| 18 to 34 Years | 0 (0.0%) | 0 (0.0%) |
| 35 to 64 Years | 0 (0.0%) | 0 (0.0%) |
| 65 to 74 Years | 0 (0.0%) | 0 (0.0%) |
| 75 Years and over | 0 (0.0%) | 0 (0.0%) |
Disability Class: Cognitive Difficulty
| Age Bracket | Male | Female |
| 5 to 17 Years | 0 (0.0%) | 0 (0.0%) |
| 18 to 34 Years | 0 (0.0%) | 0 (0.0%) |
| 35 to 64 Years | 0 (0.0%) | 0 (0.0%) |
| 65 to 74 Years | 0 (0.0%) | 0 (0.0%) |
| 75 Years and over | 0 (0.0%) | 0 (0.0%) |
Disability Class: Ambulatory Difficulty
| Age Bracket | Male | Female |
| 5 to 17 Years | 0 (0.0%) | 0 (0.0%) |
| 18 to 34 Years | 0 (0.0%) | 0 (0.0%) |
| 35 to 64 Years | 0 (0.0%) | 0 (0.0%) |
| 65 to 74 Years | 0 (0.0%) | 0 (0.0%) |
| 75 Years and over | 1 (50.0%) | 0 (0.0%) |
Disability Class: Self-Care Difficulty
| Age Bracket | Male | Female |
| 5 to 17 Years | 0 (0.0%) | 0 (0.0%) |
| 18 to 34 Years | 0 (0.0%) | 0 (0.0%) |
| 35 to 64 Years | 0 (0.0%) | 0 (0.0%) |
| 65 to 74 Years | 0 (0.0%) | 0 (0.0%) |
| 75 Years and over | 1 (50.0%) | 0 (0.0%) |
Technology Access in Panola
Computing Device Access in Panola
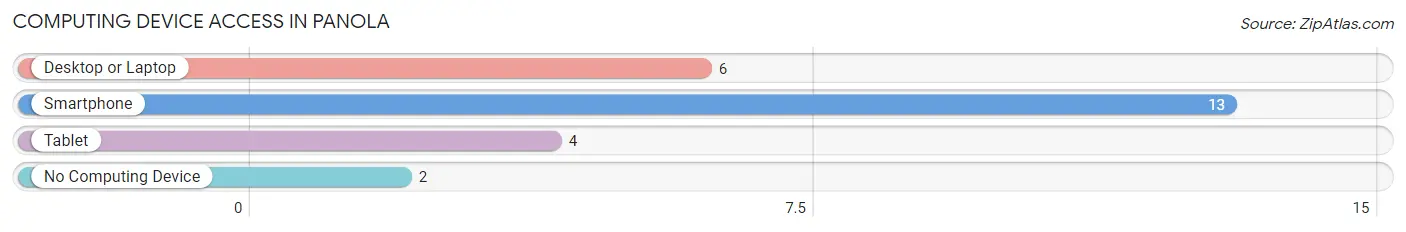
| Device Type | # Households | % Households |
| Desktop or Laptop | 6 | 40.0% |
| Smartphone | 13 | 86.7% |
| Tablet | 4 | 26.7% |
| No Computing Device | 2 | 13.3% |
| Total | 15 | 100.0% |
Internet Access in Panola
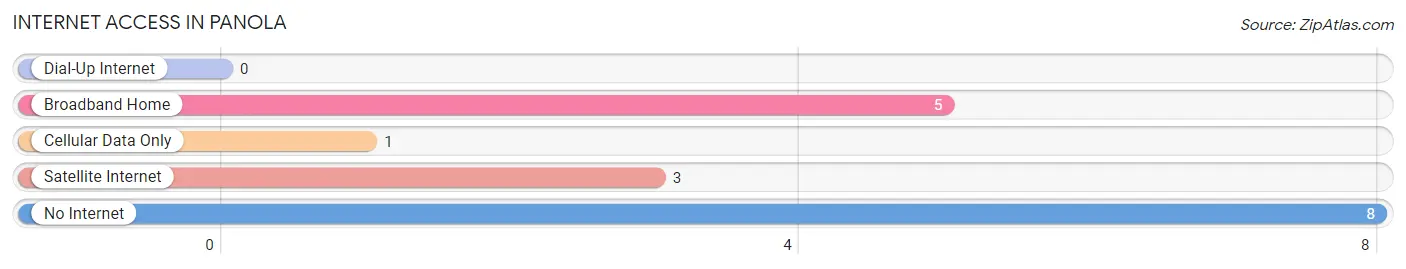
| Internet Type | # Households | % Households |
| Dial-Up Internet | 0 | 0.0% |
| Broadband Home | 5 | 33.3% |
| Cellular Data Only | 1 | 6.7% |
| Satellite Internet | 3 | 20.0% |
| No Internet | 8 | 53.3% |
| Total | 15 | 100.0% |
Panola Summary
Panola, Illinois is a small village located in LaSalle County, Illinois. It is situated on the banks of the Vermilion River, approximately 25 miles southwest of the city of Ottawa. The village has a population of approximately 500 people and is part of the Ottawa-Streator Micropolitan Statistical Area.
History
The area that is now Panola was first settled in the early 1830s by a group of settlers from New York. The village was originally known as “New York Settlement” and was later renamed “Panola” after the Greek word for “all”. The village was officially incorporated in 1867.
In the late 19th century, Panola was a thriving agricultural community. The village was home to several grain elevators, a flour mill, a sawmill, and a brickyard. The village also had a post office, a bank, a hotel, and several stores.
In the early 20th century, the village experienced a period of decline. The Great Depression and the Dust Bowl caused many of the local businesses to close. The population of the village decreased from a peak of 845 in 1910 to just 463 in 1940.
Geography
Panola is located in LaSalle County, Illinois. It is situated on the banks of the Vermilion River, approximately 25 miles southwest of the city of Ottawa. The village has a total area of 0.6 square miles, all of which is land.
The village is located in a rural area and is surrounded by farmland. The nearest major city is Ottawa, which is approximately 25 miles to the northeast.
Economy
The economy of Panola is largely based on agriculture. The village is home to several grain elevators, a flour mill, and a sawmill. The village also has a post office, a bank, a hotel, and several stores.
The village is also home to several small businesses, including a gas station, a restaurant, and a hardware store. The village also has a public library and a community center.
Demographics
As of the 2010 census, the population of Panola was 463. The racial makeup of the village was 97.3% White, 0.2% African American, 0.2% Native American, 0.2% Asian, 0.2% from other races, and 1.9% from two or more races. Hispanic or Latino of any race were 1.3% of the population.
The median household income in Panola was $45,000, and the median family income was $50,000. The per capita income for the village was $20,000. About 8.3% of families and 10.3% of the population were below the poverty line, including 14.3% of those under age 18 and none of those age 65 or over.
Common Questions
What is Per Capita Income in Panola?
Per Capita income in Panola is $45,796.
What is the Median Family Income in Panola?
Median Family Income in Panola is $103,750.
What is Inequality or Gini Index in Panola?
Inequality or Gini Index in Panola is 0.35.
What is the Total Population of Panola?
Total Population of Panola is 25.
What is the Total Male Population of Panola?
Total Male Population of Panola is 16.
What is the Total Female Population of Panola?
Total Female Population of Panola is 9.
What is the Ratio of Males per 100 Females in Panola?
There are 177.78 Males per 100 Females in Panola.
What is the Ratio of Females per 100 Males in Panola?
There are 56.25 Females per 100 Males in Panola.
What is the Median Population Age in Panola?
Median Population Age in Panola is 62.8 Years.
What is the Average Family Size in Panola
Average Family Size in Panola is 2.4 People.
What is the Average Household Size in Panola
Average Household Size in Panola is 1.7 People.
How Large is the Labor Force in Panola?
There are 10 People in the Labor Forcein in Panola.
What is the Percentage of People in the Labor Force in Panola?
43.5% of People are in the Labor Force in Panola.