Russellville, IL Map & Demographics
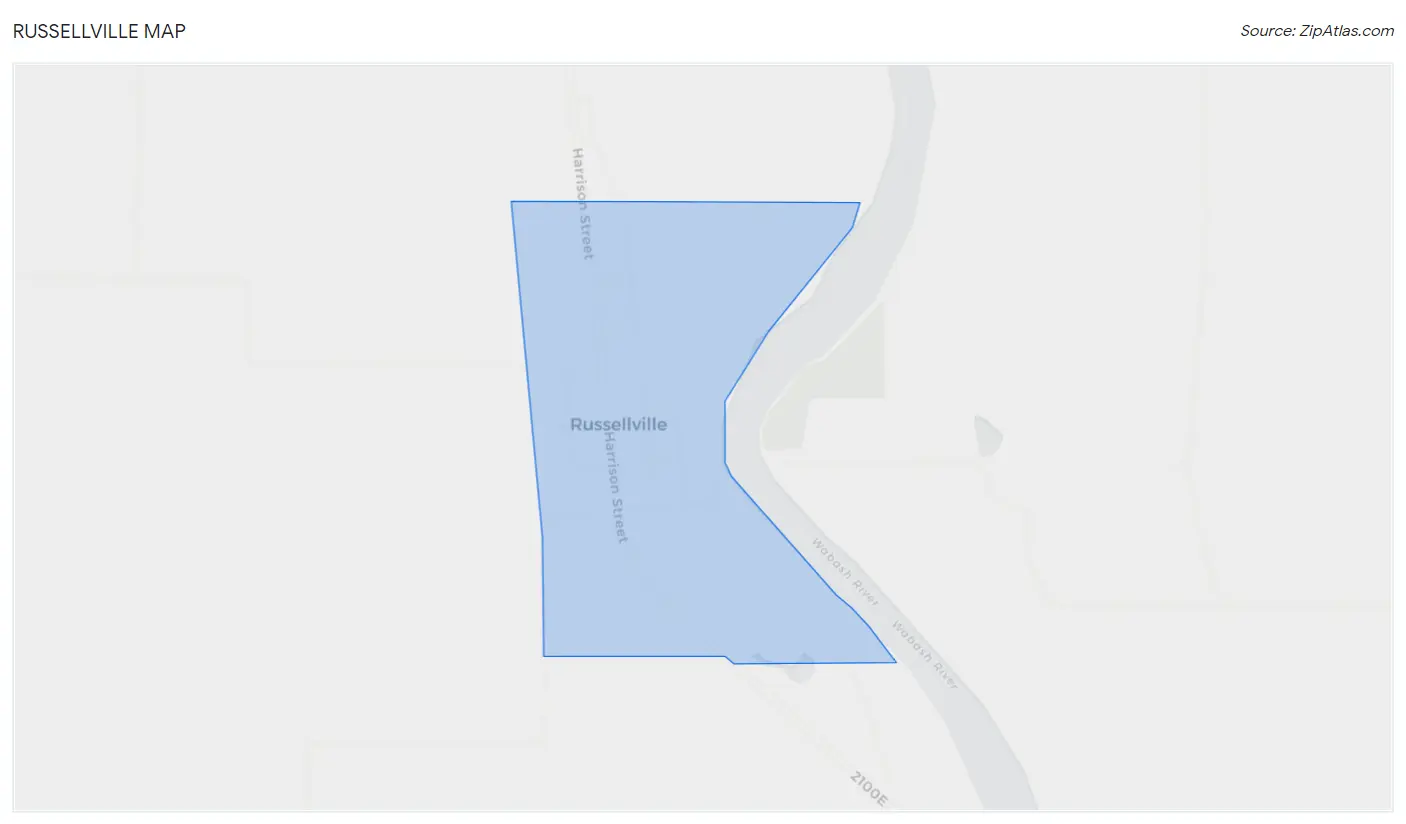
Russellville Map
Russellville Overview
$23,343
PER CAPITA INCOME
$38,929
AVG HOUSEHOLD INCOME
0.36
INEQUALITY / GINI INDEX
74
TOTAL POPULATION
51
MALE POPULATION
23
FEMALE POPULATION
221.74
MALES / 100 FEMALES
45.10
FEMALES / 100 MALES
49.1
MEDIAN AGE
6.4
AVG FAMILY SIZE
2.5
AVG HOUSEHOLD SIZE
42
LABOR FORCE [ PEOPLE ]
60.0%
PERCENT IN LABOR FORCE
2.4%
UNEMPLOYMENT RATE
Income in Russellville
Income Overview in Russellville
| Characteristic | Number | Measure |
| Per Capita Income | 74 | $23,343 |
| Median Family Income | 8 | $0 |
| Mean Family Income | 8 | $61,963 |
| Median Household Income | 30 | $38,929 |
| Mean Household Income | 30 | $40,810 |
| Income Deficit | 8 | $0 |
| Wage / Income Gap (%) | 74 | 0.00% |
| Wage / Income Gap ($) | 74 | 100.00¢ per $1 |
| Gini / Inequality Index | 74 | 0.36 |
Earnings by Sex in Russellville
| Sex | Number | Average Earnings |
| Male | 38 (90.5%) | $0 |
| Female | 4 (9.5%) | $0 |
| Total | 42 (100.0%) | $0 |
Earnings by Sex by Income Bracket in Russellville
The most common earnings brackets in Russellville are $7,500 to $9,999 for men (18 | 47.4%) and $50,000 to $54,999 for women (2 | 50.0%).
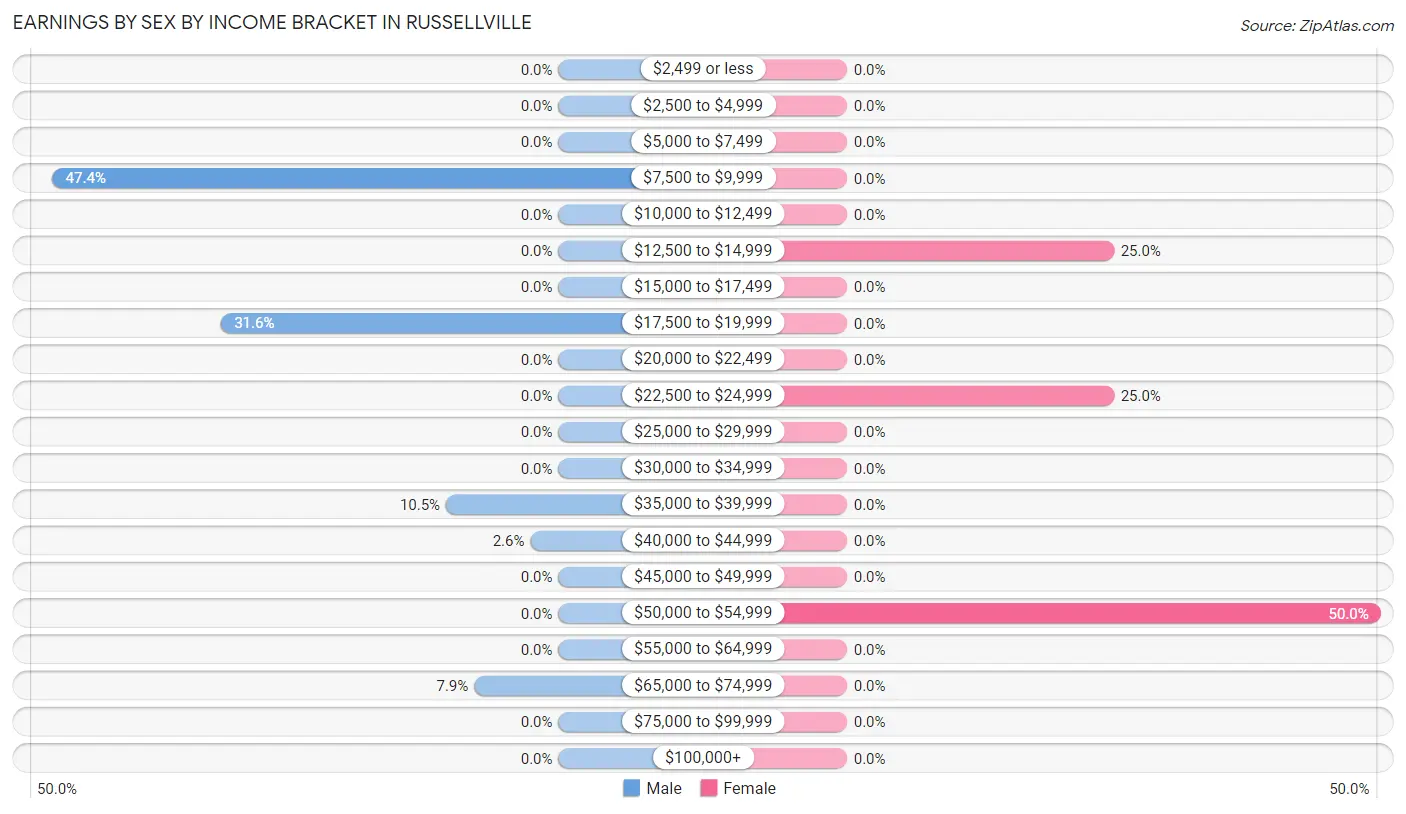
| Income | Male | Female |
| $2,499 or less | 0 (0.0%) | 0 (0.0%) |
| $2,500 to $4,999 | 0 (0.0%) | 0 (0.0%) |
| $5,000 to $7,499 | 0 (0.0%) | 0 (0.0%) |
| $7,500 to $9,999 | 18 (47.4%) | 0 (0.0%) |
| $10,000 to $12,499 | 0 (0.0%) | 0 (0.0%) |
| $12,500 to $14,999 | 0 (0.0%) | 1 (25.0%) |
| $15,000 to $17,499 | 0 (0.0%) | 0 (0.0%) |
| $17,500 to $19,999 | 12 (31.6%) | 0 (0.0%) |
| $20,000 to $22,499 | 0 (0.0%) | 0 (0.0%) |
| $22,500 to $24,999 | 0 (0.0%) | 1 (25.0%) |
| $25,000 to $29,999 | 0 (0.0%) | 0 (0.0%) |
| $30,000 to $34,999 | 0 (0.0%) | 0 (0.0%) |
| $35,000 to $39,999 | 4 (10.5%) | 0 (0.0%) |
| $40,000 to $44,999 | 1 (2.6%) | 0 (0.0%) |
| $45,000 to $49,999 | 0 (0.0%) | 0 (0.0%) |
| $50,000 to $54,999 | 0 (0.0%) | 2 (50.0%) |
| $55,000 to $64,999 | 0 (0.0%) | 0 (0.0%) |
| $65,000 to $74,999 | 3 (7.9%) | 0 (0.0%) |
| $75,000 to $99,999 | 0 (0.0%) | 0 (0.0%) |
| $100,000+ | 0 (0.0%) | 0 (0.0%) |
| Total | 38 (100.0%) | 4 (100.0%) |
Earnings by Sex by Educational Attainment in Russellville
| Educational Attainment | Male Income | Female Income |
| Less than High School | - | - |
| High School Diploma | - | - |
| College or Associate's Degree | - | - |
| Bachelor's Degree | - | - |
| Graduate Degree | - | - |
| Total | - | - |
Family Income in Russellville
Family Income Brackets in Russellville
According to the Russellville family income data, there are 3 families falling into the $35,000 to $49,999 income range, which is the most common income bracket and makes up 37.5% of all families.
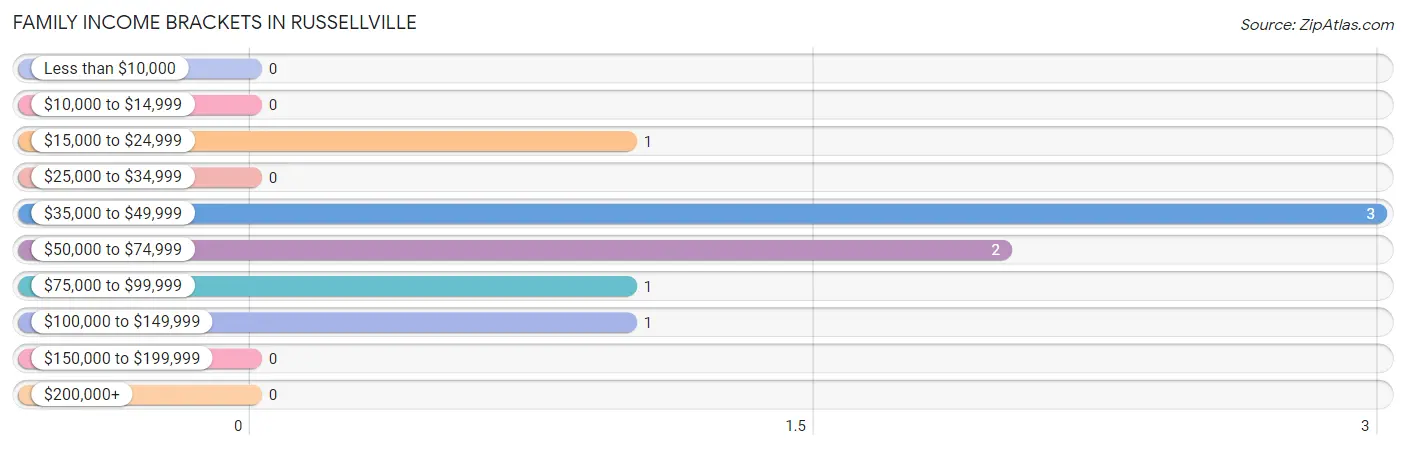
| Income Bracket | # Families | % Families |
| Less than $10,000 | 0 | 0.0% |
| $10,000 to $14,999 | 0 | 0.0% |
| $15,000 to $24,999 | 1 | 12.5% |
| $25,000 to $34,999 | 0 | 0.0% |
| $35,000 to $49,999 | 3 | 37.5% |
| $50,000 to $74,999 | 2 | 25.0% |
| $75,000 to $99,999 | 1 | 12.5% |
| $100,000 to $149,999 | 1 | 12.5% |
| $150,000 to $199,999 | 0 | 0.0% |
| $200,000+ | 0 | 0.0% |
Family Income by Famaliy Size in Russellville
2-person families (4 | 50.0%) account for the highest median family income in Russellville with $65,000 per family, while 2-person families (4 | 50.0%) have the highest median income of $32,500 per family member.
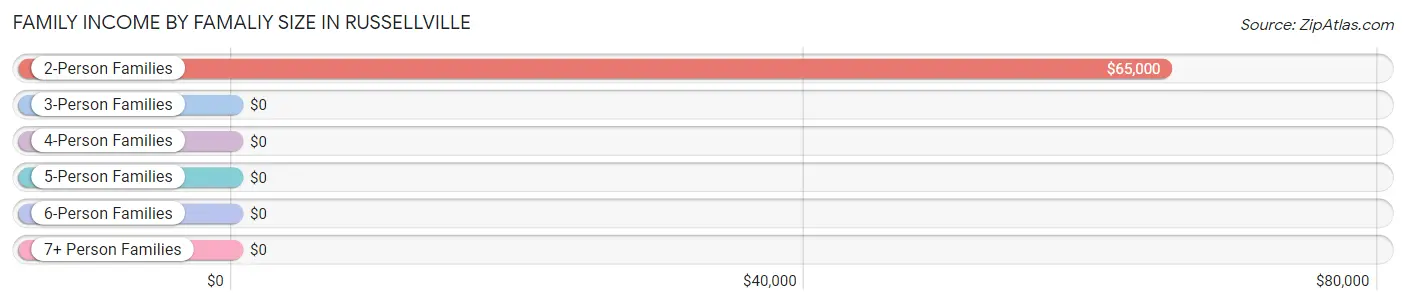
| Income Bracket | # Families | Median Income |
| 2-Person Families | 4 (50.0%) | $65,000 |
| 3-Person Families | 1 (12.5%) | $0 |
| 4-Person Families | 3 (37.5%) | $0 |
| 5-Person Families | 0 (0.0%) | $0 |
| 6-Person Families | 0 (0.0%) | $0 |
| 7+ Person Families | 0 (0.0%) | $0 |
| Total | 8 (100.0%) | $0 |
Family Income by Number of Earners in Russellville
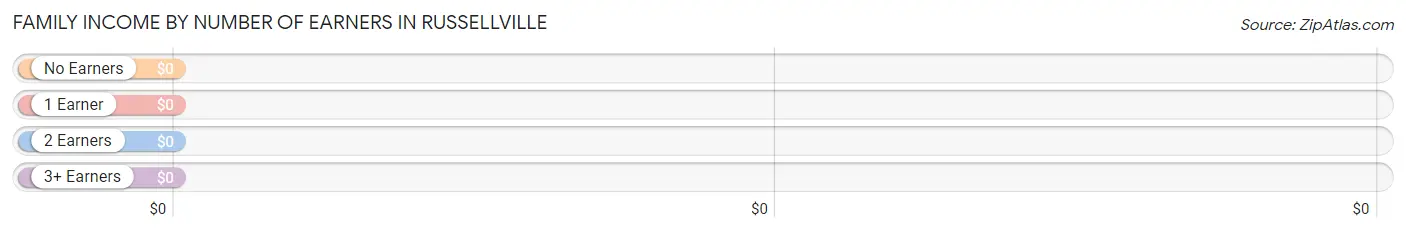
| Number of Earners | # Families | Median Income |
| No Earners | 3 (37.5%) | $0 |
| 1 Earner | 1 (12.5%) | $0 |
| 2 Earners | 4 (50.0%) | $0 |
| 3+ Earners | 0 (0.0%) | $0 |
| Total | 8 (100.0%) | $0 |
Household Income in Russellville
Household Income Brackets in Russellville
With 12 households falling in the category, the $35,000 to $49,999 income range is the most frequent in Russellville, accounting for 40.0% of all households.
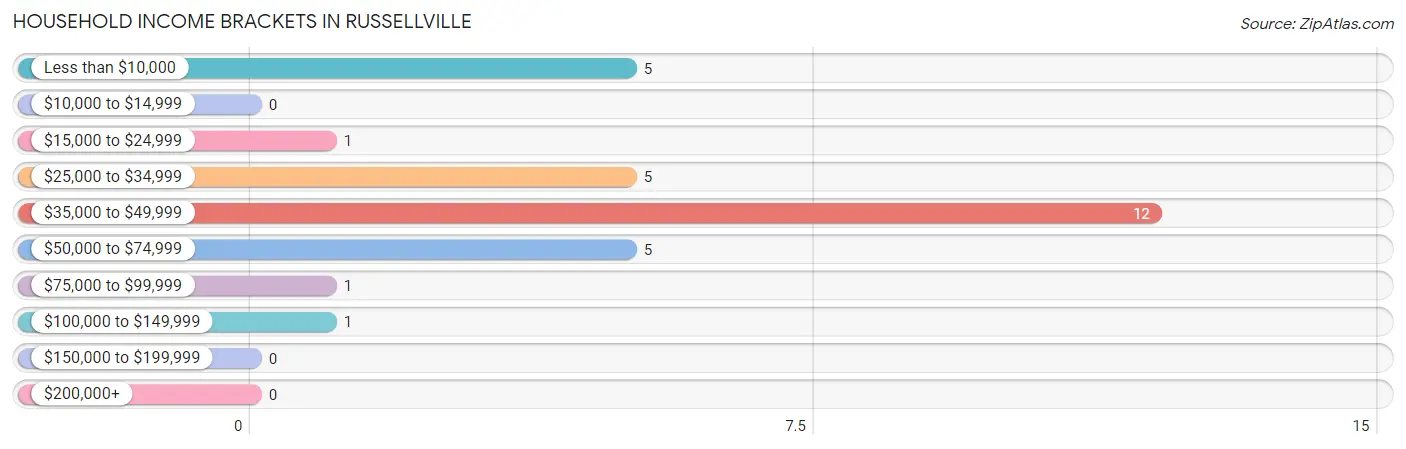
| Income Bracket | # Households | % Households |
| Less than $10,000 | 5 | 16.7% |
| $10,000 to $14,999 | 0 | 0.0% |
| $15,000 to $24,999 | 1 | 3.3% |
| $25,000 to $34,999 | 5 | 16.7% |
| $35,000 to $49,999 | 12 | 40.0% |
| $50,000 to $74,999 | 5 | 16.7% |
| $75,000 to $99,999 | 1 | 3.3% |
| $100,000 to $149,999 | 1 | 3.3% |
| $150,000 to $199,999 | 0 | 0.0% |
| $200,000+ | 0 | 0.0% |
Household Income by Householder Age in Russellville
The median household income in Russellville is $38,929, with the highest median household income of $39,583 found in the 45 to 64 years age bracket for the primary householder. A total of 15 households (50.0%) fall into this category.
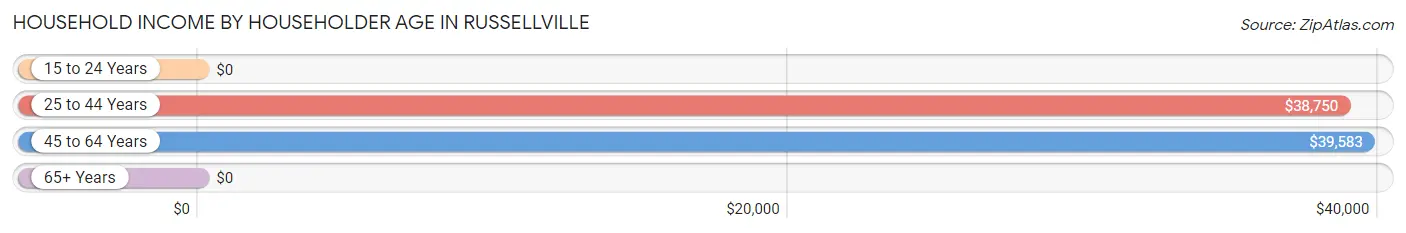
| Income Bracket | # Households | Median Income |
| 15 to 24 Years | 0 (0.0%) | $0 |
| 25 to 44 Years | 6 (20.0%) | $38,750 |
| 45 to 64 Years | 15 (50.0%) | $39,583 |
| 65+ Years | 9 (30.0%) | $0 |
| Total | 30 (100.0%) | $38,929 |
Poverty in Russellville
Income Below Poverty by Sex and Age in Russellville
With 9.8% poverty level for males and 4.3% for females among the residents of Russellville, 55 to 64 year old males and 35 to 44 year old females are the most vulnerable to poverty, with 5 males (45.5%) and 1 females (50.0%) in their respective age groups living below the poverty level.
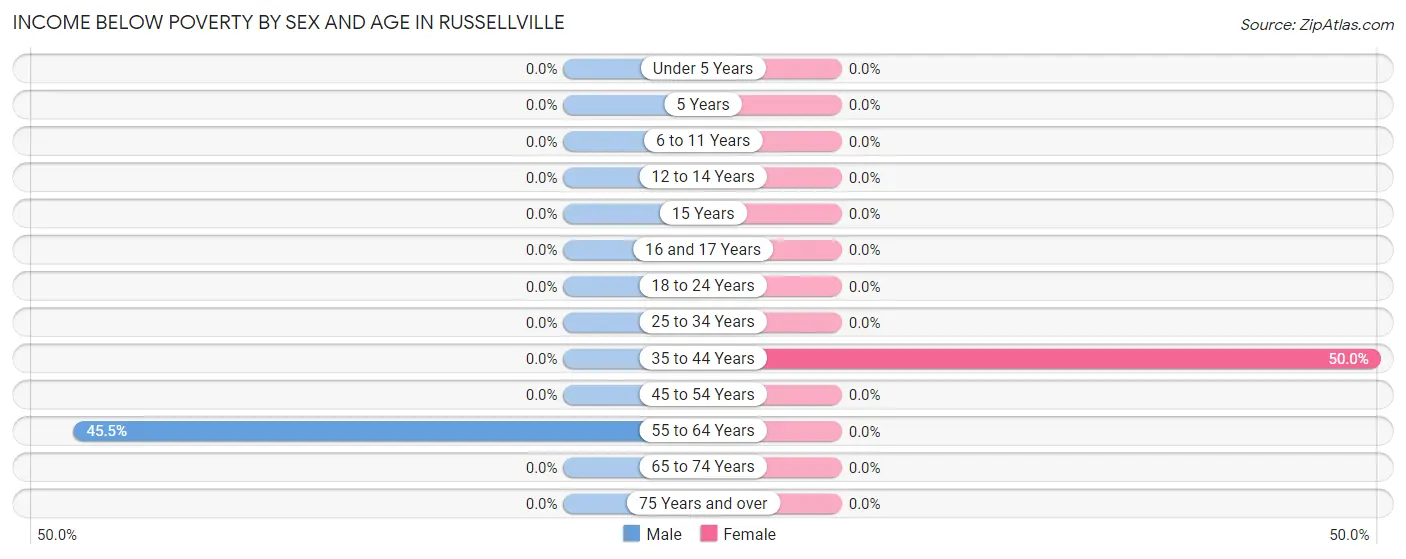
| Age Bracket | Male | Female |
| Under 5 Years | 0 (0.0%) | 0 (0.0%) |
| 5 Years | 0 (0.0%) | 0 (0.0%) |
| 6 to 11 Years | 0 (0.0%) | 0 (0.0%) |
| 12 to 14 Years | 0 (0.0%) | 0 (0.0%) |
| 15 Years | 0 (0.0%) | 0 (0.0%) |
| 16 and 17 Years | 0 (0.0%) | 0 (0.0%) |
| 18 to 24 Years | 0 (0.0%) | 0 (0.0%) |
| 25 to 34 Years | 0 (0.0%) | 0 (0.0%) |
| 35 to 44 Years | 0 (0.0%) | 1 (50.0%) |
| 45 to 54 Years | 0 (0.0%) | 0 (0.0%) |
| 55 to 64 Years | 5 (45.5%) | 0 (0.0%) |
| 65 to 74 Years | 0 (0.0%) | 0 (0.0%) |
| 75 Years and over | 0 (0.0%) | 0 (0.0%) |
| Total | 5 (9.8%) | 1 (4.3%) |
Income Above Poverty by Sex and Age in Russellville
According to the poverty statistics in Russellville, males aged 18 to 24 years and females aged 12 to 14 years are the age groups that are most secure financially, with 100.0% of males and 100.0% of females in these age groups living above the poverty line.
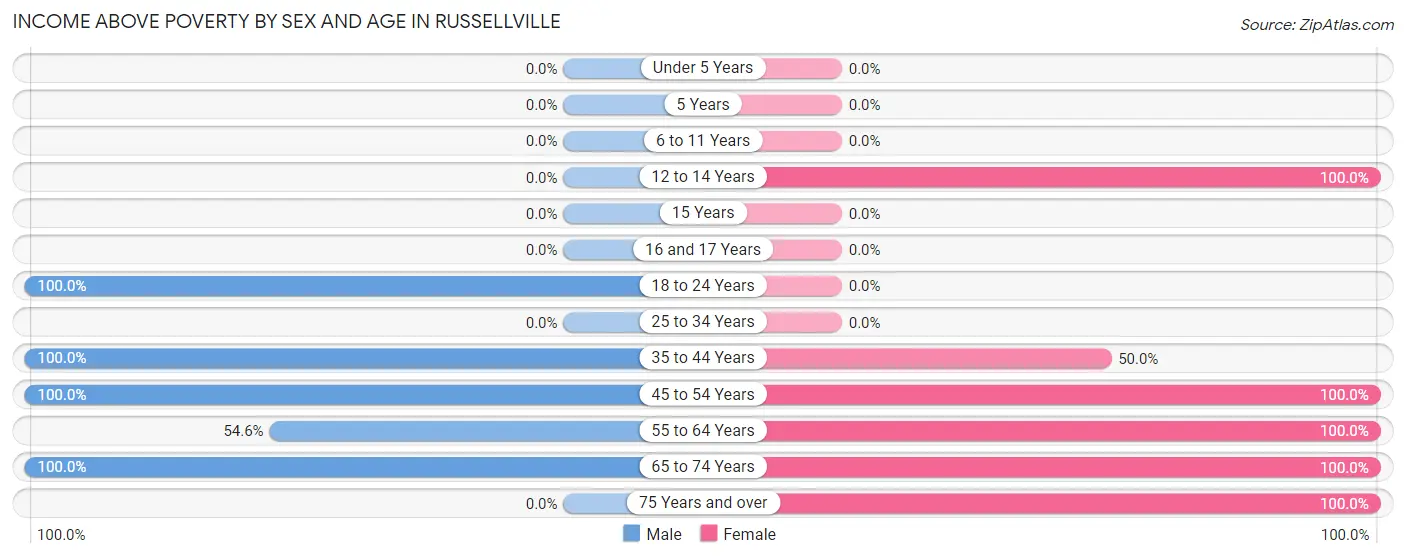
| Age Bracket | Male | Female |
| Under 5 Years | 0 (0.0%) | 0 (0.0%) |
| 5 Years | 0 (0.0%) | 0 (0.0%) |
| 6 to 11 Years | 0 (0.0%) | 0 (0.0%) |
| 12 to 14 Years | 0 (0.0%) | 4 (100.0%) |
| 15 Years | 0 (0.0%) | 0 (0.0%) |
| 16 and 17 Years | 0 (0.0%) | 0 (0.0%) |
| 18 to 24 Years | 18 (100.0%) | 0 (0.0%) |
| 25 to 34 Years | 0 (0.0%) | 0 (0.0%) |
| 35 to 44 Years | 9 (100.0%) | 1 (50.0%) |
| 45 to 54 Years | 11 (100.0%) | 3 (100.0%) |
| 55 to 64 Years | 6 (54.5%) | 2 (100.0%) |
| 65 to 74 Years | 2 (100.0%) | 7 (100.0%) |
| 75 Years and over | 0 (0.0%) | 5 (100.0%) |
| Total | 46 (90.2%) | 22 (95.7%) |
Income Below Poverty Among Married-Couple Families in Russellville
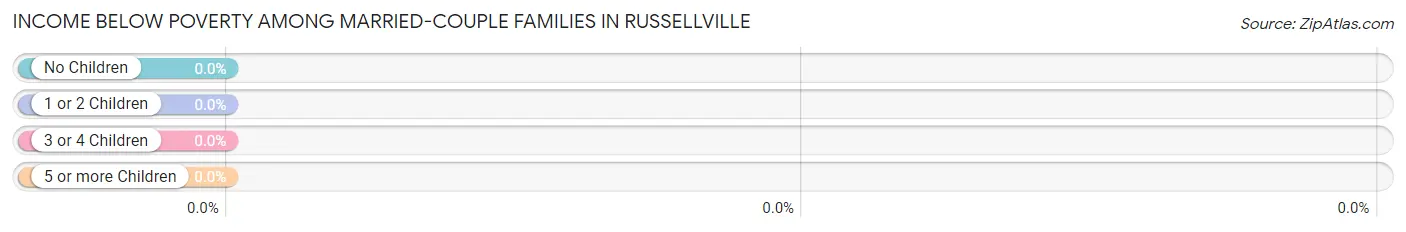
| Children | Above Poverty | Below Poverty |
| No Children | 4 (100.0%) | 0 (0.0%) |
| 1 or 2 Children | 3 (100.0%) | 0 (0.0%) |
| 3 or 4 Children | 0 (0.0%) | 0 (0.0%) |
| 5 or more Children | 0 (0.0%) | 0 (0.0%) |
| Total | 7 (100.0%) | 0 (0.0%) |
Income Below Poverty Among Single-Parent Households in Russellville
| Children | Single Father | Single Mother |
| No Children | 0 (0.0%) | 0 (0.0%) |
| 1 or 2 Children | 0 (0.0%) | 0 (0.0%) |
| 3 or 4 Children | 0 (0.0%) | 0 (0.0%) |
| 5 or more Children | 0 (0.0%) | 0 (0.0%) |
| Total | 0 (0.0%) | 0 (0.0%) |
Income Below Poverty Among Married-Couple vs Single-Parent Households in Russellville
| Children | Married-Couple Families | Single-Parent Households |
| No Children | 0 (0.0%) | 0 (0.0%) |
| 1 or 2 Children | 0 (0.0%) | 0 (0.0%) |
| 3 or 4 Children | 0 (0.0%) | 0 (0.0%) |
| 5 or more Children | 0 (0.0%) | 0 (0.0%) |
| Total | 0 (0.0%) | 0 (0.0%) |
Race in Russellville
The most populous races in Russellville are White / Caucasian (41 | 55.4%), Two or more Races (22 | 29.7%), and Black / African American (11 | 14.9%).
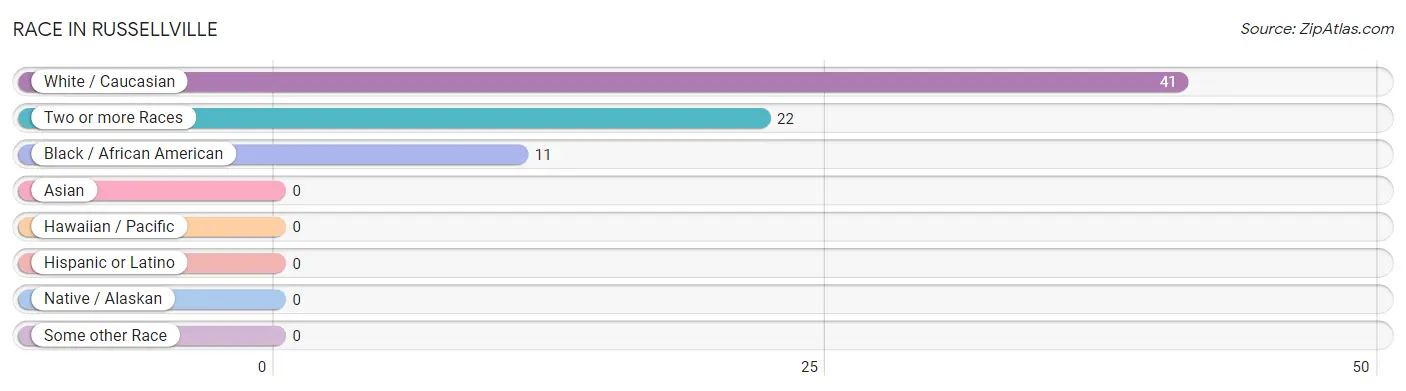
| Race | # Population | % Population |
| Asian | 0 | 0.0% |
| Black / African American | 11 | 14.9% |
| Hawaiian / Pacific | 0 | 0.0% |
| Hispanic or Latino | 0 | 0.0% |
| Native / Alaskan | 0 | 0.0% |
| White / Caucasian | 41 | 55.4% |
| Two or more Races | 22 | 29.7% |
| Some other Race | 0 | 0.0% |
| Total | 74 | 100.0% |
Ancestry in Russellville
The most populous ancestries reported in Russellville are Irish (11 | 14.9%), German (6 | 8.1%), Dutch (3 | 4.1%), and English (2 | 2.7%), together accounting for 29.7% of all Russellville residents.
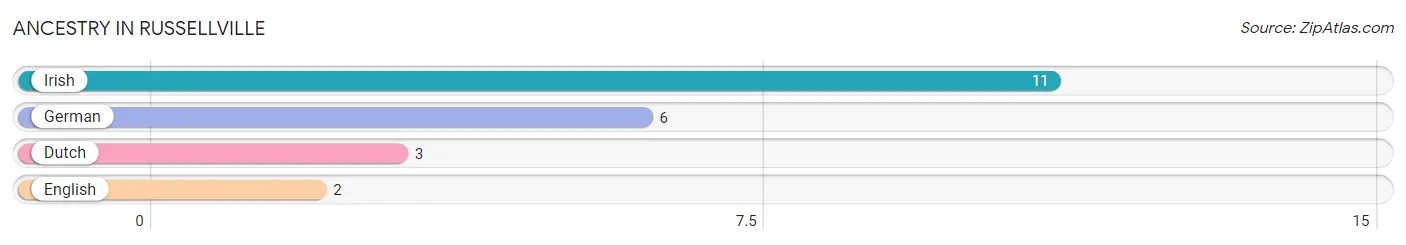
| Ancestry | # Population | % Population |
| Dutch | 3 | 4.1% |
| English | 2 | 2.7% |
| German | 6 | 8.1% |
| Irish | 11 | 14.9% | View All 4 Rows |
Immigrants in Russellville

| Immigration Origin | # Population | % Population | View All 0 Rows |
Sex and Age in Russellville
Sex and Age in Russellville
The most populous age groups in Russellville are 15 to 19 Years (18 | 35.3%) for men and 65 to 69 Years (6 | 26.1%) for women.
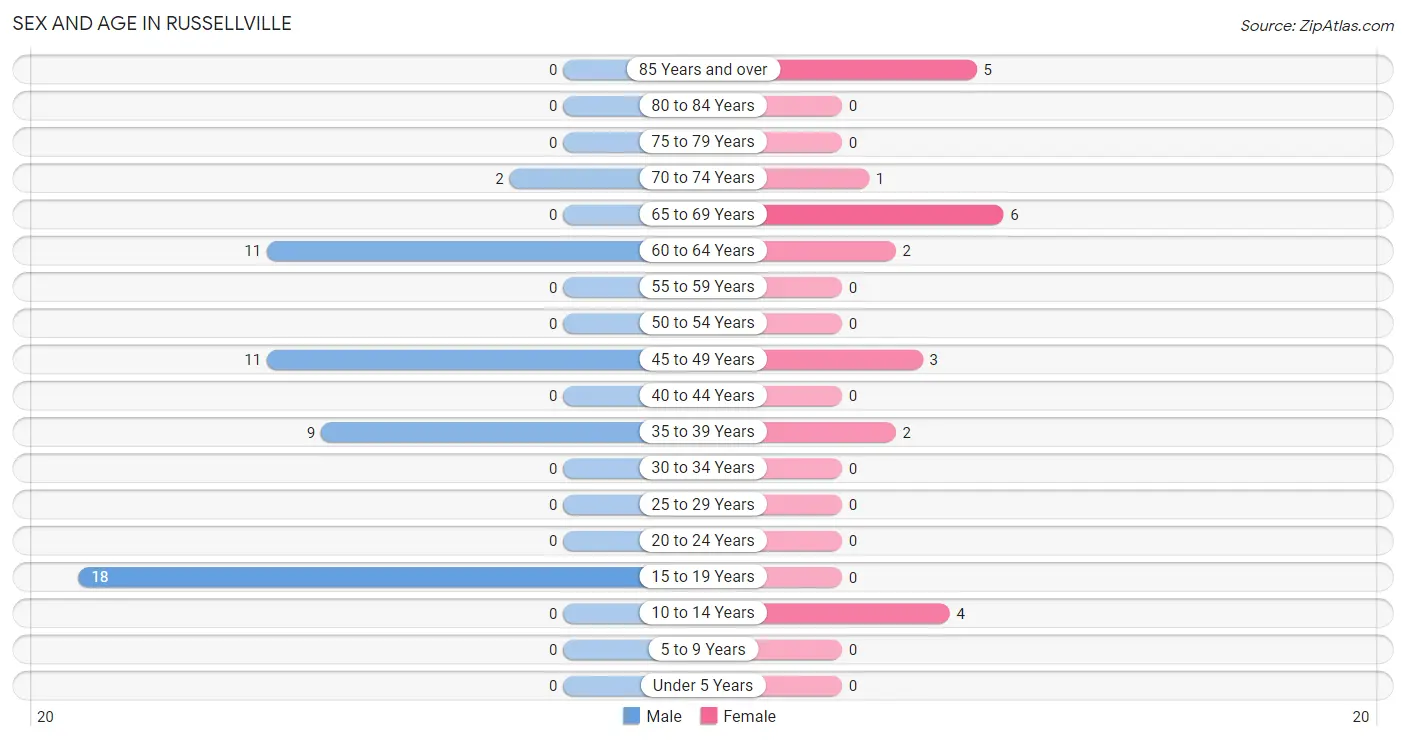
| Age Bracket | Male | Female |
| Under 5 Years | 0 (0.0%) | 0 (0.0%) |
| 5 to 9 Years | 0 (0.0%) | 0 (0.0%) |
| 10 to 14 Years | 0 (0.0%) | 4 (17.4%) |
| 15 to 19 Years | 18 (35.3%) | 0 (0.0%) |
| 20 to 24 Years | 0 (0.0%) | 0 (0.0%) |
| 25 to 29 Years | 0 (0.0%) | 0 (0.0%) |
| 30 to 34 Years | 0 (0.0%) | 0 (0.0%) |
| 35 to 39 Years | 9 (17.6%) | 2 (8.7%) |
| 40 to 44 Years | 0 (0.0%) | 0 (0.0%) |
| 45 to 49 Years | 11 (21.6%) | 3 (13.0%) |
| 50 to 54 Years | 0 (0.0%) | 0 (0.0%) |
| 55 to 59 Years | 0 (0.0%) | 0 (0.0%) |
| 60 to 64 Years | 11 (21.6%) | 2 (8.7%) |
| 65 to 69 Years | 0 (0.0%) | 6 (26.1%) |
| 70 to 74 Years | 2 (3.9%) | 1 (4.3%) |
| 75 to 79 Years | 0 (0.0%) | 0 (0.0%) |
| 80 to 84 Years | 0 (0.0%) | 0 (0.0%) |
| 85 Years and over | 0 (0.0%) | 5 (21.7%) |
| Total | 51 (100.0%) | 23 (100.0%) |
Families and Households in Russellville
Median Family Size in Russellville
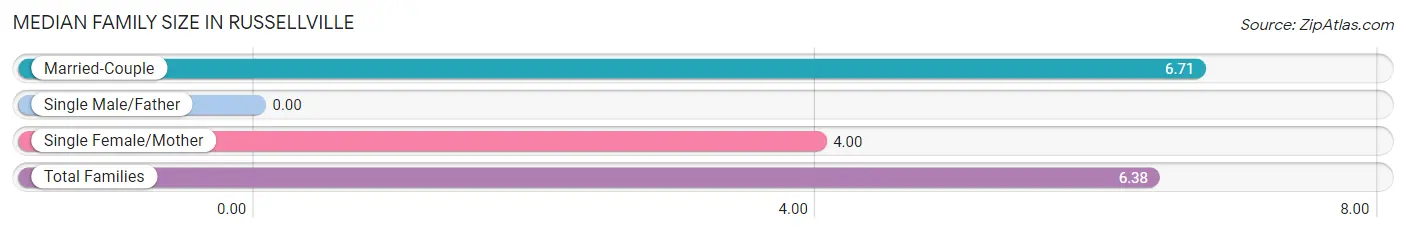
| Family Type | # Families | Family Size |
| Married-Couple | 7 (87.5%) | 6.71 |
| Single Male/Father | 0 (0.0%) | - |
| Single Female/Mother | 1 (12.5%) | 4.00 |
| Total Families | 8 (100.0%) | 6.38 |
Median Household Size in Russellville
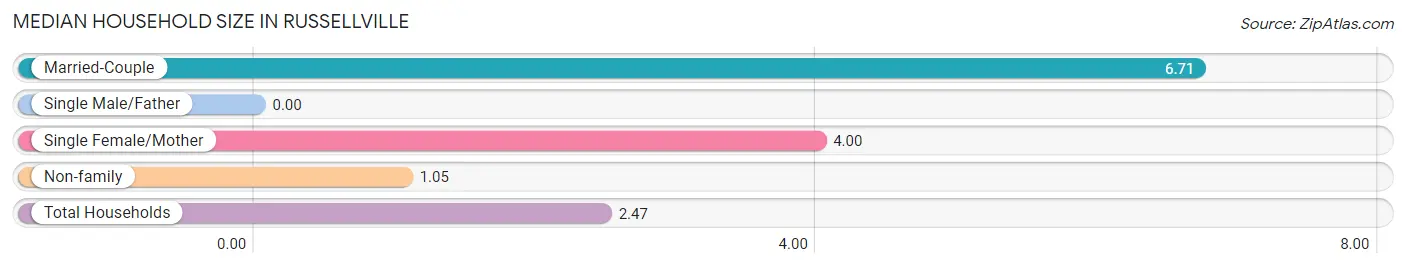
| Household Type | # Households | Household Size |
| Married-Couple | 7 (23.3%) | 6.71 |
| Single Male/Father | 0 (0.0%) | - |
| Single Female/Mother | 1 (3.3%) | 4.00 |
| Non-family | 22 (73.3%) | 1.05 |
| Total Households | 30 (100.0%) | 2.47 |
Household Size by Marriage Status in Russellville
Out of a total of 30 households in Russellville, 8 (26.7%) are family households, while 22 (73.3%) are nonfamily households. The most numerous type of family households are 2-person households, comprising 4, and the most common type of nonfamily households are 1-person households, comprising 21.
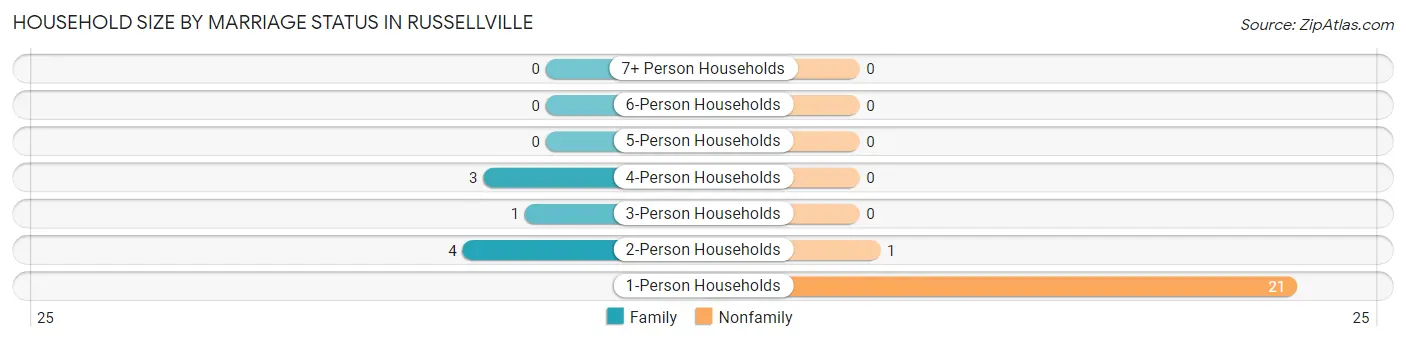
| Household Size | Family Households | Nonfamily Households |
| 1-Person Households | - | 21 (70.0%) |
| 2-Person Households | 4 (13.3%) | 1 (3.3%) |
| 3-Person Households | 1 (3.3%) | 0 (0.0%) |
| 4-Person Households | 3 (10.0%) | 0 (0.0%) |
| 5-Person Households | 0 (0.0%) | 0 (0.0%) |
| 6-Person Households | 0 (0.0%) | 0 (0.0%) |
| 7+ Person Households | 0 (0.0%) | 0 (0.0%) |
| Total | 8 (26.7%) | 22 (73.3%) |
Female Fertility in Russellville
Fertility by Age in Russellville
| Age Bracket | Women with Births | Births / 1,000 Women |
| 15 to 19 years | 0 (0.0%) | 0.0 |
| 20 to 34 years | 0 (0.0%) | 0.0 |
| 35 to 50 years | 0 (0.0%) | 0.0 |
| Total | 0 (0.0%) | 0.0 |
Fertility by Age by Marriage Status in Russellville
| Age Bracket | Married | Unmarried |
| 15 to 19 years | 0 (0.0%) | 0 (0.0%) |
| 20 to 34 years | 0 (0.0%) | 0 (0.0%) |
| 35 to 50 years | 0 (0.0%) | 0 (0.0%) |
| Total | 0 (0.0%) | 0 (0.0%) |
Fertility by Education in Russellville
| Educational Attainment | Women with Births | Births / 1,000 Women |
| Less than High School | 0 (0.0%) | 0.0 |
| High School Diploma | 0 (0.0%) | 0.0 |
| College or Associate's Degree | 0 (0.0%) | 0.0 |
| Bachelor's Degree | 0 (0.0%) | 0.0 |
| Graduate Degree | 0 (0.0%) | 0.0 |
| Total | 0 (0.0%) | 0.0 |
Fertility by Education by Marriage Status in Russellville
| Educational Attainment | Married | Unmarried |
| Less than High School | 0 (0.0%) | 0 (0.0%) |
| High School Diploma | 0 (0.0%) | 0 (0.0%) |
| College or Associate's Degree | 0 (0.0%) | 0 (0.0%) |
| Bachelor's Degree | 0 (0.0%) | 0 (0.0%) |
| Graduate Degree | 0 (0.0%) | 0 (0.0%) |
| Total | 0 (0.0%) | 0 (0.0%) |
Employment Characteristics in Russellville
Employment by Class of Employer in Russellville
Among the 41 employed individuals in Russellville, private company employees (40 | 97.6%), and local government employees (1 | 2.4%) make up the most common classes of employment.
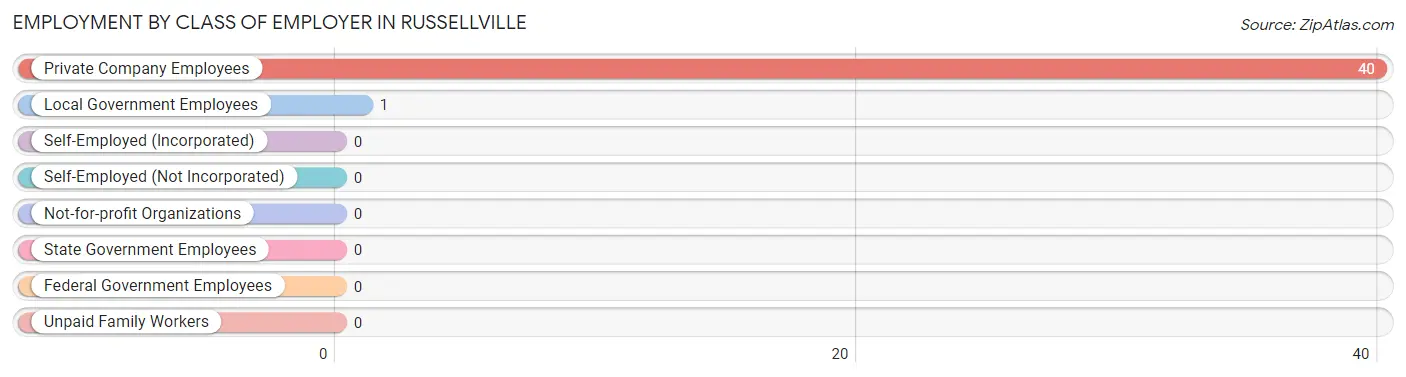
| Employer Class | # Employees | % Employees |
| Private Company Employees | 40 | 97.6% |
| Self-Employed (Incorporated) | 0 | 0.0% |
| Self-Employed (Not Incorporated) | 0 | 0.0% |
| Not-for-profit Organizations | 0 | 0.0% |
| Local Government Employees | 1 | 2.4% |
| State Government Employees | 0 | 0.0% |
| Federal Government Employees | 0 | 0.0% |
| Unpaid Family Workers | 0 | 0.0% |
| Total | 41 | 100.0% |
Employment Status by Age in Russellville
According to the labor force statistics for Russellville, out of the total population over 16 years of age (70), 60.0% or 42 individuals are in the labor force, with 2.4% or 1 of them unemployed. The age group with the highest labor force participation rate is 16 to 19 years, with 100.0% or 18 individuals in the labor force. Within the labor force, the 60 to 64 years age range has the highest percentage of unemployed individuals, with 33.3% or 1 of them being unemployed.
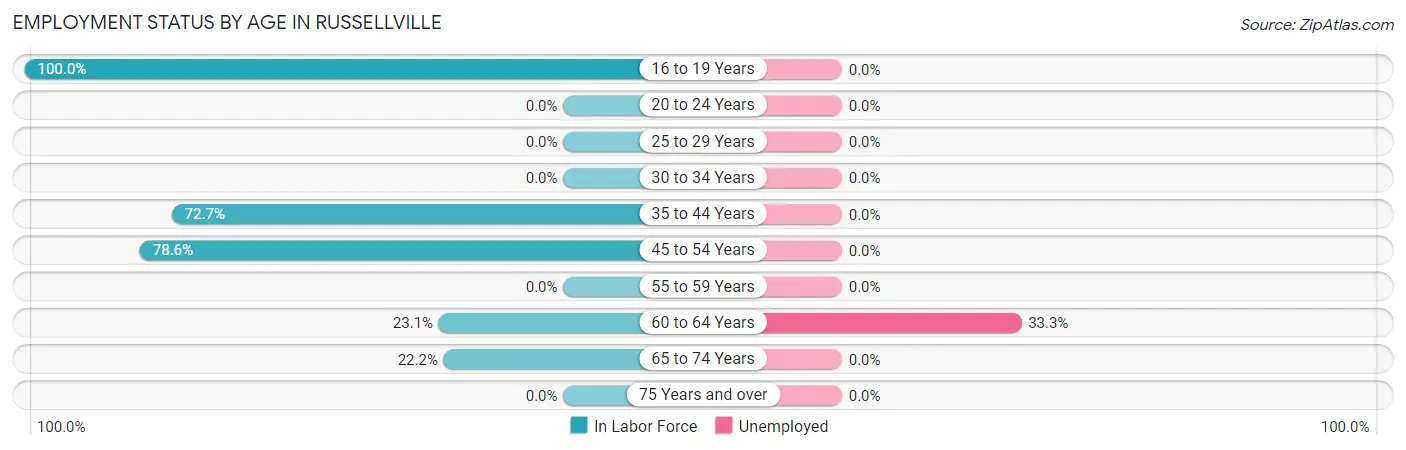
| Age Bracket | In Labor Force | Unemployed |
| 16 to 19 Years | 18 (100.0%) | 0 (0.0%) |
| 20 to 24 Years | 0 (0.0%) | 0 (0.0%) |
| 25 to 29 Years | 0 (0.0%) | 0 (0.0%) |
| 30 to 34 Years | 0 (0.0%) | 0 (0.0%) |
| 35 to 44 Years | 8 (72.7%) | 0 (0.0%) |
| 45 to 54 Years | 11 (78.6%) | 0 (0.0%) |
| 55 to 59 Years | 0 (0.0%) | 0 (0.0%) |
| 60 to 64 Years | 3 (23.1%) | 1 (33.3%) |
| 65 to 74 Years | 2 (22.2%) | 0 (0.0%) |
| 75 Years and over | 0 (0.0%) | 0 (0.0%) |
| Total | 42 (60.0%) | 1 (2.4%) |
Employment Status by Educational Attainment in Russellville
According to labor force statistics for Russellville, 57.9% of individuals (22) out of the total population between 25 and 64 years of age (38) are in the labor force, with 4.5% or 1 of them being unemployed. The group with the highest labor force participation rate are those with the educational attainment of less than high school, with 100.0% or 1 individuals in the labor force. Within the labor force, individuals with less than high school education have the highest percentage of unemployment, with 100.0% or 1 of them being unemployed.
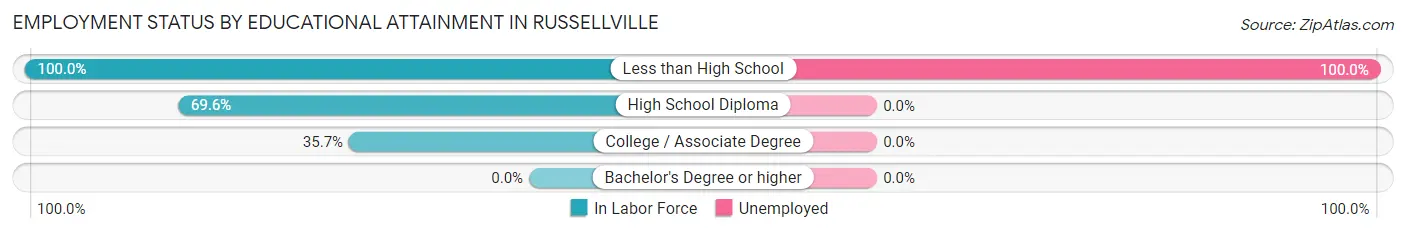
| Educational Attainment | In Labor Force | Unemployed |
| Less than High School | 1 (100.0%) | 1 (100.0%) |
| High School Diploma | 16 (69.6%) | 0 (0.0%) |
| College / Associate Degree | 5 (35.7%) | 0 (0.0%) |
| Bachelor's Degree or higher | 0 (0.0%) | 0 (0.0%) |
| Total | 22 (57.9%) | 2 (4.5%) |
Employment Occupations by Sex in Russellville
Management, Business, Science and Arts Occupations
The most common Management, Business, Science and Arts occupations in Russellville are , and Management (4 | 9.8%).
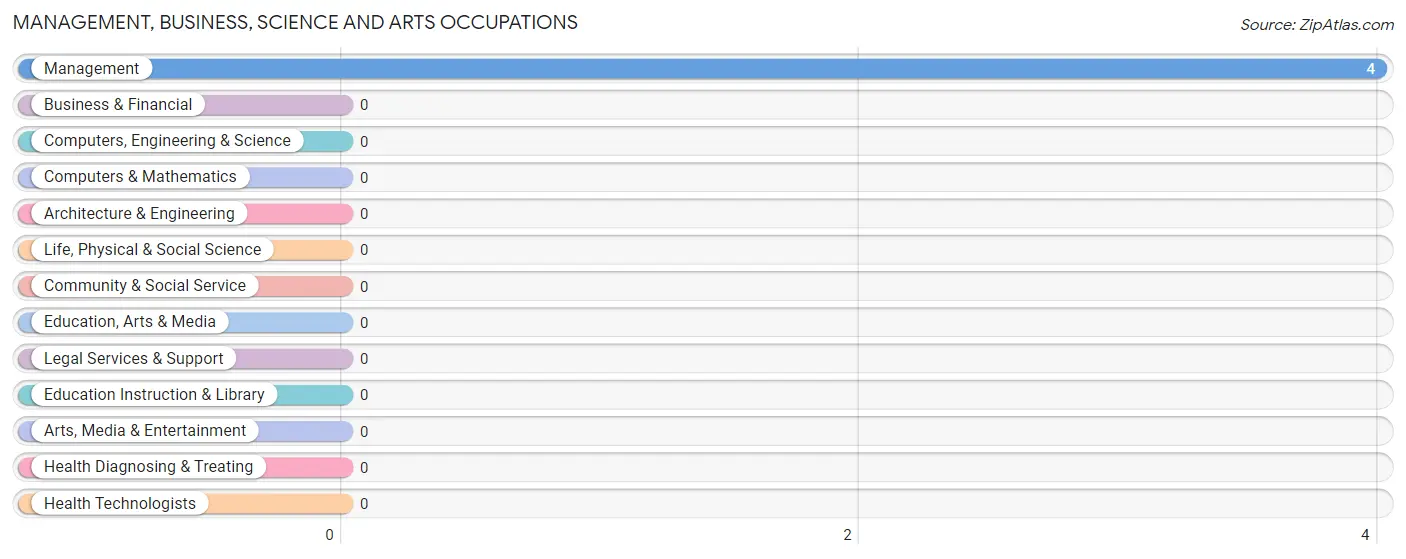
Management, Business, Science and Arts Occupations by Sex
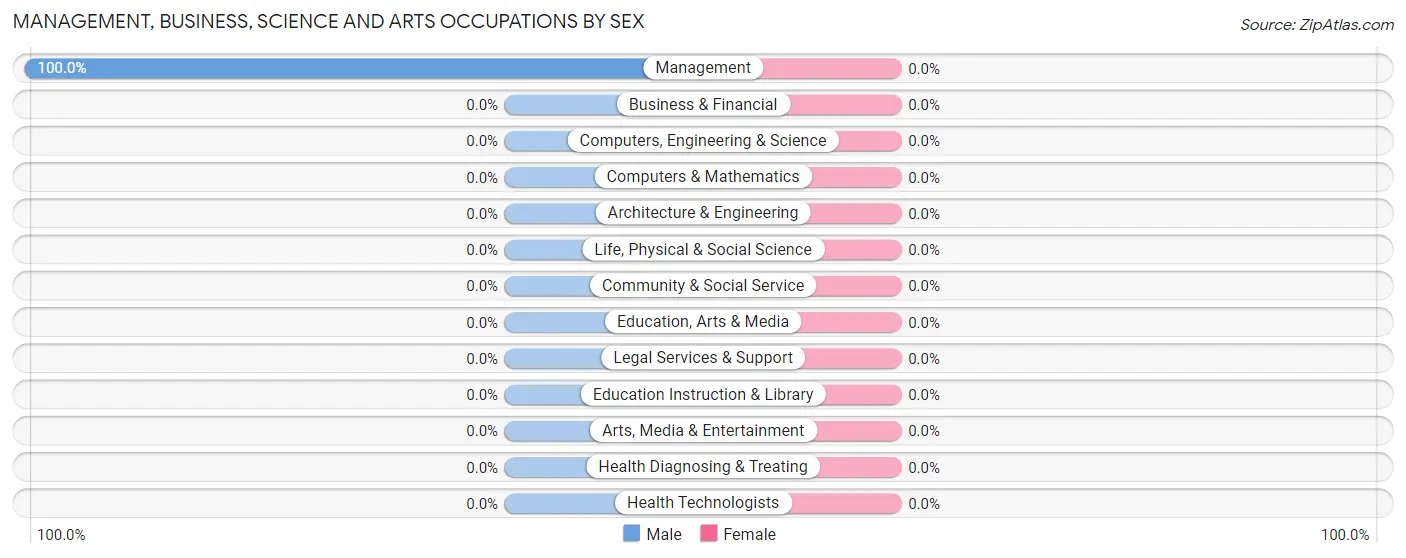
| Occupation | Male | Female |
| Management | 4 (100.0%) | 0 (0.0%) |
| Business & Financial | 0 (0.0%) | 0 (0.0%) |
| Computers, Engineering & Science | 0 (0.0%) | 0 (0.0%) |
| Computers & Mathematics | 0 (0.0%) | 0 (0.0%) |
| Architecture & Engineering | 0 (0.0%) | 0 (0.0%) |
| Life, Physical & Social Science | 0 (0.0%) | 0 (0.0%) |
| Community & Social Service | 0 (0.0%) | 0 (0.0%) |
| Education, Arts & Media | 0 (0.0%) | 0 (0.0%) |
| Legal Services & Support | 0 (0.0%) | 0 (0.0%) |
| Education Instruction & Library | 0 (0.0%) | 0 (0.0%) |
| Arts, Media & Entertainment | 0 (0.0%) | 0 (0.0%) |
| Health Diagnosing & Treating | 0 (0.0%) | 0 (0.0%) |
| Health Technologists | 0 (0.0%) | 0 (0.0%) |
| Total (Category) | 4 (100.0%) | 0 (0.0%) |
| Total (Overall) | 38 (92.7%) | 3 (7.3%) |
Services Occupations
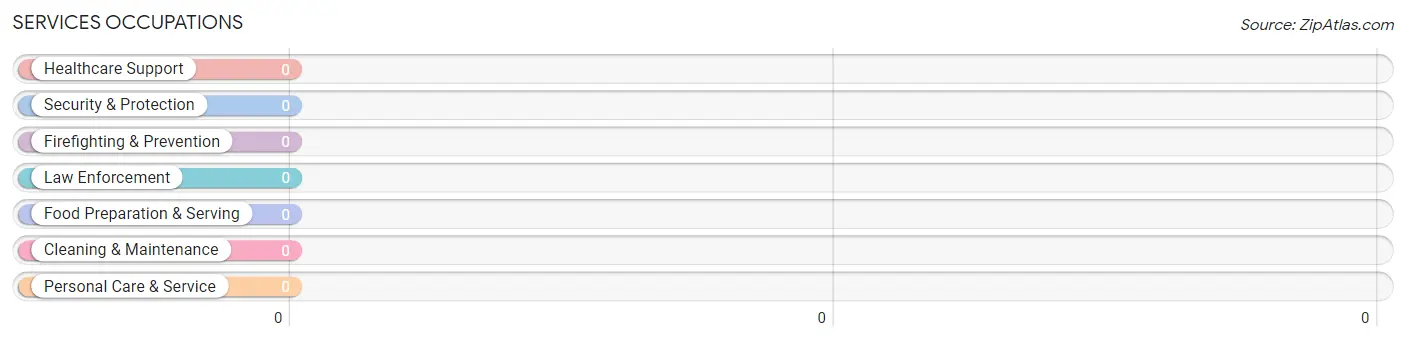
Services Occupations by Sex
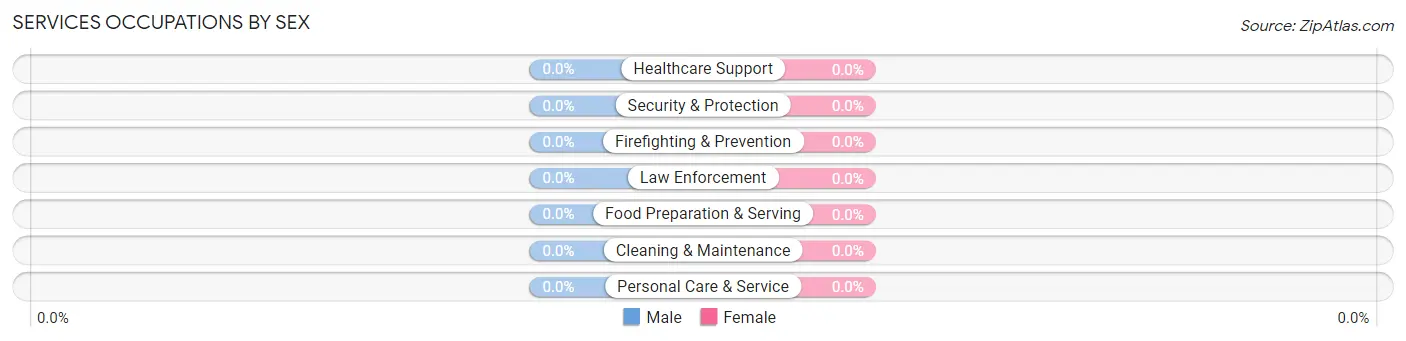
| Occupation | Male | Female |
| Healthcare Support | 0 (0.0%) | 0 (0.0%) |
| Security & Protection | 0 (0.0%) | 0 (0.0%) |
| Firefighting & Prevention | 0 (0.0%) | 0 (0.0%) |
| Law Enforcement | 0 (0.0%) | 0 (0.0%) |
| Food Preparation & Serving | 0 (0.0%) | 0 (0.0%) |
| Cleaning & Maintenance | 0 (0.0%) | 0 (0.0%) |
| Personal Care & Service | 0 (0.0%) | 0 (0.0%) |
| Total (Category) | 0 (0.0%) | 0 (0.0%) |
| Total (Overall) | 38 (92.7%) | 3 (7.3%) |
Sales and Office Occupations
The most common Sales and Office occupations in Russellville are , and Office & Administration (1 | 2.4%).
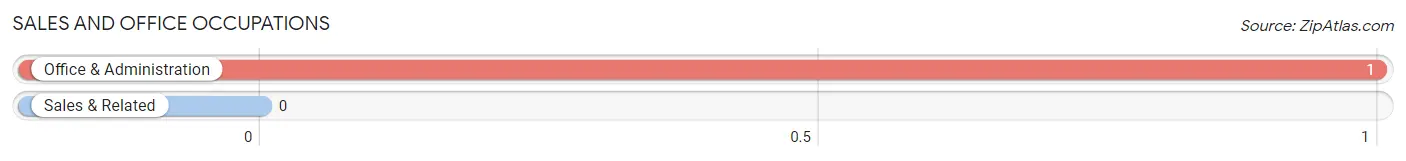
Sales and Office Occupations by Sex

| Occupation | Male | Female |
| Sales & Related | 0 (0.0%) | 0 (0.0%) |
| Office & Administration | 0 (0.0%) | 1 (100.0%) |
| Total (Category) | 0 (0.0%) | 1 (100.0%) |
| Total (Overall) | 38 (92.7%) | 3 (7.3%) |
Natural Resources, Construction and Maintenance Occupations
The most common Natural Resources, Construction and Maintenance occupations in Russellville are , and Construction & Extraction (11 | 26.8%).

Natural Resources, Construction and Maintenance Occupations by Sex
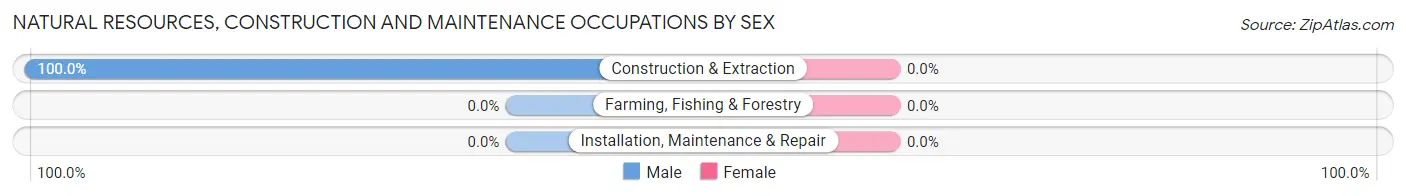
| Occupation | Male | Female |
| Farming, Fishing & Forestry | 0 (0.0%) | 0 (0.0%) |
| Construction & Extraction | 11 (100.0%) | 0 (0.0%) |
| Installation, Maintenance & Repair | 0 (0.0%) | 0 (0.0%) |
| Total (Category) | 11 (100.0%) | 0 (0.0%) |
| Total (Overall) | 38 (92.7%) | 3 (7.3%) |
Production, Transportation and Moving Occupations
The most common Production, Transportation and Moving occupations in Russellville are Material Moving (18 | 43.9%), Transportation (4 | 9.8%), and Production (3 | 7.3%).
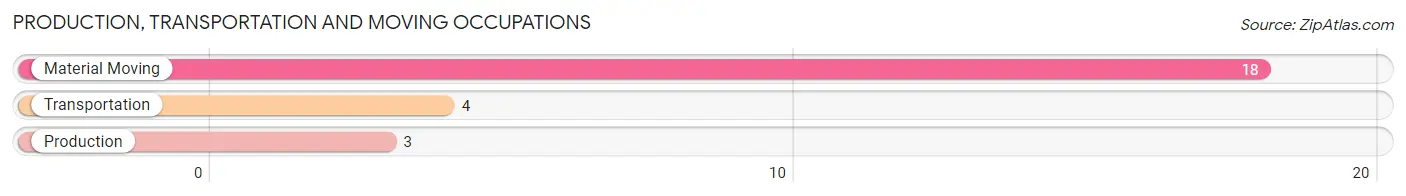
Production, Transportation and Moving Occupations by Sex
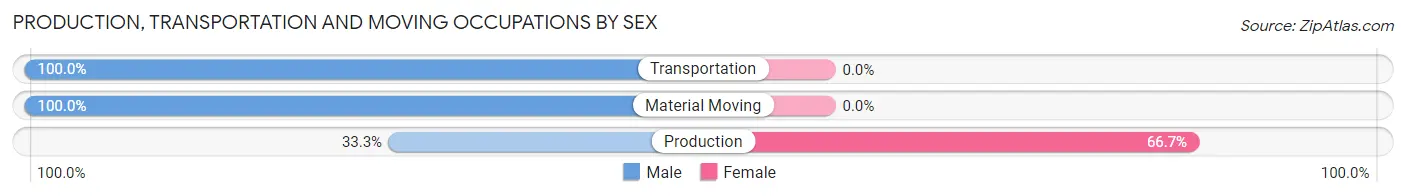
| Occupation | Male | Female |
| Production | 1 (33.3%) | 2 (66.7%) |
| Transportation | 4 (100.0%) | 0 (0.0%) |
| Material Moving | 18 (100.0%) | 0 (0.0%) |
| Total (Category) | 23 (92.0%) | 2 (8.0%) |
| Total (Overall) | 38 (92.7%) | 3 (7.3%) |
Employment Industries by Sex in Russellville
Employment Industries in Russellville
The major employment industries in Russellville include Retail Trade (18 | 43.9%), Wholesale Trade (15 | 36.6%), Manufacturing (3 | 7.3%), Administrative & Support (3 | 7.3%), and Construction (1 | 2.4%).
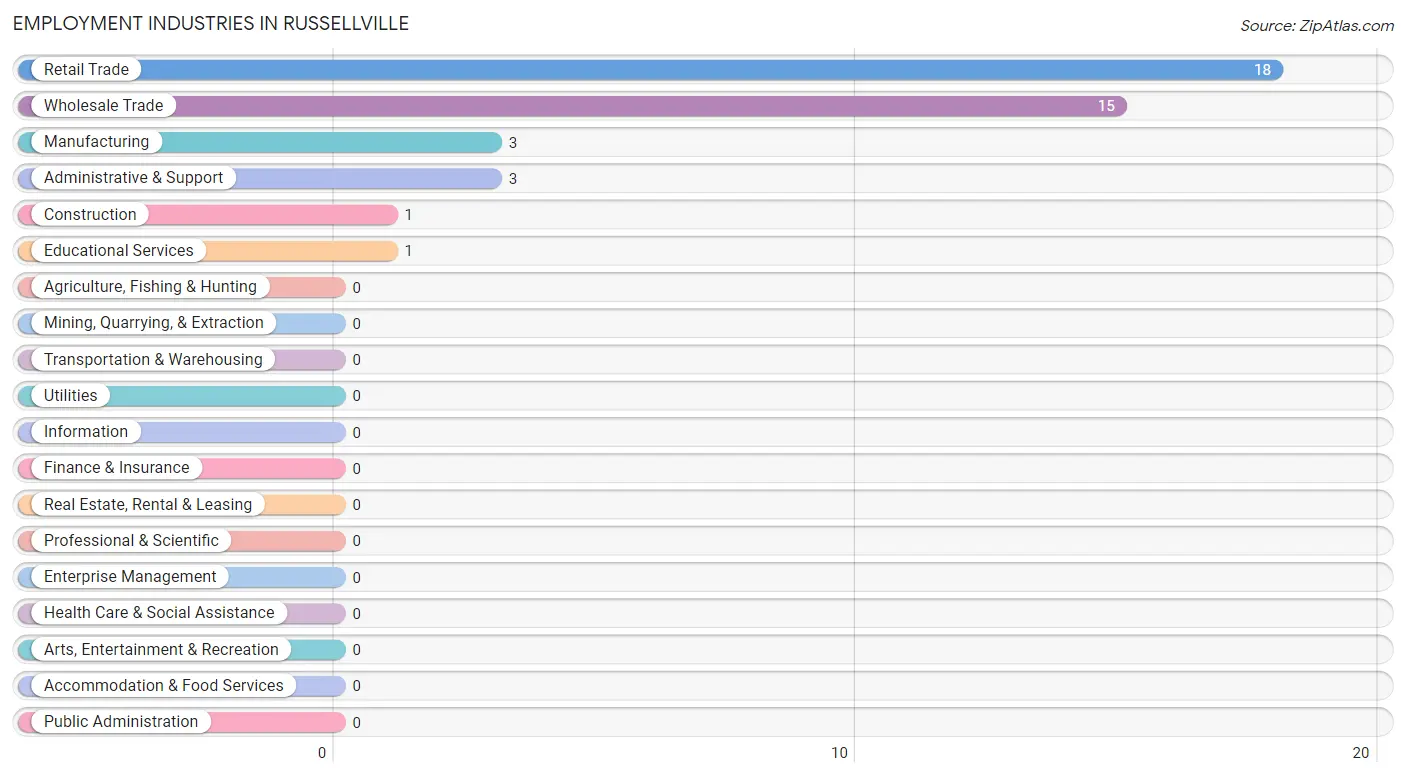
Employment Industries by Sex in Russellville
The Russellville industries that see more men than women are Construction (100.0%), Wholesale Trade (100.0%), and Retail Trade (100.0%), whereas the industries that tend to have a higher number of women are Educational Services (100.0%), and Manufacturing (66.7%).
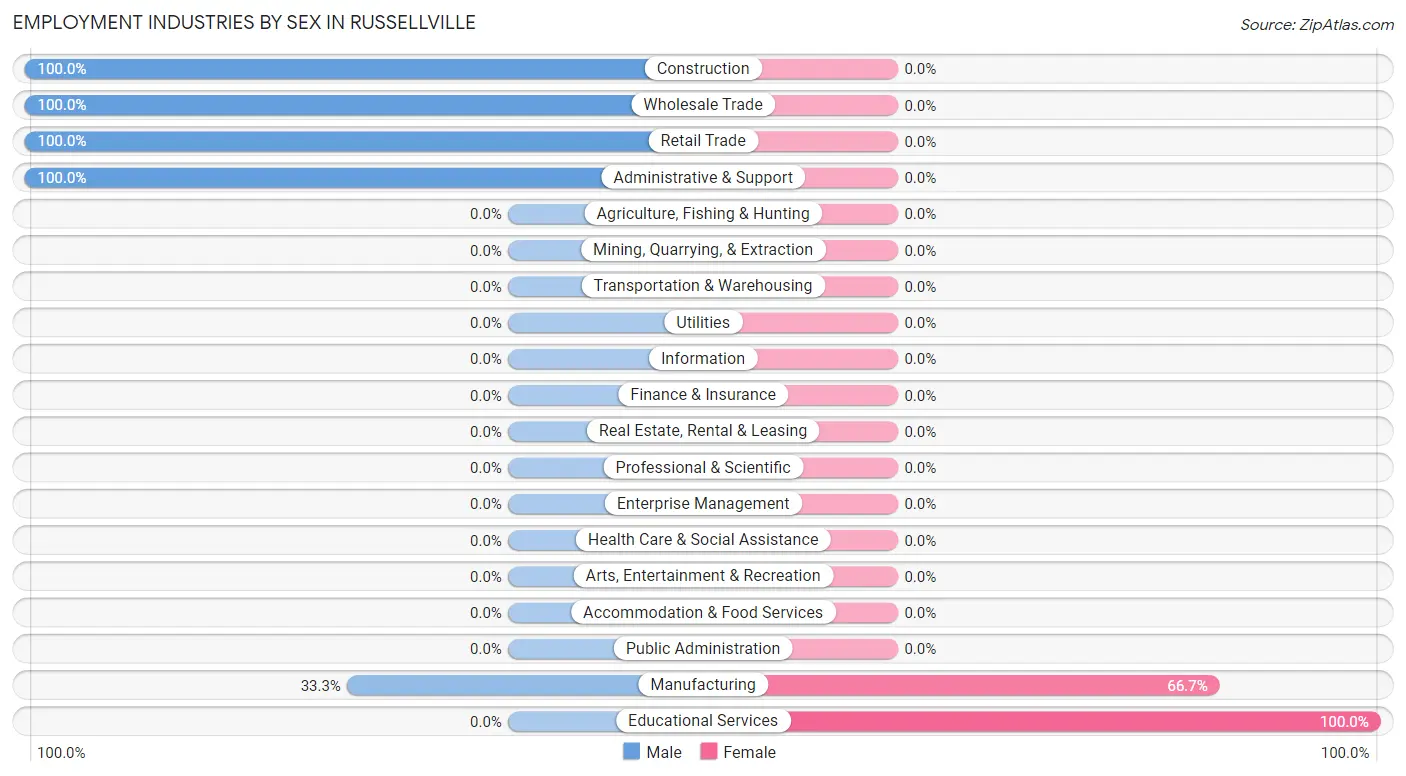
| Industry | Male | Female |
| Agriculture, Fishing & Hunting | 0 (0.0%) | 0 (0.0%) |
| Mining, Quarrying, & Extraction | 0 (0.0%) | 0 (0.0%) |
| Construction | 1 (100.0%) | 0 (0.0%) |
| Manufacturing | 1 (33.3%) | 2 (66.7%) |
| Wholesale Trade | 15 (100.0%) | 0 (0.0%) |
| Retail Trade | 18 (100.0%) | 0 (0.0%) |
| Transportation & Warehousing | 0 (0.0%) | 0 (0.0%) |
| Utilities | 0 (0.0%) | 0 (0.0%) |
| Information | 0 (0.0%) | 0 (0.0%) |
| Finance & Insurance | 0 (0.0%) | 0 (0.0%) |
| Real Estate, Rental & Leasing | 0 (0.0%) | 0 (0.0%) |
| Professional & Scientific | 0 (0.0%) | 0 (0.0%) |
| Enterprise Management | 0 (0.0%) | 0 (0.0%) |
| Administrative & Support | 3 (100.0%) | 0 (0.0%) |
| Educational Services | 0 (0.0%) | 1 (100.0%) |
| Health Care & Social Assistance | 0 (0.0%) | 0 (0.0%) |
| Arts, Entertainment & Recreation | 0 (0.0%) | 0 (0.0%) |
| Accommodation & Food Services | 0 (0.0%) | 0 (0.0%) |
| Public Administration | 0 (0.0%) | 0 (0.0%) |
| Total | 38 (92.7%) | 3 (7.3%) |
Education in Russellville
School Enrollment in Russellville
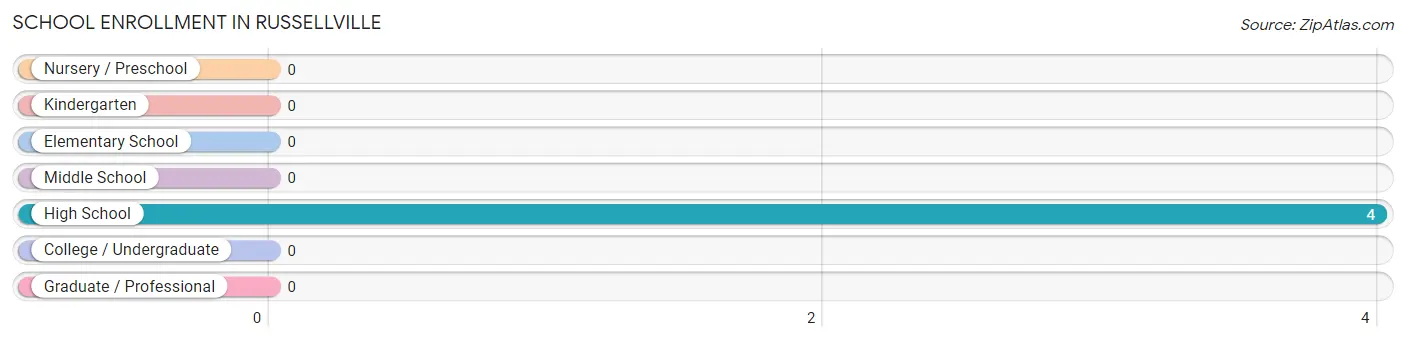
| School Level | # Students | % Students |
| Nursery / Preschool | 0 | 0.0% |
| Kindergarten | 0 | 0.0% |
| Elementary School | 0 | 0.0% |
| Middle School | 0 | 0.0% |
| High School | 4 | 100.0% |
| College / Undergraduate | 0 | 0.0% |
| Graduate / Professional | 0 | 0.0% |
| Total | 4 | 100.0% |
School Enrollment by Age by Funding Source in Russellville
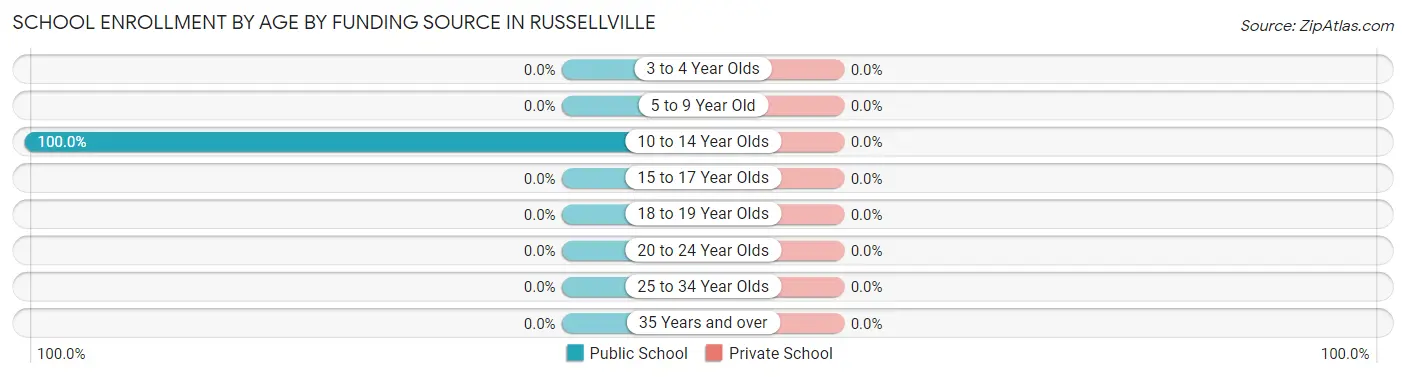
| Age Bracket | Public School | Private School |
| 3 to 4 Year Olds | 0 (0.0%) | 0 (0.0%) |
| 5 to 9 Year Old | 0 (0.0%) | 0 (0.0%) |
| 10 to 14 Year Olds | 4 (100.0%) | 0 (0.0%) |
| 15 to 17 Year Olds | 0 (0.0%) | 0 (0.0%) |
| 18 to 19 Year Olds | 0 (0.0%) | 0 (0.0%) |
| 20 to 24 Year Olds | 0 (0.0%) | 0 (0.0%) |
| 25 to 34 Year Olds | 0 (0.0%) | 0 (0.0%) |
| 35 Years and over | 0 (0.0%) | 0 (0.0%) |
| Total | 4 (100.0%) | 0 (0.0%) |
Educational Attainment by Field of Study in Russellville
, and education (1 | 100.0%) are the most common fields of study among 1 individuals in Russellville who have obtained a bachelor's degree or higher.
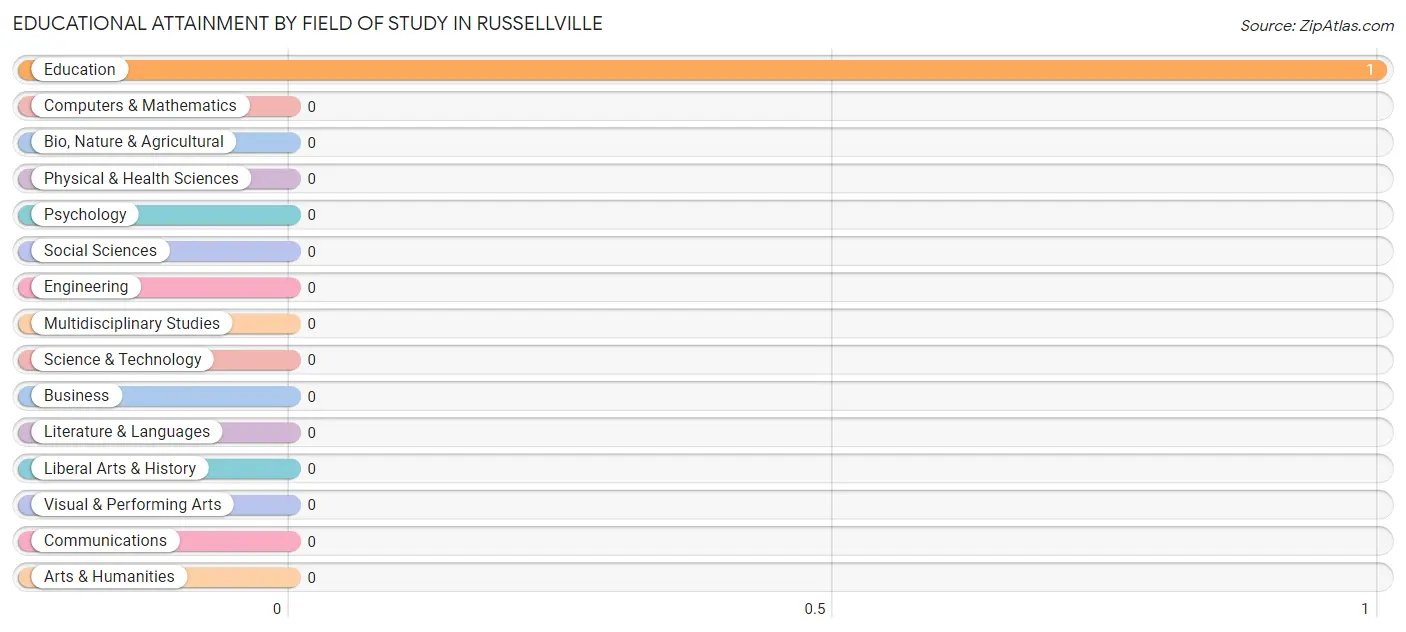
| Field of Study | # Graduates | % Graduates |
| Computers & Mathematics | 0 | 0.0% |
| Bio, Nature & Agricultural | 0 | 0.0% |
| Physical & Health Sciences | 0 | 0.0% |
| Psychology | 0 | 0.0% |
| Social Sciences | 0 | 0.0% |
| Engineering | 0 | 0.0% |
| Multidisciplinary Studies | 0 | 0.0% |
| Science & Technology | 0 | 0.0% |
| Business | 0 | 0.0% |
| Education | 1 | 100.0% |
| Literature & Languages | 0 | 0.0% |
| Liberal Arts & History | 0 | 0.0% |
| Visual & Performing Arts | 0 | 0.0% |
| Communications | 0 | 0.0% |
| Arts & Humanities | 0 | 0.0% |
| Total | 1 | 100.0% |
Transportation & Commute in Russellville
Vehicle Availability by Sex in Russellville
The most prevalent vehicle ownership categories in Russellville are males with 3 vehicles (29, accounting for 76.3%) and females with 3 vehicles (0, making up 966.7%).
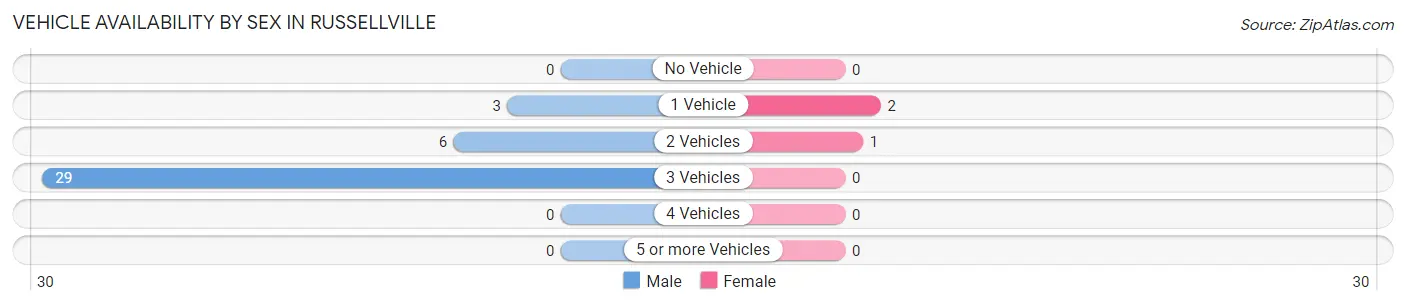
| Vehicles Available | Male | Female |
| No Vehicle | 0 (0.0%) | 0 (0.0%) |
| 1 Vehicle | 3 (7.9%) | 2 (66.7%) |
| 2 Vehicles | 6 (15.8%) | 1 (33.3%) |
| 3 Vehicles | 29 (76.3%) | 0 (0.0%) |
| 4 Vehicles | 0 (0.0%) | 0 (0.0%) |
| 5 or more Vehicles | 0 (0.0%) | 0 (0.0%) |
| Total | 38 (100.0%) | 3 (100.0%) |
Commute Time in Russellville
The most frequently occuring commute durations in Russellville are 25 to 29 minutes (29 commuters, 70.7%), 20 to 24 minutes (10 commuters, 24.4%), and 10 to 14 minutes (1 commuters, 2.4%).
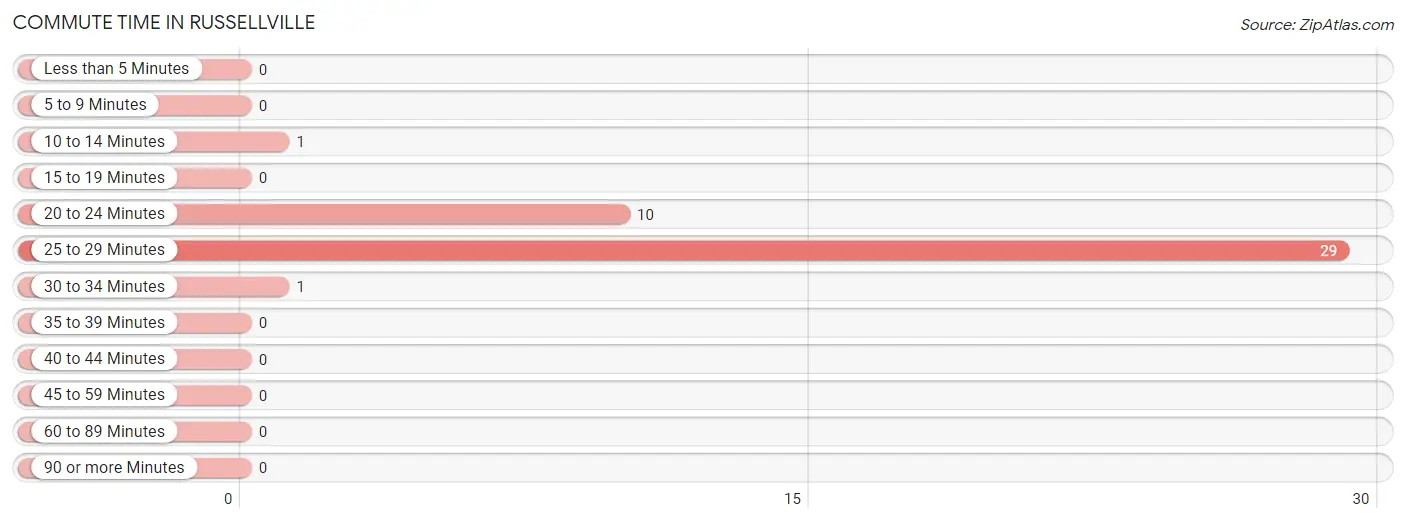
| Commute Time | # Commuters | % Commuters |
| Less than 5 Minutes | 0 | 0.0% |
| 5 to 9 Minutes | 0 | 0.0% |
| 10 to 14 Minutes | 1 | 2.4% |
| 15 to 19 Minutes | 0 | 0.0% |
| 20 to 24 Minutes | 10 | 24.4% |
| 25 to 29 Minutes | 29 | 70.7% |
| 30 to 34 Minutes | 1 | 2.4% |
| 35 to 39 Minutes | 0 | 0.0% |
| 40 to 44 Minutes | 0 | 0.0% |
| 45 to 59 Minutes | 0 | 0.0% |
| 60 to 89 Minutes | 0 | 0.0% |
| 90 or more Minutes | 0 | 0.0% |
Commute Time by Sex in Russellville
The most common commute times in Russellville are 25 to 29 minutes (29 commuters, 76.3%) for males and 20 to 24 minutes (3 commuters, 100.0%) for females.
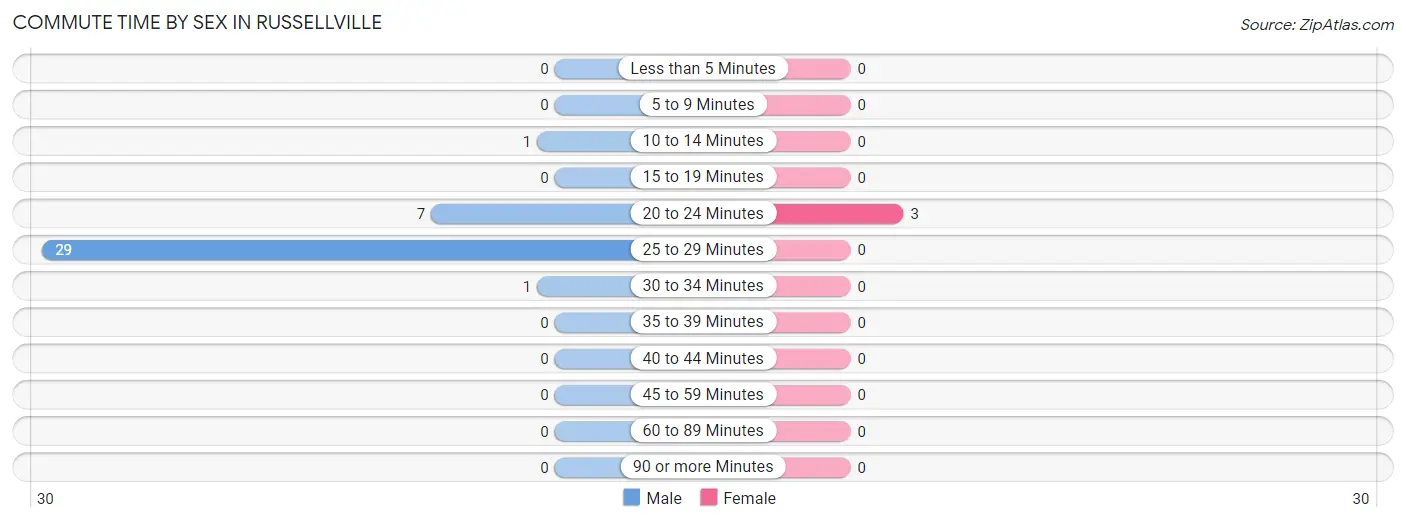
| Commute Time | Male | Female |
| Less than 5 Minutes | 0 (0.0%) | 0 (0.0%) |
| 5 to 9 Minutes | 0 (0.0%) | 0 (0.0%) |
| 10 to 14 Minutes | 1 (2.6%) | 0 (0.0%) |
| 15 to 19 Minutes | 0 (0.0%) | 0 (0.0%) |
| 20 to 24 Minutes | 7 (18.4%) | 3 (100.0%) |
| 25 to 29 Minutes | 29 (76.3%) | 0 (0.0%) |
| 30 to 34 Minutes | 1 (2.6%) | 0 (0.0%) |
| 35 to 39 Minutes | 0 (0.0%) | 0 (0.0%) |
| 40 to 44 Minutes | 0 (0.0%) | 0 (0.0%) |
| 45 to 59 Minutes | 0 (0.0%) | 0 (0.0%) |
| 60 to 89 Minutes | 0 (0.0%) | 0 (0.0%) |
| 90 or more Minutes | 0 (0.0%) | 0 (0.0%) |
Time of Departure to Work by Sex in Russellville
The most frequent times of departure to work in Russellville are 11:00 AM to 11:59 AM (18, 47.4%) for males and 5:00 AM to 5:29 AM (2, 66.7%) for females.
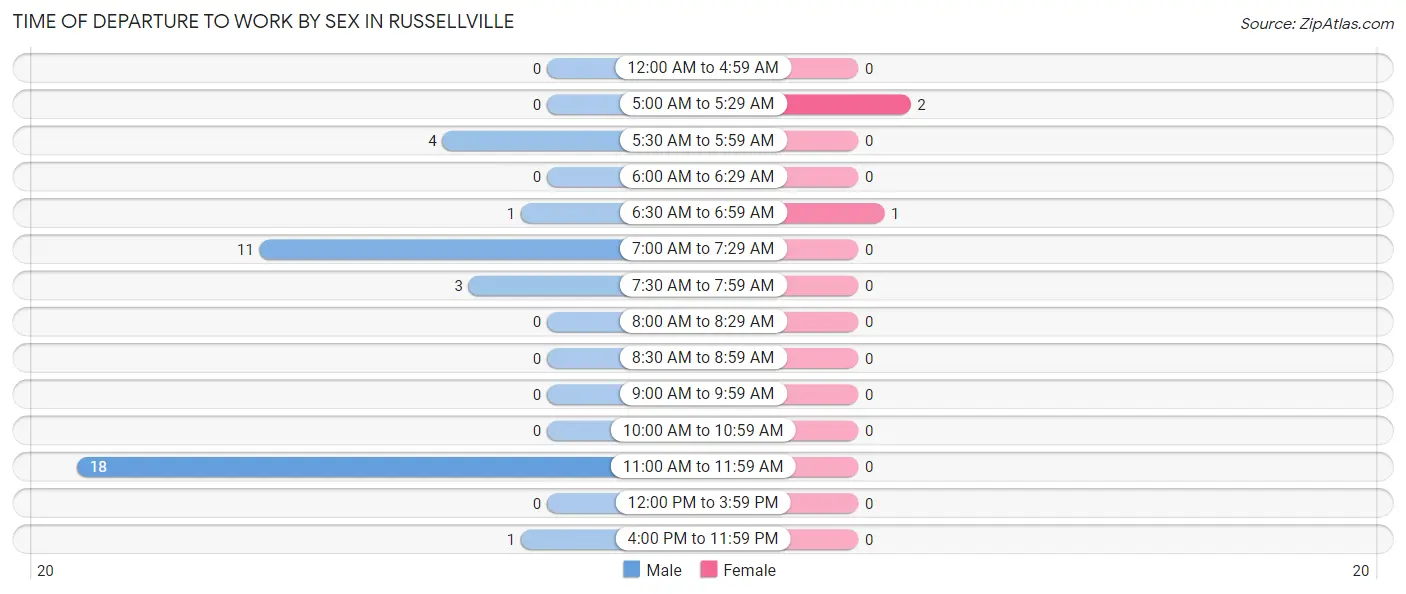
| Time of Departure | Male | Female |
| 12:00 AM to 4:59 AM | 0 (0.0%) | 0 (0.0%) |
| 5:00 AM to 5:29 AM | 0 (0.0%) | 2 (66.7%) |
| 5:30 AM to 5:59 AM | 4 (10.5%) | 0 (0.0%) |
| 6:00 AM to 6:29 AM | 0 (0.0%) | 0 (0.0%) |
| 6:30 AM to 6:59 AM | 1 (2.6%) | 1 (33.3%) |
| 7:00 AM to 7:29 AM | 11 (28.9%) | 0 (0.0%) |
| 7:30 AM to 7:59 AM | 3 (7.9%) | 0 (0.0%) |
| 8:00 AM to 8:29 AM | 0 (0.0%) | 0 (0.0%) |
| 8:30 AM to 8:59 AM | 0 (0.0%) | 0 (0.0%) |
| 9:00 AM to 9:59 AM | 0 (0.0%) | 0 (0.0%) |
| 10:00 AM to 10:59 AM | 0 (0.0%) | 0 (0.0%) |
| 11:00 AM to 11:59 AM | 18 (47.4%) | 0 (0.0%) |
| 12:00 PM to 3:59 PM | 0 (0.0%) | 0 (0.0%) |
| 4:00 PM to 11:59 PM | 1 (2.6%) | 0 (0.0%) |
| Total | 38 (100.0%) | 3 (100.0%) |
Housing Occupancy in Russellville
Occupancy by Ownership in Russellville
Of the total 30 dwellings in Russellville, owner-occupied units account for 21 (70.0%), while renter-occupied units make up 9 (30.0%).
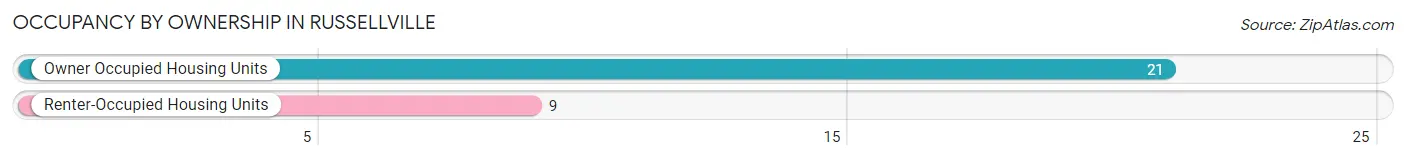
| Occupancy | # Housing Units | % Housing Units |
| Owner Occupied Housing Units | 21 | 70.0% |
| Renter-Occupied Housing Units | 9 | 30.0% |
| Total Occupied Housing Units | 30 | 100.0% |
Occupancy by Household Size in Russellville
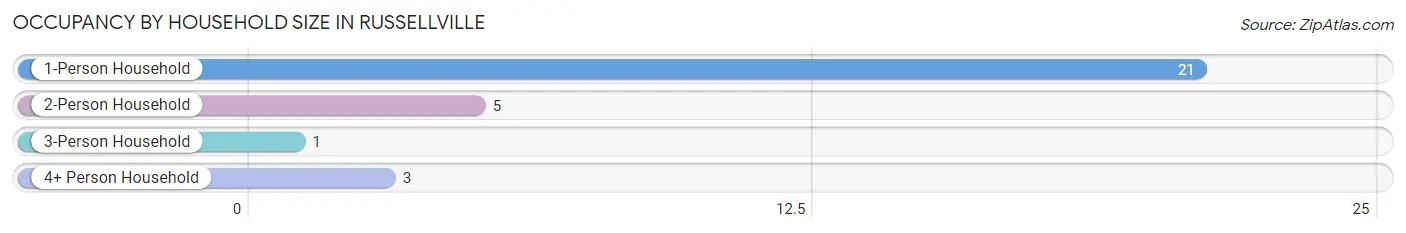
| Household Size | # Housing Units | % Housing Units |
| 1-Person Household | 21 | 70.0% |
| 2-Person Household | 5 | 16.7% |
| 3-Person Household | 1 | 3.3% |
| 4+ Person Household | 3 | 10.0% |
| Total Housing Units | 30 | 100.0% |
Occupancy by Ownership by Household Size in Russellville
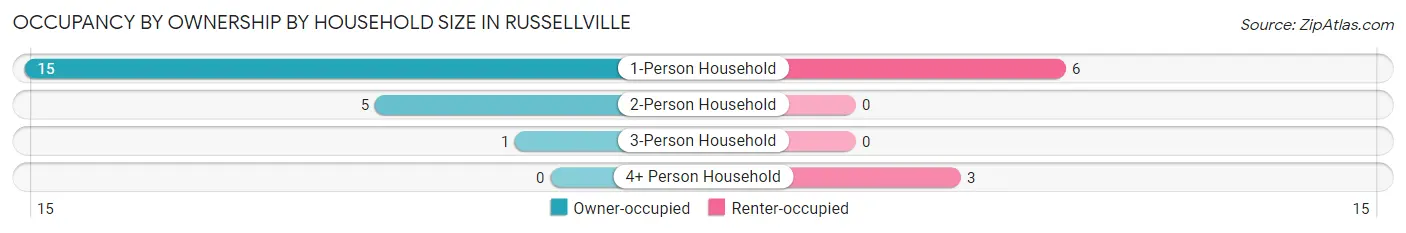
| Household Size | Owner-occupied | Renter-occupied |
| 1-Person Household | 15 (71.4%) | 6 (28.6%) |
| 2-Person Household | 5 (100.0%) | 0 (0.0%) |
| 3-Person Household | 1 (100.0%) | 0 (0.0%) |
| 4+ Person Household | 0 (0.0%) | 3 (100.0%) |
| Total Housing Units | 21 (70.0%) | 9 (30.0%) |
Occupancy by Educational Attainment in Russellville
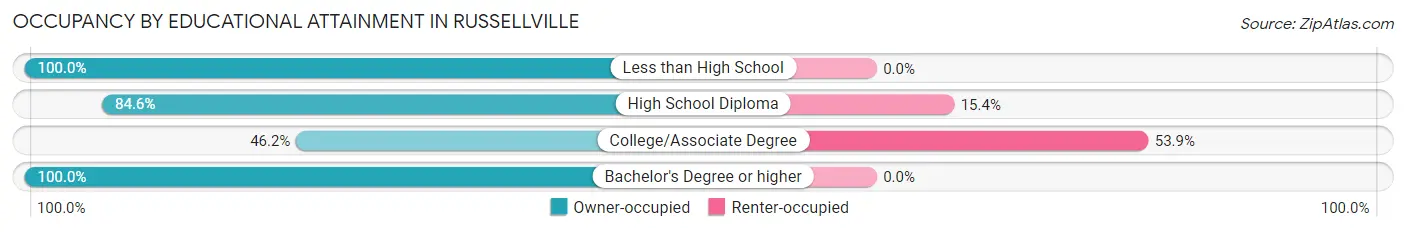
| Household Size | Owner-occupied | Renter-occupied |
| Less than High School | 3 (100.0%) | 0 (0.0%) |
| High School Diploma | 11 (84.6%) | 2 (15.4%) |
| College/Associate Degree | 6 (46.2%) | 7 (53.8%) |
| Bachelor's Degree or higher | 1 (100.0%) | 0 (0.0%) |
Occupancy by Age of Householder in Russellville
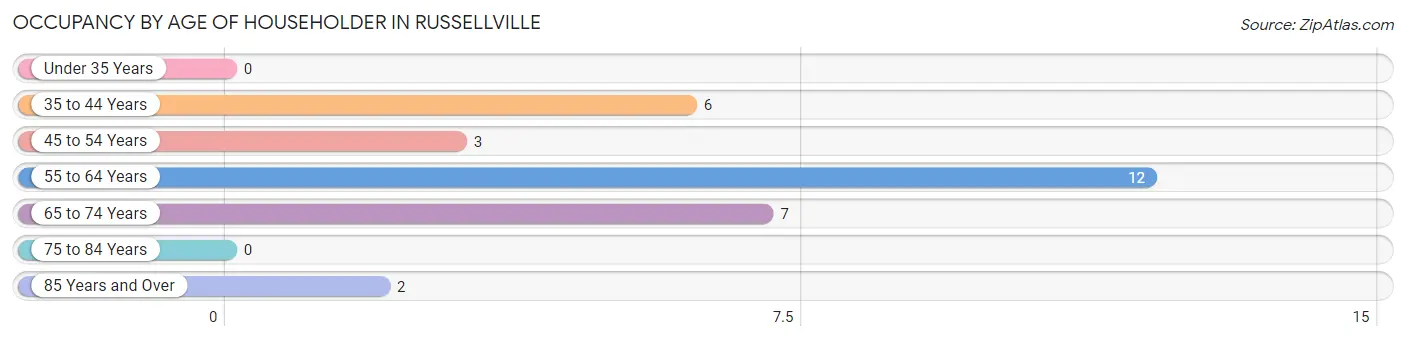
| Age Bracket | # Households | % Households |
| Under 35 Years | 0 | 0.0% |
| 35 to 44 Years | 6 | 20.0% |
| 45 to 54 Years | 3 | 10.0% |
| 55 to 64 Years | 12 | 40.0% |
| 65 to 74 Years | 7 | 23.3% |
| 75 to 84 Years | 0 | 0.0% |
| 85 Years and Over | 2 | 6.7% |
| Total | 30 | 100.0% |
Housing Finances in Russellville
Median Income by Occupancy in Russellville
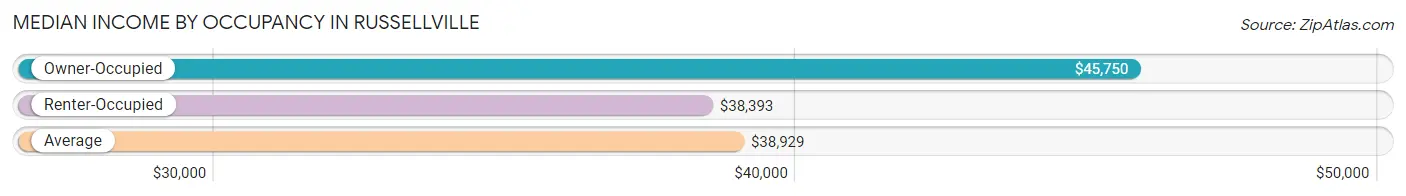
| Occupancy Type | # Households | Median Income |
| Owner-Occupied | 21 (70.0%) | $45,750 |
| Renter-Occupied | 9 (30.0%) | $38,393 |
| Average | 30 (100.0%) | $38,929 |
Occupancy by Householder Income Bracket in Russellville
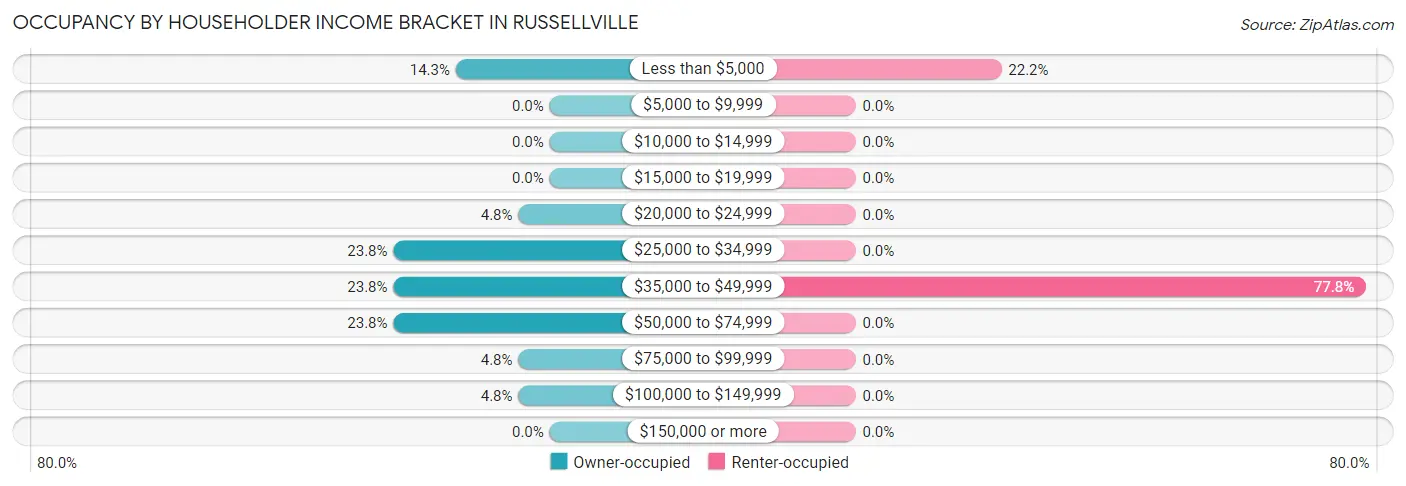
| Income Bracket | Owner-occupied | Renter-occupied |
| Less than $5,000 | 3 (14.3%) | 2 (22.2%) |
| $5,000 to $9,999 | 0 (0.0%) | 0 (0.0%) |
| $10,000 to $14,999 | 0 (0.0%) | 0 (0.0%) |
| $15,000 to $19,999 | 0 (0.0%) | 0 (0.0%) |
| $20,000 to $24,999 | 1 (4.8%) | 0 (0.0%) |
| $25,000 to $34,999 | 5 (23.8%) | 0 (0.0%) |
| $35,000 to $49,999 | 5 (23.8%) | 7 (77.8%) |
| $50,000 to $74,999 | 5 (23.8%) | 0 (0.0%) |
| $75,000 to $99,999 | 1 (4.8%) | 0 (0.0%) |
| $100,000 to $149,999 | 1 (4.8%) | 0 (0.0%) |
| $150,000 or more | 0 (0.0%) | 0 (0.0%) |
| Total | 21 (100.0%) | 9 (100.0%) |
Monthly Housing Cost Tiers in Russellville
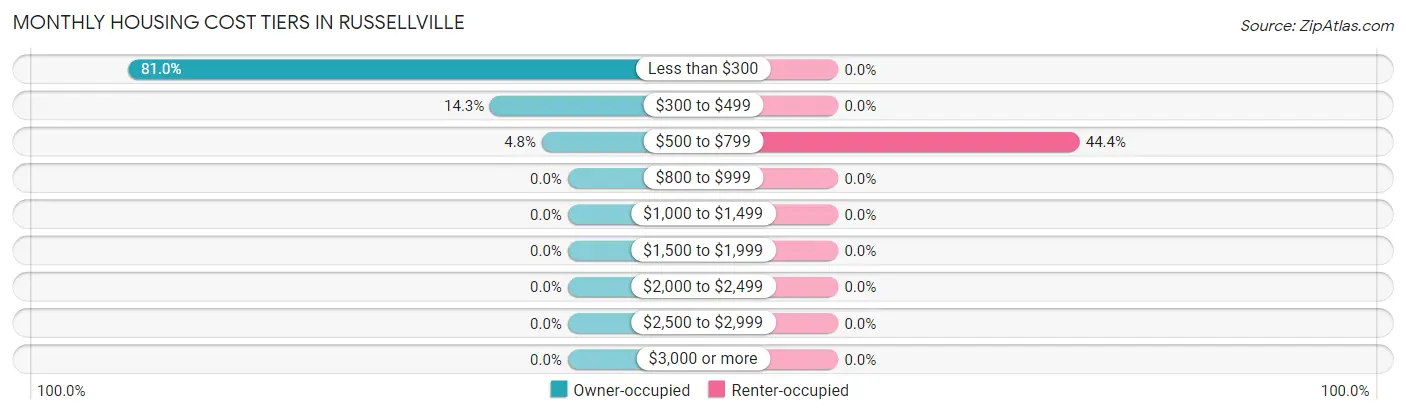
| Monthly Cost | Owner-occupied | Renter-occupied |
| Less than $300 | 17 (80.9%) | 0 (0.0%) |
| $300 to $499 | 3 (14.3%) | 0 (0.0%) |
| $500 to $799 | 1 (4.8%) | 4 (44.4%) |
| $800 to $999 | 0 (0.0%) | 0 (0.0%) |
| $1,000 to $1,499 | 0 (0.0%) | 0 (0.0%) |
| $1,500 to $1,999 | 0 (0.0%) | 0 (0.0%) |
| $2,000 to $2,499 | 0 (0.0%) | 0 (0.0%) |
| $2,500 to $2,999 | 0 (0.0%) | 0 (0.0%) |
| $3,000 or more | 0 (0.0%) | 0 (0.0%) |
| Total | 21 (100.0%) | 9 (100.0%) |
Physical Housing Characteristics in Russellville
Housing Structures in Russellville
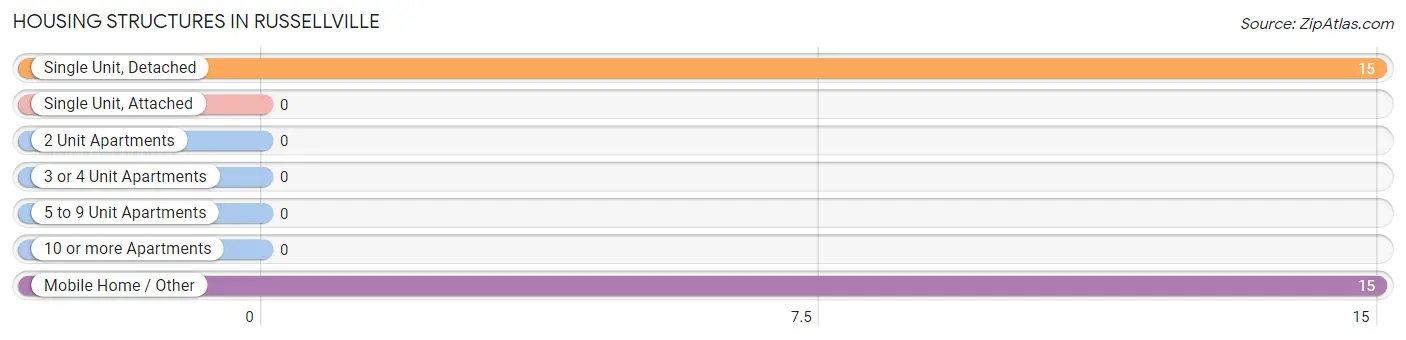
| Structure Type | # Housing Units | % Housing Units |
| Single Unit, Detached | 15 | 50.0% |
| Single Unit, Attached | 0 | 0.0% |
| 2 Unit Apartments | 0 | 0.0% |
| 3 or 4 Unit Apartments | 0 | 0.0% |
| 5 to 9 Unit Apartments | 0 | 0.0% |
| 10 or more Apartments | 0 | 0.0% |
| Mobile Home / Other | 15 | 50.0% |
| Total | 30 | 100.0% |
Housing Structures by Occupancy in Russellville
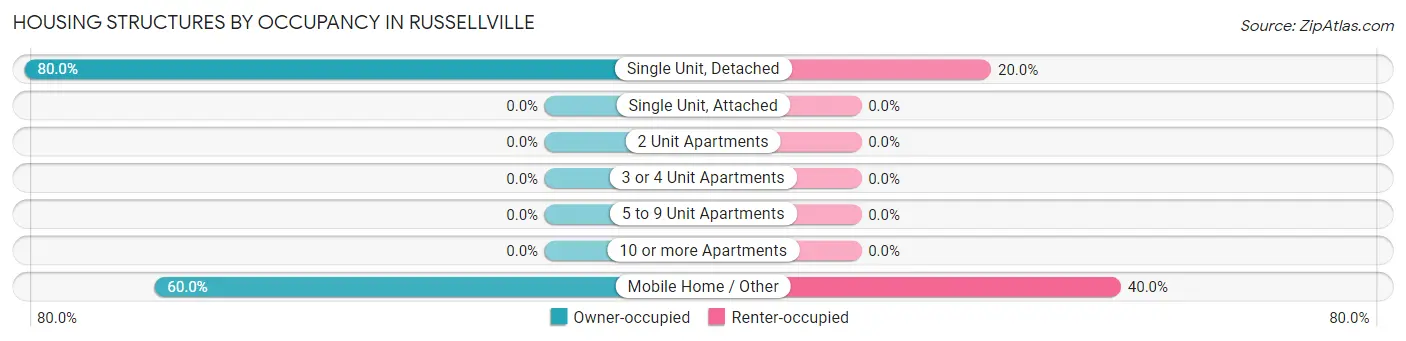
| Structure Type | Owner-occupied | Renter-occupied |
| Single Unit, Detached | 12 (80.0%) | 3 (20.0%) |
| Single Unit, Attached | 0 (0.0%) | 0 (0.0%) |
| 2 Unit Apartments | 0 (0.0%) | 0 (0.0%) |
| 3 or 4 Unit Apartments | 0 (0.0%) | 0 (0.0%) |
| 5 to 9 Unit Apartments | 0 (0.0%) | 0 (0.0%) |
| 10 or more Apartments | 0 (0.0%) | 0 (0.0%) |
| Mobile Home / Other | 9 (60.0%) | 6 (40.0%) |
| Total | 21 (70.0%) | 9 (30.0%) |
Housing Structures by Number of Rooms in Russellville
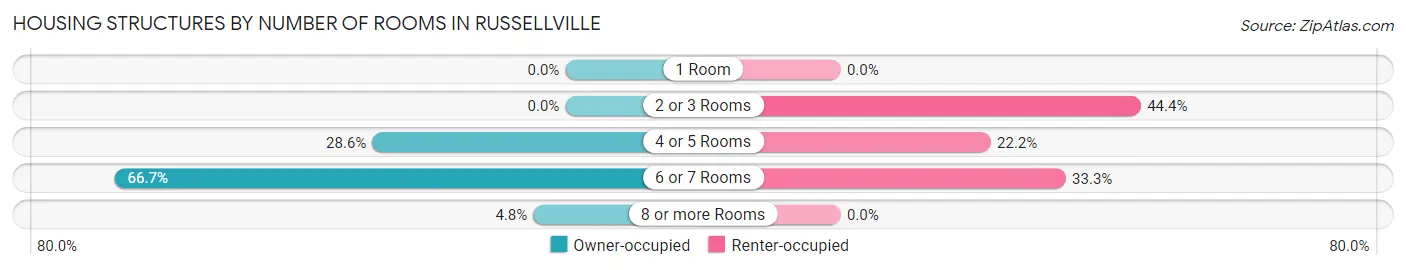
| Number of Rooms | Owner-occupied | Renter-occupied |
| 1 Room | 0 (0.0%) | 0 (0.0%) |
| 2 or 3 Rooms | 0 (0.0%) | 4 (44.4%) |
| 4 or 5 Rooms | 6 (28.6%) | 2 (22.2%) |
| 6 or 7 Rooms | 14 (66.7%) | 3 (33.3%) |
| 8 or more Rooms | 1 (4.8%) | 0 (0.0%) |
| Total | 21 (100.0%) | 9 (100.0%) |
Housing Structure by Heating Type in Russellville
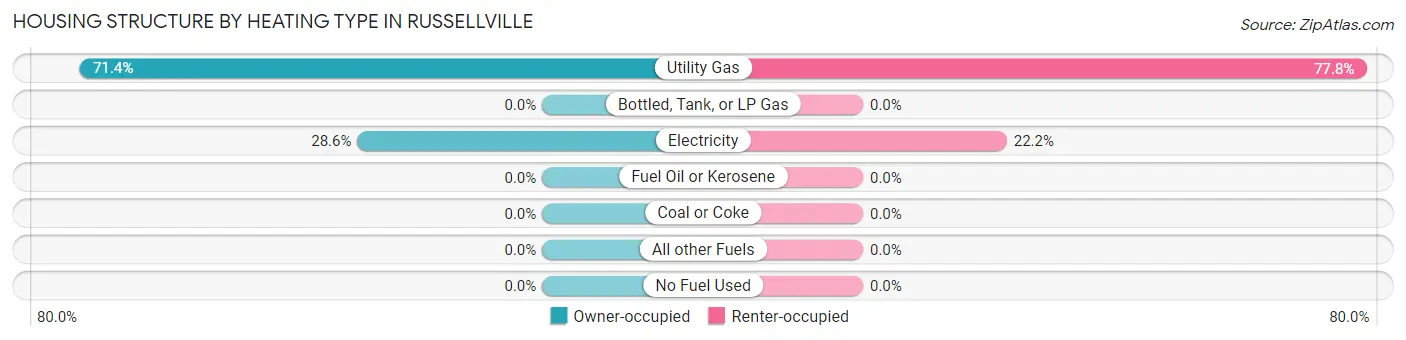
| Heating Type | Owner-occupied | Renter-occupied |
| Utility Gas | 15 (71.4%) | 7 (77.8%) |
| Bottled, Tank, or LP Gas | 0 (0.0%) | 0 (0.0%) |
| Electricity | 6 (28.6%) | 2 (22.2%) |
| Fuel Oil or Kerosene | 0 (0.0%) | 0 (0.0%) |
| Coal or Coke | 0 (0.0%) | 0 (0.0%) |
| All other Fuels | 0 (0.0%) | 0 (0.0%) |
| No Fuel Used | 0 (0.0%) | 0 (0.0%) |
| Total | 21 (100.0%) | 9 (100.0%) |
Household Vehicle Usage in Russellville
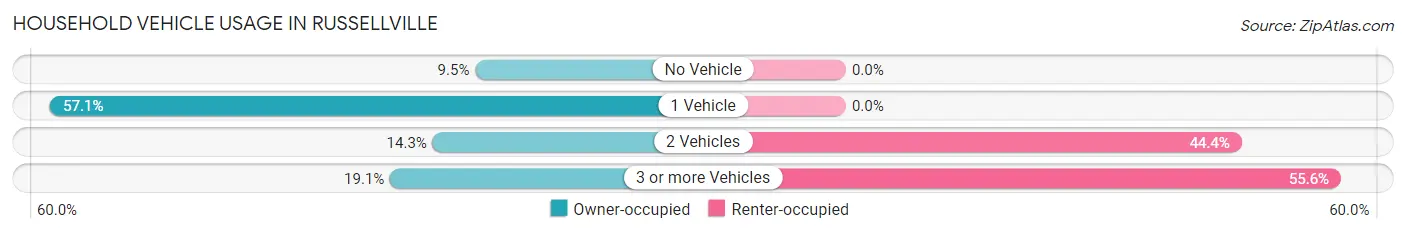
| Vehicles per Household | Owner-occupied | Renter-occupied |
| No Vehicle | 2 (9.5%) | 0 (0.0%) |
| 1 Vehicle | 12 (57.1%) | 0 (0.0%) |
| 2 Vehicles | 3 (14.3%) | 4 (44.4%) |
| 3 or more Vehicles | 4 (19.1%) | 5 (55.6%) |
| Total | 21 (100.0%) | 9 (100.0%) |
Real Estate & Mortgages in Russellville
Real Estate and Mortgage Overview in Russellville
| Characteristic | Without Mortgage | With Mortgage |
| Housing Units | 21 | 0 |
| Median Property Value | $43,500 | $0 |
| Median Household Income | $45,750 | $0 |
| Monthly Housing Costs | $243 | $0 |
| Real Estate Taxes | $567 | $0 |
Property Value by Mortgage Status in Russellville
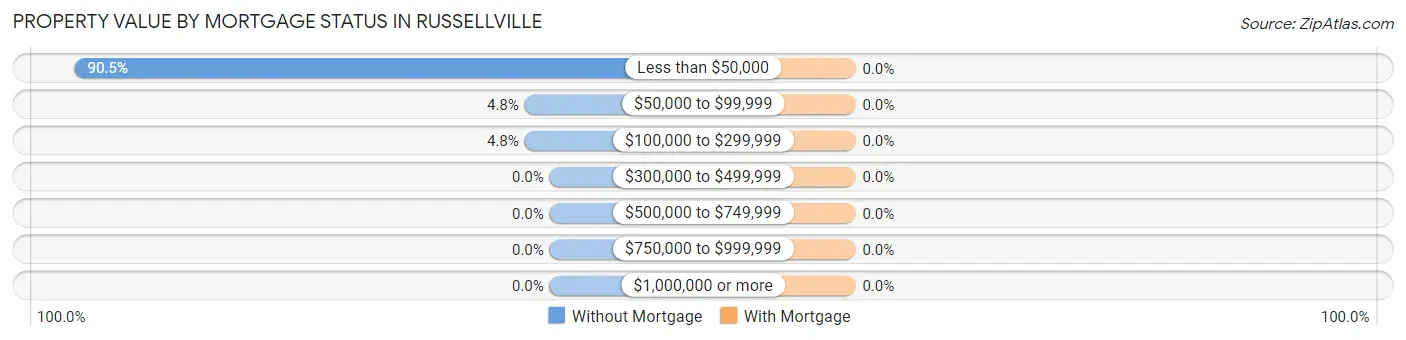
| Property Value | Without Mortgage | With Mortgage |
| Less than $50,000 | 19 (90.5%) | 0 (0.0%) |
| $50,000 to $99,999 | 1 (4.8%) | 0 (0.0%) |
| $100,000 to $299,999 | 1 (4.8%) | 0 (0.0%) |
| $300,000 to $499,999 | 0 (0.0%) | 0 (0.0%) |
| $500,000 to $749,999 | 0 (0.0%) | 0 (0.0%) |
| $750,000 to $999,999 | 0 (0.0%) | 0 (0.0%) |
| $1,000,000 or more | 0 (0.0%) | 0 (0.0%) |
| Total | 21 (100.0%) | 0 (0.0%) |
Household Income by Mortgage Status in Russellville
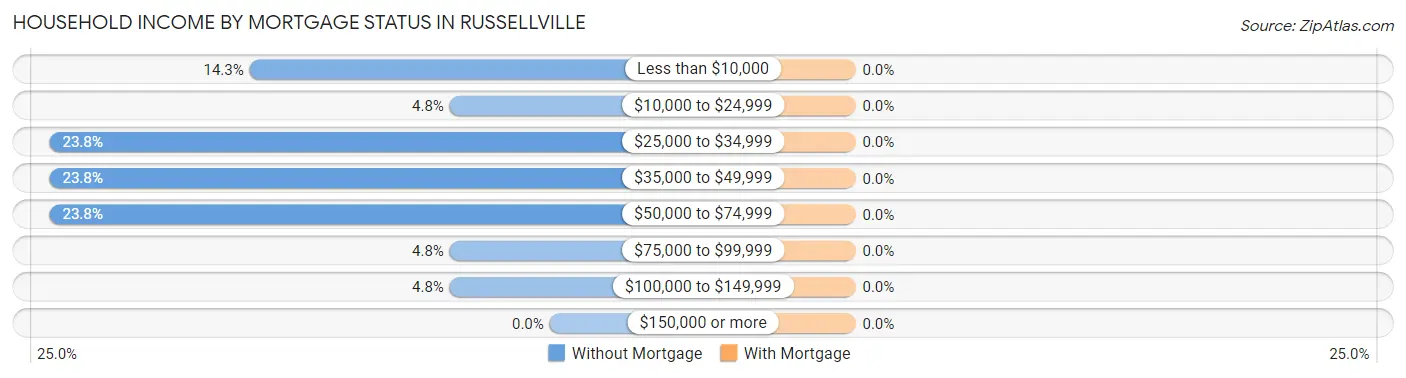
| Household Income | Without Mortgage | With Mortgage |
| Less than $10,000 | 3 (14.3%) | 0 (0.0%) |
| $10,000 to $24,999 | 1 (4.8%) | 0 (0.0%) |
| $25,000 to $34,999 | 5 (23.8%) | 0 (0.0%) |
| $35,000 to $49,999 | 5 (23.8%) | 0 (0.0%) |
| $50,000 to $74,999 | 5 (23.8%) | 0 (0.0%) |
| $75,000 to $99,999 | 1 (4.8%) | 0 (0.0%) |
| $100,000 to $149,999 | 1 (4.8%) | 0 (0.0%) |
| $150,000 or more | 0 (0.0%) | 0 (0.0%) |
| Total | 21 (100.0%) | 0 (0.0%) |
Property Value to Household Income Ratio in Russellville
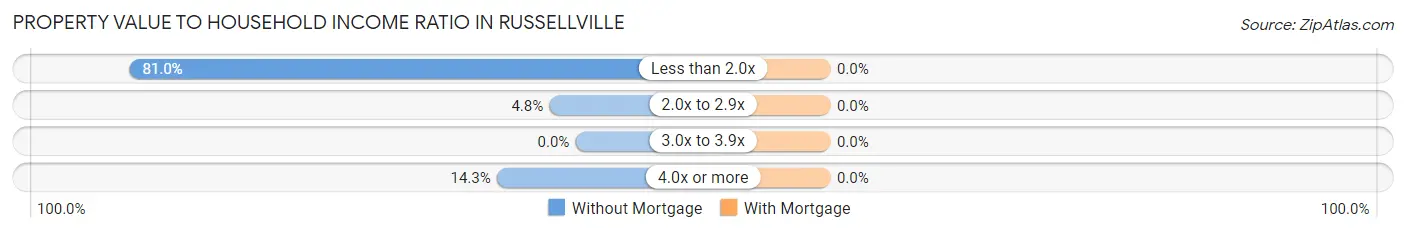
| Value-to-Income Ratio | Without Mortgage | With Mortgage |
| Less than 2.0x | 17 (80.9%) | 0 (0.0%) |
| 2.0x to 2.9x | 1 (4.8%) | 0 (0.0%) |
| 3.0x to 3.9x | 0 (0.0%) | 0 (0.0%) |
| 4.0x or more | 3 (14.3%) | 0 (0.0%) |
| Total | 21 (100.0%) | 0 (0.0%) |
Real Estate Taxes by Mortgage Status in Russellville
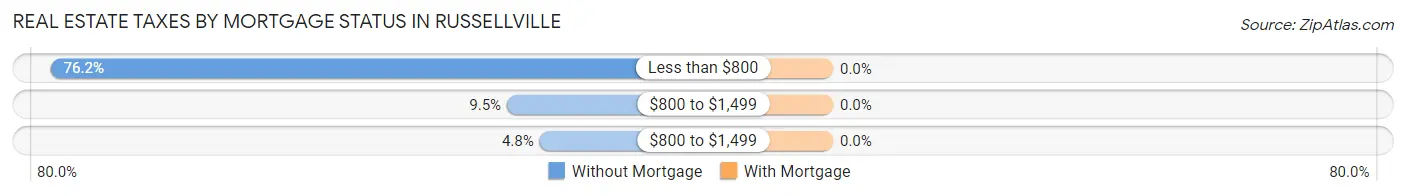
| Property Taxes | Without Mortgage | With Mortgage |
| Less than $800 | 16 (76.2%) | 0 (0.0%) |
| $800 to $1,499 | 2 (9.5%) | 0 (0.0%) |
| $800 to $1,499 | 1 (4.8%) | 0 (0.0%) |
| Total | 21 (100.0%) | 0 (0.0%) |
Health & Disability in Russellville
Health Insurance Coverage by Age in Russellville
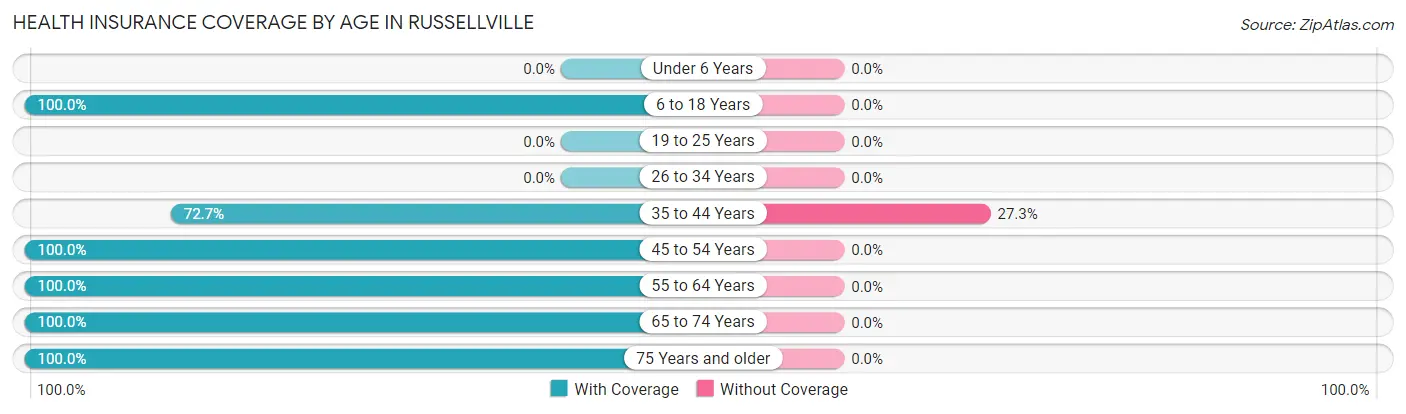
| Age Bracket | With Coverage | Without Coverage |
| Under 6 Years | 0 (0.0%) | 0 (0.0%) |
| 6 to 18 Years | 22 (100.0%) | 0 (0.0%) |
| 19 to 25 Years | 0 (0.0%) | 0 (0.0%) |
| 26 to 34 Years | 0 (0.0%) | 0 (0.0%) |
| 35 to 44 Years | 8 (72.7%) | 3 (27.3%) |
| 45 to 54 Years | 14 (100.0%) | 0 (0.0%) |
| 55 to 64 Years | 13 (100.0%) | 0 (0.0%) |
| 65 to 74 Years | 9 (100.0%) | 0 (0.0%) |
| 75 Years and older | 5 (100.0%) | 0 (0.0%) |
| Total | 71 (96.0%) | 3 (4.1%) |
Health Insurance Coverage by Citizenship Status in Russellville
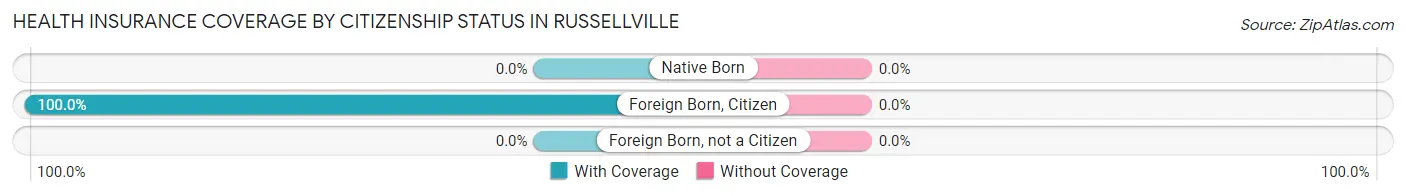
| Citizenship Status | With Coverage | Without Coverage |
| Native Born | 0 (0.0%) | 0 (0.0%) |
| Foreign Born, Citizen | 22 (100.0%) | 0 (0.0%) |
| Foreign Born, not a Citizen | 0 (0.0%) | 0 (0.0%) |
Health Insurance Coverage by Household Income in Russellville
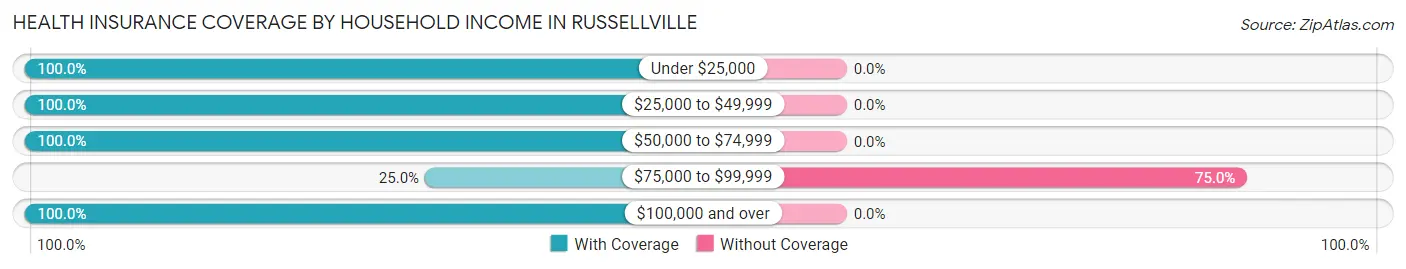
| Household Income | With Coverage | Without Coverage |
| Under $25,000 | 7 (100.0%) | 0 (0.0%) |
| $25,000 to $49,999 | 50 (100.0%) | 0 (0.0%) |
| $50,000 to $74,999 | 8 (100.0%) | 0 (0.0%) |
| $75,000 to $99,999 | 1 (25.0%) | 3 (75.0%) |
| $100,000 and over | 5 (100.0%) | 0 (0.0%) |
Public vs Private Health Insurance Coverage by Age in Russellville
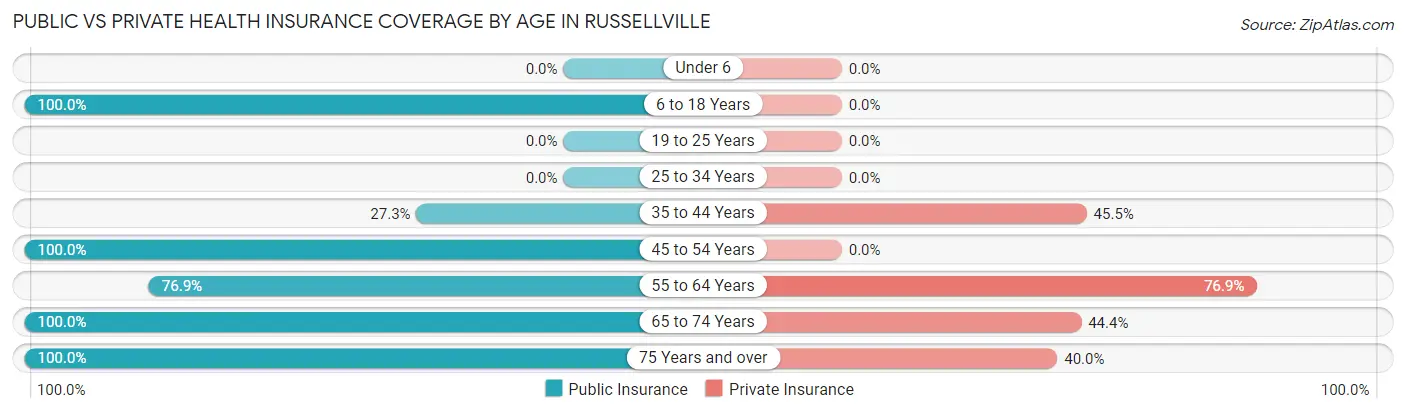
| Age Bracket | Public Insurance | Private Insurance |
| Under 6 | 0 (0.0%) | 0 (0.0%) |
| 6 to 18 Years | 22 (100.0%) | 0 (0.0%) |
| 19 to 25 Years | 0 (0.0%) | 0 (0.0%) |
| 25 to 34 Years | 0 (0.0%) | 0 (0.0%) |
| 35 to 44 Years | 3 (27.3%) | 5 (45.5%) |
| 45 to 54 Years | 14 (100.0%) | 0 (0.0%) |
| 55 to 64 Years | 10 (76.9%) | 10 (76.9%) |
| 65 to 74 Years | 9 (100.0%) | 4 (44.4%) |
| 75 Years and over | 5 (100.0%) | 2 (40.0%) |
| Total | 63 (85.1%) | 21 (28.4%) |
Disability Status by Sex by Age in Russellville
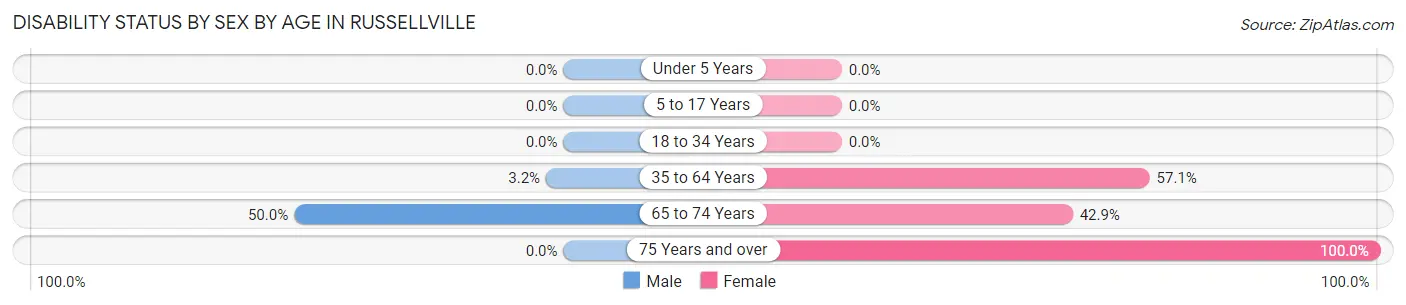
| Age Bracket | Male | Female |
| Under 5 Years | 0 (0.0%) | 0 (0.0%) |
| 5 to 17 Years | 0 (0.0%) | 0 (0.0%) |
| 18 to 34 Years | 0 (0.0%) | 0 (0.0%) |
| 35 to 64 Years | 1 (3.2%) | 4 (57.1%) |
| 65 to 74 Years | 1 (50.0%) | 3 (42.9%) |
| 75 Years and over | 0 (0.0%) | 5 (100.0%) |
Disability Class by Sex by Age in Russellville
Disability Class: Hearing Difficulty
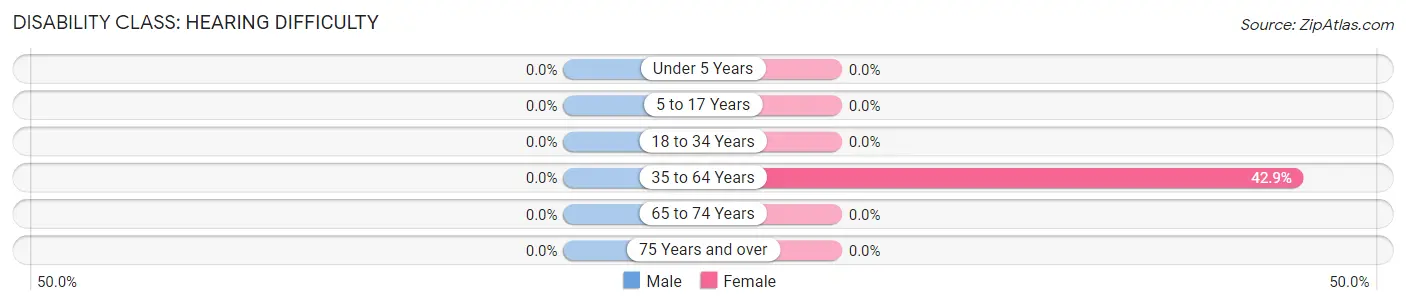
| Age Bracket | Male | Female |
| Under 5 Years | 0 (0.0%) | 0 (0.0%) |
| 5 to 17 Years | 0 (0.0%) | 0 (0.0%) |
| 18 to 34 Years | 0 (0.0%) | 0 (0.0%) |
| 35 to 64 Years | 0 (0.0%) | 3 (42.9%) |
| 65 to 74 Years | 0 (0.0%) | 0 (0.0%) |
| 75 Years and over | 0 (0.0%) | 0 (0.0%) |
Disability Class: Vision Difficulty
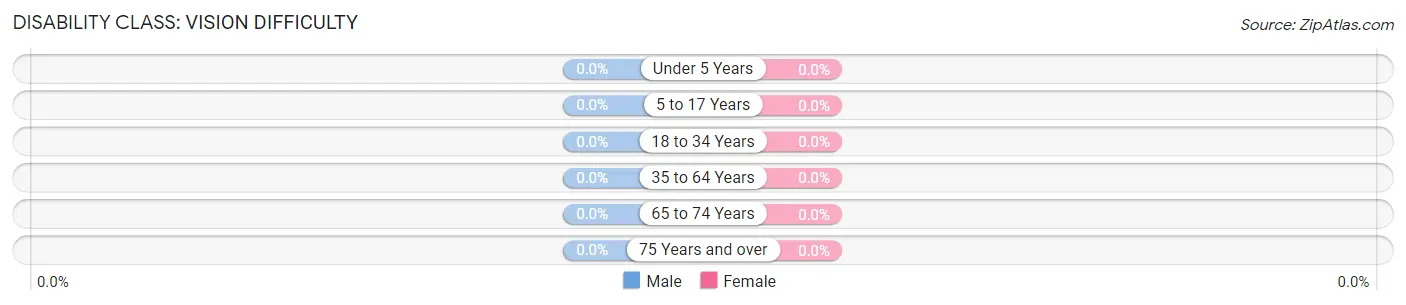
| Age Bracket | Male | Female |
| Under 5 Years | 0 (0.0%) | 0 (0.0%) |
| 5 to 17 Years | 0 (0.0%) | 0 (0.0%) |
| 18 to 34 Years | 0 (0.0%) | 0 (0.0%) |
| 35 to 64 Years | 0 (0.0%) | 0 (0.0%) |
| 65 to 74 Years | 0 (0.0%) | 0 (0.0%) |
| 75 Years and over | 0 (0.0%) | 0 (0.0%) |
Disability Class: Cognitive Difficulty
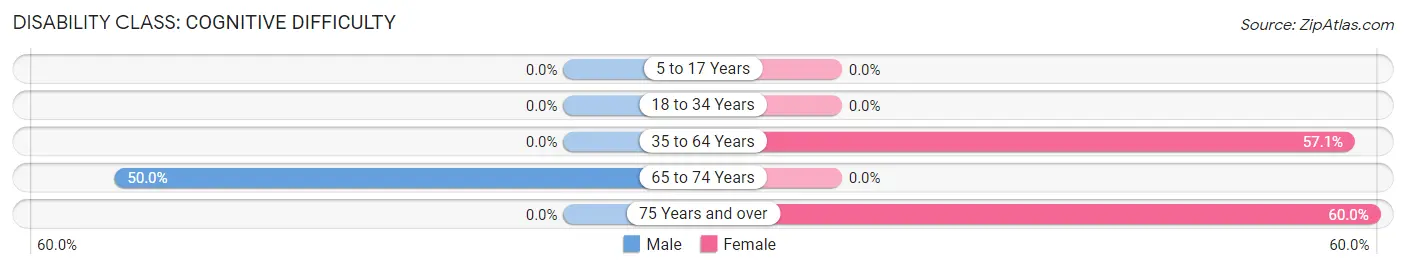
| Age Bracket | Male | Female |
| 5 to 17 Years | 0 (0.0%) | 0 (0.0%) |
| 18 to 34 Years | 0 (0.0%) | 0 (0.0%) |
| 35 to 64 Years | 0 (0.0%) | 4 (57.1%) |
| 65 to 74 Years | 1 (50.0%) | 0 (0.0%) |
| 75 Years and over | 0 (0.0%) | 3 (60.0%) |
Disability Class: Ambulatory Difficulty
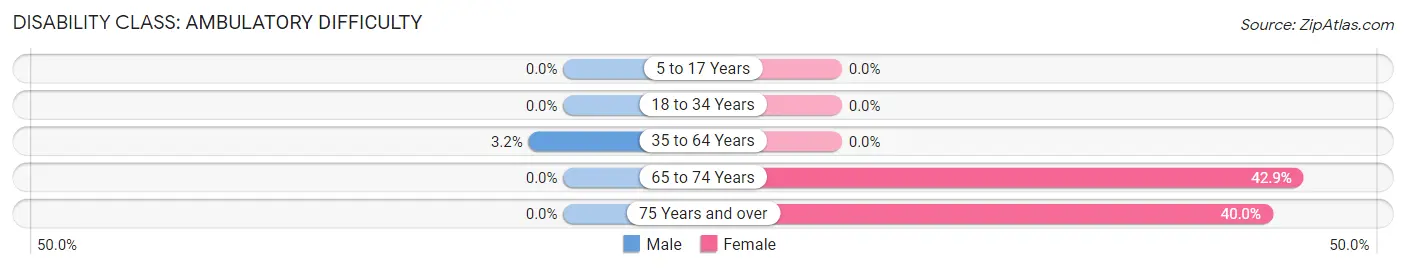
| Age Bracket | Male | Female |
| 5 to 17 Years | 0 (0.0%) | 0 (0.0%) |
| 18 to 34 Years | 0 (0.0%) | 0 (0.0%) |
| 35 to 64 Years | 1 (3.2%) | 0 (0.0%) |
| 65 to 74 Years | 0 (0.0%) | 3 (42.9%) |
| 75 Years and over | 0 (0.0%) | 2 (40.0%) |
Disability Class: Self-Care Difficulty
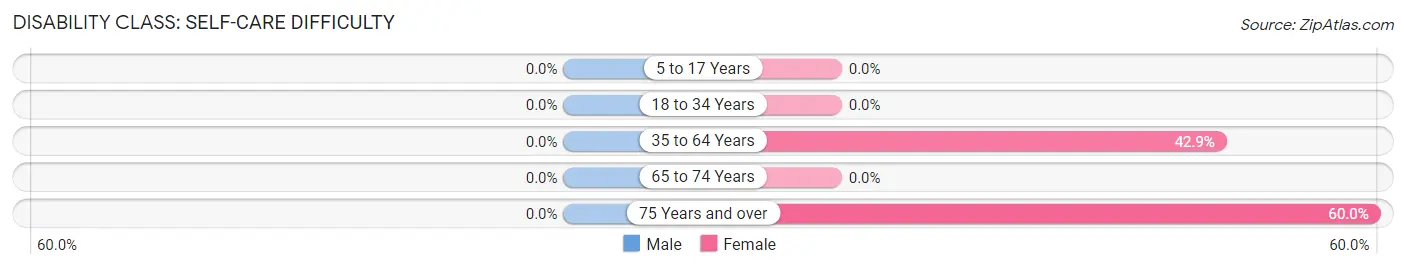
| Age Bracket | Male | Female |
| 5 to 17 Years | 0 (0.0%) | 0 (0.0%) |
| 18 to 34 Years | 0 (0.0%) | 0 (0.0%) |
| 35 to 64 Years | 0 (0.0%) | 3 (42.9%) |
| 65 to 74 Years | 0 (0.0%) | 0 (0.0%) |
| 75 Years and over | 0 (0.0%) | 3 (60.0%) |
Technology Access in Russellville
Computing Device Access in Russellville
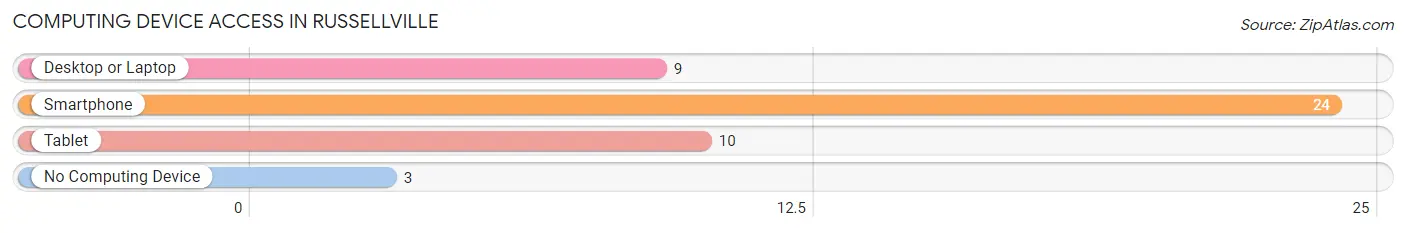
| Device Type | # Households | % Households |
| Desktop or Laptop | 9 | 30.0% |
| Smartphone | 24 | 80.0% |
| Tablet | 10 | 33.3% |
| No Computing Device | 3 | 10.0% |
| Total | 30 | 100.0% |
Internet Access in Russellville
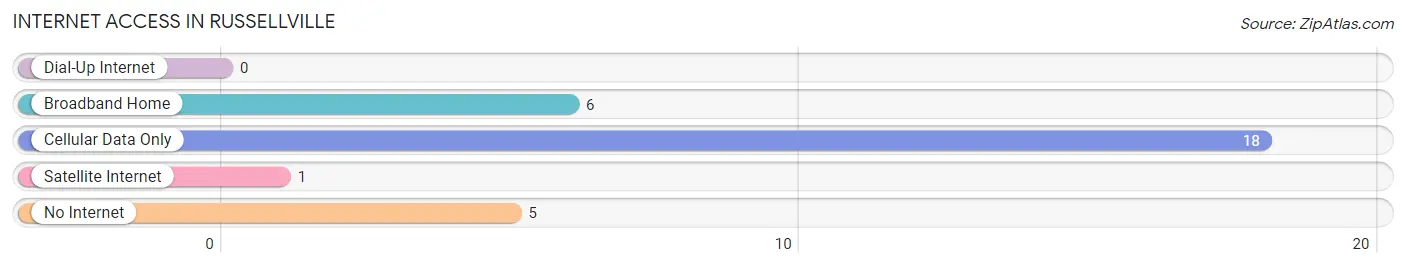
| Internet Type | # Households | % Households |
| Dial-Up Internet | 0 | 0.0% |
| Broadband Home | 6 | 20.0% |
| Cellular Data Only | 18 | 60.0% |
| Satellite Internet | 1 | 3.3% |
| No Internet | 5 | 16.7% |
| Total | 30 | 100.0% |
Russellville Summary
Introduction
Russellville is a small village located in the state of Illinois, in the United States. It is situated in the county of Logan, and is part of the Lincoln-Logan-Menard Combined Statistical Area. The village has a population of around 1,000 people, and is located in the central part of the state. The village is known for its rural charm and its close proximity to the city of Springfield.
History
The village of Russellville was founded in 1854 by a group of settlers from Kentucky. The settlers named the village after their leader, William Russell. The village was originally a farming community, and the settlers grew corn, wheat, and other crops. The village was also home to a number of small businesses, including a blacksmith shop, a general store, and a post office.
In the late 19th century, the village began to grow and develop. The railroad arrived in 1887, and the village was connected to the larger cities of Springfield and Decatur. This allowed for the growth of the village, and it soon became a popular destination for tourists. The village also became a popular spot for hunting and fishing.
In the early 20th century, the village began to decline. The railroad was abandoned, and the village was no longer a popular destination for tourists. The population of the village began to decline, and by the 1950s, the population had dropped to just over 500 people.
Geography
The village of Russellville is located in the central part of the state of Illinois. It is situated in the county of Logan, and is part of the Lincoln-Logan-Menard Combined Statistical Area. The village is located in a rural area, and is surrounded by farmland and woodlands. The village is located near the Sangamon River, and is close to the cities of Springfield and Decatur.
The village has a total area of 0.6 square miles, all of which is land. The village is located at an elevation of 690 feet above sea level. The climate of the village is classified as humid continental, with hot summers and cold winters.
Economy
The economy of Russellville is largely based on agriculture. The village is surrounded by farmland, and the main crops grown in the area are corn, soybeans, and wheat. The village also has a number of small businesses, including a general store, a post office, and a few restaurants.
The village is also home to a number of manufacturing companies, including a plastics factory and a metal fabrication plant. The village is also home to a number of small businesses, including a gas station, a hardware store, and a few other retail stores.
Demographics
As of the 2010 census, the population of Russellville was 1,000 people. The racial makeup of the village was 97.2% White, 0.7% African American, 0.2% Native American, 0.2% Asian, 0.2% from other races, and 1.7% from two or more races. The median household income in the village was $37,500, and the median family income was $45,000.
Conclusion
The village of Russellville is a small rural village located in the state of Illinois. The village has a population of around 1,000 people, and is known for its rural charm and its close proximity to the city of Springfield. The village has a largely agricultural economy, and is home to a number of small businesses. The village has a diverse population, and the median household income is $37,500.
Common Questions
What is Per Capita Income in Russellville?
Per Capita income in Russellville is $23,343.
What is the Median Household income in Russellville?
Median Household Income in Russellville is $38,929.
What is Inequality or Gini Index in Russellville?
Inequality or Gini Index in Russellville is 0.36.
What is the Total Population of Russellville?
Total Population of Russellville is 74.
What is the Total Male Population of Russellville?
Total Male Population of Russellville is 51.
What is the Total Female Population of Russellville?
Total Female Population of Russellville is 23.
What is the Ratio of Males per 100 Females in Russellville?
There are 221.74 Males per 100 Females in Russellville.
What is the Ratio of Females per 100 Males in Russellville?
There are 45.10 Females per 100 Males in Russellville.
What is the Median Population Age in Russellville?
Median Population Age in Russellville is 49.1 Years.
What is the Average Family Size in Russellville
Average Family Size in Russellville is 6.4 People.
What is the Average Household Size in Russellville
Average Household Size in Russellville is 2.5 People.
How Large is the Labor Force in Russellville?
There are 42 People in the Labor Forcein in Russellville.
What is the Percentage of People in the Labor Force in Russellville?
60.0% of People are in the Labor Force in Russellville.
What is the Unemployment Rate in Russellville?
Unemployment Rate in Russellville is 2.4%.