Arthur, IL Map & Demographics
Arthur Map
Arthur Overview
$32,067
PER CAPITA INCOME
$83,500
AVG FAMILY INCOME
$50,192
AVG HOUSEHOLD INCOME
42.9%
WAGE / INCOME GAP [ % ]
57.1¢/ $1
WAGE / INCOME GAP [ $ ]
0.44
INEQUALITY / GINI INDEX
1,992
TOTAL POPULATION
868
MALE POPULATION
1,124
FEMALE POPULATION
77.22
MALES / 100 FEMALES
129.49
FEMALES / 100 MALES
48.1
MEDIAN AGE
2.8
AVG FAMILY SIZE
2.1
AVG HOUSEHOLD SIZE
935
LABOR FORCE [ PEOPLE ]
55.6%
PERCENT IN LABOR FORCE
5.9%
UNEMPLOYMENT RATE
Arthur Zip Codes
Arthur Area Codes
Income in Arthur
Income Overview in Arthur
Per Capita Income in Arthur is $32,067, while median incomes of families and households are $83,500 and $50,192 respectively.
| Characteristic | Number | Measure |
| Per Capita Income | 1,992 | $32,067 |
| Median Family Income | 534 | $83,500 |
| Mean Family Income | 534 | $89,046 |
| Median Household Income | 916 | $50,192 |
| Mean Household Income | 916 | $68,582 |
| Income Deficit | 534 | $0 |
| Wage / Income Gap (%) | 1,992 | 42.90% |
| Wage / Income Gap ($) | 1,992 | 57.10¢ per $1 |
| Gini / Inequality Index | 1,992 | 0.44 |
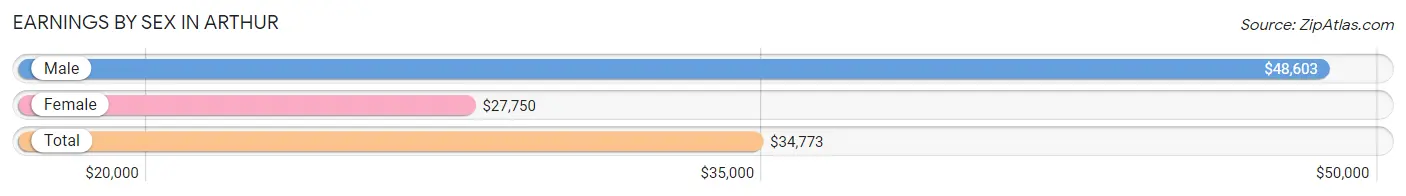
Earnings by Sex in Arthur
Average Earnings in Arthur are $34,773, $48,603 for men and $27,750 for women, a difference of 42.9%.
| Sex | Number | Average Earnings |
| Male | 527 (55.7%) | $48,603 |
| Female | 419 (44.3%) | $27,750 |
| Total | 946 (100.0%) | $34,773 |
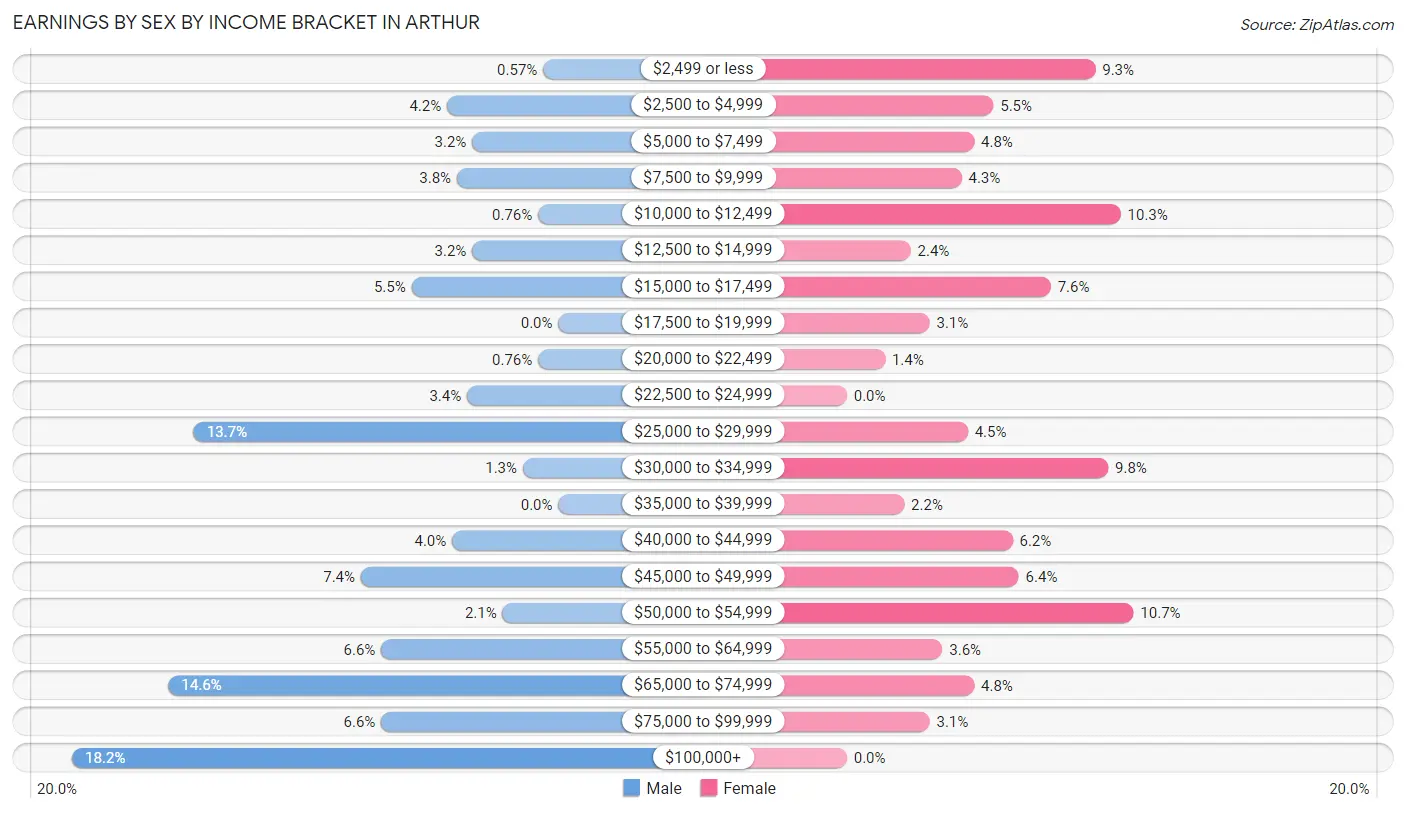
Earnings by Sex by Income Bracket in Arthur
The most common earnings brackets in Arthur are $100,000+ for men (96 | 18.2%) and $50,000 to $54,999 for women (45 | 10.7%).
| Income | Male | Female |
| $2,499 or less | 3 (0.6%) | 39 (9.3%) |
| $2,500 to $4,999 | 22 (4.2%) | 23 (5.5%) |
| $5,000 to $7,499 | 17 (3.2%) | 20 (4.8%) |
| $7,500 to $9,999 | 20 (3.8%) | 18 (4.3%) |
| $10,000 to $12,499 | 4 (0.8%) | 43 (10.3%) |
| $12,500 to $14,999 | 17 (3.2%) | 10 (2.4%) |
| $15,000 to $17,499 | 29 (5.5%) | 32 (7.6%) |
| $17,500 to $19,999 | 0 (0.0%) | 13 (3.1%) |
| $20,000 to $22,499 | 4 (0.8%) | 6 (1.4%) |
| $22,500 to $24,999 | 18 (3.4%) | 0 (0.0%) |
| $25,000 to $29,999 | 72 (13.7%) | 19 (4.5%) |
| $30,000 to $34,999 | 7 (1.3%) | 41 (9.8%) |
| $35,000 to $39,999 | 0 (0.0%) | 9 (2.1%) |
| $40,000 to $44,999 | 21 (4.0%) | 26 (6.2%) |
| $45,000 to $49,999 | 39 (7.4%) | 27 (6.4%) |
| $50,000 to $54,999 | 11 (2.1%) | 45 (10.7%) |
| $55,000 to $64,999 | 35 (6.6%) | 15 (3.6%) |
| $65,000 to $74,999 | 77 (14.6%) | 20 (4.8%) |
| $75,000 to $99,999 | 35 (6.6%) | 13 (3.1%) |
| $100,000+ | 96 (18.2%) | 0 (0.0%) |
| Total | 527 (100.0%) | 419 (100.0%) |
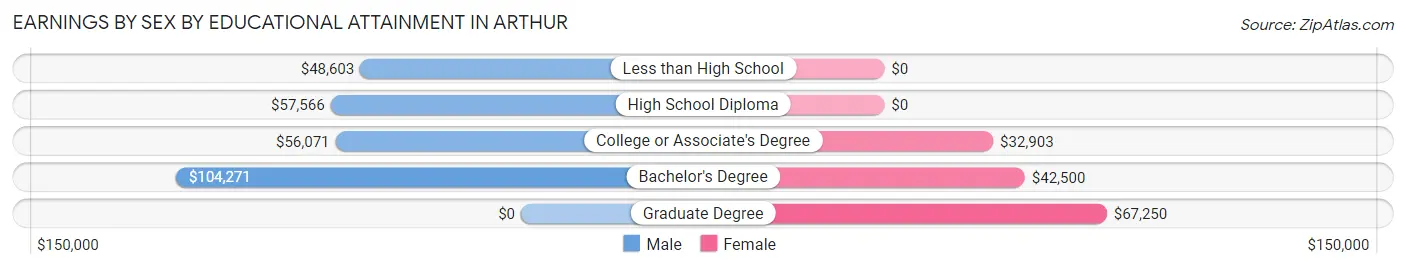
Earnings by Sex by Educational Attainment in Arthur
Average earnings in Arthur are $59,167 for men and $33,902 for women, a difference of 42.7%. Men with an educational attainment of bachelor's degree enjoy the highest average annual earnings of $104,271, while those with less than high school education earn the least with $48,603. Women with an educational attainment of graduate degree earn the most with the average annual earnings of $67,250, while those with college or associate's degree education have the smallest earnings of $32,903.
| Educational Attainment | Male Income | Female Income |
| Less than High School | $48,603 | $0 |
| High School Diploma | $57,566 | $0 |
| College or Associate's Degree | $56,071 | $32,903 |
| Bachelor's Degree | $104,271 | $42,500 |
| Graduate Degree | - | - |
| Total | $59,167 | $33,902 |
Family Income in Arthur
Family Income Brackets in Arthur
According to the Arthur family income data, there are 115 families falling into the $100,000 to $149,999 income range, which is the most common income bracket and makes up 21.5% of all families. Conversely, the $10,000 to $14,999 income bracket is the least frequent group with only 12 families (2.2%) belonging to this category.
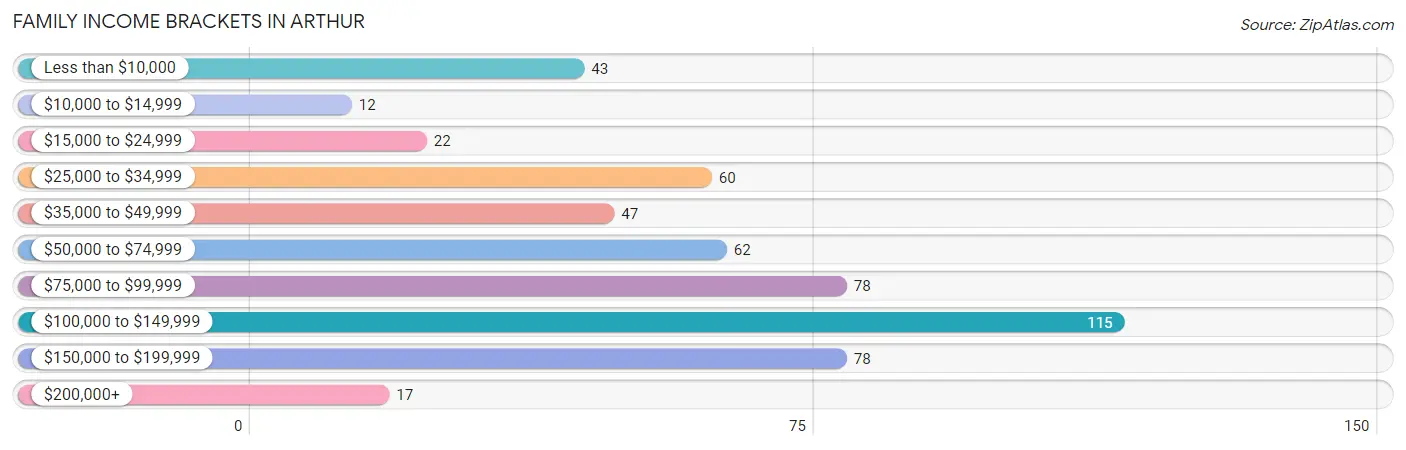
| Income Bracket | # Families | % Families |
| Less than $10,000 | 43 | 8.1% |
| $10,000 to $14,999 | 12 | 2.2% |
| $15,000 to $24,999 | 22 | 4.1% |
| $25,000 to $34,999 | 60 | 11.2% |
| $35,000 to $49,999 | 47 | 8.8% |
| $50,000 to $74,999 | 62 | 11.6% |
| $75,000 to $99,999 | 78 | 14.6% |
| $100,000 to $149,999 | 115 | 21.5% |
| $150,000 to $199,999 | 78 | 14.6% |
| $200,000+ | 17 | 3.2% |
Family Income by Famaliy Size in Arthur
4-person families (94 | 17.6%) account for the highest median family income in Arthur with $116,111 per family, while 4-person families (94 | 17.6%) have the highest median income of $29,028 per family member.
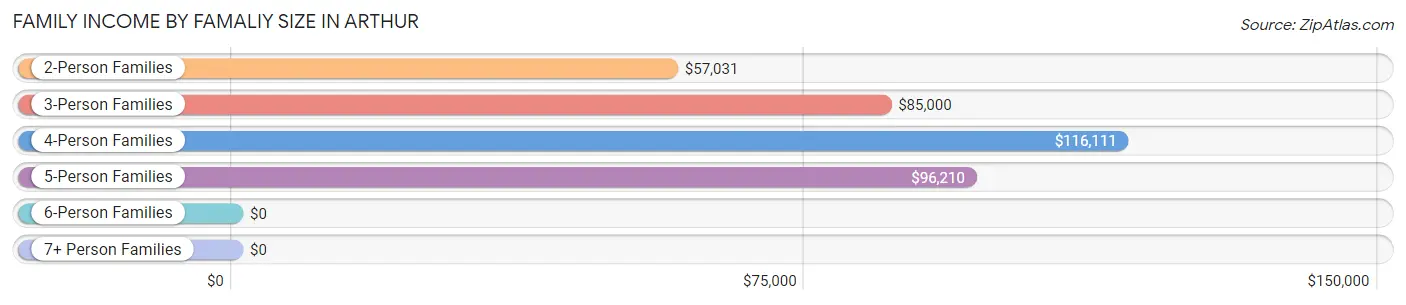
| Income Bracket | # Families | Median Income |
| 2-Person Families | 267 (50.0%) | $57,031 |
| 3-Person Families | 92 (17.2%) | $85,000 |
| 4-Person Families | 94 (17.6%) | $116,111 |
| 5-Person Families | 60 (11.2%) | $96,210 |
| 6-Person Families | 18 (3.4%) | $0 |
| 7+ Person Families | 3 (0.6%) | $0 |
| Total | 534 (100.0%) | $83,500 |
Family Income by Number of Earners in Arthur
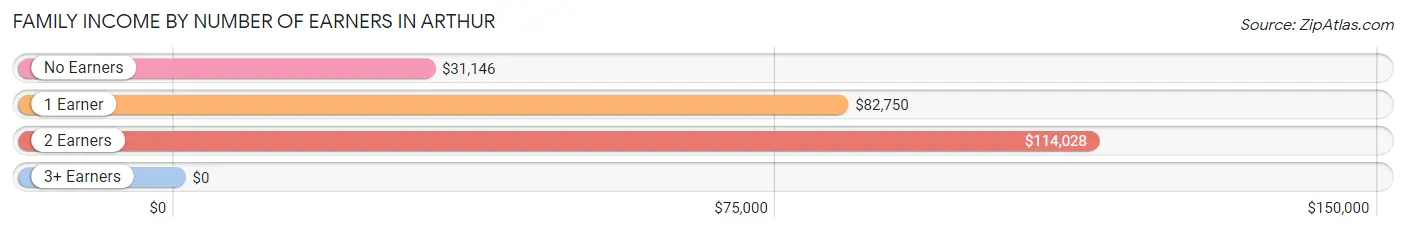
| Number of Earners | # Families | Median Income |
| No Earners | 135 (25.3%) | $31,146 |
| 1 Earner | 135 (25.3%) | $82,750 |
| 2 Earners | 189 (35.4%) | $114,028 |
| 3+ Earners | 75 (14.0%) | $0 |
| Total | 534 (100.0%) | $83,500 |
Household Income in Arthur
Household Income Brackets in Arthur
With 165 households falling in the category, the $25,000 to $34,999 income range is the most frequent in Arthur, accounting for 18.0% of all households. In contrast, only 17 households (1.9%) fall into the $200,000+ income bracket, making it the least populous group.
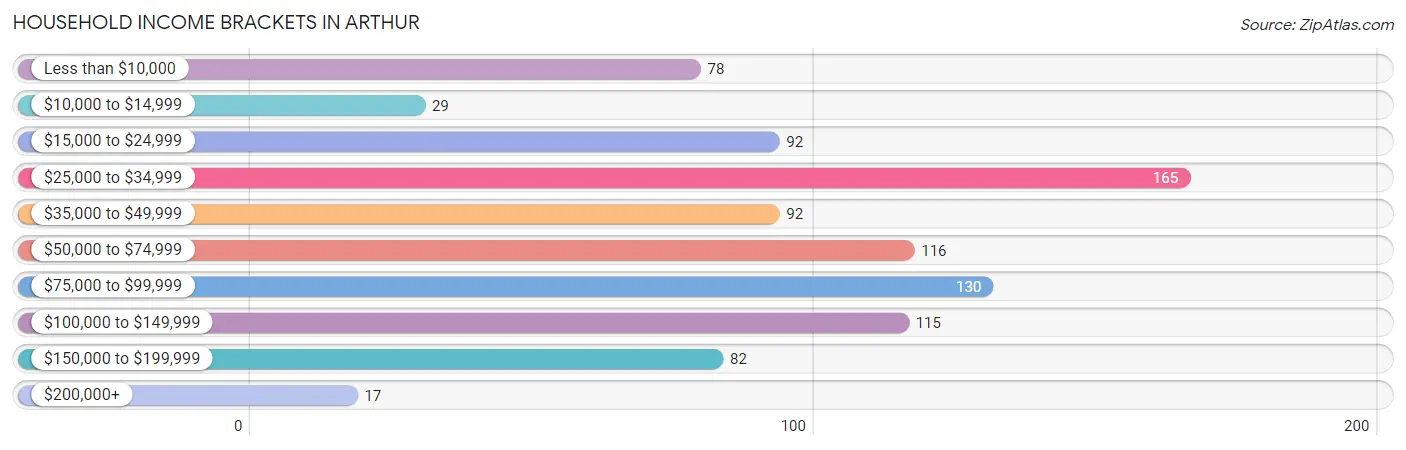
| Income Bracket | # Households | % Households |
| Less than $10,000 | 78 | 8.5% |
| $10,000 to $14,999 | 29 | 3.2% |
| $15,000 to $24,999 | 92 | 10.0% |
| $25,000 to $34,999 | 165 | 18.0% |
| $35,000 to $49,999 | 92 | 10.0% |
| $50,000 to $74,999 | 116 | 12.7% |
| $75,000 to $99,999 | 130 | 14.2% |
| $100,000 to $149,999 | 115 | 12.6% |
| $150,000 to $199,999 | 82 | 9.0% |
| $200,000+ | 17 | 1.9% |
Household Income by Householder Age in Arthur
The median household income in Arthur is $50,192, with the highest median household income of $74,063 found in the 25 to 44 years age bracket for the primary householder. A total of 245 households (26.8%) fall into this category. Meanwhile, the 15 to 24 years age bracket for the primary householder has the lowest median household income of $0, with 30 households (3.3%) in this group.
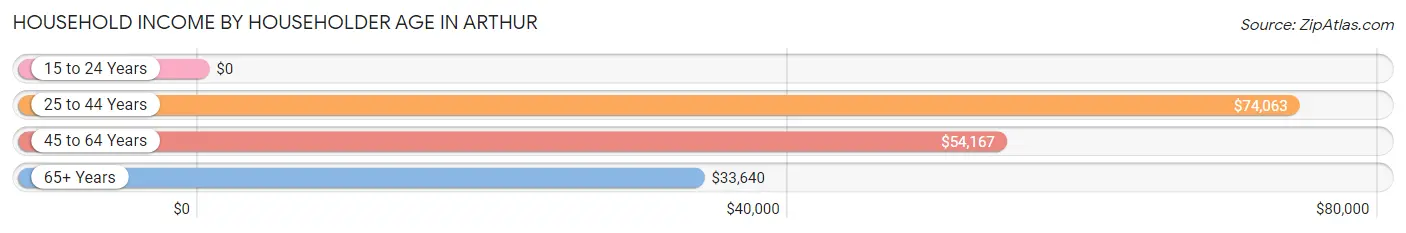
| Income Bracket | # Households | Median Income |
| 15 to 24 Years | 30 (3.3%) | $0 |
| 25 to 44 Years | 245 (26.8%) | $74,063 |
| 45 to 64 Years | 234 (25.6%) | $54,167 |
| 65+ Years | 407 (44.4%) | $33,640 |
| Total | 916 (100.0%) | $50,192 |
Poverty in Arthur
Income Below Poverty by Sex and Age in Arthur
With 14.8% poverty level for males and 15.3% for females among the residents of Arthur, 16 and 17 year old males and under 5 year old females are the most vulnerable to poverty, with 14 males (66.7%) and 32 females (42.1%) in their respective age groups living below the poverty level.
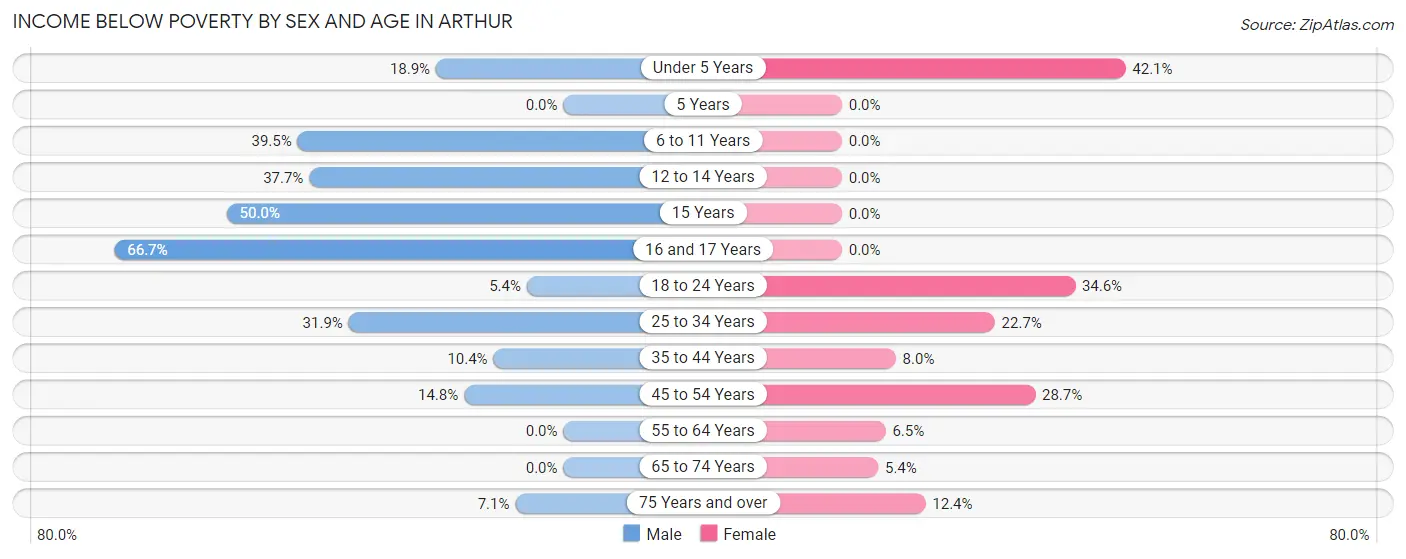
| Age Bracket | Male | Female |
| Under 5 Years | 7 (18.9%) | 32 (42.1%) |
| 5 Years | 0 (0.0%) | 0 (0.0%) |
| 6 to 11 Years | 15 (39.5%) | 0 (0.0%) |
| 12 to 14 Years | 20 (37.7%) | 0 (0.0%) |
| 15 Years | 4 (50.0%) | 0 (0.0%) |
| 16 and 17 Years | 14 (66.7%) | 0 (0.0%) |
| 18 to 24 Years | 5 (5.4%) | 18 (34.6%) |
| 25 to 34 Years | 22 (31.9%) | 32 (22.7%) |
| 35 to 44 Years | 11 (10.4%) | 6 (8.0%) |
| 45 to 54 Years | 18 (14.7%) | 35 (28.7%) |
| 55 to 64 Years | 0 (0.0%) | 5 (6.5%) |
| 65 to 74 Years | 0 (0.0%) | 7 (5.4%) |
| 75 Years and over | 9 (7.1%) | 33 (12.4%) |
| Total | 125 (14.8%) | 168 (15.3%) |
Income Above Poverty by Sex and Age in Arthur
According to the poverty statistics in Arthur, males aged 55 to 64 years and females aged 5 years are the age groups that are most secure financially, with 100.0% of males and 100.0% of females in these age groups living above the poverty line.
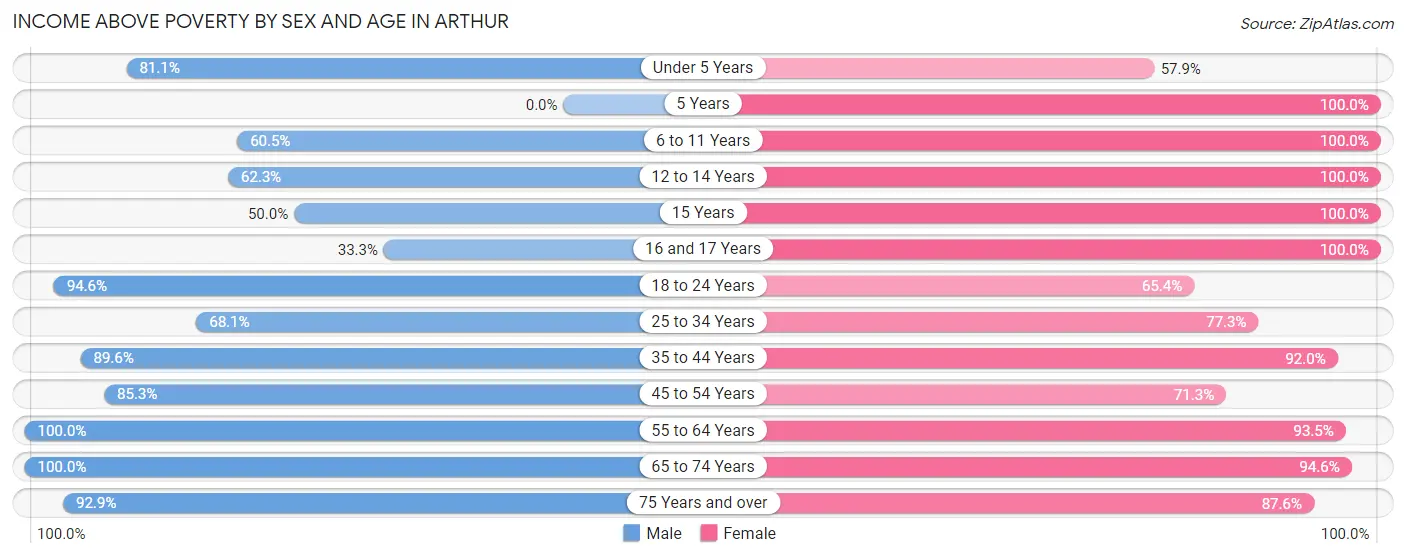
| Age Bracket | Male | Female |
| Under 5 Years | 30 (81.1%) | 44 (57.9%) |
| 5 Years | 0 (0.0%) | 18 (100.0%) |
| 6 to 11 Years | 23 (60.5%) | 45 (100.0%) |
| 12 to 14 Years | 33 (62.3%) | 21 (100.0%) |
| 15 Years | 4 (50.0%) | 14 (100.0%) |
| 16 and 17 Years | 7 (33.3%) | 61 (100.0%) |
| 18 to 24 Years | 87 (94.6%) | 34 (65.4%) |
| 25 to 34 Years | 47 (68.1%) | 109 (77.3%) |
| 35 to 44 Years | 95 (89.6%) | 69 (92.0%) |
| 45 to 54 Years | 104 (85.3%) | 87 (71.3%) |
| 55 to 64 Years | 77 (100.0%) | 72 (93.5%) |
| 65 to 74 Years | 95 (100.0%) | 123 (94.6%) |
| 75 Years and over | 117 (92.9%) | 233 (87.6%) |
| Total | 719 (85.2%) | 930 (84.7%) |
Income Below Poverty Among Married-Couple Families in Arthur
The poverty statistics for married-couple families in Arthur show that 10.8% or 47 of the total 434 families live below the poverty line. Families with 3 or 4 children have the highest poverty rate of 36.4%, comprising of 12 families. On the other hand, families with 1 or 2 children have the lowest poverty rate of 3.4%, which includes 5 families.
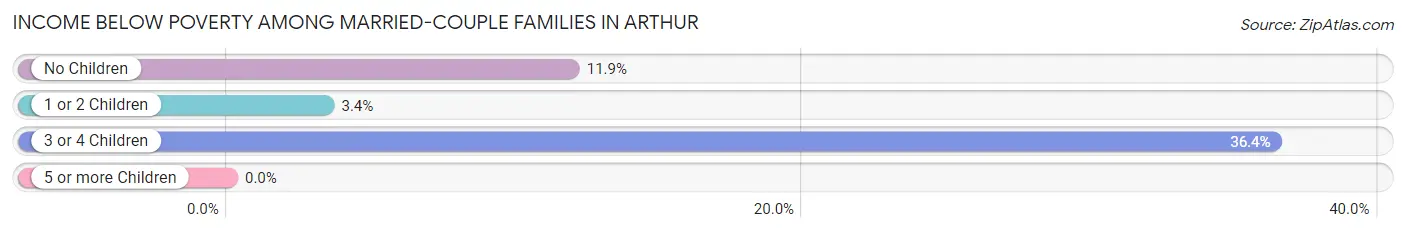
| Children | Above Poverty | Below Poverty |
| No Children | 222 (88.1%) | 30 (11.9%) |
| 1 or 2 Children | 144 (96.6%) | 5 (3.4%) |
| 3 or 4 Children | 21 (63.6%) | 12 (36.4%) |
| 5 or more Children | 0 (0.0%) | 0 (0.0%) |
| Total | 387 (89.2%) | 47 (10.8%) |
Income Below Poverty Among Single-Parent Households in Arthur
According to the poverty data in Arthur, 24.5% or 12 single-father households and 39.2% or 20 single-mother households are living below the poverty line. Among single-father households, those with 1 or 2 children have the highest poverty rate, with 12 households (34.3%) experiencing poverty. Likewise, among single-mother households, those with 3 or 4 children have the highest poverty rate, with 20 households (100.0%) falling below the poverty line.
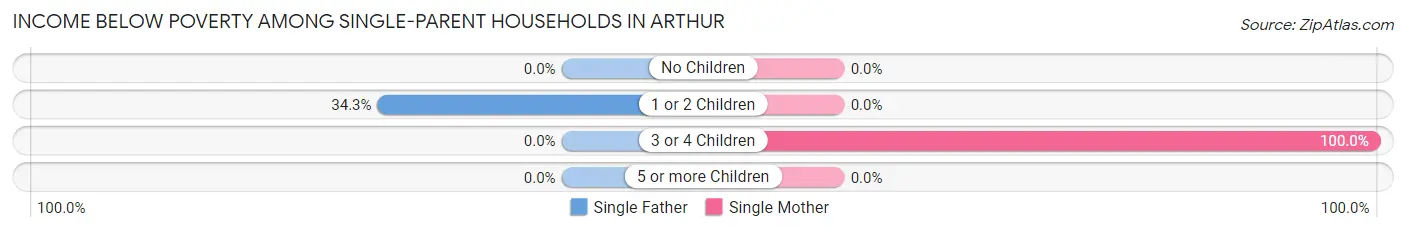
| Children | Single Father | Single Mother |
| No Children | 0 (0.0%) | 0 (0.0%) |
| 1 or 2 Children | 12 (34.3%) | 0 (0.0%) |
| 3 or 4 Children | 0 (0.0%) | 20 (100.0%) |
| 5 or more Children | 0 (0.0%) | 0 (0.0%) |
| Total | 12 (24.5%) | 20 (39.2%) |
Income Below Poverty Among Married-Couple vs Single-Parent Households in Arthur
The poverty data for Arthur shows that 47 of the married-couple family households (10.8%) and 32 of the single-parent households (32.0%) are living below the poverty level. Within the married-couple family households, those with 3 or 4 children have the highest poverty rate, with 12 households (36.4%) falling below the poverty line. Among the single-parent households, those with 3 or 4 children have the highest poverty rate, with 20 household (100.0%) living below poverty.
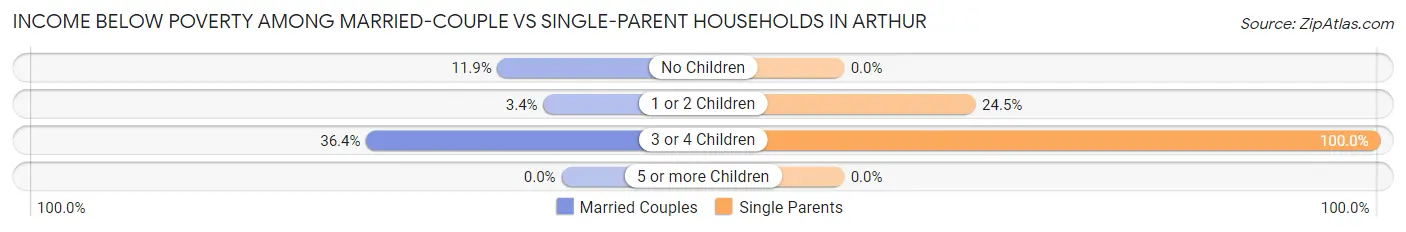
| Children | Married-Couple Families | Single-Parent Households |
| No Children | 30 (11.9%) | 0 (0.0%) |
| 1 or 2 Children | 5 (3.4%) | 12 (24.5%) |
| 3 or 4 Children | 12 (36.4%) | 20 (100.0%) |
| 5 or more Children | 0 (0.0%) | 0 (0.0%) |
| Total | 47 (10.8%) | 32 (32.0%) |
Race in Arthur
The most populous races in Arthur are White / Caucasian (1,843 | 92.5%), Some other Race (109 | 5.5%), and Hispanic or Latino (87 | 4.4%).
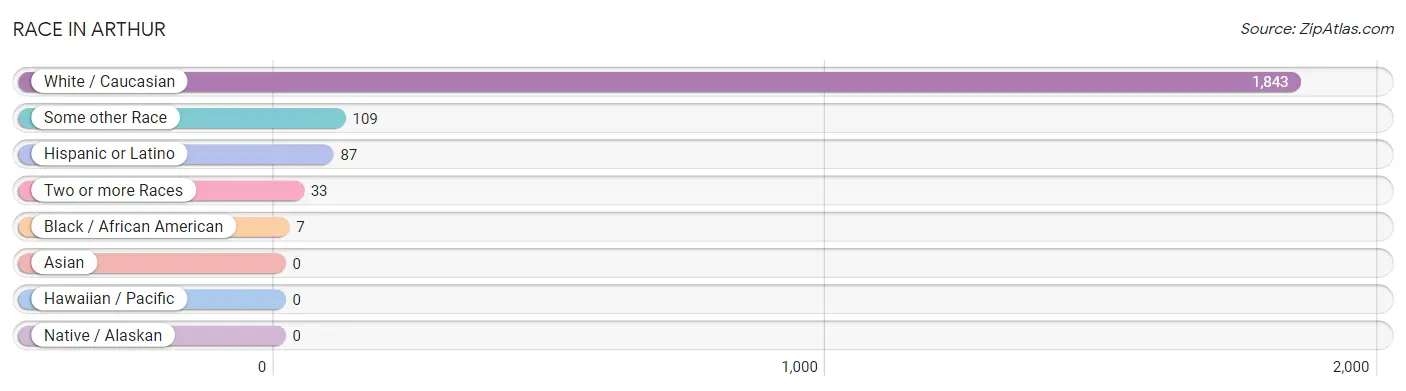
| Race | # Population | % Population |
| Asian | 0 | 0.0% |
| Black / African American | 7 | 0.4% |
| Hawaiian / Pacific | 0 | 0.0% |
| Hispanic or Latino | 87 | 4.4% |
| Native / Alaskan | 0 | 0.0% |
| White / Caucasian | 1,843 | 92.5% |
| Two or more Races | 33 | 1.7% |
| Some other Race | 109 | 5.5% |
| Total | 1,992 | 100.0% |
Ancestry in Arthur
The most populous ancestries reported in Arthur are German (876 | 44.0%), Irish (263 | 13.2%), English (186 | 9.3%), American (131 | 6.6%), and Pennsylvania German (50 | 2.5%), together accounting for 75.6% of all Arthur residents.
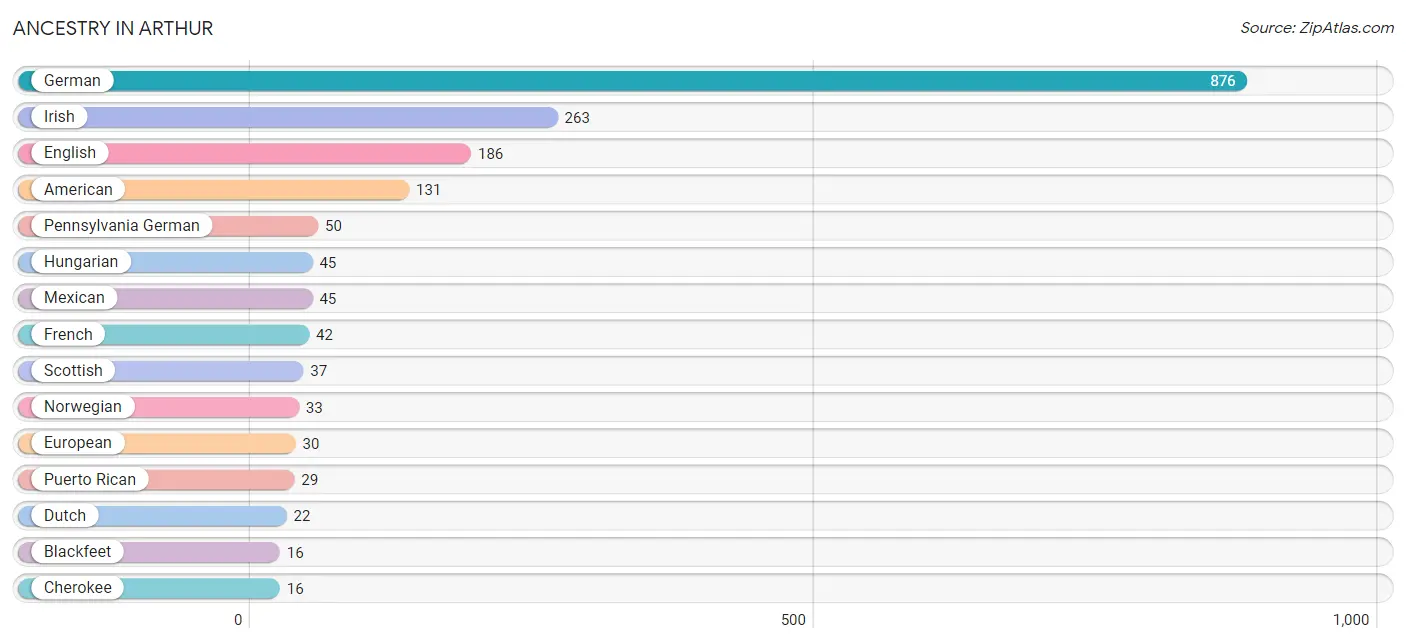
| Ancestry | # Population | % Population |
| American | 131 | 6.6% |
| Blackfeet | 16 | 0.8% |
| British | 7 | 0.4% |
| Canadian | 3 | 0.2% |
| Cherokee | 16 | 0.8% |
| Dutch | 22 | 1.1% |
| English | 186 | 9.3% |
| European | 30 | 1.5% |
| French | 42 | 2.1% |
| German | 876 | 44.0% |
| Hungarian | 45 | 2.3% |
| Irish | 263 | 13.2% |
| Italian | 11 | 0.5% |
| Mexican | 45 | 2.3% |
| Norwegian | 33 | 1.7% |
| Pennsylvania German | 50 | 2.5% |
| Polish | 12 | 0.6% |
| Puerto Rican | 29 | 1.5% |
| Scandinavian | 3 | 0.2% |
| Scotch-Irish | 4 | 0.2% |
| Scottish | 37 | 1.9% |
| South American | 12 | 0.6% |
| Swedish | 9 | 0.4% |
| Swiss | 2 | 0.1% |
| Venezuelan | 12 | 0.6% |
| Welsh | 10 | 0.5% | View All 26 Rows |
Immigrants in Arthur
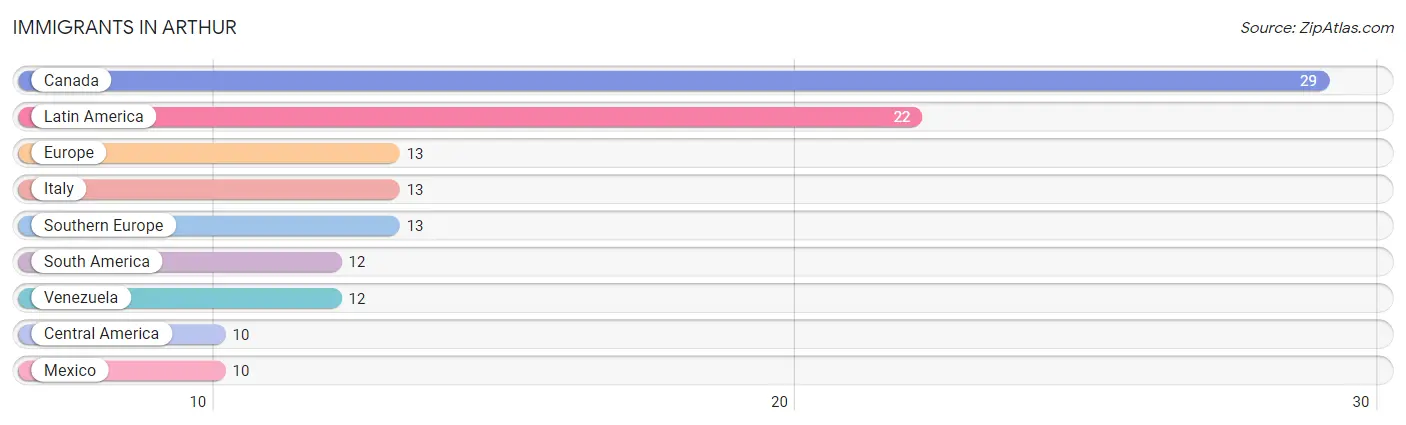
The most numerous immigrant groups reported in Arthur came from Canada (29 | 1.5%), Latin America (22 | 1.1%), Europe (13 | 0.6%), Italy (13 | 0.6%), and Southern Europe (13 | 0.6%), together accounting for 4.5% of all Arthur residents.
| Immigration Origin | # Population | % Population |
| Canada | 29 | 1.5% |
| Central America | 10 | 0.5% |
| Europe | 13 | 0.6% |
| Italy | 13 | 0.6% |
| Latin America | 22 | 1.1% |
| Mexico | 10 | 0.5% |
| South America | 12 | 0.6% |
| Southern Europe | 13 | 0.6% |
| Venezuela | 12 | 0.6% | View All 9 Rows |
Sex and Age in Arthur
Sex and Age in Arthur
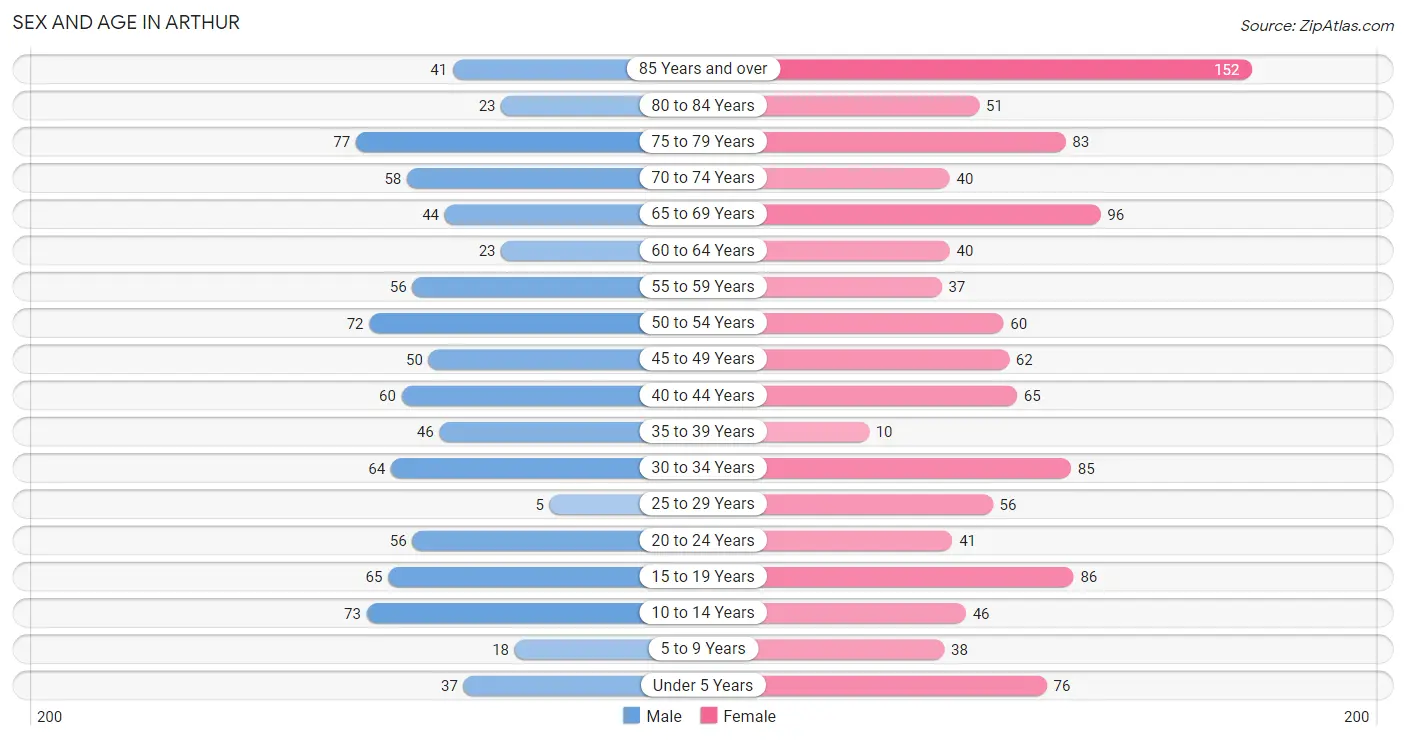
The most populous age groups in Arthur are 75 to 79 Years (77 | 8.9%) for men and 85 Years and over (152 | 13.5%) for women.
| Age Bracket | Male | Female |
| Under 5 Years | 37 (4.3%) | 76 (6.8%) |
| 5 to 9 Years | 18 (2.1%) | 38 (3.4%) |
| 10 to 14 Years | 73 (8.4%) | 46 (4.1%) |
| 15 to 19 Years | 65 (7.5%) | 86 (7.6%) |
| 20 to 24 Years | 56 (6.5%) | 41 (3.6%) |
| 25 to 29 Years | 5 (0.6%) | 56 (5.0%) |
| 30 to 34 Years | 64 (7.4%) | 85 (7.6%) |
| 35 to 39 Years | 46 (5.3%) | 10 (0.9%) |
| 40 to 44 Years | 60 (6.9%) | 65 (5.8%) |
| 45 to 49 Years | 50 (5.8%) | 62 (5.5%) |
| 50 to 54 Years | 72 (8.3%) | 60 (5.3%) |
| 55 to 59 Years | 56 (6.5%) | 37 (3.3%) |
| 60 to 64 Years | 23 (2.6%) | 40 (3.6%) |
| 65 to 69 Years | 44 (5.1%) | 96 (8.5%) |
| 70 to 74 Years | 58 (6.7%) | 40 (3.6%) |
| 75 to 79 Years | 77 (8.9%) | 83 (7.4%) |
| 80 to 84 Years | 23 (2.6%) | 51 (4.5%) |
| 85 Years and over | 41 (4.7%) | 152 (13.5%) |
| Total | 868 (100.0%) | 1,124 (100.0%) |
Families and Households in Arthur
Median Family Size in Arthur
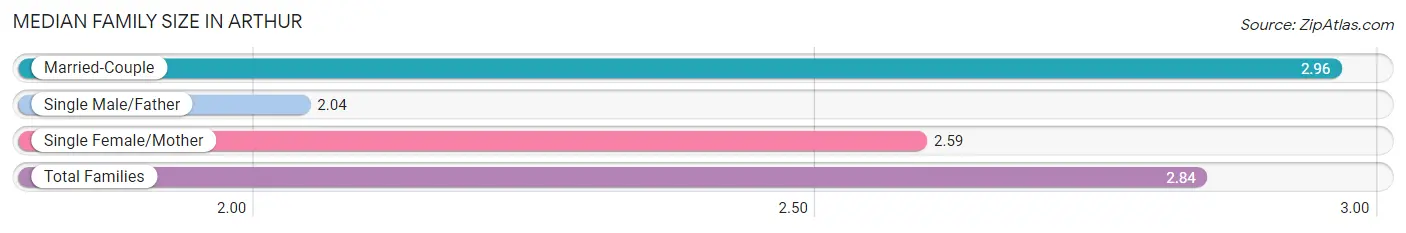
The median family size in Arthur is 2.84 persons per family, with married-couple families (434 | 81.3%) accounting for the largest median family size of 2.96 persons per family. On the other hand, single male/father families (49 | 9.2%) represent the smallest median family size with 2.04 persons per family.
| Family Type | # Families | Family Size |
| Married-Couple | 434 (81.3%) | 2.96 |
| Single Male/Father | 49 (9.2%) | 2.04 |
| Single Female/Mother | 51 (9.6%) | 2.59 |
| Total Families | 534 (100.0%) | 2.84 |
Median Household Size in Arthur
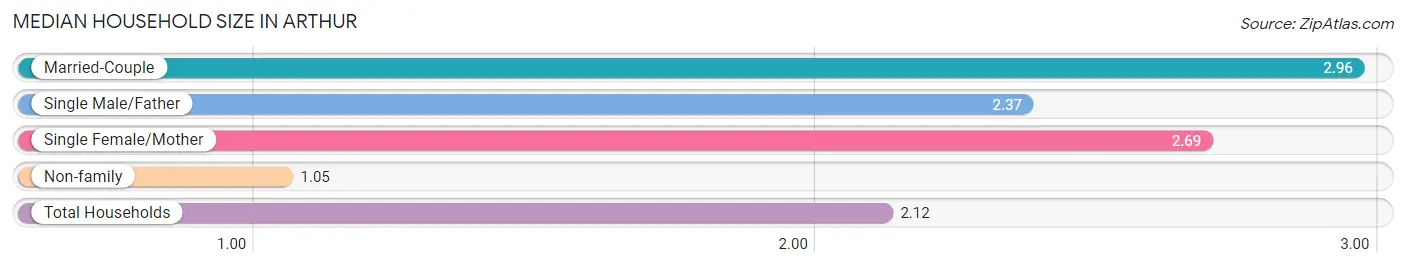
The median household size in Arthur is 2.12 persons per household, with married-couple households (434 | 47.4%) accounting for the largest median household size of 2.96 persons per household. non-family households (382 | 41.7%) represent the smallest median household size with 1.05 persons per household.
| Household Type | # Households | Household Size |
| Married-Couple | 434 (47.4%) | 2.96 |
| Single Male/Father | 49 (5.3%) | 2.37 |
| Single Female/Mother | 51 (5.6%) | 2.69 |
| Non-family | 382 (41.7%) | 1.05 |
| Total Households | 916 (100.0%) | 2.12 |
Household Size by Marriage Status in Arthur
Out of a total of 916 households in Arthur, 534 (58.3%) are family households, while 382 (41.7%) are nonfamily households. The most numerous type of family households are 2-person households, comprising 246, and the most common type of nonfamily households are 1-person households, comprising 359.
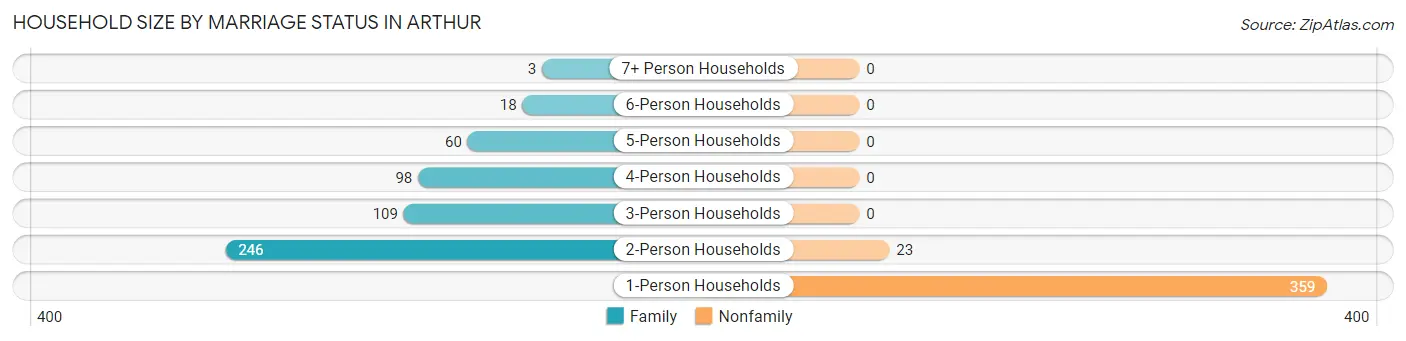
| Household Size | Family Households | Nonfamily Households |
| 1-Person Households | - | 359 (39.2%) |
| 2-Person Households | 246 (26.9%) | 23 (2.5%) |
| 3-Person Households | 109 (11.9%) | 0 (0.0%) |
| 4-Person Households | 98 (10.7%) | 0 (0.0%) |
| 5-Person Households | 60 (6.6%) | 0 (0.0%) |
| 6-Person Households | 18 (2.0%) | 0 (0.0%) |
| 7+ Person Households | 3 (0.3%) | 0 (0.0%) |
| Total | 534 (58.3%) | 382 (41.7%) |
Female Fertility in Arthur
Fertility by Age in Arthur
Average fertility rate in Arthur is 82.0 births per 1,000 women. Women in the age bracket of 20 to 34 years have the highest fertility rate with 198.0 births per 1,000 women. Women in the age bracket of 20 to 34 years acount for 100.0% of all women with births.
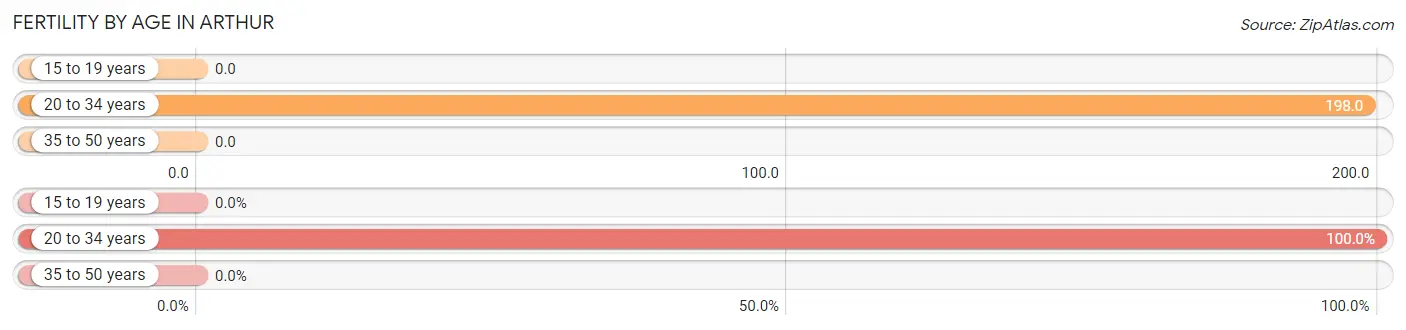
| Age Bracket | Women with Births | Births / 1,000 Women |
| 15 to 19 years | 0 (0.0%) | 0.0 |
| 20 to 34 years | 36 (100.0%) | 198.0 |
| 35 to 50 years | 0 (0.0%) | 0.0 |
| Total | 36 (100.0%) | 82.0 |
Fertility by Age by Marriage Status in Arthur
44.4% of women with births (36) in Arthur are married. The highest percentage of unmarried women with births falls into 20 to 34 years age bracket with 55.6% of them unmarried at the time of birth, while the lowest percentage of unmarried women with births belong to 20 to 34 years age bracket with 55.6% of them unmarried.
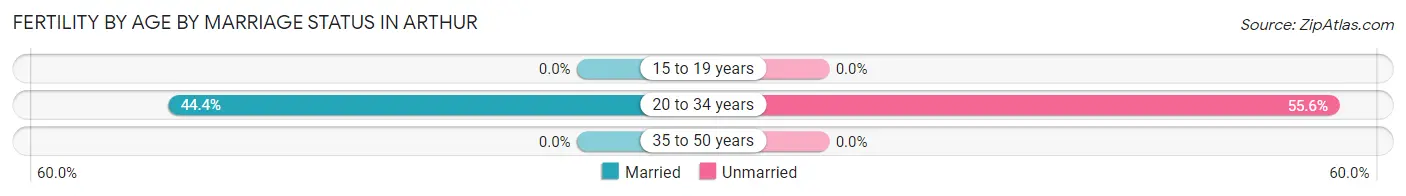
| Age Bracket | Married | Unmarried |
| 15 to 19 years | 0 (0.0%) | 0 (0.0%) |
| 20 to 34 years | 16 (44.4%) | 20 (55.6%) |
| 35 to 50 years | 0 (0.0%) | 0 (0.0%) |
| Total | 16 (44.4%) | 20 (55.6%) |
Fertility by Education in Arthur
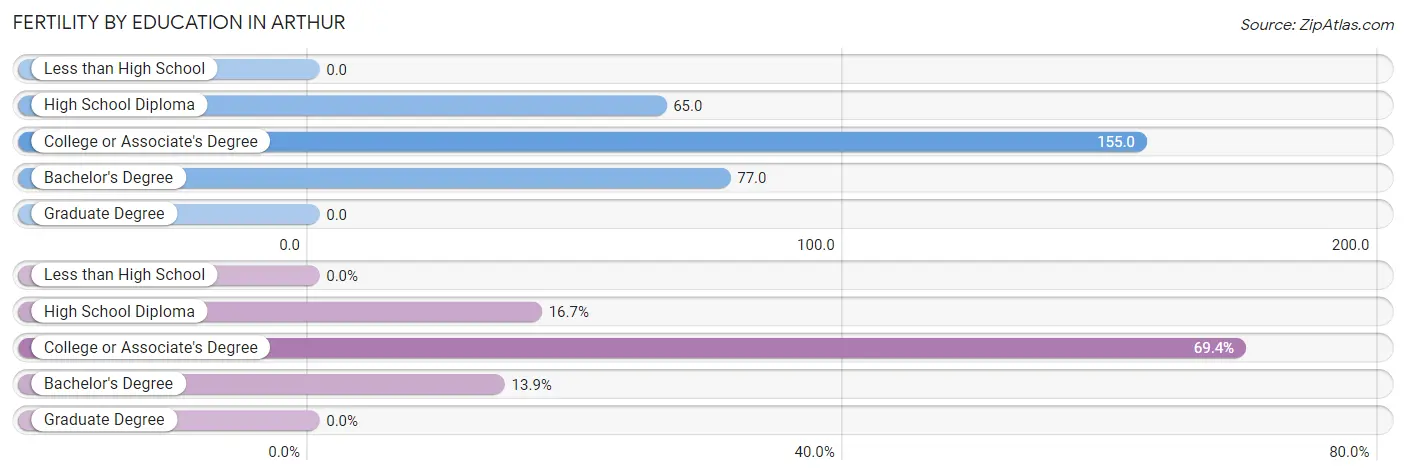
| Educational Attainment | Women with Births | Births / 1,000 Women |
| Less than High School | 0 (0.0%) | 0.0 |
| High School Diploma | 6 (16.7%) | 65.0 |
| College or Associate's Degree | 25 (69.4%) | 155.0 |
| Bachelor's Degree | 5 (13.9%) | 77.0 |
| Graduate Degree | 0 (0.0%) | 0.0 |
| Total | 36 (100.0%) | 82.0 |
Fertility by Education by Marriage Status in Arthur
55.6% of women with births in Arthur are unmarried. Women with the educational attainment of high school diploma are most likely to be married with 100.0% of them married at childbirth, while women with the educational attainment of college or associate's degree are least likely to be married with 80.0% of them unmarried at childbirth.
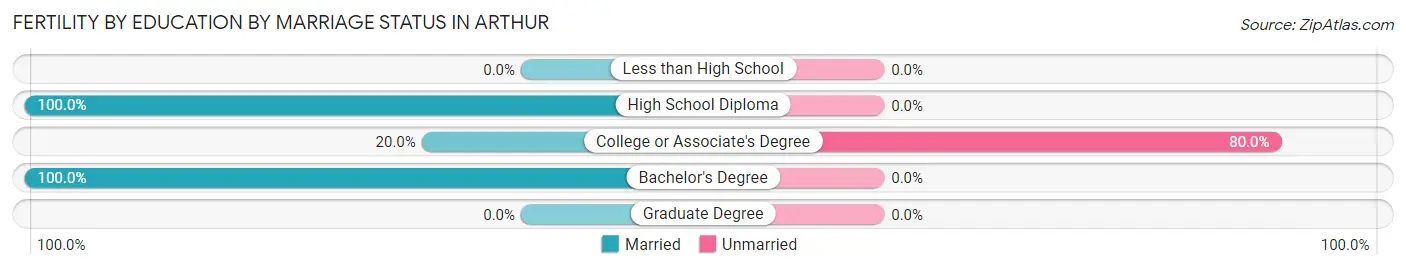
| Educational Attainment | Married | Unmarried |
| Less than High School | 0 (0.0%) | 0 (0.0%) |
| High School Diploma | 6 (100.0%) | 0 (0.0%) |
| College or Associate's Degree | 5 (20.0%) | 20 (80.0%) |
| Bachelor's Degree | 5 (100.0%) | 0 (0.0%) |
| Graduate Degree | 0 (0.0%) | 0 (0.0%) |
| Total | 16 (44.4%) | 20 (55.6%) |
Employment Characteristics in Arthur
Employment by Class of Employer in Arthur
Among the 839 employed individuals in Arthur, private company employees (525 | 62.6%), self-employed (not incorporated) (117 | 14.0%), and state government employees (65 | 7.7%) make up the most common classes of employment.
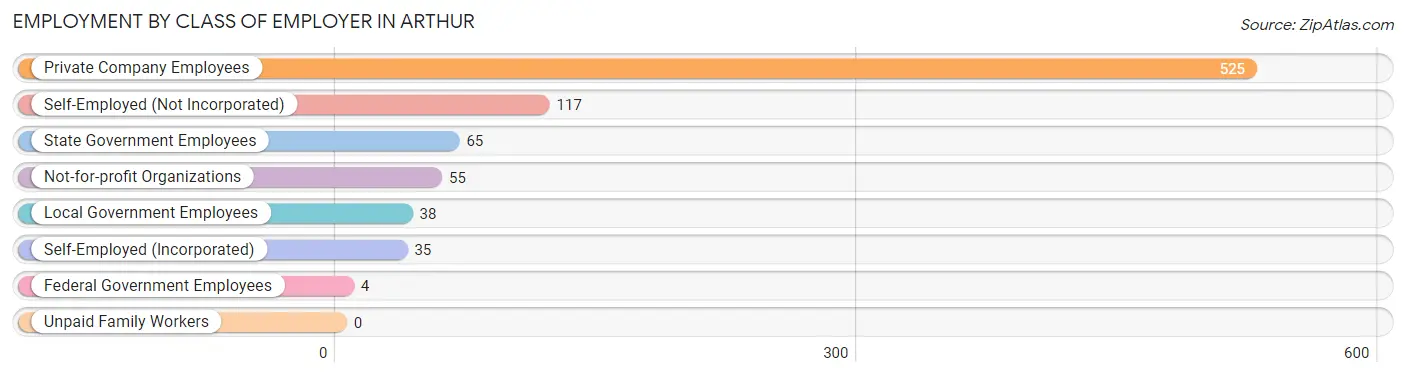
| Employer Class | # Employees | % Employees |
| Private Company Employees | 525 | 62.6% |
| Self-Employed (Incorporated) | 35 | 4.2% |
| Self-Employed (Not Incorporated) | 117 | 14.0% |
| Not-for-profit Organizations | 55 | 6.6% |
| Local Government Employees | 38 | 4.5% |
| State Government Employees | 65 | 7.7% |
| Federal Government Employees | 4 | 0.5% |
| Unpaid Family Workers | 0 | 0.0% |
| Total | 839 | 100.0% |
Employment Status by Age in Arthur
According to the labor force statistics for Arthur, out of the total population over 16 years of age (1,682), 55.6% or 935 individuals are in the labor force, with 5.9% or 55 of them unemployed. The age group with the highest labor force participation rate is 25 to 29 years, with 100.0% or 61 individuals in the labor force. Within the labor force, the 16 to 19 years age range has the highest percentage of unemployed individuals, with 20.0% or 15 of them being unemployed.
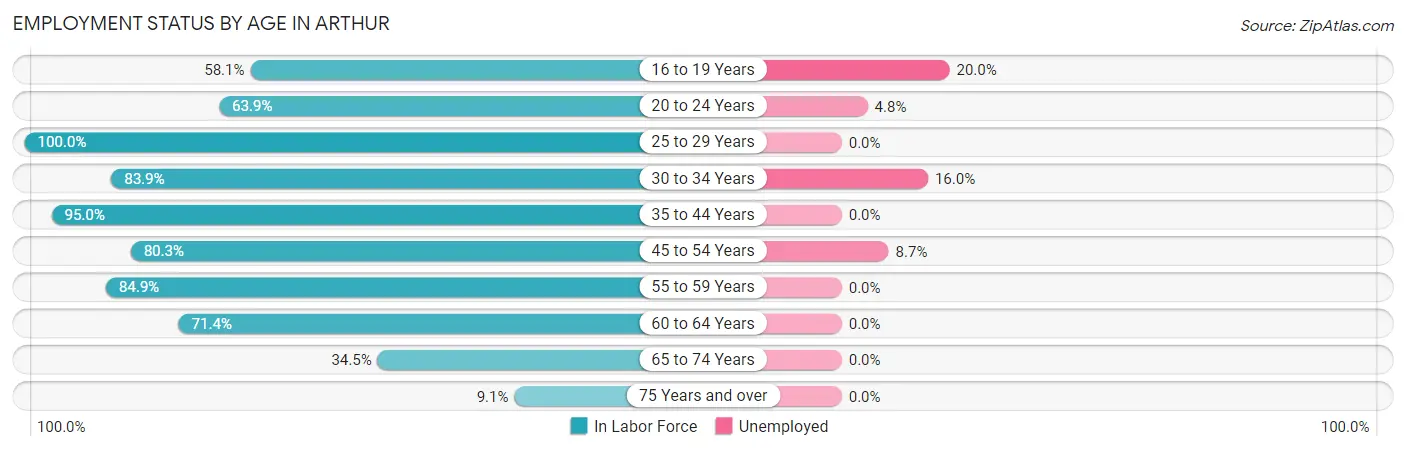
| Age Bracket | In Labor Force | Unemployed |
| 16 to 19 Years | 75 (58.1%) | 15 (20.0%) |
| 20 to 24 Years | 62 (63.9%) | 3 (4.8%) |
| 25 to 29 Years | 61 (100.0%) | 0 (0.0%) |
| 30 to 34 Years | 125 (83.9%) | 20 (16.0%) |
| 35 to 44 Years | 172 (95.0%) | 0 (0.0%) |
| 45 to 54 Years | 196 (80.3%) | 17 (8.7%) |
| 55 to 59 Years | 79 (84.9%) | 0 (0.0%) |
| 60 to 64 Years | 45 (71.4%) | 0 (0.0%) |
| 65 to 74 Years | 82 (34.5%) | 0 (0.0%) |
| 75 Years and over | 39 (9.1%) | 0 (0.0%) |
| Total | 935 (55.6%) | 55 (5.9%) |
Employment Status by Educational Attainment in Arthur
According to labor force statistics for Arthur, 85.7% of individuals (678) out of the total population between 25 and 64 years of age (791) are in the labor force, with 5.5% or 37 of them being unemployed. The group with the highest labor force participation rate are those with the educational attainment of bachelor's degree or higher, with 97.4% or 185 individuals in the labor force. Within the labor force, individuals with college / associate degree education have the highest percentage of unemployment, with 11.2% or 30 of them being unemployed.
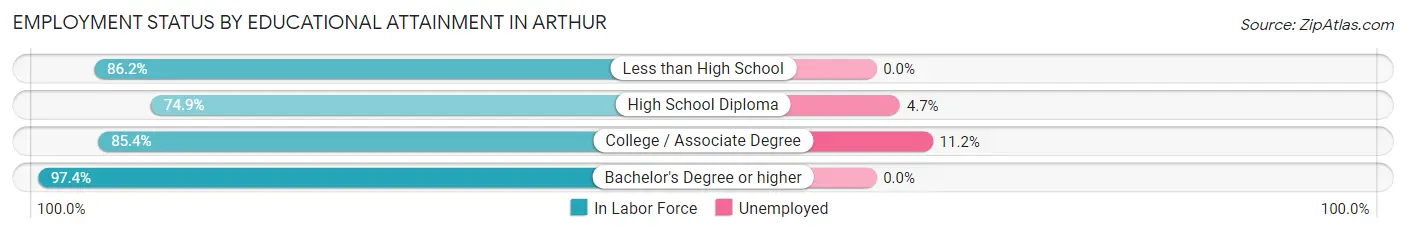
| Educational Attainment | In Labor Force | Unemployed |
| Less than High School | 75 (86.2%) | 0 (0.0%) |
| High School Diploma | 149 (74.9%) | 9 (4.7%) |
| College / Associate Degree | 269 (85.4%) | 35 (11.2%) |
| Bachelor's Degree or higher | 185 (97.4%) | 0 (0.0%) |
| Total | 678 (85.7%) | 44 (5.5%) |
Employment Occupations by Sex in Arthur
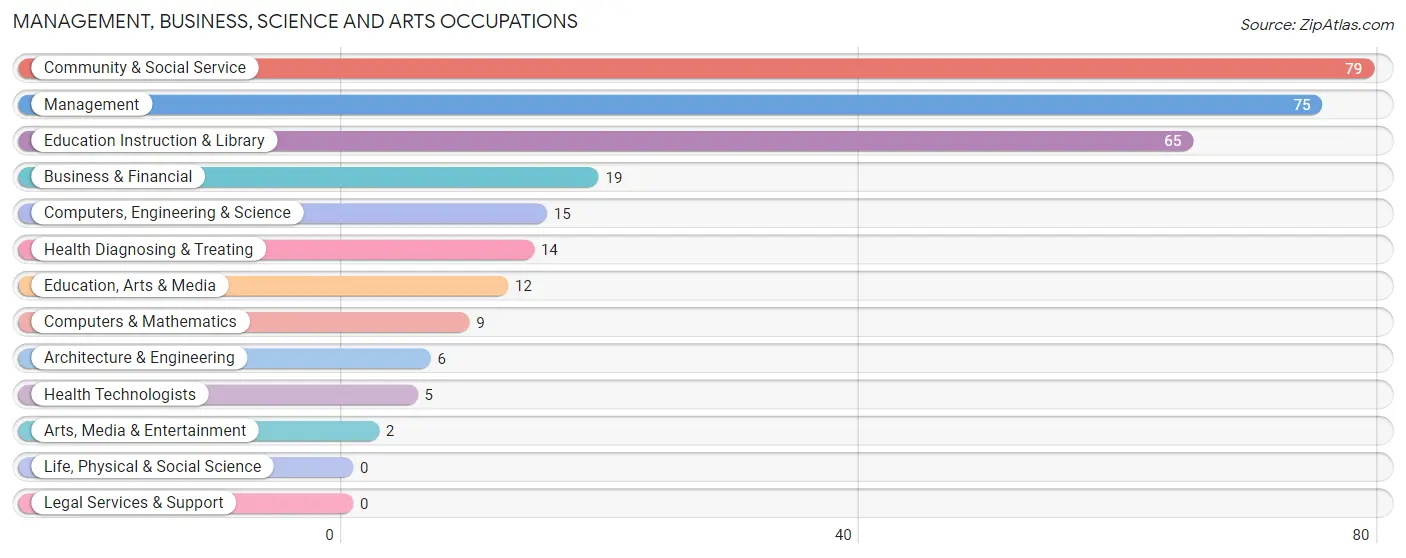
Management, Business, Science and Arts Occupations
The most common Management, Business, Science and Arts occupations in Arthur are Community & Social Service (79 | 9.0%), Management (75 | 8.5%), Education Instruction & Library (65 | 7.4%), Business & Financial (19 | 2.2%), and Computers, Engineering & Science (15 | 1.7%).
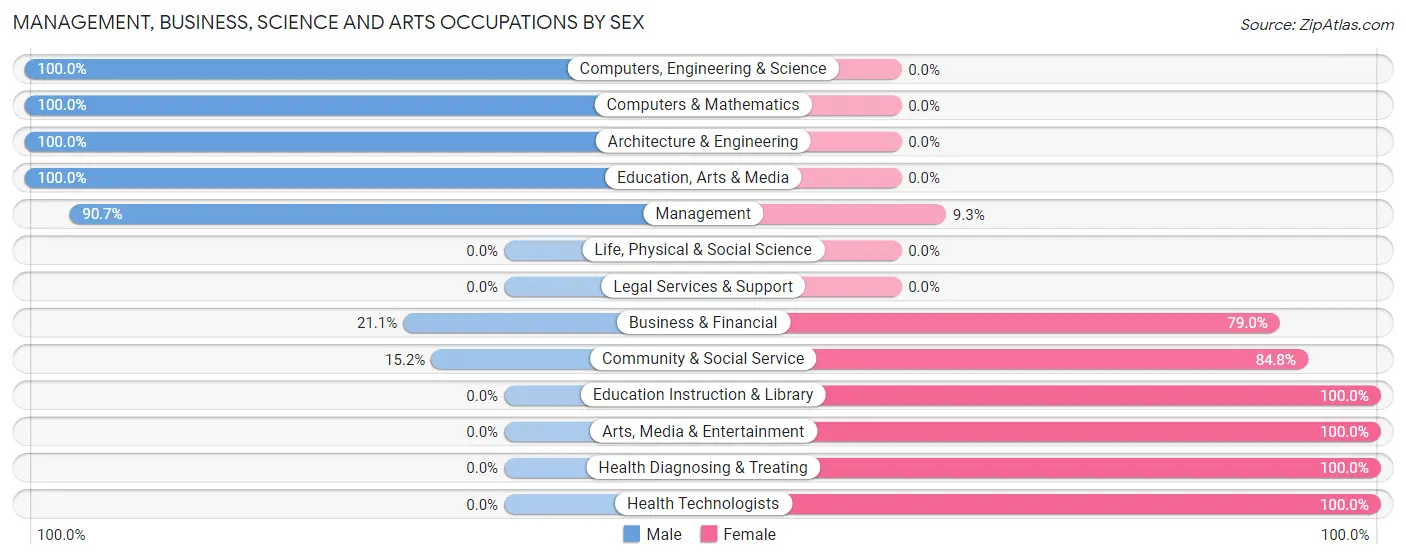
Management, Business, Science and Arts Occupations by Sex
Within the Management, Business, Science and Arts occupations in Arthur, the most male-oriented occupations are Computers, Engineering & Science (100.0%), Computers & Mathematics (100.0%), and Architecture & Engineering (100.0%), while the most female-oriented occupations are Education Instruction & Library (100.0%), Arts, Media & Entertainment (100.0%), and Health Diagnosing & Treating (100.0%).
| Occupation | Male | Female |
| Management | 68 (90.7%) | 7 (9.3%) |
| Business & Financial | 4 (21.0%) | 15 (78.9%) |
| Computers, Engineering & Science | 15 (100.0%) | 0 (0.0%) |
| Computers & Mathematics | 9 (100.0%) | 0 (0.0%) |
| Architecture & Engineering | 6 (100.0%) | 0 (0.0%) |
| Life, Physical & Social Science | 0 (0.0%) | 0 (0.0%) |
| Community & Social Service | 12 (15.2%) | 67 (84.8%) |
| Education, Arts & Media | 12 (100.0%) | 0 (0.0%) |
| Legal Services & Support | 0 (0.0%) | 0 (0.0%) |
| Education Instruction & Library | 0 (0.0%) | 65 (100.0%) |
| Arts, Media & Entertainment | 0 (0.0%) | 2 (100.0%) |
| Health Diagnosing & Treating | 0 (0.0%) | 14 (100.0%) |
| Health Technologists | 0 (0.0%) | 5 (100.0%) |
| Total (Category) | 99 (49.0%) | 103 (51.0%) |
| Total (Overall) | 501 (56.9%) | 380 (43.1%) |
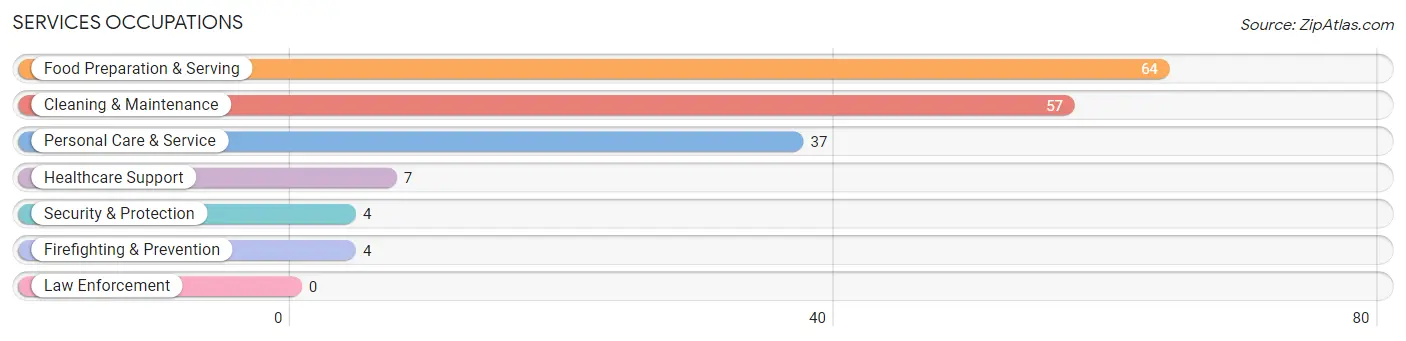
Services Occupations
The most common Services occupations in Arthur are Food Preparation & Serving (64 | 7.3%), Cleaning & Maintenance (57 | 6.5%), Personal Care & Service (37 | 4.2%), Healthcare Support (7 | 0.8%), and Security & Protection (4 | 0.4%).
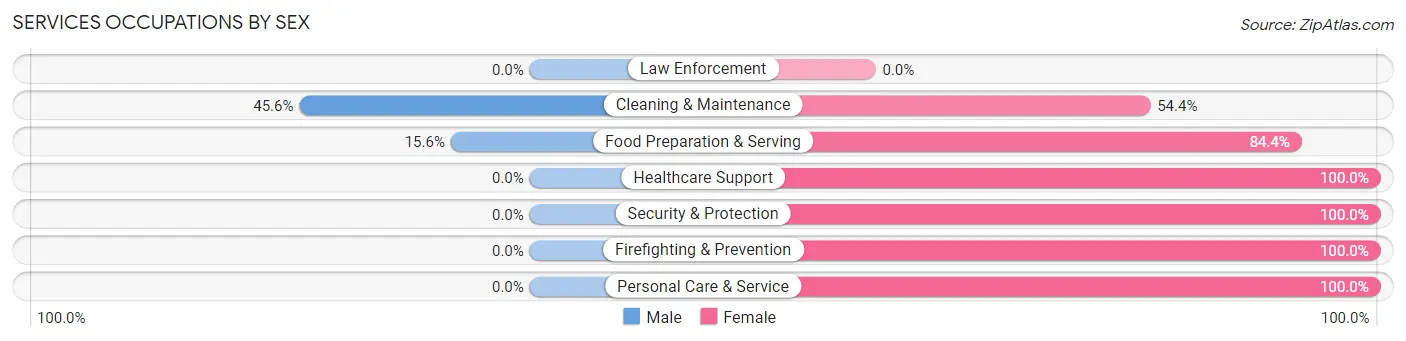
Services Occupations by Sex
Within the Services occupations in Arthur, the most male-oriented occupations are Cleaning & Maintenance (45.6%), and Food Preparation & Serving (15.6%), while the most female-oriented occupations are Healthcare Support (100.0%), Security & Protection (100.0%), and Firefighting & Prevention (100.0%).
| Occupation | Male | Female |
| Healthcare Support | 0 (0.0%) | 7 (100.0%) |
| Security & Protection | 0 (0.0%) | 4 (100.0%) |
| Firefighting & Prevention | 0 (0.0%) | 4 (100.0%) |
| Law Enforcement | 0 (0.0%) | 0 (0.0%) |
| Food Preparation & Serving | 10 (15.6%) | 54 (84.4%) |
| Cleaning & Maintenance | 26 (45.6%) | 31 (54.4%) |
| Personal Care & Service | 0 (0.0%) | 37 (100.0%) |
| Total (Category) | 36 (21.3%) | 133 (78.7%) |
| Total (Overall) | 501 (56.9%) | 380 (43.1%) |
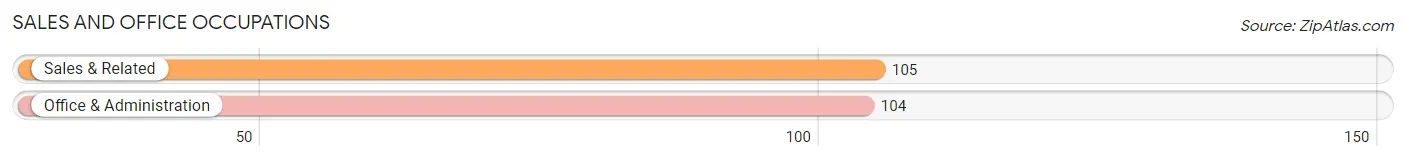
Sales and Office Occupations
The most common Sales and Office occupations in Arthur are Sales & Related (105 | 11.9%), and Office & Administration (104 | 11.8%).
Sales and Office Occupations by Sex
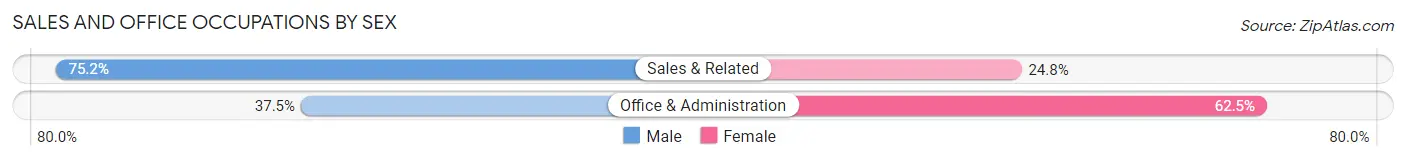
| Occupation | Male | Female |
| Sales & Related | 79 (75.2%) | 26 (24.8%) |
| Office & Administration | 39 (37.5%) | 65 (62.5%) |
| Total (Category) | 118 (56.5%) | 91 (43.5%) |
| Total (Overall) | 501 (56.9%) | 380 (43.1%) |
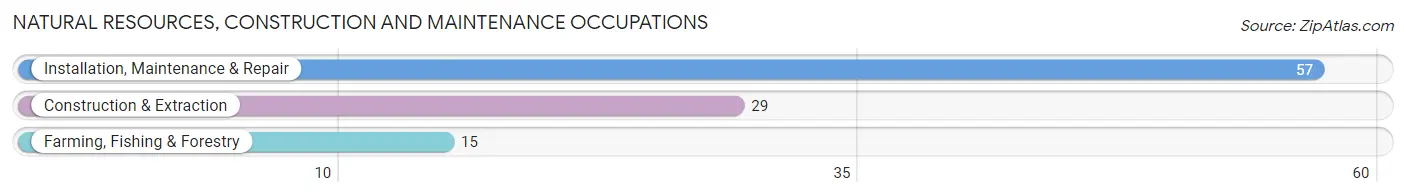
Natural Resources, Construction and Maintenance Occupations
The most common Natural Resources, Construction and Maintenance occupations in Arthur are Installation, Maintenance & Repair (57 | 6.5%), Construction & Extraction (29 | 3.3%), and Farming, Fishing & Forestry (15 | 1.7%).
Natural Resources, Construction and Maintenance Occupations by Sex
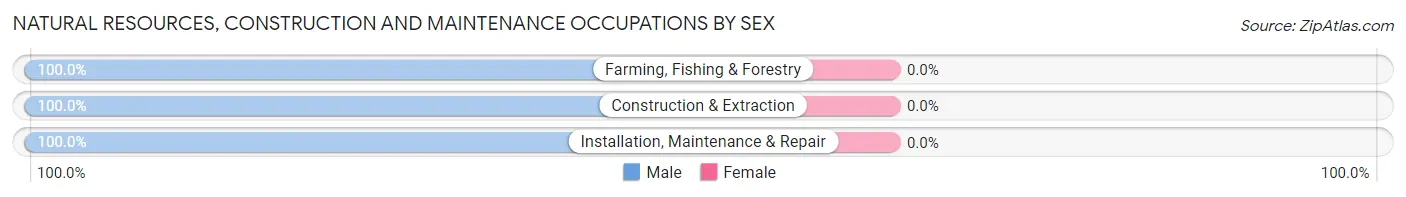
| Occupation | Male | Female |
| Farming, Fishing & Forestry | 15 (100.0%) | 0 (0.0%) |
| Construction & Extraction | 29 (100.0%) | 0 (0.0%) |
| Installation, Maintenance & Repair | 57 (100.0%) | 0 (0.0%) |
| Total (Category) | 101 (100.0%) | 0 (0.0%) |
| Total (Overall) | 501 (56.9%) | 380 (43.1%) |
Production, Transportation and Moving Occupations
The most common Production, Transportation and Moving occupations in Arthur are Production (101 | 11.5%), Material Moving (65 | 7.4%), and Transportation (34 | 3.9%).
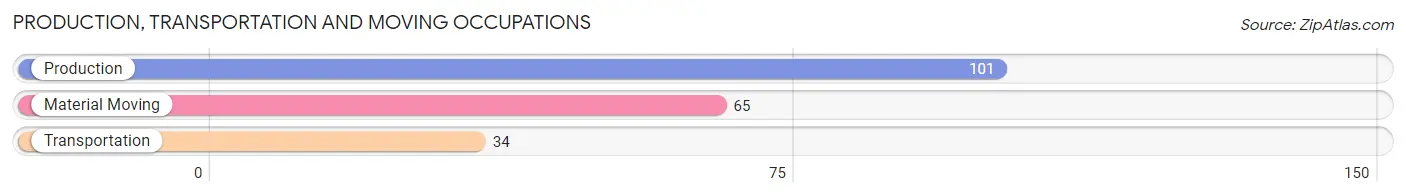
Production, Transportation and Moving Occupations by Sex
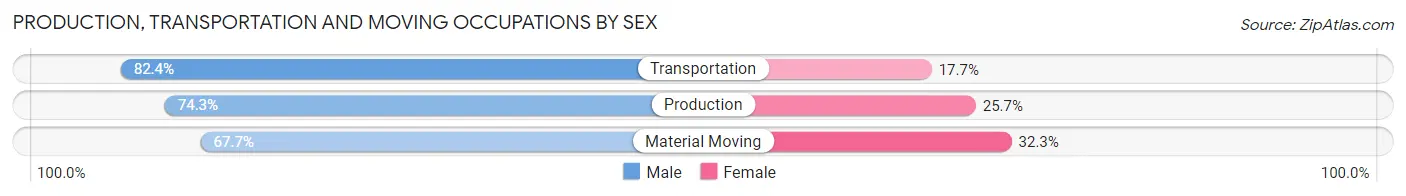
| Occupation | Male | Female |
| Production | 75 (74.3%) | 26 (25.7%) |
| Transportation | 28 (82.4%) | 6 (17.6%) |
| Material Moving | 44 (67.7%) | 21 (32.3%) |
| Total (Category) | 147 (73.5%) | 53 (26.5%) |
| Total (Overall) | 501 (56.9%) | 380 (43.1%) |
Employment Industries by Sex in Arthur
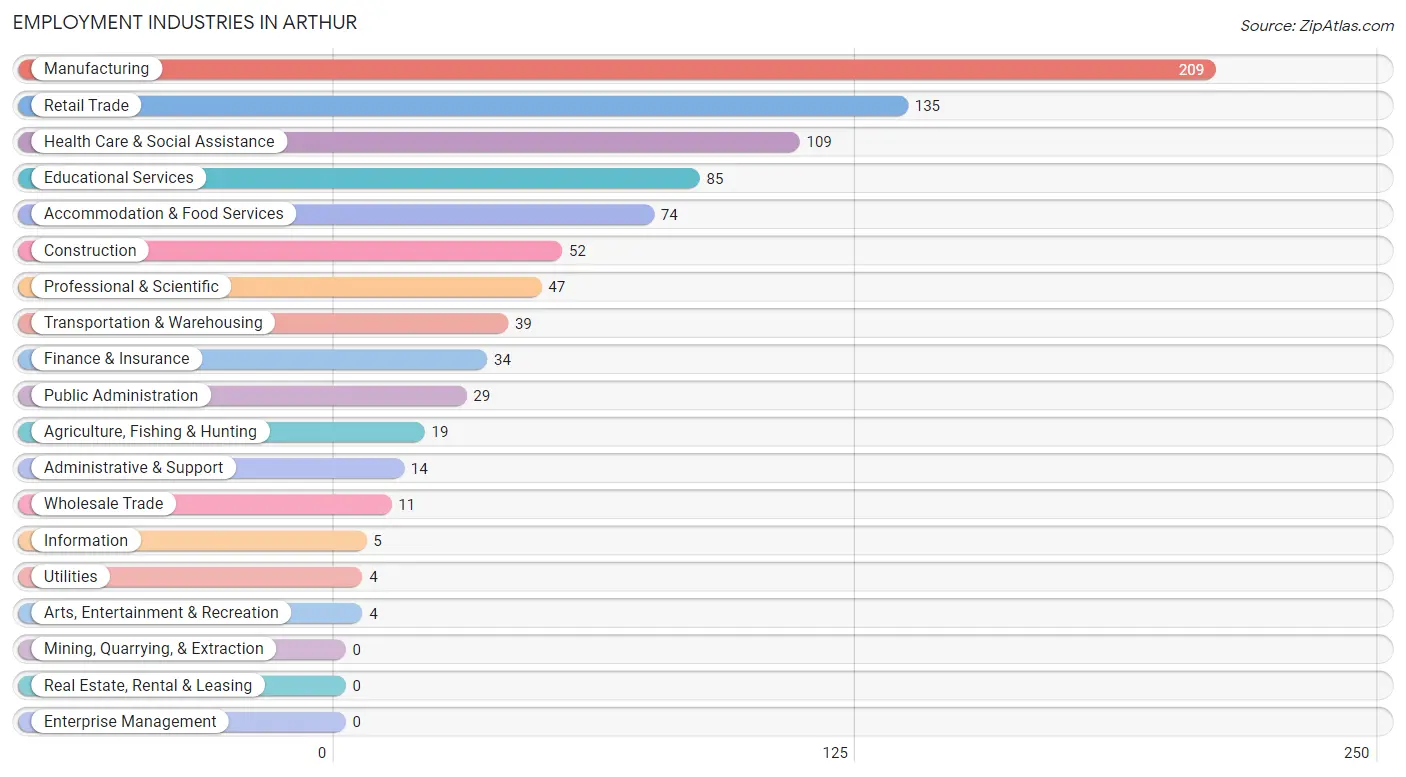
Employment Industries in Arthur
The major employment industries in Arthur include Manufacturing (209 | 23.7%), Retail Trade (135 | 15.3%), Health Care & Social Assistance (109 | 12.4%), Educational Services (85 | 9.7%), and Accommodation & Food Services (74 | 8.4%).
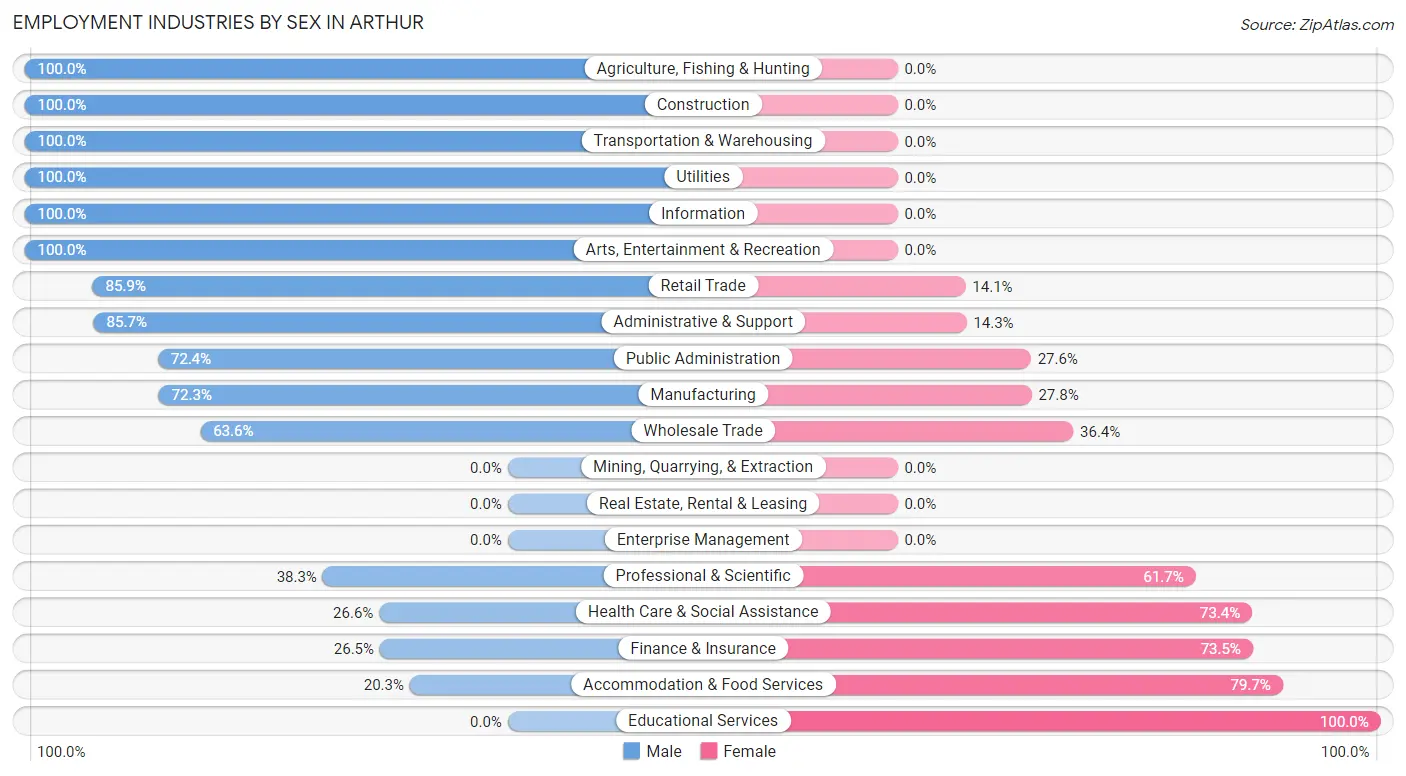
Employment Industries by Sex in Arthur
The Arthur industries that see more men than women are Agriculture, Fishing & Hunting (100.0%), Construction (100.0%), and Transportation & Warehousing (100.0%), whereas the industries that tend to have a higher number of women are Educational Services (100.0%), Accommodation & Food Services (79.7%), and Finance & Insurance (73.5%).
| Industry | Male | Female |
| Agriculture, Fishing & Hunting | 19 (100.0%) | 0 (0.0%) |
| Mining, Quarrying, & Extraction | 0 (0.0%) | 0 (0.0%) |
| Construction | 52 (100.0%) | 0 (0.0%) |
| Manufacturing | 151 (72.3%) | 58 (27.8%) |
| Wholesale Trade | 7 (63.6%) | 4 (36.4%) |
| Retail Trade | 116 (85.9%) | 19 (14.1%) |
| Transportation & Warehousing | 39 (100.0%) | 0 (0.0%) |
| Utilities | 4 (100.0%) | 0 (0.0%) |
| Information | 5 (100.0%) | 0 (0.0%) |
| Finance & Insurance | 9 (26.5%) | 25 (73.5%) |
| Real Estate, Rental & Leasing | 0 (0.0%) | 0 (0.0%) |
| Professional & Scientific | 18 (38.3%) | 29 (61.7%) |
| Enterprise Management | 0 (0.0%) | 0 (0.0%) |
| Administrative & Support | 12 (85.7%) | 2 (14.3%) |
| Educational Services | 0 (0.0%) | 85 (100.0%) |
| Health Care & Social Assistance | 29 (26.6%) | 80 (73.4%) |
| Arts, Entertainment & Recreation | 4 (100.0%) | 0 (0.0%) |
| Accommodation & Food Services | 15 (20.3%) | 59 (79.7%) |
| Public Administration | 21 (72.4%) | 8 (27.6%) |
| Total | 501 (56.9%) | 380 (43.1%) |
Education in Arthur
School Enrollment in Arthur
The most common levels of schooling among the 344 students in Arthur are high school (150 | 43.6%), middle school (75 | 21.8%), and college / undergraduate (50 | 14.5%).
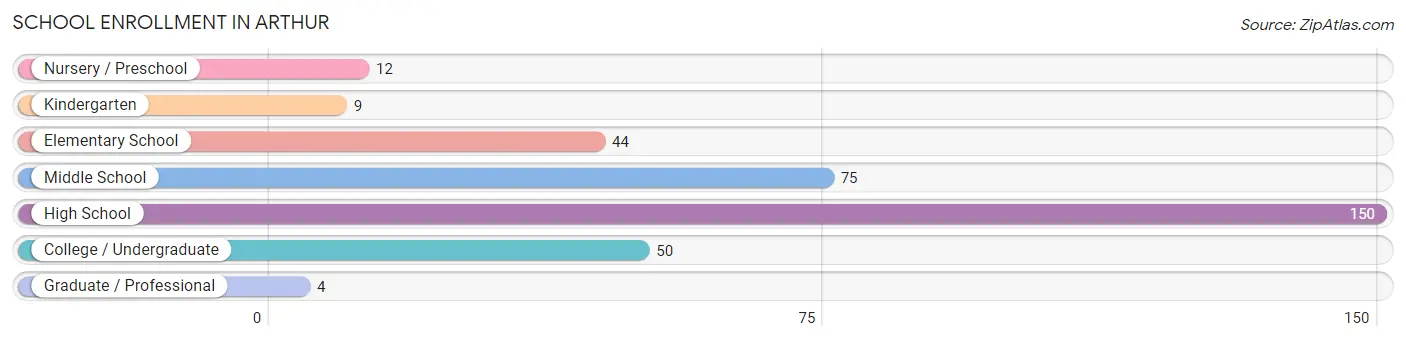
| School Level | # Students | % Students |
| Nursery / Preschool | 12 | 3.5% |
| Kindergarten | 9 | 2.6% |
| Elementary School | 44 | 12.8% |
| Middle School | 75 | 21.8% |
| High School | 150 | 43.6% |
| College / Undergraduate | 50 | 14.5% |
| Graduate / Professional | 4 | 1.2% |
| Total | 344 | 100.0% |
School Enrollment by Age by Funding Source in Arthur
Out of a total of 344 students who are enrolled in schools in Arthur, 52 (15.1%) attend a private institution, while the remaining 292 (84.9%) are enrolled in public schools. The age group of 3 to 4 year olds has the highest likelihood of being enrolled in private schools, with 6 (50.0% in the age bracket) enrolled. Conversely, the age group of 18 to 19 year olds has the lowest likelihood of being enrolled in a private school, with 18 (100.0% in the age bracket) attending a public institution.
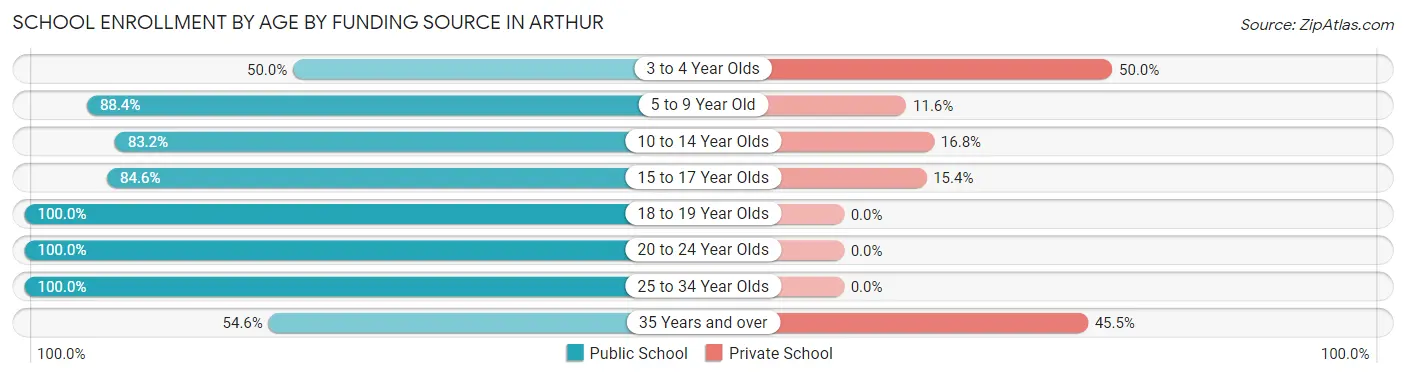
| Age Bracket | Public School | Private School |
| 3 to 4 Year Olds | 6 (50.0%) | 6 (50.0%) |
| 5 to 9 Year Old | 38 (88.4%) | 5 (11.6%) |
| 10 to 14 Year Olds | 99 (83.2%) | 20 (16.8%) |
| 15 to 17 Year Olds | 88 (84.6%) | 16 (15.4%) |
| 18 to 19 Year Olds | 18 (100.0%) | 0 (0.0%) |
| 20 to 24 Year Olds | 8 (100.0%) | 0 (0.0%) |
| 25 to 34 Year Olds | 29 (100.0%) | 0 (0.0%) |
| 35 Years and over | 6 (54.5%) | 5 (45.5%) |
| Total | 292 (84.9%) | 52 (15.1%) |
Educational Attainment by Field of Study in Arthur
Education (141 | 45.5%), business (32 | 10.3%), science & technology (31 | 10.0%), arts & humanities (23 | 7.4%), and bio, nature & agricultural (20 | 6.5%) are the most common fields of study among 310 individuals in Arthur who have obtained a bachelor's degree or higher.
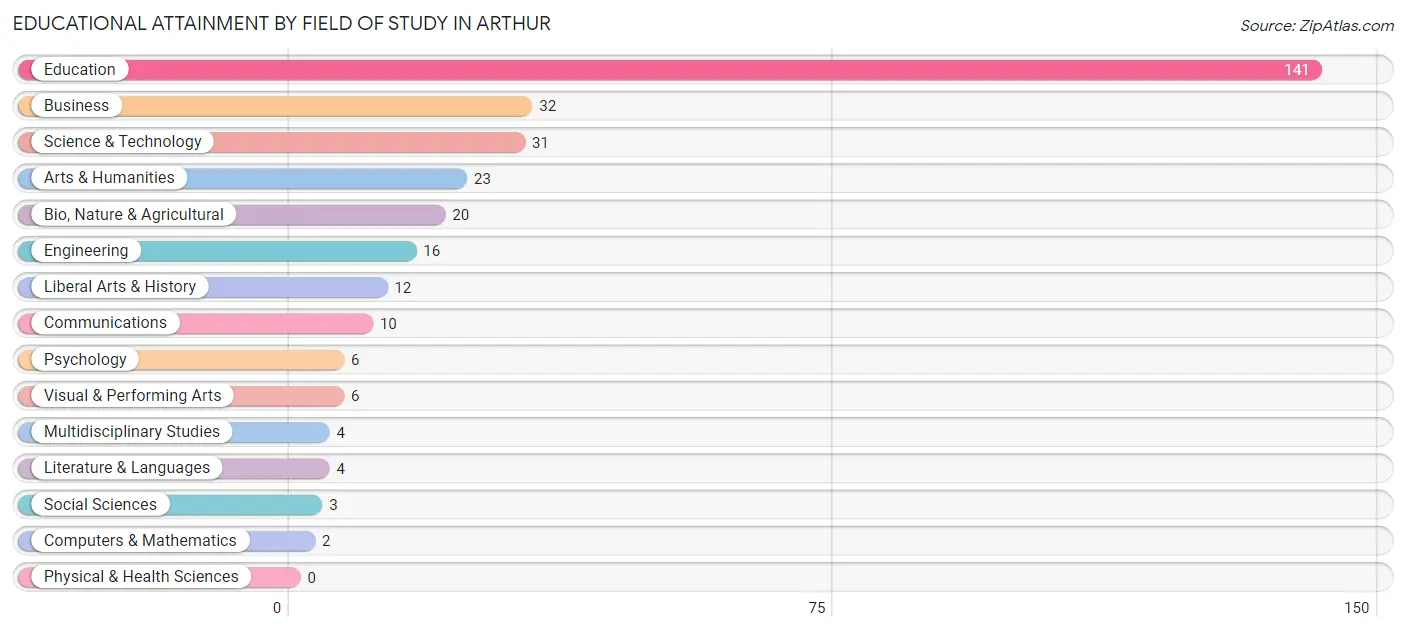
| Field of Study | # Graduates | % Graduates |
| Computers & Mathematics | 2 | 0.6% |
| Bio, Nature & Agricultural | 20 | 6.5% |
| Physical & Health Sciences | 0 | 0.0% |
| Psychology | 6 | 1.9% |
| Social Sciences | 3 | 1.0% |
| Engineering | 16 | 5.2% |
| Multidisciplinary Studies | 4 | 1.3% |
| Science & Technology | 31 | 10.0% |
| Business | 32 | 10.3% |
| Education | 141 | 45.5% |
| Literature & Languages | 4 | 1.3% |
| Liberal Arts & History | 12 | 3.9% |
| Visual & Performing Arts | 6 | 1.9% |
| Communications | 10 | 3.2% |
| Arts & Humanities | 23 | 7.4% |
| Total | 310 | 100.0% |
Transportation & Commute in Arthur
Vehicle Availability by Sex in Arthur
The most prevalent vehicle ownership categories in Arthur are males with 2 vehicles (204, accounting for 44.4%) and females with 2 vehicles (155, making up 53.7%).
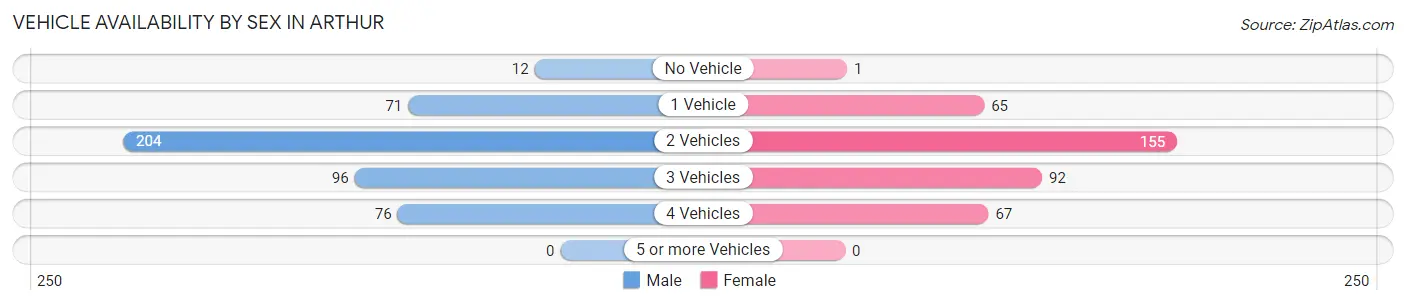
| Vehicles Available | Male | Female |
| No Vehicle | 12 (2.6%) | 1 (0.3%) |
| 1 Vehicle | 71 (15.5%) | 65 (17.1%) |
| 2 Vehicles | 204 (44.4%) | 155 (40.8%) |
| 3 Vehicles | 96 (20.9%) | 92 (24.2%) |
| 4 Vehicles | 76 (16.6%) | 67 (17.6%) |
| 5 or more Vehicles | 0 (0.0%) | 0 (0.0%) |
| Total | 459 (100.0%) | 380 (100.0%) |
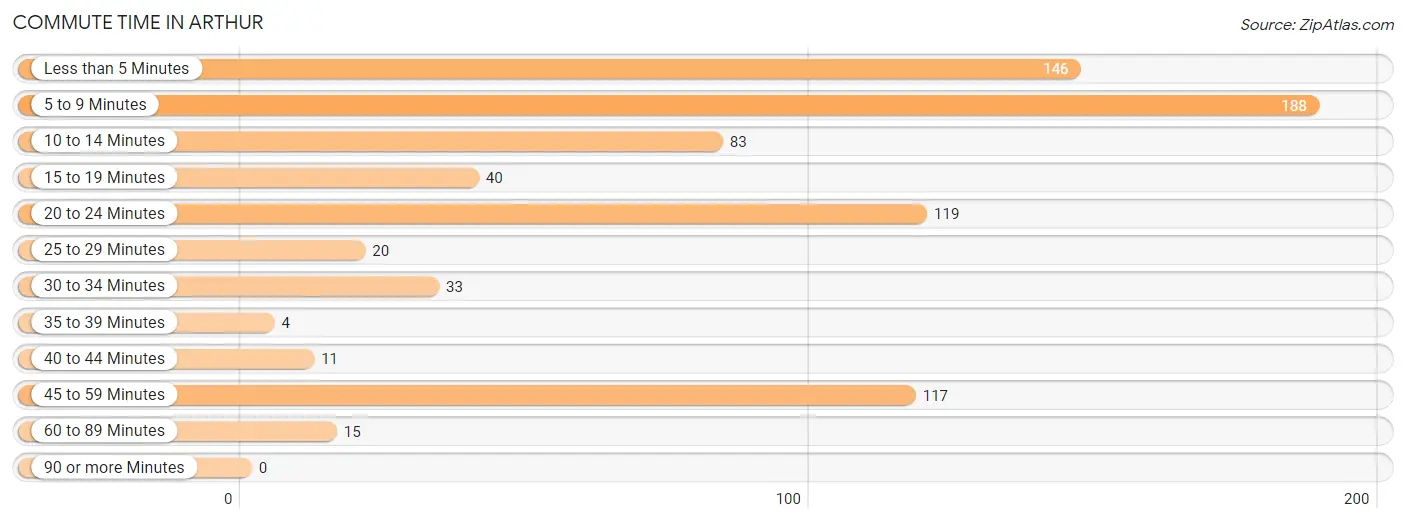
Commute Time in Arthur
The most frequently occuring commute durations in Arthur are 5 to 9 minutes (188 commuters, 24.2%), less than 5 minutes (146 commuters, 18.8%), and 20 to 24 minutes (119 commuters, 15.3%).
| Commute Time | # Commuters | % Commuters |
| Less than 5 Minutes | 146 | 18.8% |
| 5 to 9 Minutes | 188 | 24.2% |
| 10 to 14 Minutes | 83 | 10.7% |
| 15 to 19 Minutes | 40 | 5.1% |
| 20 to 24 Minutes | 119 | 15.3% |
| 25 to 29 Minutes | 20 | 2.6% |
| 30 to 34 Minutes | 33 | 4.3% |
| 35 to 39 Minutes | 4 | 0.5% |
| 40 to 44 Minutes | 11 | 1.4% |
| 45 to 59 Minutes | 117 | 15.1% |
| 60 to 89 Minutes | 15 | 1.9% |
| 90 or more Minutes | 0 | 0.0% |
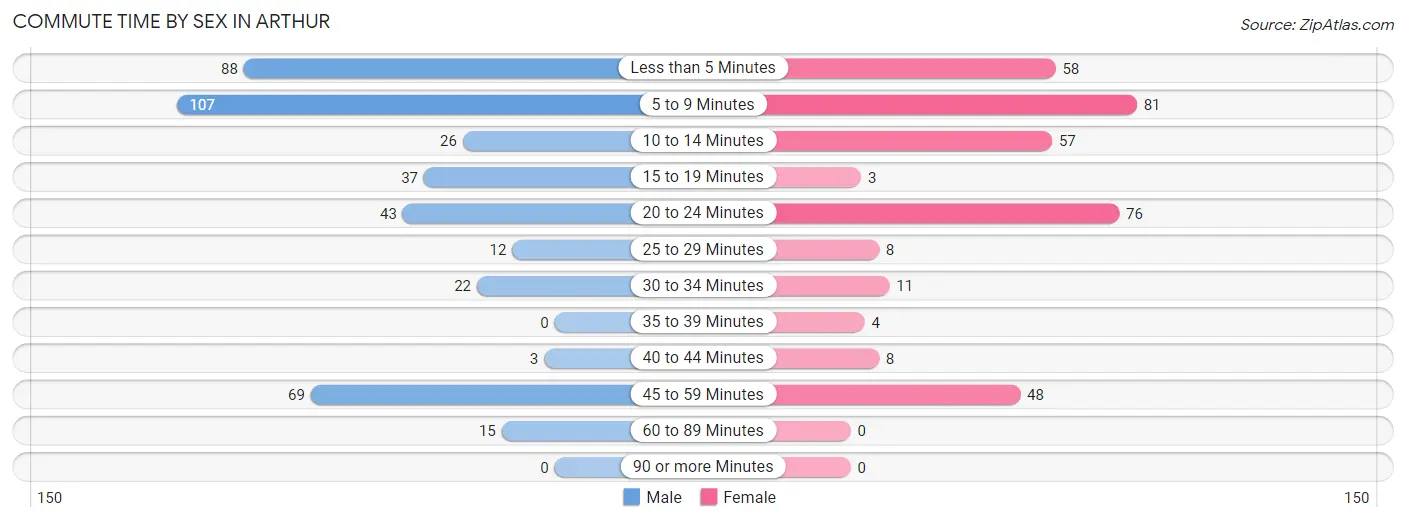
Commute Time by Sex in Arthur
The most common commute times in Arthur are 5 to 9 minutes (107 commuters, 25.4%) for males and 5 to 9 minutes (81 commuters, 22.9%) for females.
| Commute Time | Male | Female |
| Less than 5 Minutes | 88 (20.8%) | 58 (16.4%) |
| 5 to 9 Minutes | 107 (25.4%) | 81 (22.9%) |
| 10 to 14 Minutes | 26 (6.2%) | 57 (16.1%) |
| 15 to 19 Minutes | 37 (8.8%) | 3 (0.9%) |
| 20 to 24 Minutes | 43 (10.2%) | 76 (21.5%) |
| 25 to 29 Minutes | 12 (2.8%) | 8 (2.3%) |
| 30 to 34 Minutes | 22 (5.2%) | 11 (3.1%) |
| 35 to 39 Minutes | 0 (0.0%) | 4 (1.1%) |
| 40 to 44 Minutes | 3 (0.7%) | 8 (2.3%) |
| 45 to 59 Minutes | 69 (16.4%) | 48 (13.6%) |
| 60 to 89 Minutes | 15 (3.5%) | 0 (0.0%) |
| 90 or more Minutes | 0 (0.0%) | 0 (0.0%) |
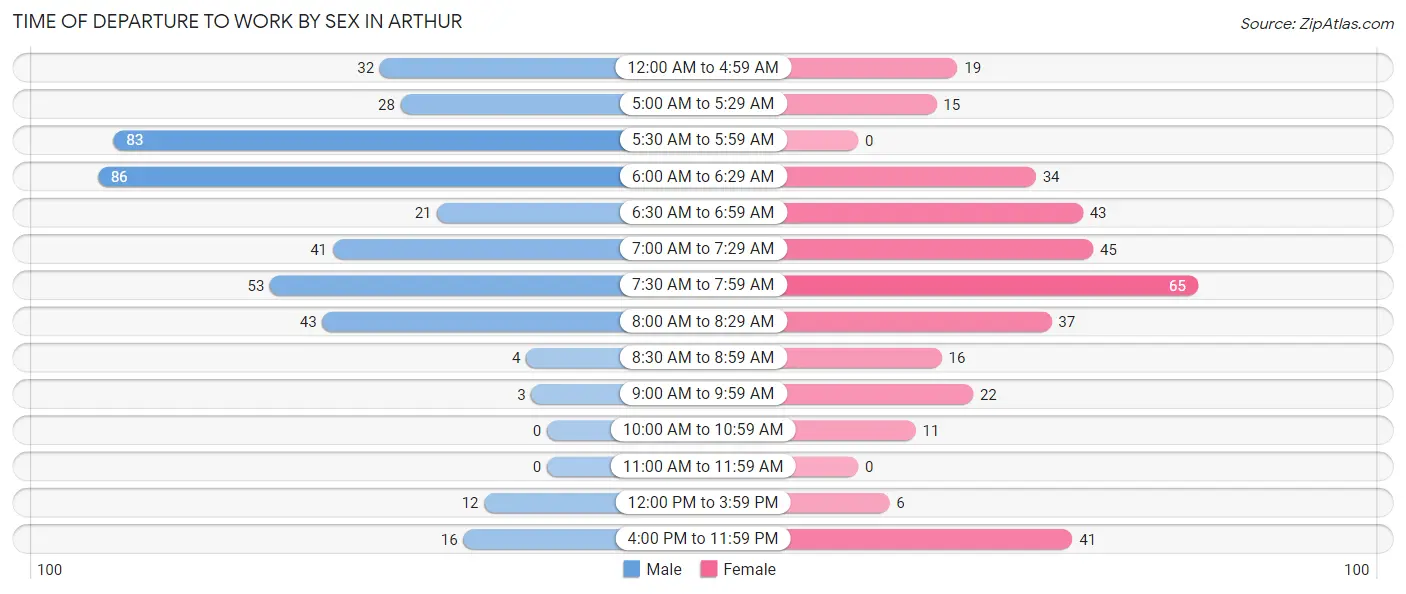
Time of Departure to Work by Sex in Arthur
The most frequent times of departure to work in Arthur are 6:00 AM to 6:29 AM (86, 20.4%) for males and 7:30 AM to 7:59 AM (65, 18.4%) for females.
| Time of Departure | Male | Female |
| 12:00 AM to 4:59 AM | 32 (7.6%) | 19 (5.4%) |
| 5:00 AM to 5:29 AM | 28 (6.6%) | 15 (4.2%) |
| 5:30 AM to 5:59 AM | 83 (19.7%) | 0 (0.0%) |
| 6:00 AM to 6:29 AM | 86 (20.4%) | 34 (9.6%) |
| 6:30 AM to 6:59 AM | 21 (5.0%) | 43 (12.1%) |
| 7:00 AM to 7:29 AM | 41 (9.7%) | 45 (12.7%) |
| 7:30 AM to 7:59 AM | 53 (12.6%) | 65 (18.4%) |
| 8:00 AM to 8:29 AM | 43 (10.2%) | 37 (10.4%) |
| 8:30 AM to 8:59 AM | 4 (0.9%) | 16 (4.5%) |
| 9:00 AM to 9:59 AM | 3 (0.7%) | 22 (6.2%) |
| 10:00 AM to 10:59 AM | 0 (0.0%) | 11 (3.1%) |
| 11:00 AM to 11:59 AM | 0 (0.0%) | 0 (0.0%) |
| 12:00 PM to 3:59 PM | 12 (2.8%) | 6 (1.7%) |
| 4:00 PM to 11:59 PM | 16 (3.8%) | 41 (11.6%) |
| Total | 422 (100.0%) | 354 (100.0%) |
Housing Occupancy in Arthur
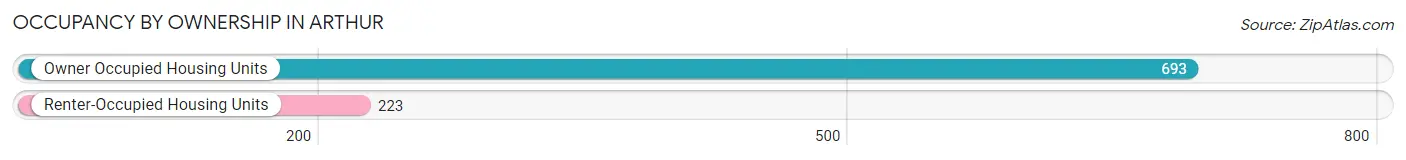
Occupancy by Ownership in Arthur
Of the total 916 dwellings in Arthur, owner-occupied units account for 693 (75.7%), while renter-occupied units make up 223 (24.3%).
| Occupancy | # Housing Units | % Housing Units |
| Owner Occupied Housing Units | 693 | 75.7% |
| Renter-Occupied Housing Units | 223 | 24.3% |
| Total Occupied Housing Units | 916 | 100.0% |
Occupancy by Household Size in Arthur
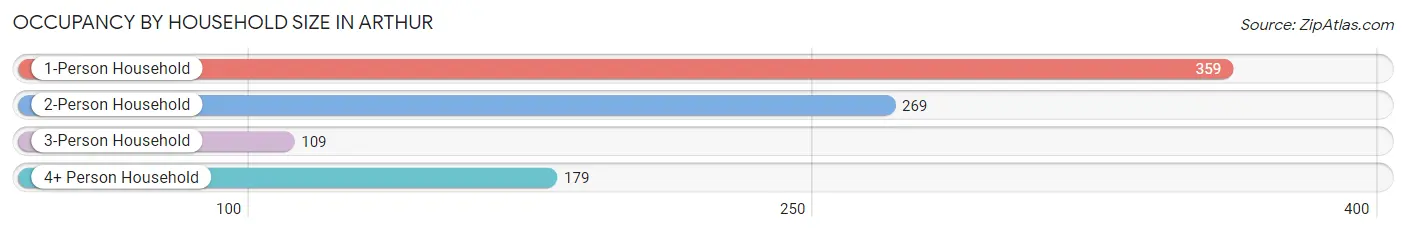
| Household Size | # Housing Units | % Housing Units |
| 1-Person Household | 359 | 39.2% |
| 2-Person Household | 269 | 29.4% |
| 3-Person Household | 109 | 11.9% |
| 4+ Person Household | 179 | 19.5% |
| Total Housing Units | 916 | 100.0% |
Occupancy by Ownership by Household Size in Arthur
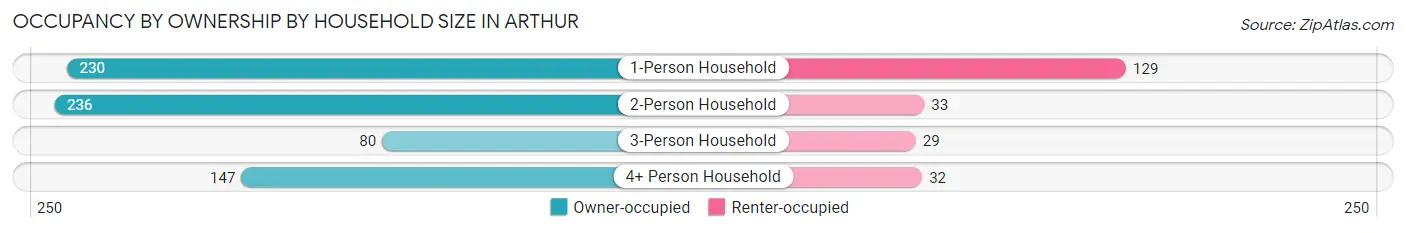
| Household Size | Owner-occupied | Renter-occupied |
| 1-Person Household | 230 (64.1%) | 129 (35.9%) |
| 2-Person Household | 236 (87.7%) | 33 (12.3%) |
| 3-Person Household | 80 (73.4%) | 29 (26.6%) |
| 4+ Person Household | 147 (82.1%) | 32 (17.9%) |
| Total Housing Units | 693 (75.7%) | 223 (24.3%) |
Occupancy by Educational Attainment in Arthur
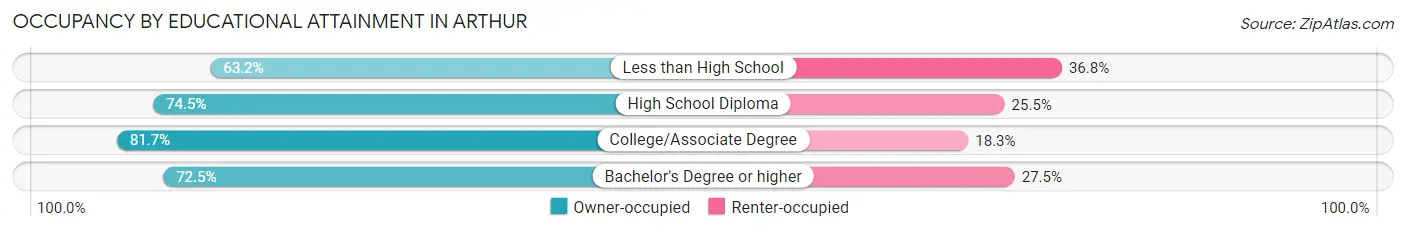
| Household Size | Owner-occupied | Renter-occupied |
| Less than High School | 72 (63.2%) | 42 (36.8%) |
| High School Diploma | 193 (74.5%) | 66 (25.5%) |
| College/Associate Degree | 304 (81.7%) | 68 (18.3%) |
| Bachelor's Degree or higher | 124 (72.5%) | 47 (27.5%) |
Occupancy by Age of Householder in Arthur
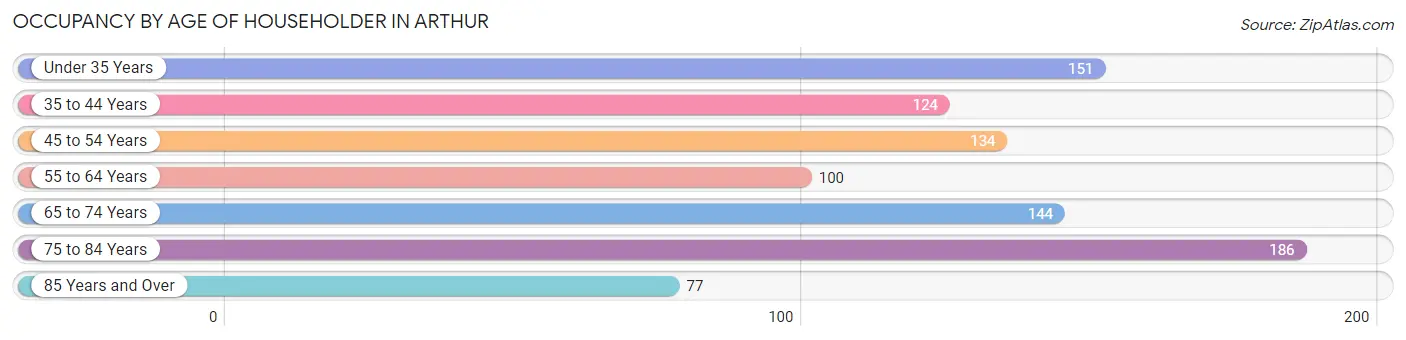
| Age Bracket | # Households | % Households |
| Under 35 Years | 151 | 16.5% |
| 35 to 44 Years | 124 | 13.5% |
| 45 to 54 Years | 134 | 14.6% |
| 55 to 64 Years | 100 | 10.9% |
| 65 to 74 Years | 144 | 15.7% |
| 75 to 84 Years | 186 | 20.3% |
| 85 Years and Over | 77 | 8.4% |
| Total | 916 | 100.0% |
Housing Finances in Arthur
Median Income by Occupancy in Arthur
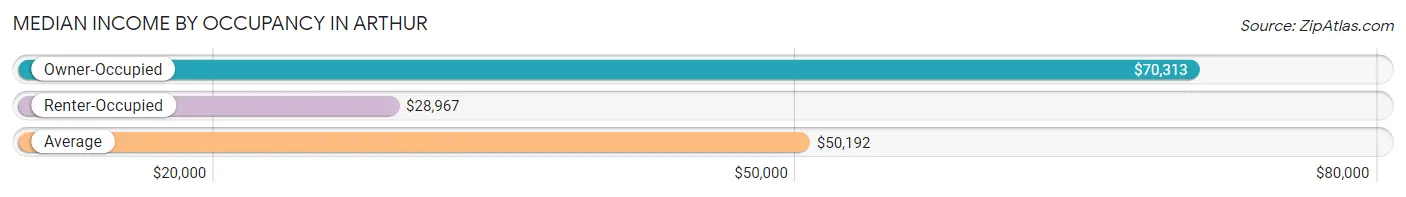
| Occupancy Type | # Households | Median Income |
| Owner-Occupied | 693 (75.7%) | $70,313 |
| Renter-Occupied | 223 (24.3%) | $28,967 |
| Average | 916 (100.0%) | $50,192 |
Occupancy by Householder Income Bracket in Arthur
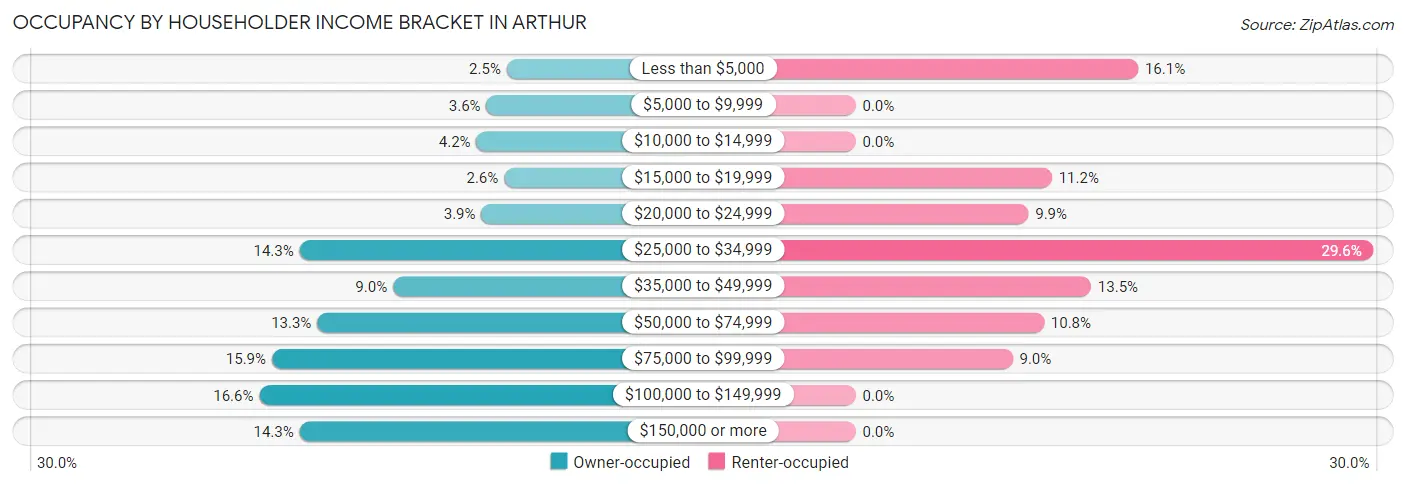
| Income Bracket | Owner-occupied | Renter-occupied |
| Less than $5,000 | 17 (2.5%) | 36 (16.1%) |
| $5,000 to $9,999 | 25 (3.6%) | 0 (0.0%) |
| $10,000 to $14,999 | 29 (4.2%) | 0 (0.0%) |
| $15,000 to $19,999 | 18 (2.6%) | 25 (11.2%) |
| $20,000 to $24,999 | 27 (3.9%) | 22 (9.9%) |
| $25,000 to $34,999 | 99 (14.3%) | 66 (29.6%) |
| $35,000 to $49,999 | 62 (8.9%) | 30 (13.5%) |
| $50,000 to $74,999 | 92 (13.3%) | 24 (10.8%) |
| $75,000 to $99,999 | 110 (15.9%) | 20 (9.0%) |
| $100,000 to $149,999 | 115 (16.6%) | 0 (0.0%) |
| $150,000 or more | 99 (14.3%) | 0 (0.0%) |
| Total | 693 (100.0%) | 223 (100.0%) |
Monthly Housing Cost Tiers in Arthur
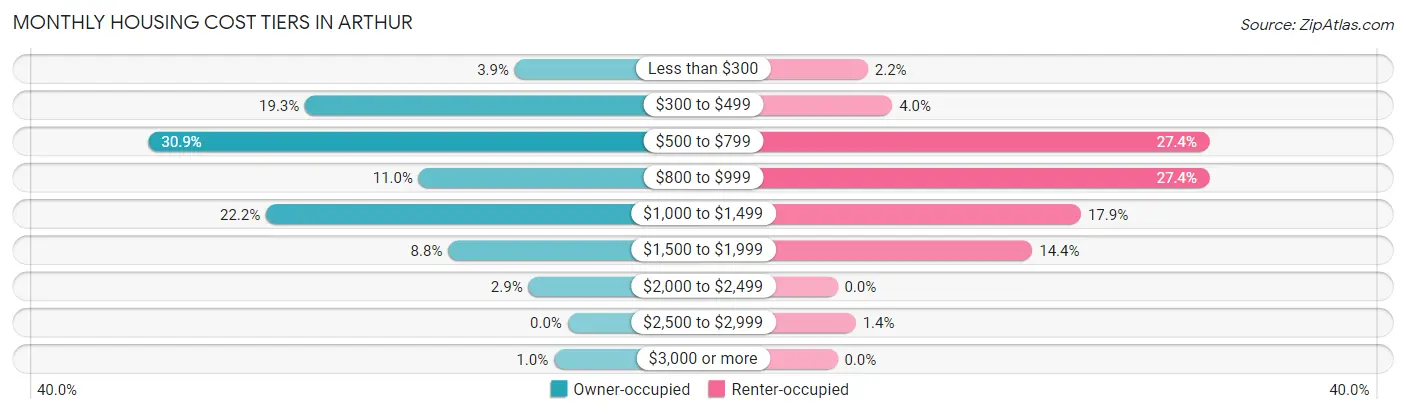
| Monthly Cost | Owner-occupied | Renter-occupied |
| Less than $300 | 27 (3.9%) | 5 (2.2%) |
| $300 to $499 | 134 (19.3%) | 9 (4.0%) |
| $500 to $799 | 214 (30.9%) | 61 (27.4%) |
| $800 to $999 | 76 (11.0%) | 61 (27.4%) |
| $1,000 to $1,499 | 154 (22.2%) | 40 (17.9%) |
| $1,500 to $1,999 | 61 (8.8%) | 32 (14.3%) |
| $2,000 to $2,499 | 20 (2.9%) | 0 (0.0%) |
| $2,500 to $2,999 | 0 (0.0%) | 3 (1.3%) |
| $3,000 or more | 7 (1.0%) | 0 (0.0%) |
| Total | 693 (100.0%) | 223 (100.0%) |
Physical Housing Characteristics in Arthur
Housing Structures in Arthur
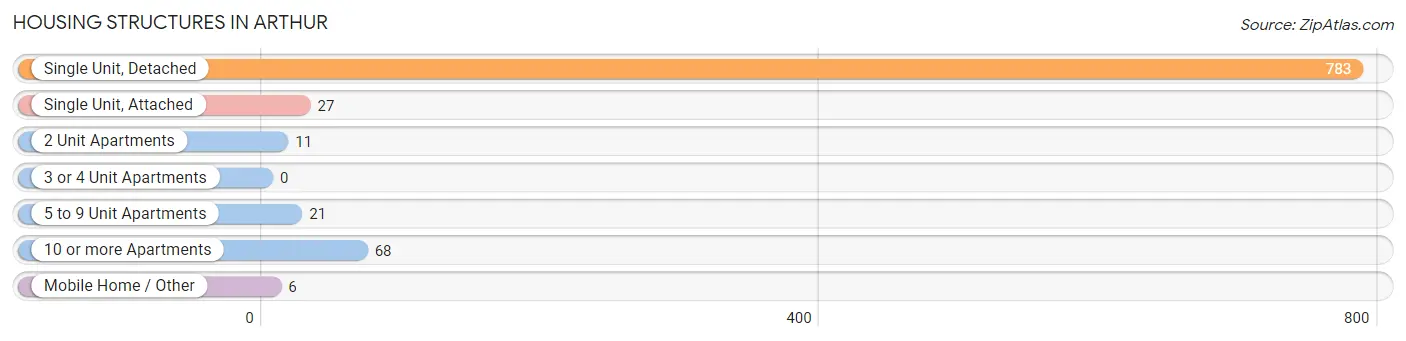
| Structure Type | # Housing Units | % Housing Units |
| Single Unit, Detached | 783 | 85.5% |
| Single Unit, Attached | 27 | 2.9% |
| 2 Unit Apartments | 11 | 1.2% |
| 3 or 4 Unit Apartments | 0 | 0.0% |
| 5 to 9 Unit Apartments | 21 | 2.3% |
| 10 or more Apartments | 68 | 7.4% |
| Mobile Home / Other | 6 | 0.7% |
| Total | 916 | 100.0% |
Housing Structures by Occupancy in Arthur
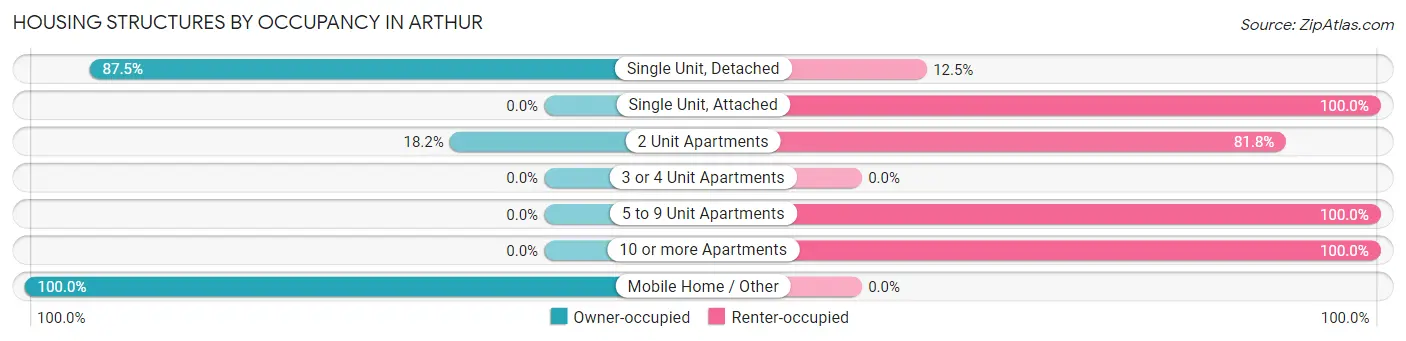
| Structure Type | Owner-occupied | Renter-occupied |
| Single Unit, Detached | 685 (87.5%) | 98 (12.5%) |
| Single Unit, Attached | 0 (0.0%) | 27 (100.0%) |
| 2 Unit Apartments | 2 (18.2%) | 9 (81.8%) |
| 3 or 4 Unit Apartments | 0 (0.0%) | 0 (0.0%) |
| 5 to 9 Unit Apartments | 0 (0.0%) | 21 (100.0%) |
| 10 or more Apartments | 0 (0.0%) | 68 (100.0%) |
| Mobile Home / Other | 6 (100.0%) | 0 (0.0%) |
| Total | 693 (75.7%) | 223 (24.3%) |
Housing Structures by Number of Rooms in Arthur
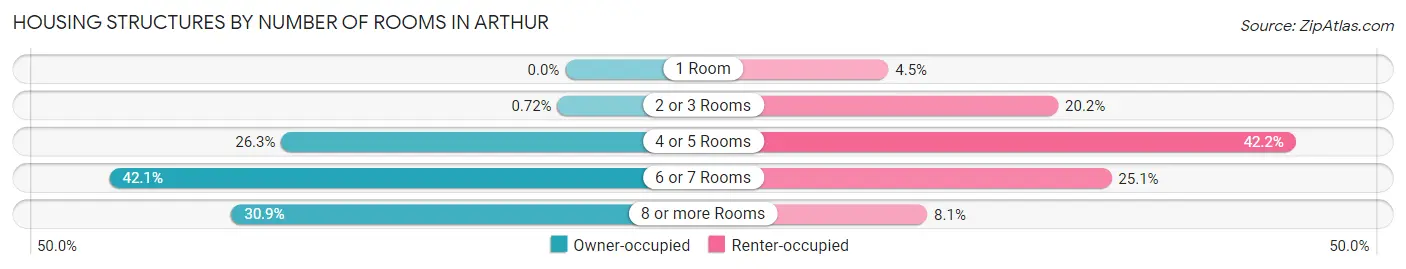
| Number of Rooms | Owner-occupied | Renter-occupied |
| 1 Room | 0 (0.0%) | 10 (4.5%) |
| 2 or 3 Rooms | 5 (0.7%) | 45 (20.2%) |
| 4 or 5 Rooms | 182 (26.3%) | 94 (42.1%) |
| 6 or 7 Rooms | 292 (42.1%) | 56 (25.1%) |
| 8 or more Rooms | 214 (30.9%) | 18 (8.1%) |
| Total | 693 (100.0%) | 223 (100.0%) |
Housing Structure by Heating Type in Arthur
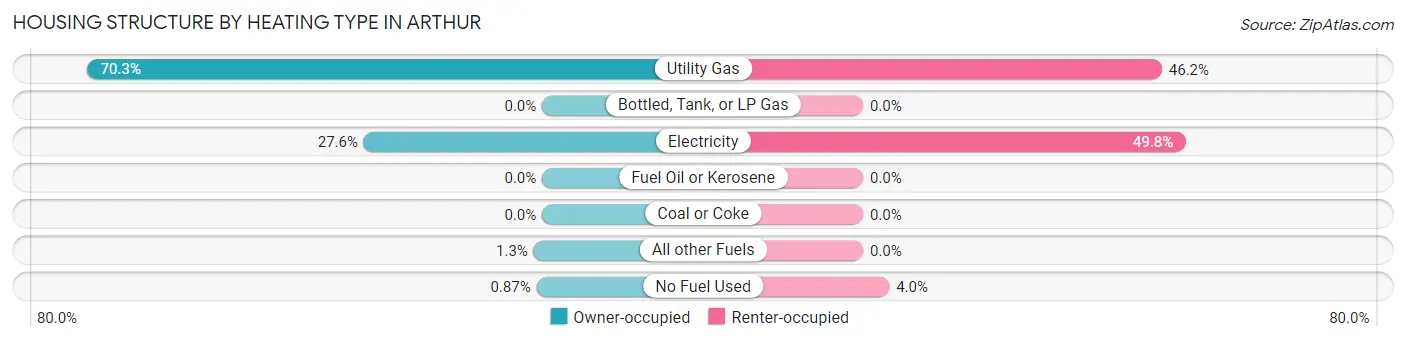
| Heating Type | Owner-occupied | Renter-occupied |
| Utility Gas | 487 (70.3%) | 103 (46.2%) |
| Bottled, Tank, or LP Gas | 0 (0.0%) | 0 (0.0%) |
| Electricity | 191 (27.6%) | 111 (49.8%) |
| Fuel Oil or Kerosene | 0 (0.0%) | 0 (0.0%) |
| Coal or Coke | 0 (0.0%) | 0 (0.0%) |
| All other Fuels | 9 (1.3%) | 0 (0.0%) |
| No Fuel Used | 6 (0.9%) | 9 (4.0%) |
| Total | 693 (100.0%) | 223 (100.0%) |
Household Vehicle Usage in Arthur
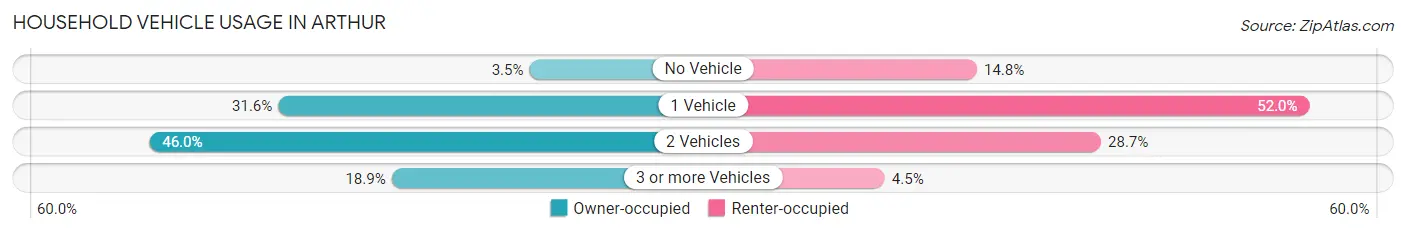
| Vehicles per Household | Owner-occupied | Renter-occupied |
| No Vehicle | 24 (3.5%) | 33 (14.8%) |
| 1 Vehicle | 219 (31.6%) | 116 (52.0%) |
| 2 Vehicles | 319 (46.0%) | 64 (28.7%) |
| 3 or more Vehicles | 131 (18.9%) | 10 (4.5%) |
| Total | 693 (100.0%) | 223 (100.0%) |
Real Estate & Mortgages in Arthur
Real Estate and Mortgage Overview in Arthur
| Characteristic | Without Mortgage | With Mortgage |
| Housing Units | 403 | 290 |
| Median Property Value | $134,900 | $122,400 |
| Median Household Income | $46,989 | $75 |
| Monthly Housing Costs | $549 | $7 |
| Real Estate Taxes | $2,381 | $6 |
Property Value by Mortgage Status in Arthur
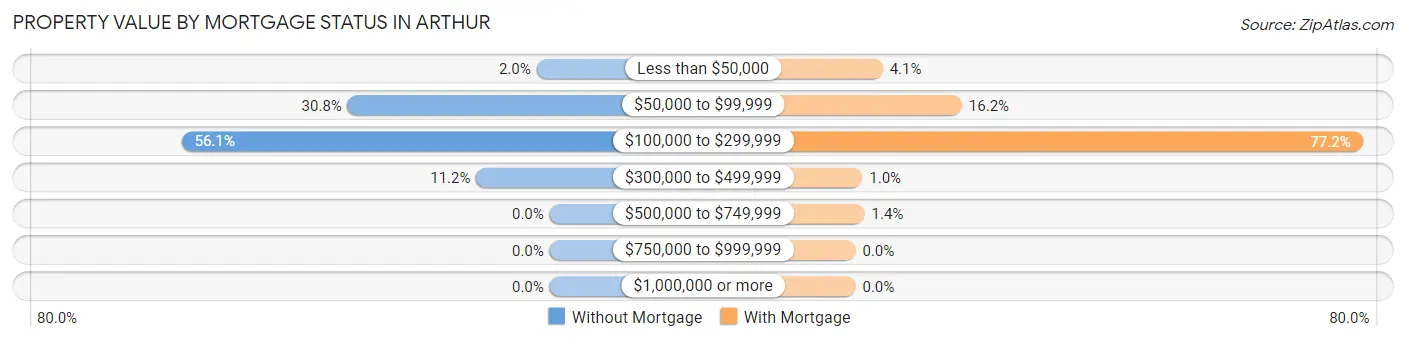
| Property Value | Without Mortgage | With Mortgage |
| Less than $50,000 | 8 (2.0%) | 12 (4.1%) |
| $50,000 to $99,999 | 124 (30.8%) | 47 (16.2%) |
| $100,000 to $299,999 | 226 (56.1%) | 224 (77.2%) |
| $300,000 to $499,999 | 45 (11.2%) | 3 (1.0%) |
| $500,000 to $749,999 | 0 (0.0%) | 4 (1.4%) |
| $750,000 to $999,999 | 0 (0.0%) | 0 (0.0%) |
| $1,000,000 or more | 0 (0.0%) | 0 (0.0%) |
| Total | 403 (100.0%) | 290 (100.0%) |
Household Income by Mortgage Status in Arthur
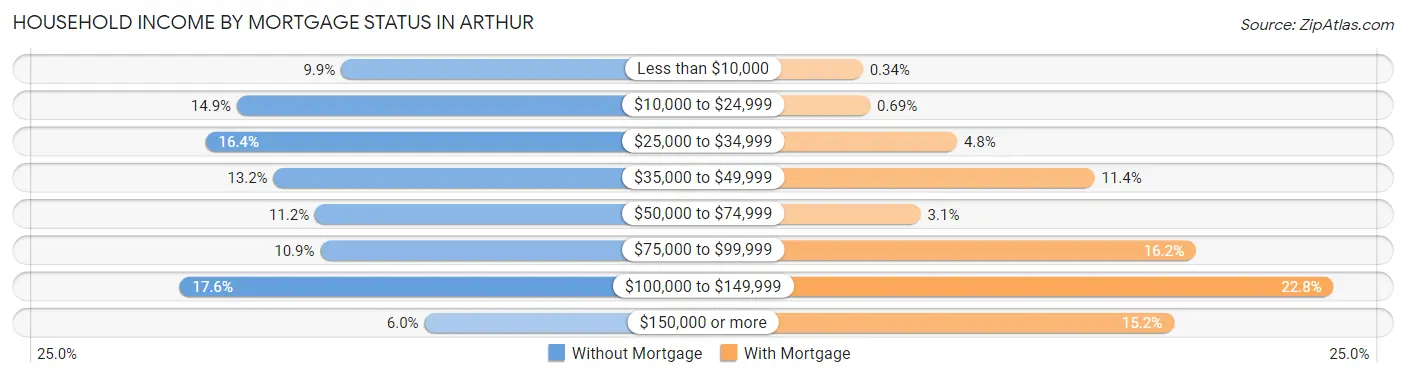
| Household Income | Without Mortgage | With Mortgage |
| Less than $10,000 | 40 (9.9%) | 1 (0.3%) |
| $10,000 to $24,999 | 60 (14.9%) | 2 (0.7%) |
| $25,000 to $34,999 | 66 (16.4%) | 14 (4.8%) |
| $35,000 to $49,999 | 53 (13.2%) | 33 (11.4%) |
| $50,000 to $74,999 | 45 (11.2%) | 9 (3.1%) |
| $75,000 to $99,999 | 44 (10.9%) | 47 (16.2%) |
| $100,000 to $149,999 | 71 (17.6%) | 66 (22.8%) |
| $150,000 or more | 24 (6.0%) | 44 (15.2%) |
| Total | 403 (100.0%) | 290 (100.0%) |
Property Value to Household Income Ratio in Arthur
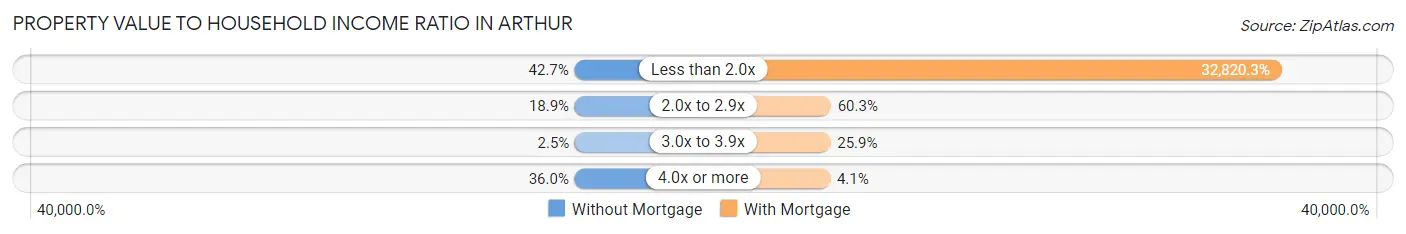
| Value-to-Income Ratio | Without Mortgage | With Mortgage |
| Less than 2.0x | 172 (42.7%) | 95,179 (32,820.3%) |
| 2.0x to 2.9x | 76 (18.9%) | 175 (60.3%) |
| 3.0x to 3.9x | 10 (2.5%) | 75 (25.9%) |
| 4.0x or more | 145 (36.0%) | 12 (4.1%) |
| Total | 403 (100.0%) | 290 (100.0%) |
Real Estate Taxes by Mortgage Status in Arthur
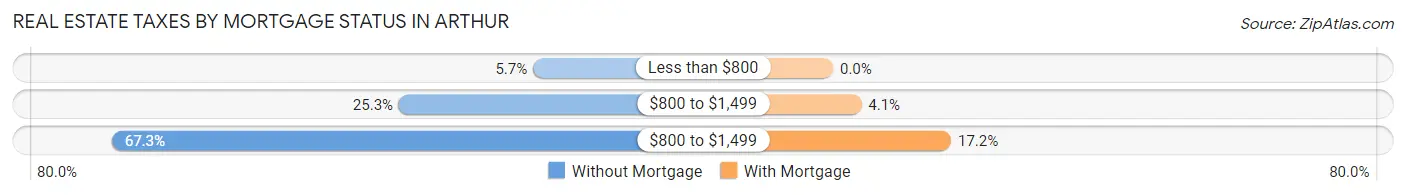
| Property Taxes | Without Mortgage | With Mortgage |
| Less than $800 | 23 (5.7%) | 0 (0.0%) |
| $800 to $1,499 | 102 (25.3%) | 12 (4.1%) |
| $800 to $1,499 | 271 (67.2%) | 50 (17.2%) |
| Total | 403 (100.0%) | 290 (100.0%) |
Health & Disability in Arthur
Health Insurance Coverage by Age in Arthur
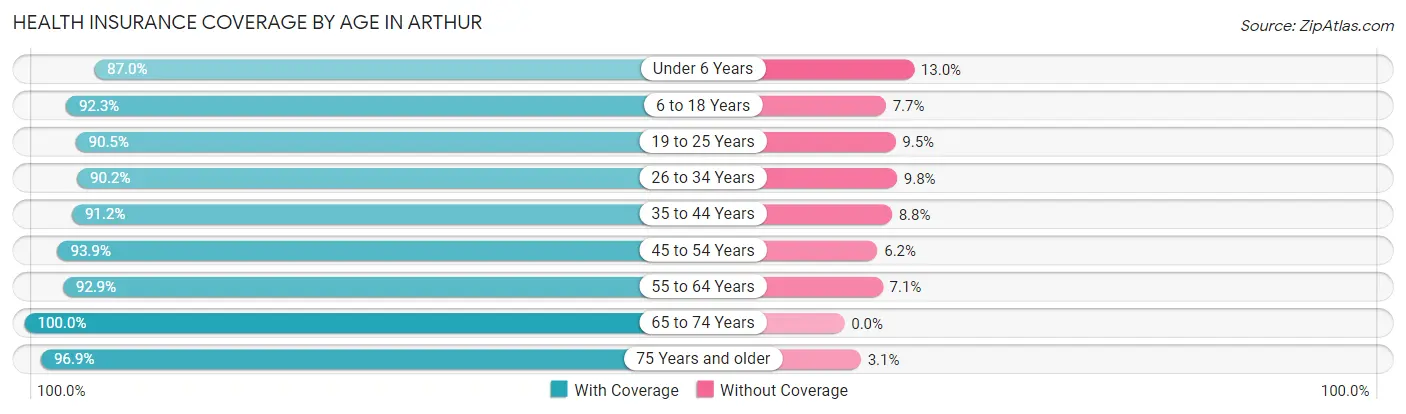
| Age Bracket | With Coverage | Without Coverage |
| Under 6 Years | 114 (87.0%) | 17 (13.0%) |
| 6 to 18 Years | 263 (92.3%) | 22 (7.7%) |
| 19 to 25 Years | 114 (90.5%) | 12 (9.5%) |
| 26 to 34 Years | 184 (90.2%) | 20 (9.8%) |
| 35 to 44 Years | 165 (91.2%) | 16 (8.8%) |
| 45 to 54 Years | 229 (93.9%) | 15 (6.1%) |
| 55 to 64 Years | 143 (92.9%) | 11 (7.1%) |
| 65 to 74 Years | 225 (100.0%) | 0 (0.0%) |
| 75 Years and older | 380 (96.9%) | 12 (3.1%) |
| Total | 1,817 (93.6%) | 125 (6.4%) |
Health Insurance Coverage by Citizenship Status in Arthur
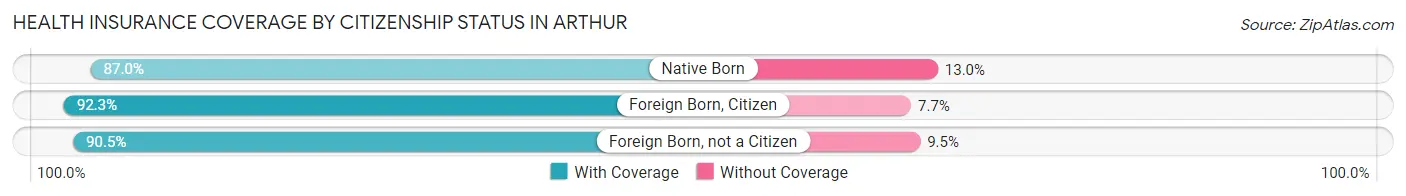
| Citizenship Status | With Coverage | Without Coverage |
| Native Born | 114 (87.0%) | 17 (13.0%) |
| Foreign Born, Citizen | 263 (92.3%) | 22 (7.7%) |
| Foreign Born, not a Citizen | 114 (90.5%) | 12 (9.5%) |
Health Insurance Coverage by Household Income in Arthur
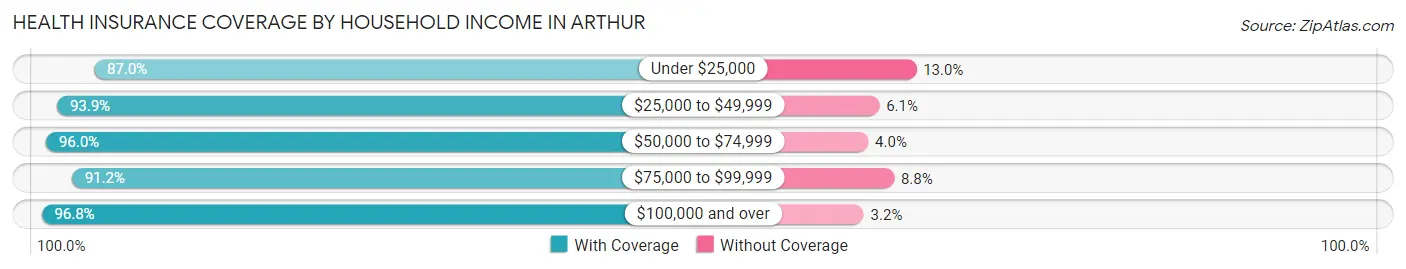
| Household Income | With Coverage | Without Coverage |
| Under $25,000 | 281 (87.0%) | 42 (13.0%) |
| $25,000 to $49,999 | 387 (93.9%) | 25 (6.1%) |
| $50,000 to $74,999 | 216 (96.0%) | 9 (4.0%) |
| $75,000 to $99,999 | 289 (91.2%) | 28 (8.8%) |
| $100,000 and over | 644 (96.8%) | 21 (3.2%) |
Public vs Private Health Insurance Coverage by Age in Arthur
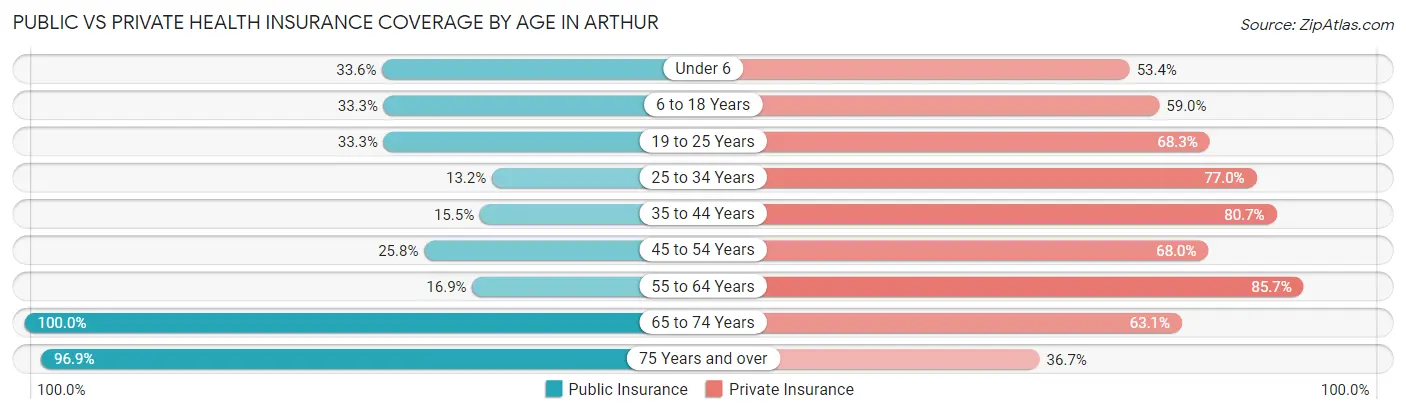
| Age Bracket | Public Insurance | Private Insurance |
| Under 6 | 44 (33.6%) | 70 (53.4%) |
| 6 to 18 Years | 95 (33.3%) | 168 (59.0%) |
| 19 to 25 Years | 42 (33.3%) | 86 (68.2%) |
| 25 to 34 Years | 27 (13.2%) | 157 (77.0%) |
| 35 to 44 Years | 28 (15.5%) | 146 (80.7%) |
| 45 to 54 Years | 63 (25.8%) | 166 (68.0%) |
| 55 to 64 Years | 26 (16.9%) | 132 (85.7%) |
| 65 to 74 Years | 225 (100.0%) | 142 (63.1%) |
| 75 Years and over | 380 (96.9%) | 144 (36.7%) |
| Total | 930 (47.9%) | 1,211 (62.4%) |
Disability Status by Sex by Age in Arthur
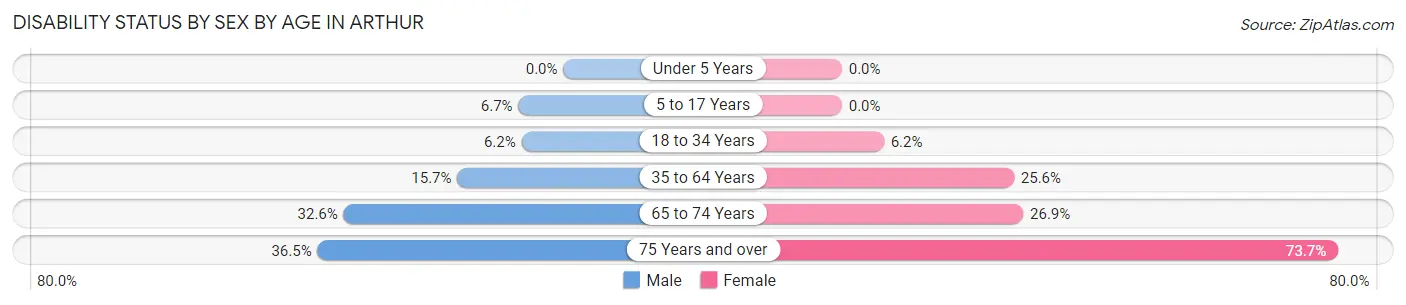
| Age Bracket | Male | Female |
| Under 5 Years | 0 (0.0%) | 0 (0.0%) |
| 5 to 17 Years | 8 (6.7%) | 0 (0.0%) |
| 18 to 34 Years | 10 (6.2%) | 12 (6.2%) |
| 35 to 64 Years | 48 (15.7%) | 70 (25.6%) |
| 65 to 74 Years | 31 (32.6%) | 35 (26.9%) |
| 75 Years and over | 46 (36.5%) | 196 (73.7%) |
Disability Class by Sex by Age in Arthur
Disability Class: Hearing Difficulty
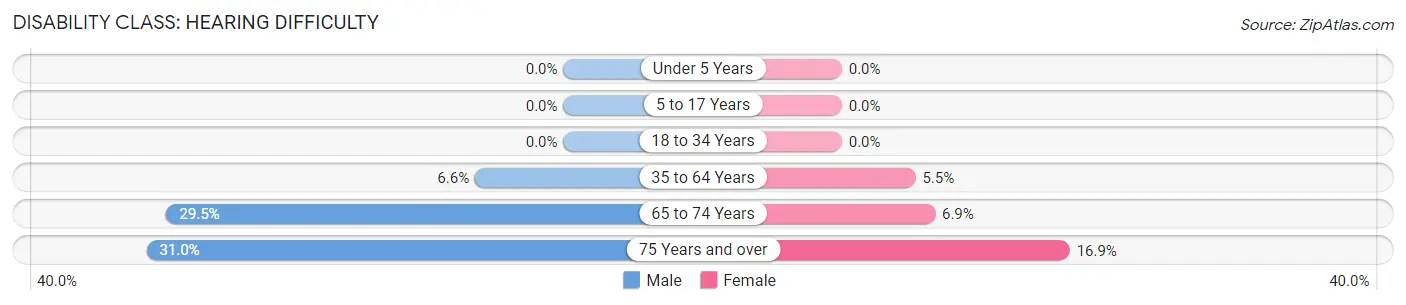
| Age Bracket | Male | Female |
| Under 5 Years | 0 (0.0%) | 0 (0.0%) |
| 5 to 17 Years | 0 (0.0%) | 0 (0.0%) |
| 18 to 34 Years | 0 (0.0%) | 0 (0.0%) |
| 35 to 64 Years | 20 (6.6%) | 15 (5.5%) |
| 65 to 74 Years | 28 (29.5%) | 9 (6.9%) |
| 75 Years and over | 39 (30.9%) | 45 (16.9%) |
Disability Class: Vision Difficulty
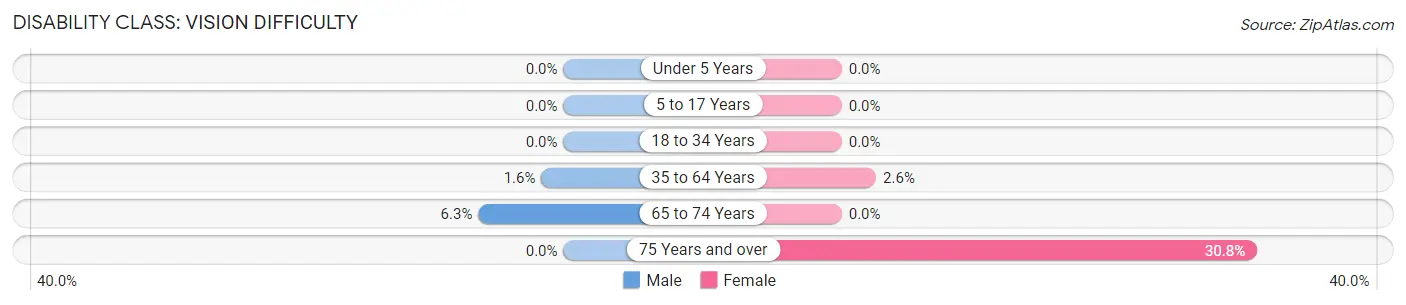
| Age Bracket | Male | Female |
| Under 5 Years | 0 (0.0%) | 0 (0.0%) |
| 5 to 17 Years | 0 (0.0%) | 0 (0.0%) |
| 18 to 34 Years | 0 (0.0%) | 0 (0.0%) |
| 35 to 64 Years | 5 (1.6%) | 7 (2.5%) |
| 65 to 74 Years | 6 (6.3%) | 0 (0.0%) |
| 75 Years and over | 0 (0.0%) | 82 (30.8%) |
Disability Class: Cognitive Difficulty
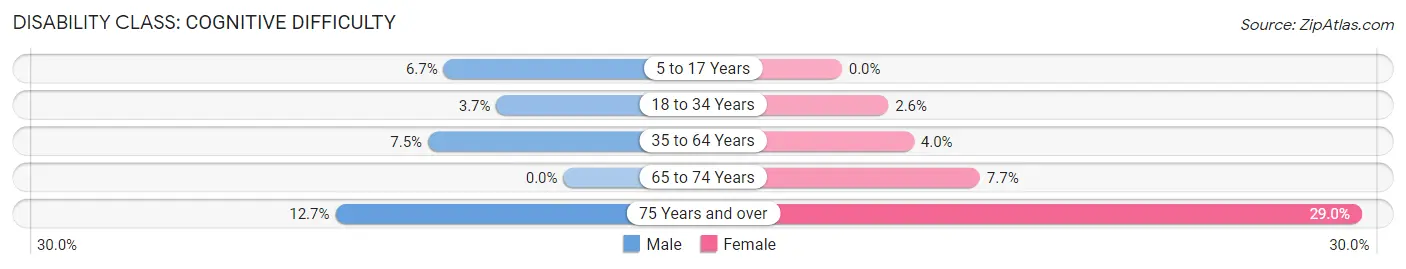
| Age Bracket | Male | Female |
| 5 to 17 Years | 8 (6.7%) | 0 (0.0%) |
| 18 to 34 Years | 6 (3.7%) | 5 (2.6%) |
| 35 to 64 Years | 23 (7.5%) | 11 (4.0%) |
| 65 to 74 Years | 0 (0.0%) | 10 (7.7%) |
| 75 Years and over | 16 (12.7%) | 77 (28.9%) |
Disability Class: Ambulatory Difficulty
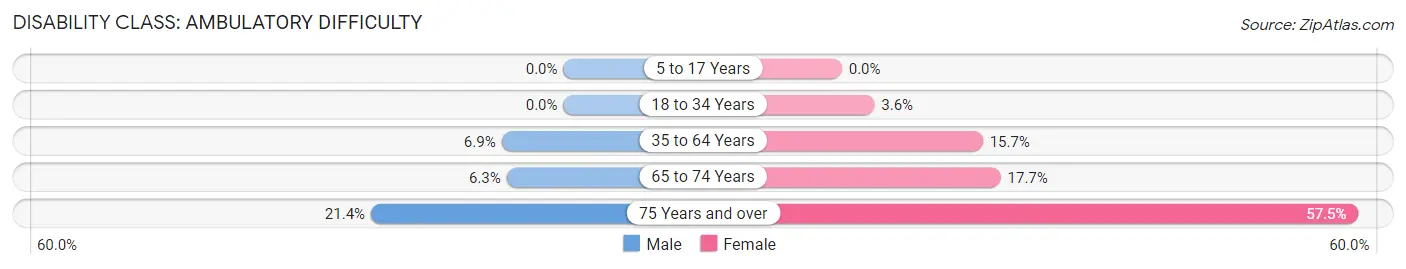
| Age Bracket | Male | Female |
| 5 to 17 Years | 0 (0.0%) | 0 (0.0%) |
| 18 to 34 Years | 0 (0.0%) | 7 (3.6%) |
| 35 to 64 Years | 21 (6.9%) | 43 (15.7%) |
| 65 to 74 Years | 6 (6.3%) | 23 (17.7%) |
| 75 Years and over | 27 (21.4%) | 153 (57.5%) |
Disability Class: Self-Care Difficulty
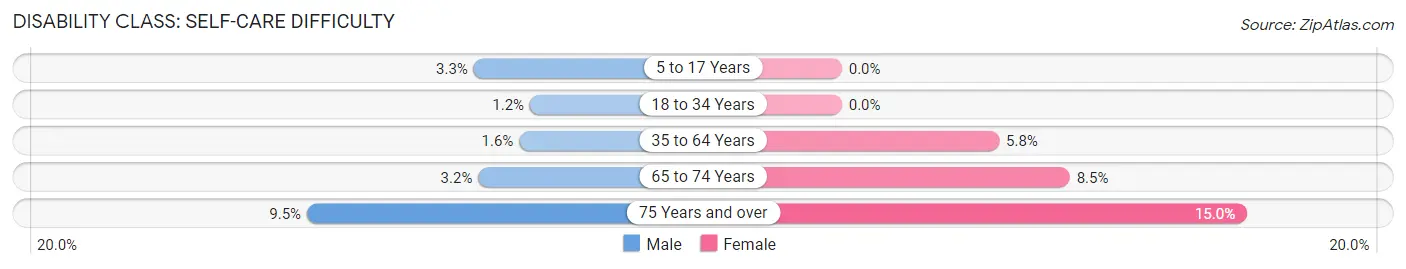
| Age Bracket | Male | Female |
| 5 to 17 Years | 4 (3.3%) | 0 (0.0%) |
| 18 to 34 Years | 2 (1.2%) | 0 (0.0%) |
| 35 to 64 Years | 5 (1.6%) | 16 (5.8%) |
| 65 to 74 Years | 3 (3.2%) | 11 (8.5%) |
| 75 Years and over | 12 (9.5%) | 40 (15.0%) |
Technology Access in Arthur
Computing Device Access in Arthur
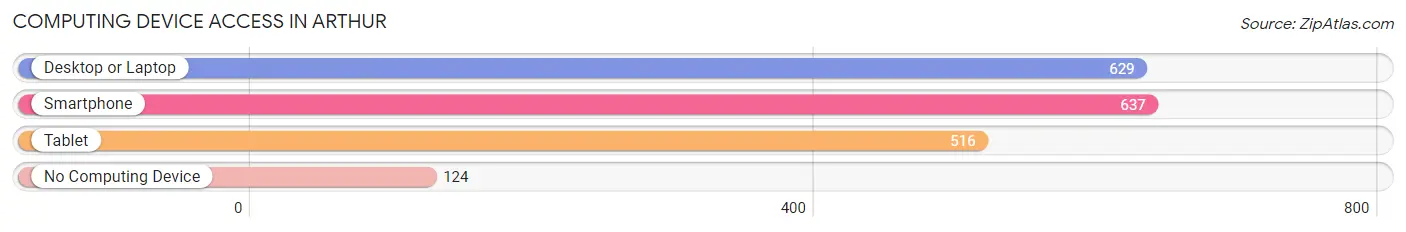
| Device Type | # Households | % Households |
| Desktop or Laptop | 629 | 68.7% |
| Smartphone | 637 | 69.5% |
| Tablet | 516 | 56.3% |
| No Computing Device | 124 | 13.5% |
| Total | 916 | 100.0% |
Internet Access in Arthur
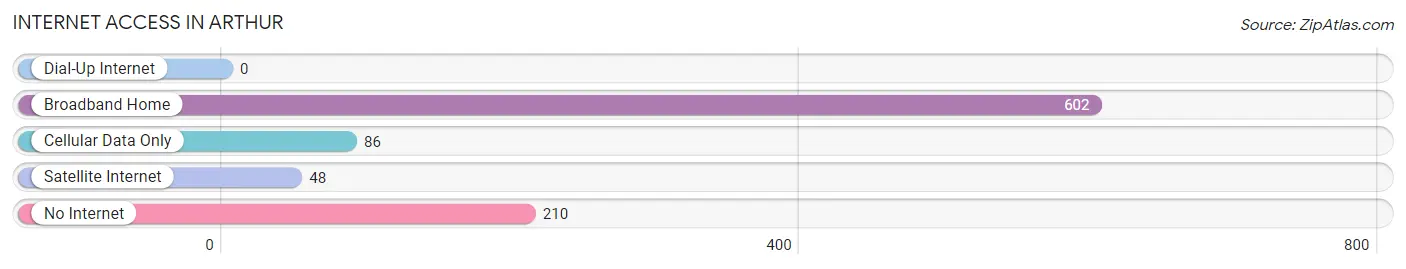
| Internet Type | # Households | % Households |
| Dial-Up Internet | 0 | 0.0% |
| Broadband Home | 602 | 65.7% |
| Cellular Data Only | 86 | 9.4% |
| Satellite Internet | 48 | 5.2% |
| No Internet | 210 | 22.9% |
| Total | 916 | 100.0% |
Arthur Summary
Arthur, Illinois is a small village located in Douglas County, Illinois. It is situated in the east-central part of the state, about 25 miles south of Champaign and about 30 miles north of Decatur. The village has a population of about 1,800 people and covers an area of 0.7 square miles.
History
Arthur was founded in 1871 by a group of settlers from Ohio. The village was named after Arthur T. Pierson, a prominent local businessman. The first post office was established in 1872 and the village was incorporated in 1875.
In the late 19th century, Arthur was a thriving agricultural community. The village was home to several grain elevators, a flour mill, a creamery, and a lumber yard. The village also had a hotel, a bank, and several stores.
Geography
Arthur is located in east-central Illinois, about 25 miles south of Champaign and about 30 miles north of Decatur. The village is situated in the heart of the Illinois prairie, with rolling hills and flat plains. The village is surrounded by farmland and is located near the Embarras River.
The climate in Arthur is typical of the Midwest, with hot summers and cold winters. The average temperature in July is 79 degrees Fahrenheit, while the average temperature in January is 24 degrees Fahrenheit.
Economy
The economy of Arthur is largely based on agriculture. The village is home to several grain elevators, a flour mill, and a creamery. The village also has several stores and restaurants.
The village is also home to several manufacturing companies, including a plastics manufacturer and a metal fabrication company. The village is also home to a number of small businesses, including a bakery, a furniture store, and a hardware store.
Demographics
As of the 2010 census, the population of Arthur was 1,817. The racial makeup of the village was 97.3% White, 0.7% African American, 0.2% Native American, 0.2% Asian, 0.2% from other races, and 1.6% from two or more races. Hispanic or Latino of any race were 1.2% of the population.
The median household income in Arthur was $45,000, and the median family income was $50,000. The per capita income was $20,000. About 10.3% of families and 12.2% of the population were below the poverty line, including 16.2% of those under age 18 and 8.2% of those age 65 or over.
The village is served by the Arthur Community Unit School District 305. The district has one elementary school, one middle school, and one high school. The village is also home to a branch of the Douglas County Public Library.
Common Questions
What is Per Capita Income in Arthur?
Per Capita income in Arthur is $32,067.
What is the Median Family Income in Arthur?
Median Family Income in Arthur is $83,500.
What is the Median Household income in Arthur?
Median Household Income in Arthur is $50,192.
What is Income or Wage Gap in Arthur?
Income or Wage Gap in Arthur is 42.9%.
Women in Arthur earn 57.1 cents for every dollar earned by a man.
What is Inequality or Gini Index in Arthur?
Inequality or Gini Index in Arthur is 0.44.
What is the Total Population of Arthur?
Total Population of Arthur is 1,992.
What is the Total Male Population of Arthur?
Total Male Population of Arthur is 868.
What is the Total Female Population of Arthur?
Total Female Population of Arthur is 1,124.
What is the Ratio of Males per 100 Females in Arthur?
There are 77.22 Males per 100 Females in Arthur.
What is the Ratio of Females per 100 Males in Arthur?
There are 129.49 Females per 100 Males in Arthur.
What is the Median Population Age in Arthur?
Median Population Age in Arthur is 48.1 Years.
What is the Average Family Size in Arthur
Average Family Size in Arthur is 2.8 People.
What is the Average Household Size in Arthur
Average Household Size in Arthur is 2.1 People.
How Large is the Labor Force in Arthur?
There are 935 People in the Labor Forcein in Arthur.
What is the Percentage of People in the Labor Force in Arthur?
55.6% of People are in the Labor Force in Arthur.
What is the Unemployment Rate in Arthur?
Unemployment Rate in Arthur is 5.9%.