Skamania County, WA Map & Demographics
Skamania County Overview
$42,162
PER CAPITA INCOME
$100,199
AVG FAMILY INCOME
$84,500
AVG HOUSEHOLD INCOME
36.7%
WAGE / INCOME GAP [ % ]
63.3¢/ $1
WAGE / INCOME GAP [ $ ]
0.44
INEQUALITY / GINI INDEX
12,118
TOTAL POPULATION
5,996
MALE POPULATION
6,122
FEMALE POPULATION
97.94
MALES / 100 FEMALES
102.10
FEMALES / 100 MALES
46.6
MEDIAN AGE
3.0
AVG FAMILY SIZE
2.5
AVG HOUSEHOLD SIZE
5,952
LABOR FORCE [ PEOPLE ]
58.4%
PERCENT IN LABOR FORCE
5.2%
UNEMPLOYMENT RATE
Skamania County Area Codes
Income in Skamania County
Income Overview in Skamania County
Per Capita Income in Skamania County is $42,162, while median incomes of families and households are $100,199 and $84,500 respectively.
| Characteristic | Number | Measure |
| Per Capita Income | 12,118 | $42,162 |
| Median Family Income | 3,264 | $100,199 |
| Mean Family Income | 3,264 | $119,493 |
| Median Household Income | 4,812 | $84,500 |
| Mean Household Income | 4,812 | $101,765 |
| Income Deficit | 3,264 | $0 |
| Wage / Income Gap (%) | 12,118 | 36.72% |
| Wage / Income Gap ($) | 12,118 | 63.28¢ per $1 |
| Gini / Inequality Index | 12,118 | 0.44 |
Earnings by Sex in Skamania County
Average Earnings in Skamania County are $44,786, $57,712 for men and $36,522 for women, a difference of 36.7%.
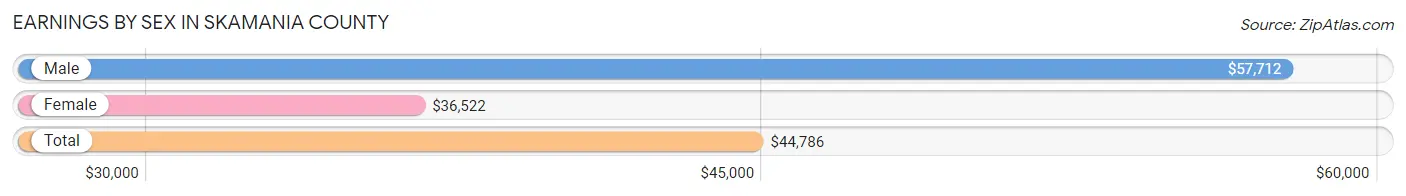
| Sex | Number | Average Earnings |
| Male | 3,265 (51.8%) | $57,712 |
| Female | 3,034 (48.2%) | $36,522 |
| Total | 6,299 (100.0%) | $44,786 |
Earnings by Sex by Income Bracket in Skamania County
The most common earnings brackets in Skamania County are $100,000+ for men (663 | 20.3%) and $100,000+ for women (386 | 12.7%).
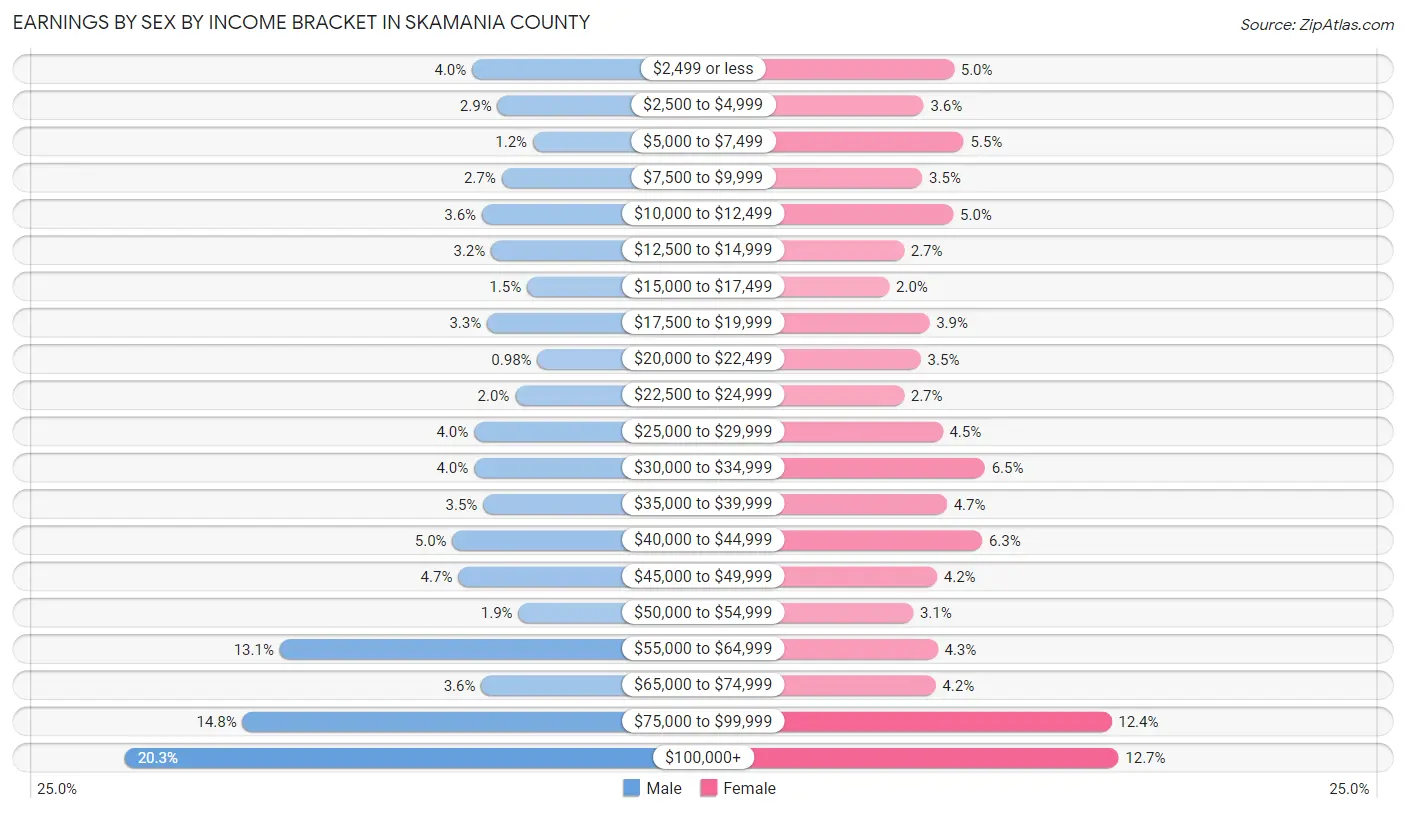
| Income | Male | Female |
| $2,499 or less | 132 (4.0%) | 152 (5.0%) |
| $2,500 to $4,999 | 93 (2.9%) | 109 (3.6%) |
| $5,000 to $7,499 | 39 (1.2%) | 166 (5.5%) |
| $7,500 to $9,999 | 87 (2.7%) | 107 (3.5%) |
| $10,000 to $12,499 | 117 (3.6%) | 151 (5.0%) |
| $12,500 to $14,999 | 103 (3.2%) | 81 (2.7%) |
| $15,000 to $17,499 | 48 (1.5%) | 60 (2.0%) |
| $17,500 to $19,999 | 109 (3.3%) | 117 (3.9%) |
| $20,000 to $22,499 | 32 (1.0%) | 105 (3.5%) |
| $22,500 to $24,999 | 66 (2.0%) | 81 (2.7%) |
| $25,000 to $29,999 | 129 (4.0%) | 136 (4.5%) |
| $30,000 to $34,999 | 129 (4.0%) | 196 (6.5%) |
| $35,000 to $39,999 | 115 (3.5%) | 142 (4.7%) |
| $40,000 to $44,999 | 162 (5.0%) | 192 (6.3%) |
| $45,000 to $49,999 | 153 (4.7%) | 128 (4.2%) |
| $50,000 to $54,999 | 61 (1.9%) | 94 (3.1%) |
| $55,000 to $64,999 | 426 (13.1%) | 129 (4.3%) |
| $65,000 to $74,999 | 118 (3.6%) | 126 (4.2%) |
| $75,000 to $99,999 | 483 (14.8%) | 376 (12.4%) |
| $100,000+ | 663 (20.3%) | 386 (12.7%) |
| Total | 3,265 (100.0%) | 3,034 (100.0%) |
Earnings by Sex by Educational Attainment in Skamania County
Average earnings in Skamania County are $61,096 for men and $40,669 for women, a difference of 33.4%. Men with an educational attainment of graduate degree enjoy the highest average annual earnings of $98,304, while those with less than high school education earn the least with $55,000. Women with an educational attainment of graduate degree earn the most with the average annual earnings of $83,750, while those with less than high school education have the smallest earnings of $19,872.
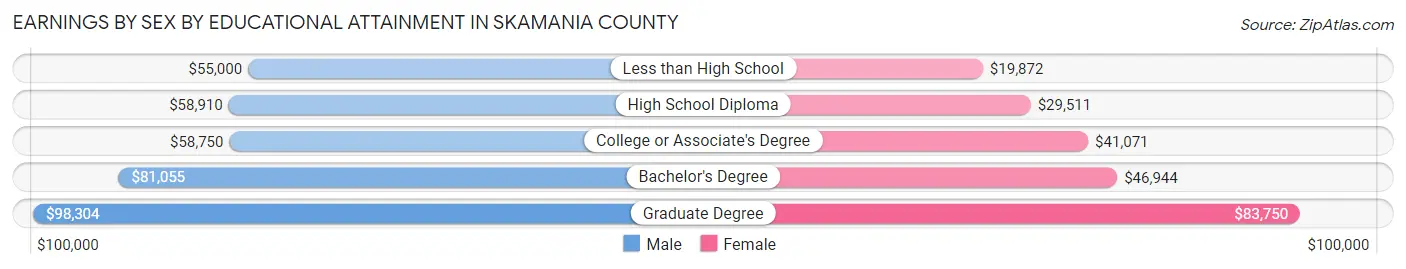
| Educational Attainment | Male Income | Female Income |
| Less than High School | $55,000 | $19,872 |
| High School Diploma | $58,910 | $29,511 |
| College or Associate's Degree | $58,750 | $41,071 |
| Bachelor's Degree | $81,055 | $46,944 |
| Graduate Degree | $98,304 | $83,750 |
| Total | $61,096 | $40,669 |
Family Income in Skamania County
Family Income Brackets in Skamania County
According to the Skamania County family income data, there are 803 families falling into the $100,000 to $149,999 income range, which is the most common income bracket and makes up 24.6% of all families. Conversely, the less than $10,000 income bracket is the least frequent group with only 26 families (0.8%) belonging to this category.
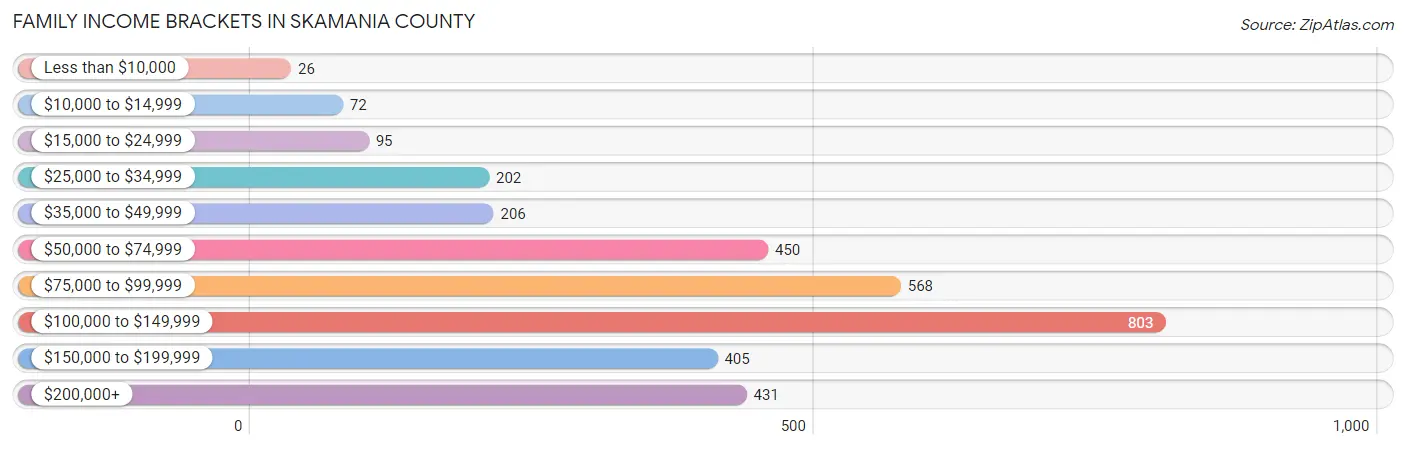
| Income Bracket | # Families | % Families |
| Less than $10,000 | 26 | 0.8% |
| $10,000 to $14,999 | 72 | 2.2% |
| $15,000 to $24,999 | 95 | 2.9% |
| $25,000 to $34,999 | 202 | 6.2% |
| $35,000 to $49,999 | 206 | 6.3% |
| $50,000 to $74,999 | 450 | 13.8% |
| $75,000 to $99,999 | 568 | 17.4% |
| $100,000 to $149,999 | 803 | 24.6% |
| $150,000 to $199,999 | 405 | 12.4% |
| $200,000+ | 431 | 13.2% |
Family Income by Famaliy Size in Skamania County
5-person families (179 | 5.5%) account for the highest median family income in Skamania County with $146,458 per family, while 2-person families (1,832 | 56.1%) have the highest median income of $45,426 per family member.
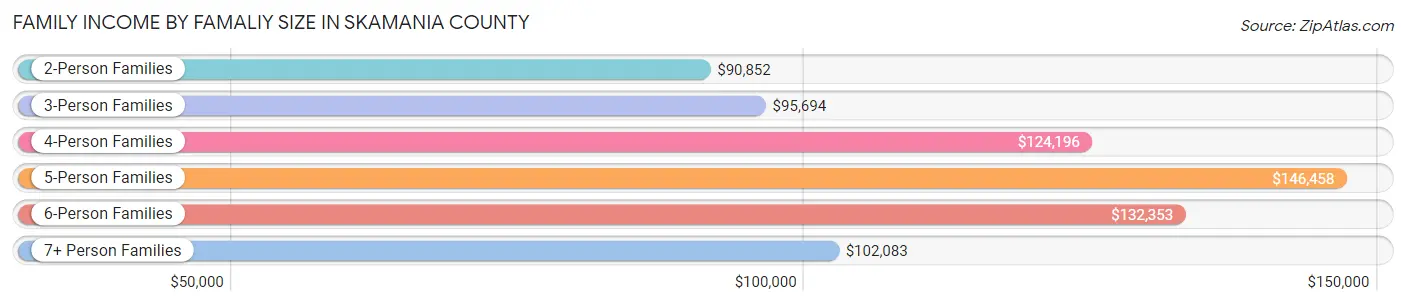
| Income Bracket | # Families | Median Income |
| 2-Person Families | 1,832 (56.1%) | $90,852 |
| 3-Person Families | 677 (20.7%) | $95,694 |
| 4-Person Families | 461 (14.1%) | $124,196 |
| 5-Person Families | 179 (5.5%) | $146,458 |
| 6-Person Families | 92 (2.8%) | $132,353 |
| 7+ Person Families | 23 (0.7%) | $102,083 |
| Total | 3,264 (100.0%) | $100,199 |
Family Income by Number of Earners in Skamania County
The median family income in Skamania County is $100,199, with families comprising 3+ earners (358) having the highest median family income of $154,423, while families with no earners (616) have the lowest median family income of $71,458, accounting for 11.0% and 18.9% of families, respectively.
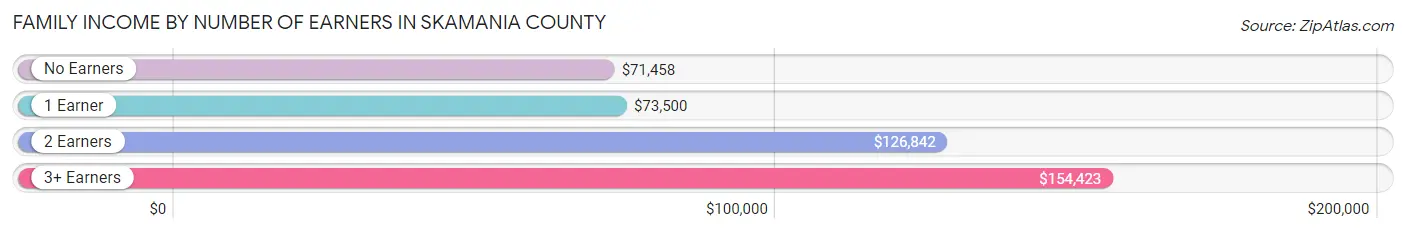
| Number of Earners | # Families | Median Income |
| No Earners | 616 (18.9%) | $71,458 |
| 1 Earner | 956 (29.3%) | $73,500 |
| 2 Earners | 1,334 (40.9%) | $126,842 |
| 3+ Earners | 358 (11.0%) | $154,423 |
| Total | 3,264 (100.0%) | $100,199 |
Household Income in Skamania County
Household Income Brackets in Skamania County
With 982 households falling in the category, the $100,000 to $149,999 income range is the most frequent in Skamania County, accounting for 20.4% of all households. In contrast, only 130 households (2.7%) fall into the $10,000 to $14,999 income bracket, making it the least populous group.
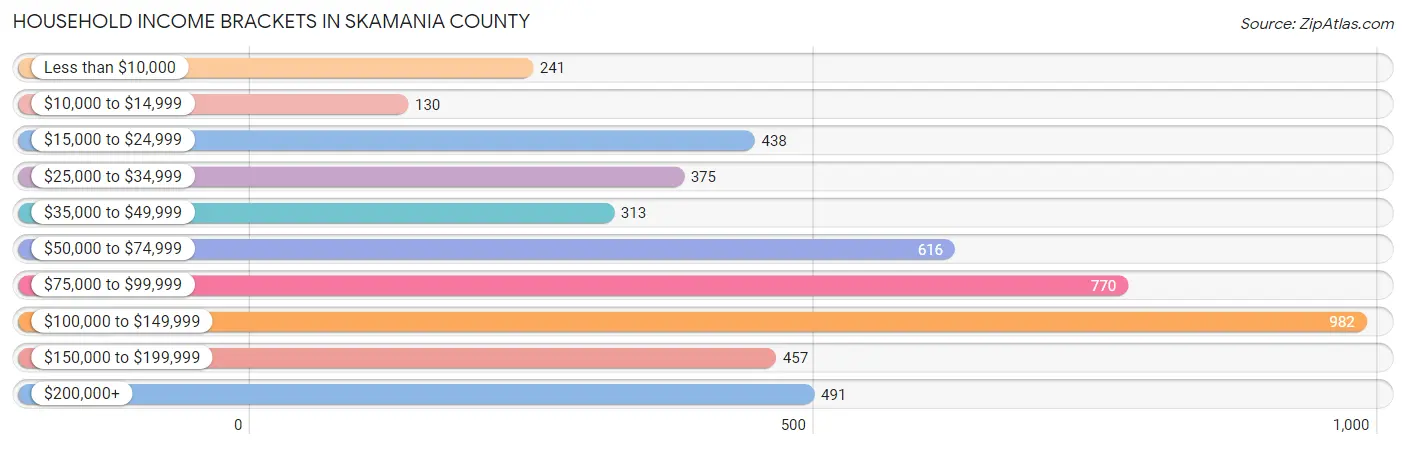
| Income Bracket | # Households | % Households |
| Less than $10,000 | 241 | 5.0% |
| $10,000 to $14,999 | 130 | 2.7% |
| $15,000 to $24,999 | 438 | 9.1% |
| $25,000 to $34,999 | 375 | 7.8% |
| $35,000 to $49,999 | 313 | 6.5% |
| $50,000 to $74,999 | 616 | 12.8% |
| $75,000 to $99,999 | 770 | 16.0% |
| $100,000 to $149,999 | 982 | 20.4% |
| $150,000 to $199,999 | 457 | 9.5% |
| $200,000+ | 491 | 10.2% |
Household Income by Householder Age in Skamania County
The median household income in Skamania County is $84,500, with the highest median household income of $218,415 found in the 15 to 24 years age bracket for the primary householder. A total of 52 households (1.1%) fall into this category. Meanwhile, the 65+ years age bracket for the primary householder has the lowest median household income of $59,375, with 1,660 households (34.5%) in this group.
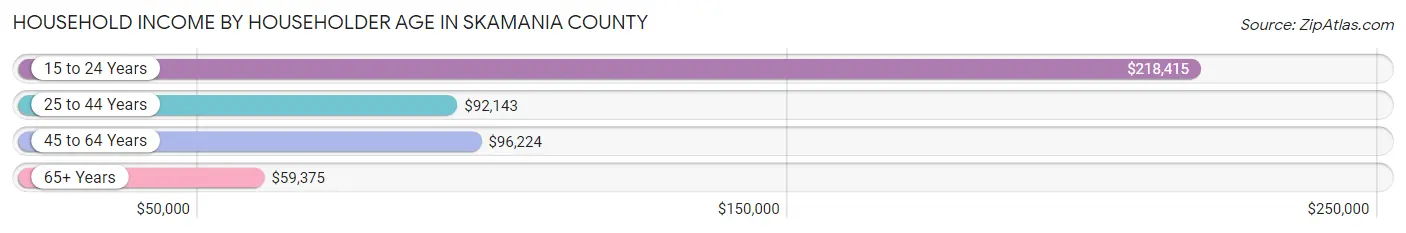
| Income Bracket | # Households | Median Income |
| 15 to 24 Years | 52 (1.1%) | $218,415 |
| 25 to 44 Years | 1,238 (25.7%) | $92,143 |
| 45 to 64 Years | 1,862 (38.7%) | $96,224 |
| 65+ Years | 1,660 (34.5%) | $59,375 |
| Total | 4,812 (100.0%) | $84,500 |
Poverty in Skamania County
Income Below Poverty by Sex and Age in Skamania County
With 7.5% poverty level for males and 9.7% for females among the residents of Skamania County, 5 year old males and 15 year old females are the most vulnerable to poverty, with 27 males (35.1%) and 35 females (28.7%) in their respective age groups living below the poverty level.
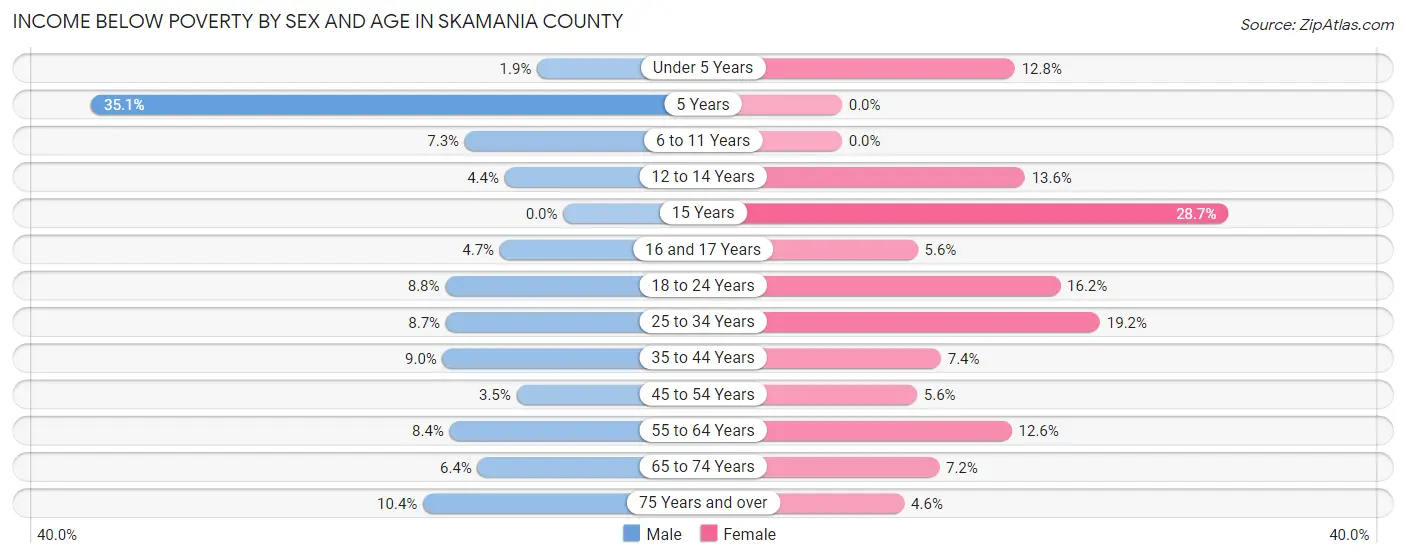
| Age Bracket | Male | Female |
| Under 5 Years | 4 (1.9%) | 33 (12.8%) |
| 5 Years | 27 (35.1%) | 0 (0.0%) |
| 6 to 11 Years | 28 (7.3%) | 0 (0.0%) |
| 12 to 14 Years | 9 (4.3%) | 22 (13.6%) |
| 15 Years | 0 (0.0%) | 35 (28.7%) |
| 16 and 17 Years | 4 (4.7%) | 8 (5.6%) |
| 18 to 24 Years | 39 (8.8%) | 59 (16.2%) |
| 25 to 34 Years | 52 (8.7%) | 114 (19.2%) |
| 35 to 44 Years | 63 (9.0%) | 55 (7.3%) |
| 45 to 54 Years | 28 (3.5%) | 53 (5.6%) |
| 55 to 64 Years | 89 (8.4%) | 131 (12.6%) |
| 65 to 74 Years | 55 (6.4%) | 57 (7.2%) |
| 75 Years and over | 48 (10.4%) | 23 (4.6%) |
| Total | 446 (7.5%) | 590 (9.7%) |
Income Above Poverty by Sex and Age in Skamania County
According to the poverty statistics in Skamania County, males aged 15 years and females aged 5 years are the age groups that are most secure financially, with 100.0% of males and 100.0% of females in these age groups living above the poverty line.
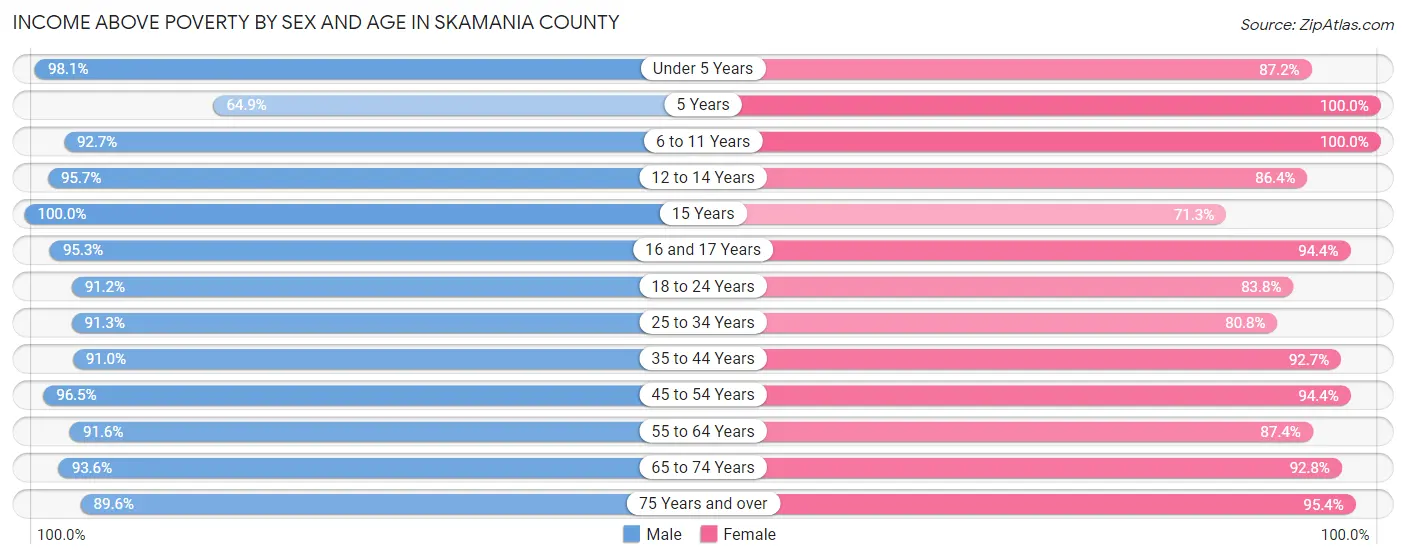
| Age Bracket | Male | Female |
| Under 5 Years | 202 (98.1%) | 224 (87.2%) |
| 5 Years | 50 (64.9%) | 85 (100.0%) |
| 6 to 11 Years | 355 (92.7%) | 316 (100.0%) |
| 12 to 14 Years | 198 (95.7%) | 140 (86.4%) |
| 15 Years | 46 (100.0%) | 87 (71.3%) |
| 16 and 17 Years | 81 (95.3%) | 134 (94.4%) |
| 18 to 24 Years | 406 (91.2%) | 305 (83.8%) |
| 25 to 34 Years | 544 (91.3%) | 481 (80.8%) |
| 35 to 44 Years | 640 (91.0%) | 693 (92.6%) |
| 45 to 54 Years | 780 (96.5%) | 899 (94.4%) |
| 55 to 64 Years | 965 (91.6%) | 908 (87.4%) |
| 65 to 74 Years | 810 (93.6%) | 733 (92.8%) |
| 75 Years and over | 413 (89.6%) | 474 (95.4%) |
| Total | 5,490 (92.5%) | 5,479 (90.3%) |
Income Below Poverty Among Married-Couple Families in Skamania County
The poverty statistics for married-couple families in Skamania County show that 2.8% or 73 of the total 2,606 families live below the poverty line. Families with no children have the highest poverty rate of 3.4%, comprising of 64 families. On the other hand, families with 3 or 4 children have the lowest poverty rate of 0.0%, which includes 0 families.
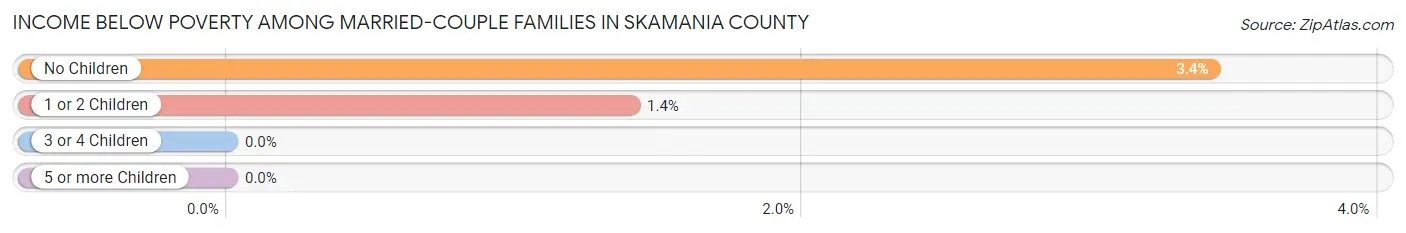
| Children | Above Poverty | Below Poverty |
| No Children | 1,808 (96.6%) | 64 (3.4%) |
| 1 or 2 Children | 636 (98.6%) | 9 (1.4%) |
| 3 or 4 Children | 80 (100.0%) | 0 (0.0%) |
| 5 or more Children | 9 (100.0%) | 0 (0.0%) |
| Total | 2,533 (97.2%) | 73 (2.8%) |
Income Below Poverty Among Single-Parent Households in Skamania County
According to the poverty data in Skamania County, 6.8% or 16 single-father households and 18.5% or 78 single-mother households are living below the poverty line. Among single-father households, those with 1 or 2 children have the highest poverty rate, with 15 households (14.0%) experiencing poverty. Likewise, among single-mother households, those with 1 or 2 children have the highest poverty rate, with 78 households (35.3%) falling below the poverty line.
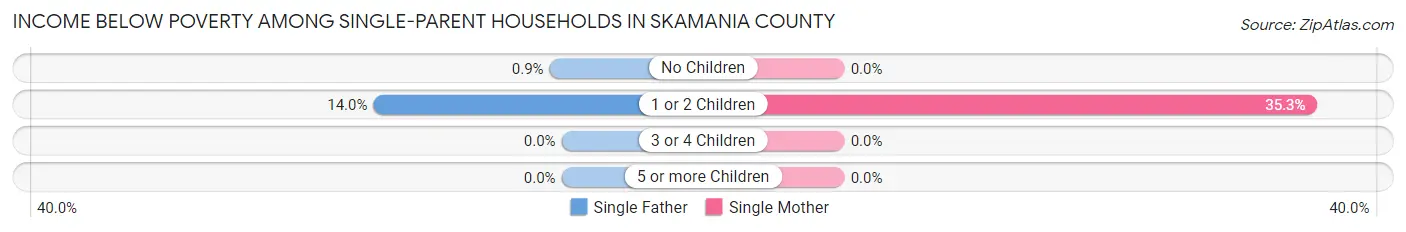
| Children | Single Father | Single Mother |
| No Children | 1 (0.9%) | 0 (0.0%) |
| 1 or 2 Children | 15 (14.0%) | 78 (35.3%) |
| 3 or 4 Children | 0 (0.0%) | 0 (0.0%) |
| 5 or more Children | 0 (0.0%) | 0 (0.0%) |
| Total | 16 (6.8%) | 78 (18.5%) |
Income Below Poverty Among Married-Couple vs Single-Parent Households in Skamania County
The poverty data for Skamania County shows that 73 of the married-couple family households (2.8%) and 94 of the single-parent households (14.3%) are living below the poverty level. Within the married-couple family households, those with no children have the highest poverty rate, with 64 households (3.4%) falling below the poverty line. Among the single-parent households, those with 1 or 2 children have the highest poverty rate, with 93 household (28.3%) living below poverty.
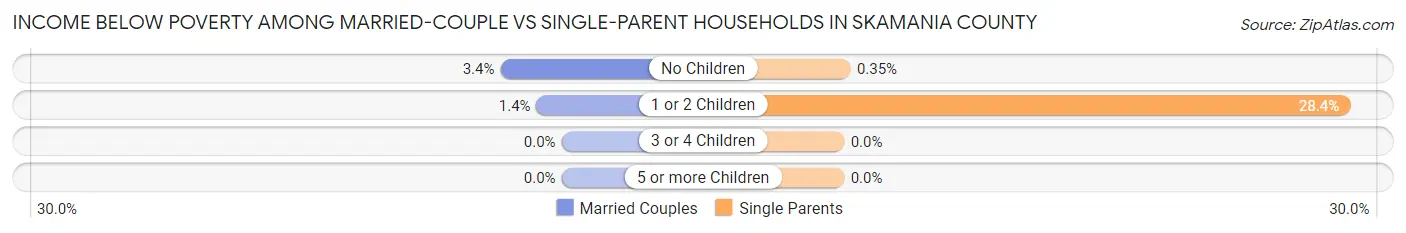
| Children | Married-Couple Families | Single-Parent Households |
| No Children | 64 (3.4%) | 1 (0.4%) |
| 1 or 2 Children | 9 (1.4%) | 93 (28.3%) |
| 3 or 4 Children | 0 (0.0%) | 0 (0.0%) |
| 5 or more Children | 0 (0.0%) | 0 (0.0%) |
| Total | 73 (2.8%) | 94 (14.3%) |
Race in Skamania County
The most populous races in Skamania County are White / Caucasian (10,654 | 87.9%), Hispanic or Latino (1,041 | 8.6%), and Two or more Races (763 | 6.3%).
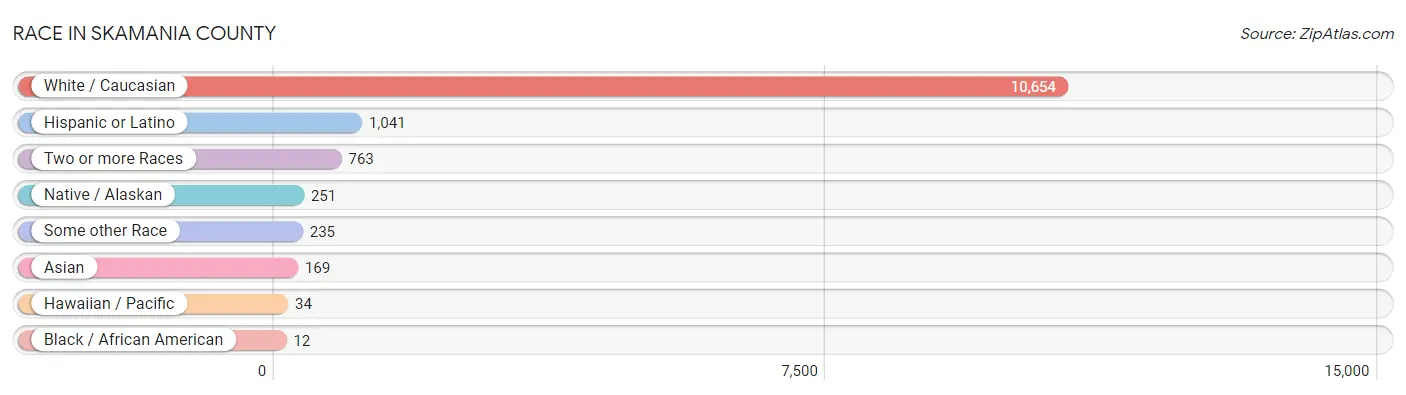
| Race | # Population | % Population |
| Asian | 169 | 1.4% |
| Black / African American | 12 | 0.1% |
| Hawaiian / Pacific | 34 | 0.3% |
| Hispanic or Latino | 1,041 | 8.6% |
| Native / Alaskan | 251 | 2.1% |
| White / Caucasian | 10,654 | 87.9% |
| Two or more Races | 763 | 6.3% |
| Some other Race | 235 | 1.9% |
| Total | 12,118 | 100.0% |
Ancestry in Skamania County
The most populous ancestries reported in Skamania County are German (2,242 | 18.5%), English (1,780 | 14.7%), Irish (1,514 | 12.5%), American (1,187 | 9.8%), and Mexican (877 | 7.2%), together accounting for 62.7% of all Skamania County residents.
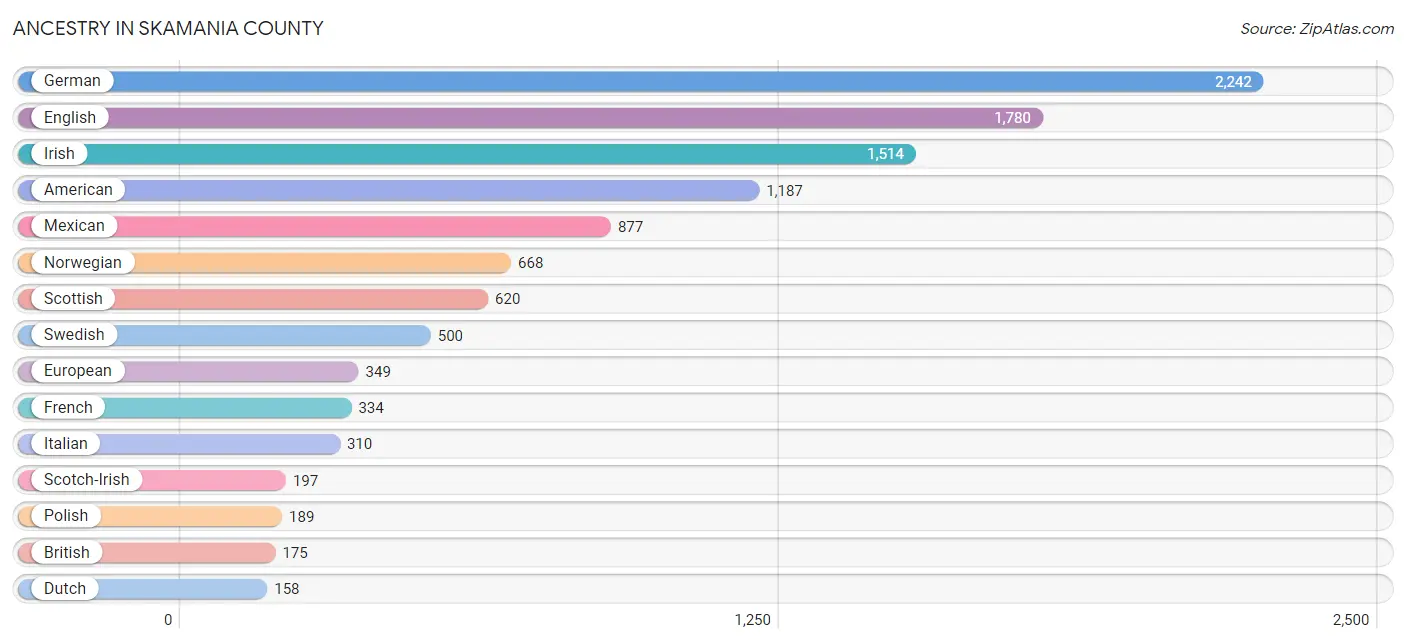
| Ancestry | # Population | % Population |
| Alaska Native | 31 | 0.3% |
| American | 1,187 | 9.8% |
| Apache | 11 | 0.1% |
| Arab | 3 | 0.0% |
| Armenian | 12 | 0.1% |
| Austrian | 16 | 0.1% |
| Belgian | 11 | 0.1% |
| Bhutanese | 65 | 0.5% |
| Bolivian | 16 | 0.1% |
| British | 175 | 1.4% |
| Burmese | 62 | 0.5% |
| Canadian | 6 | 0.1% |
| Celtic | 6 | 0.1% |
| Cherokee | 71 | 0.6% |
| Cheyenne | 9 | 0.1% |
| Choctaw | 61 | 0.5% |
| Croatian | 103 | 0.9% |
| Czech | 20 | 0.2% |
| Czechoslovakian | 56 | 0.5% |
| Danish | 67 | 0.5% |
| Dutch | 158 | 1.3% |
| Eastern European | 55 | 0.4% |
| English | 1,780 | 14.7% |
| European | 349 | 2.9% |
| French | 334 | 2.8% |
| French American Indian | 63 | 0.5% |
| French Canadian | 55 | 0.4% |
| German | 2,242 | 18.5% |
| Greek | 3 | 0.0% |
| Hungarian | 17 | 0.1% |
| Icelander | 4 | 0.0% |
| Indian (Asian) | 75 | 0.6% |
| Iranian | 1 | 0.0% |
| Irish | 1,514 | 12.5% |
| Iroquois | 40 | 0.3% |
| Italian | 310 | 2.6% |
| Jamaican | 9 | 0.1% |
| Korean | 57 | 0.5% |
| Laotian | 2 | 0.0% |
| Lebanese | 1 | 0.0% |
| Lithuanian | 21 | 0.2% |
| Mexican | 877 | 7.2% |
| Mexican American Indian | 13 | 0.1% |
| Native Hawaiian | 41 | 0.3% |
| Northern European | 52 | 0.4% |
| Norwegian | 668 | 5.5% |
| Osage | 3 | 0.0% |
| Pakistani | 13 | 0.1% |
| Peruvian | 1 | 0.0% |
| Polish | 189 | 1.6% |
| Portuguese | 2 | 0.0% |
| Puerto Rican | 30 | 0.3% |
| Puget Sound Salish | 6 | 0.1% |
| Romanian | 16 | 0.1% |
| Russian | 65 | 0.5% |
| Scandinavian | 96 | 0.8% |
| Scotch-Irish | 197 | 1.6% |
| Scottish | 620 | 5.1% |
| Serbian | 2 | 0.0% |
| Slovak | 11 | 0.1% |
| South American | 37 | 0.3% |
| Spaniard | 8 | 0.1% |
| Spanish | 74 | 0.6% |
| Swedish | 500 | 4.1% |
| Swiss | 73 | 0.6% |
| Thai | 14 | 0.1% |
| Tlingit-Haida | 13 | 0.1% |
| Tongan | 36 | 0.3% |
| Ukrainian | 21 | 0.2% |
| Venezuelan | 20 | 0.2% |
| Welsh | 108 | 0.9% |
| Yakama | 23 | 0.2% |
| Yugoslavian | 5 | 0.0% | View All 73 Rows |
Immigrants in Skamania County
The most numerous immigrant groups reported in Skamania County came from Latin America (230 | 1.9%), Central America (210 | 1.7%), Mexico (204 | 1.7%), Europe (107 | 0.9%), and Canada (69 | 0.6%), together accounting for 6.8% of all Skamania County residents.
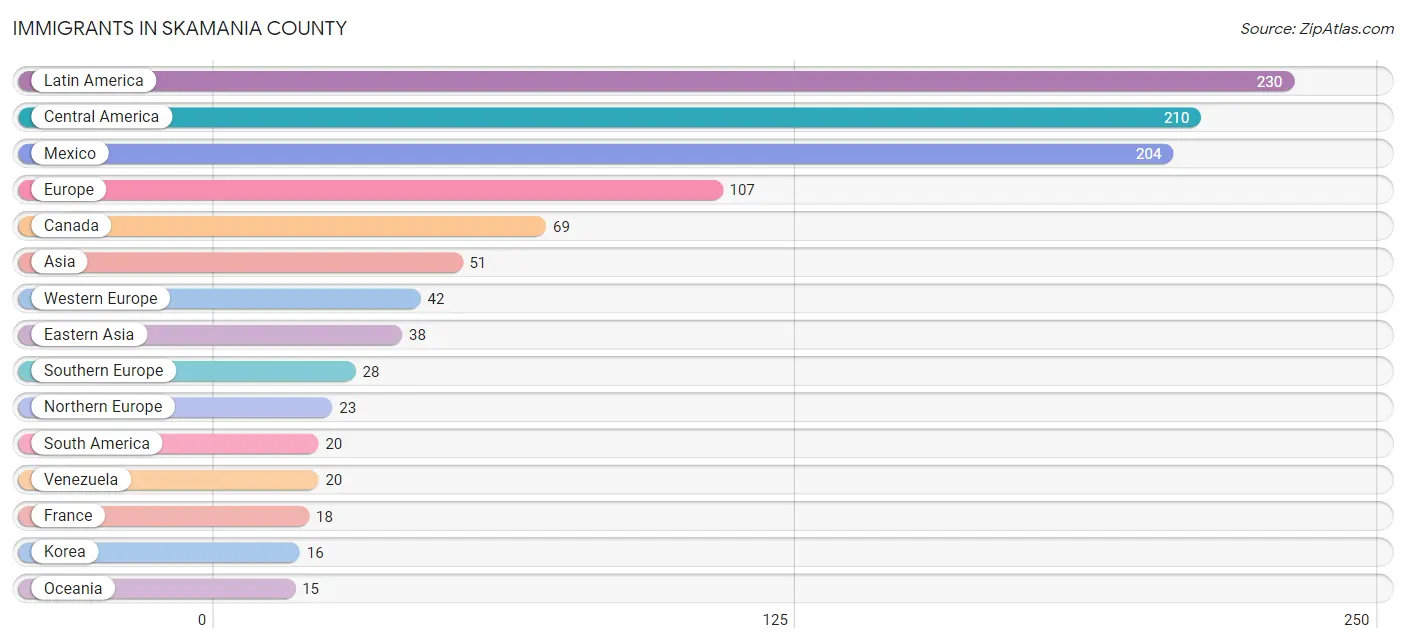
| Immigration Origin | # Population | % Population |
| Asia | 51 | 0.4% |
| Austria | 3 | 0.0% |
| Bosnia and Herzegovina | 5 | 0.0% |
| Canada | 69 | 0.6% |
| Central America | 210 | 1.7% |
| China | 11 | 0.1% |
| Eastern Asia | 38 | 0.3% |
| Eastern Europe | 14 | 0.1% |
| El Salvador | 6 | 0.1% |
| England | 7 | 0.1% |
| Europe | 107 | 0.9% |
| Fiji | 6 | 0.1% |
| France | 18 | 0.2% |
| Germany | 12 | 0.1% |
| Indonesia | 3 | 0.0% |
| Italy | 5 | 0.0% |
| Japan | 11 | 0.1% |
| Korea | 16 | 0.1% |
| Latin America | 230 | 1.9% |
| Mexico | 204 | 1.7% |
| Netherlands | 3 | 0.0% |
| Northern Europe | 23 | 0.2% |
| Oceania | 15 | 0.1% |
| Philippines | 10 | 0.1% |
| Poland | 7 | 0.1% |
| Russia | 2 | 0.0% |
| South America | 20 | 0.2% |
| South Eastern Asia | 13 | 0.1% |
| Southern Europe | 28 | 0.2% |
| Spain | 15 | 0.1% |
| Sweden | 7 | 0.1% |
| Switzerland | 6 | 0.1% |
| Taiwan | 11 | 0.1% |
| Venezuela | 20 | 0.2% |
| Western Europe | 42 | 0.4% | View All 35 Rows |
Sex and Age in Skamania County
Sex and Age in Skamania County
The most populous age groups in Skamania County are 60 to 64 Years (550 | 9.2%) for men and 60 to 64 Years (610 | 10.0%) for women.
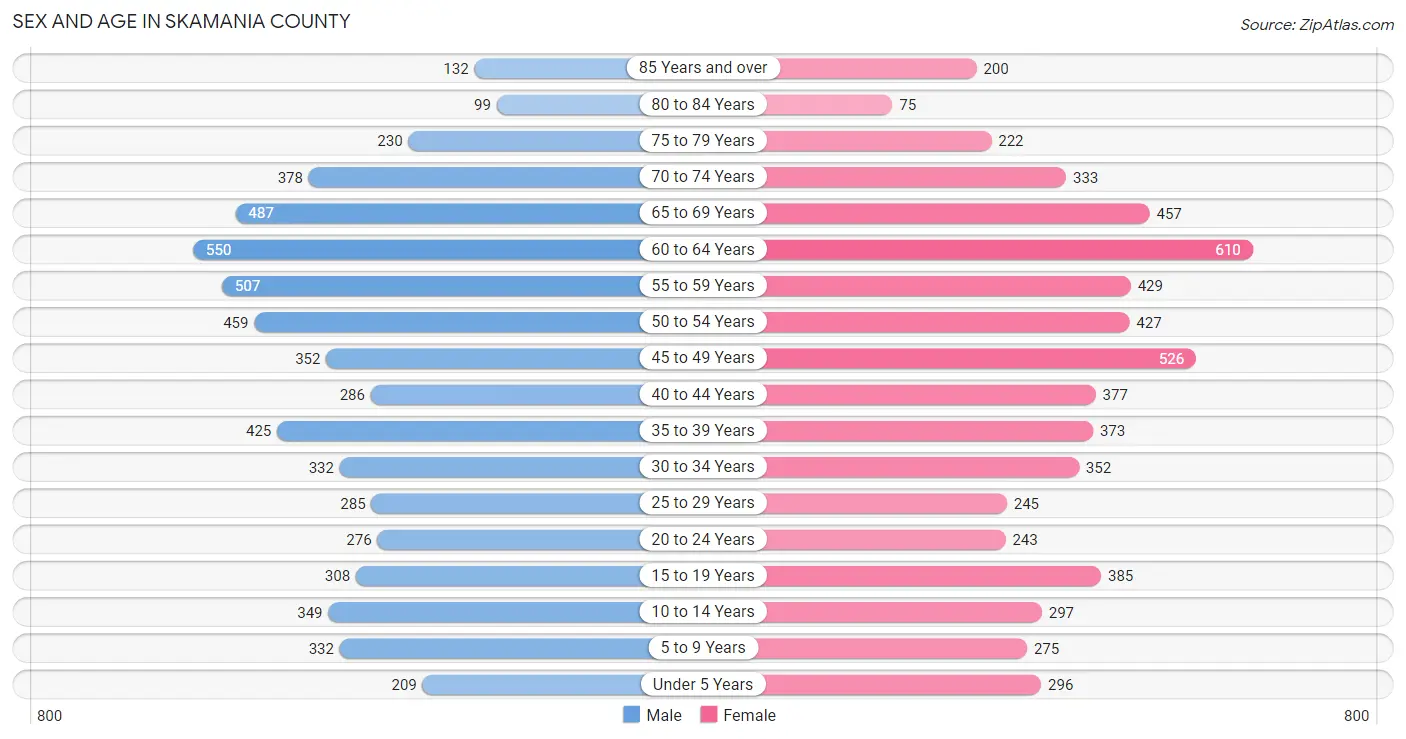
| Age Bracket | Male | Female |
| Under 5 Years | 209 (3.5%) | 296 (4.8%) |
| 5 to 9 Years | 332 (5.5%) | 275 (4.5%) |
| 10 to 14 Years | 349 (5.8%) | 297 (4.9%) |
| 15 to 19 Years | 308 (5.1%) | 385 (6.3%) |
| 20 to 24 Years | 276 (4.6%) | 243 (4.0%) |
| 25 to 29 Years | 285 (4.8%) | 245 (4.0%) |
| 30 to 34 Years | 332 (5.5%) | 352 (5.8%) |
| 35 to 39 Years | 425 (7.1%) | 373 (6.1%) |
| 40 to 44 Years | 286 (4.8%) | 377 (6.2%) |
| 45 to 49 Years | 352 (5.9%) | 526 (8.6%) |
| 50 to 54 Years | 459 (7.7%) | 427 (7.0%) |
| 55 to 59 Years | 507 (8.5%) | 429 (7.0%) |
| 60 to 64 Years | 550 (9.2%) | 610 (10.0%) |
| 65 to 69 Years | 487 (8.1%) | 457 (7.5%) |
| 70 to 74 Years | 378 (6.3%) | 333 (5.4%) |
| 75 to 79 Years | 230 (3.8%) | 222 (3.6%) |
| 80 to 84 Years | 99 (1.7%) | 75 (1.2%) |
| 85 Years and over | 132 (2.2%) | 200 (3.3%) |
| Total | 5,996 (100.0%) | 6,122 (100.0%) |
Families and Households in Skamania County
Median Family Size in Skamania County
The median family size in Skamania County is 2.98 persons per family, with single male/father families (236 | 7.2%) accounting for the largest median family size of 3.68 persons per family. On the other hand, married-couple families (2,606 | 79.8%) represent the smallest median family size with 2.87 persons per family.
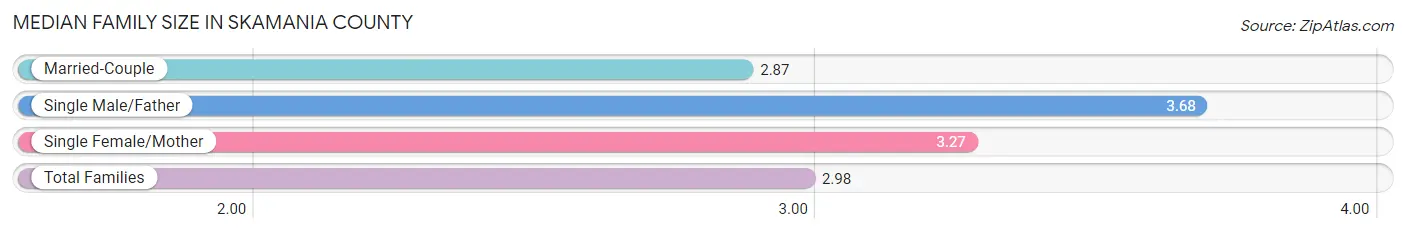
| Family Type | # Families | Family Size |
| Married-Couple | 2,606 (79.8%) | 2.87 |
| Single Male/Father | 236 (7.2%) | 3.68 |
| Single Female/Mother | 422 (12.9%) | 3.27 |
| Total Families | 3,264 (100.0%) | 2.98 |
Median Household Size in Skamania County
The median household size in Skamania County is 2.50 persons per household, with single male/father households (236 | 4.9%) accounting for the largest median household size of 4.1 persons per household. non-family households (1,548 | 32.2%) represent the smallest median household size with 1.29 persons per household.
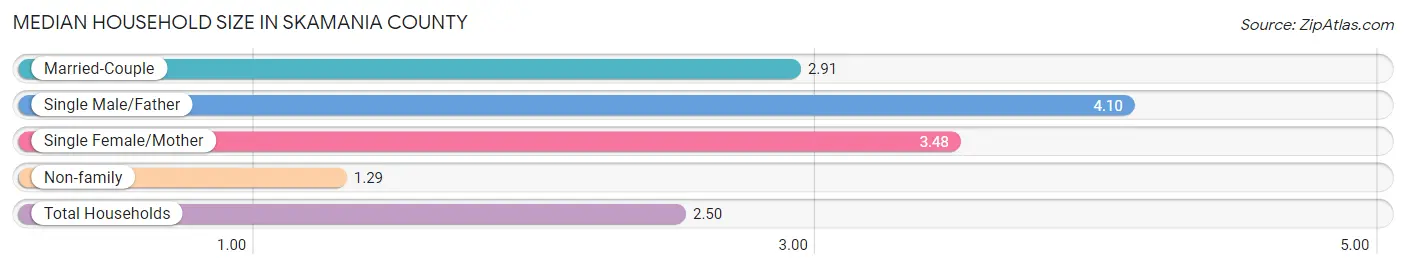
| Household Type | # Households | Household Size |
| Married-Couple | 2,606 (54.2%) | 2.91 |
| Single Male/Father | 236 (4.9%) | 4.10 |
| Single Female/Mother | 422 (8.8%) | 3.48 |
| Non-family | 1,548 (32.2%) | 1.29 |
| Total Households | 4,812 (100.0%) | 2.50 |
Household Size by Marriage Status in Skamania County
Out of a total of 4,812 households in Skamania County, 3,264 (67.8%) are family households, while 1,548 (32.2%) are nonfamily households. The most numerous type of family households are 2-person households, comprising 1,739, and the most common type of nonfamily households are 1-person households, comprising 1,161.
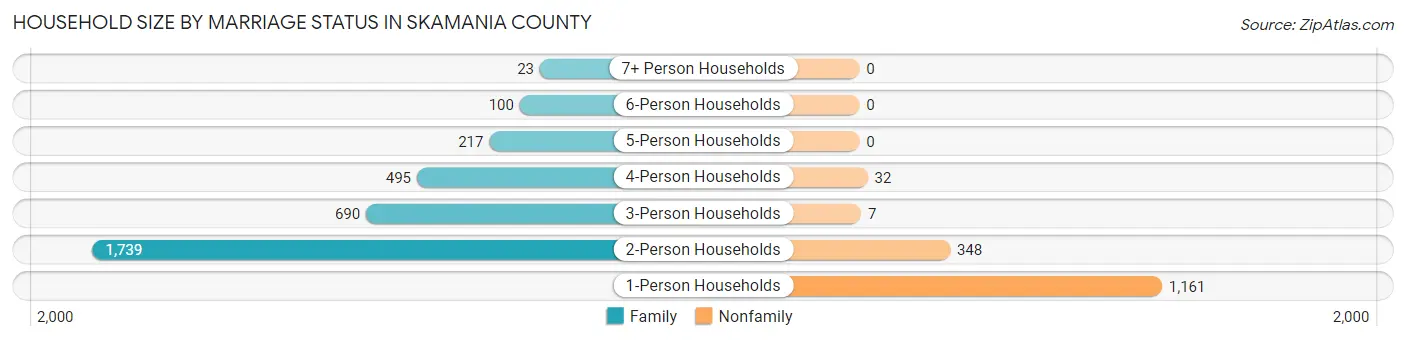
| Household Size | Family Households | Nonfamily Households |
| 1-Person Households | - | 1,161 (24.1%) |
| 2-Person Households | 1,739 (36.1%) | 348 (7.2%) |
| 3-Person Households | 690 (14.3%) | 7 (0.2%) |
| 4-Person Households | 495 (10.3%) | 32 (0.7%) |
| 5-Person Households | 217 (4.5%) | 0 (0.0%) |
| 6-Person Households | 100 (2.1%) | 0 (0.0%) |
| 7+ Person Households | 23 (0.5%) | 0 (0.0%) |
| Total | 3,264 (67.8%) | 1,548 (32.2%) |
Female Fertility in Skamania County
Fertility by Age in Skamania County
Average fertility rate in Skamania County is 16.0 births per 1,000 women. Women in the age bracket of 20 to 34 years have the highest fertility rate with 29.0 births per 1,000 women. Women in the age bracket of 20 to 34 years acount for 57.1% of all women with births.
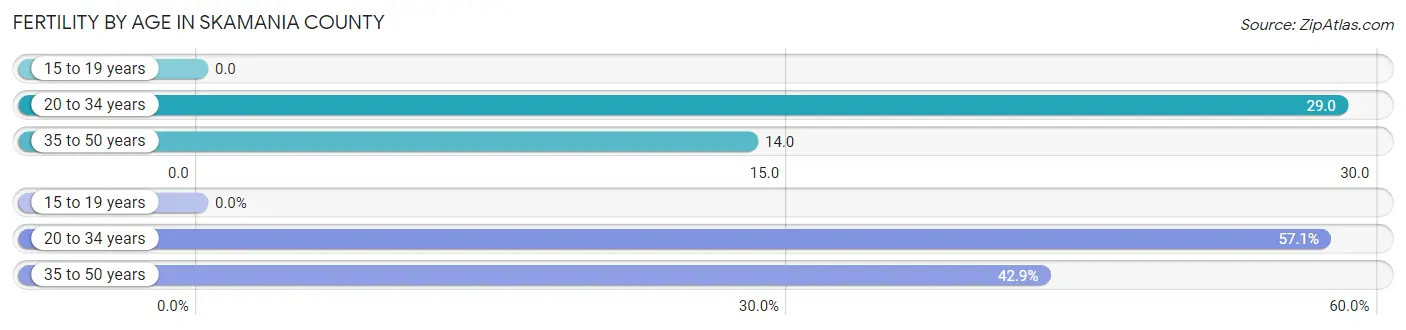
| Age Bracket | Women with Births | Births / 1,000 Women |
| 15 to 19 years | 0 (0.0%) | 0.0 |
| 20 to 34 years | 24 (57.1%) | 29.0 |
| 35 to 50 years | 18 (42.9%) | 14.0 |
| Total | 42 (100.0%) | 16.0 |
Fertility by Age by Marriage Status in Skamania County
76.2% of women with births (42) in Skamania County are married. The highest percentage of unmarried women with births falls into 20 to 34 years age bracket with 33.3% of them unmarried at the time of birth, while the lowest percentage of unmarried women with births belong to 35 to 50 years age bracket with 11.1% of them unmarried.
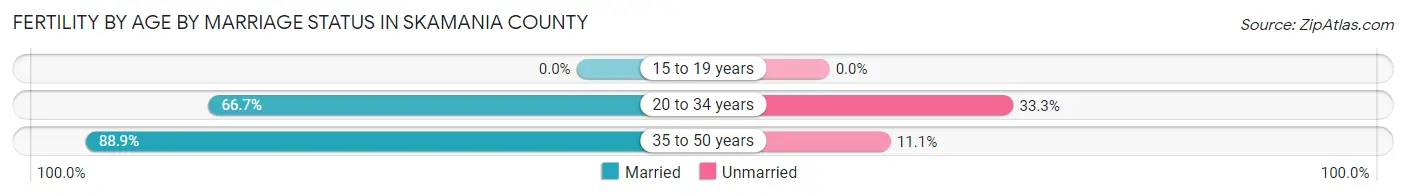
| Age Bracket | Married | Unmarried |
| 15 to 19 years | 0 (0.0%) | 0 (0.0%) |
| 20 to 34 years | 16 (66.7%) | 8 (33.3%) |
| 35 to 50 years | 16 (88.9%) | 2 (11.1%) |
| Total | 32 (76.2%) | 10 (23.8%) |
Fertility by Education in Skamania County
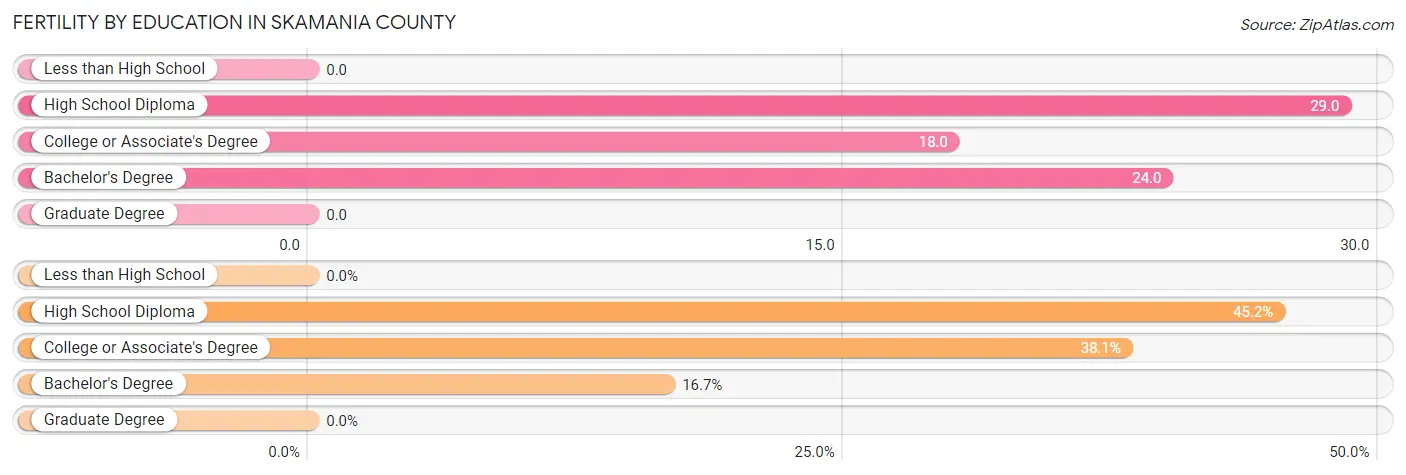
| Educational Attainment | Women with Births | Births / 1,000 Women |
| Less than High School | 0 (0.0%) | 0.0 |
| High School Diploma | 19 (45.2%) | 29.0 |
| College or Associate's Degree | 16 (38.1%) | 18.0 |
| Bachelor's Degree | 7 (16.7%) | 24.0 |
| Graduate Degree | 0 (0.0%) | 0.0 |
| Total | 42 (100.0%) | 16.0 |
Fertility by Education by Marriage Status in Skamania County
23.8% of women with births in Skamania County are unmarried. Women with the educational attainment of high school diploma are most likely to be married with 100.0% of them married at childbirth, while women with the educational attainment of college or associate's degree are least likely to be married with 62.5% of them unmarried at childbirth.
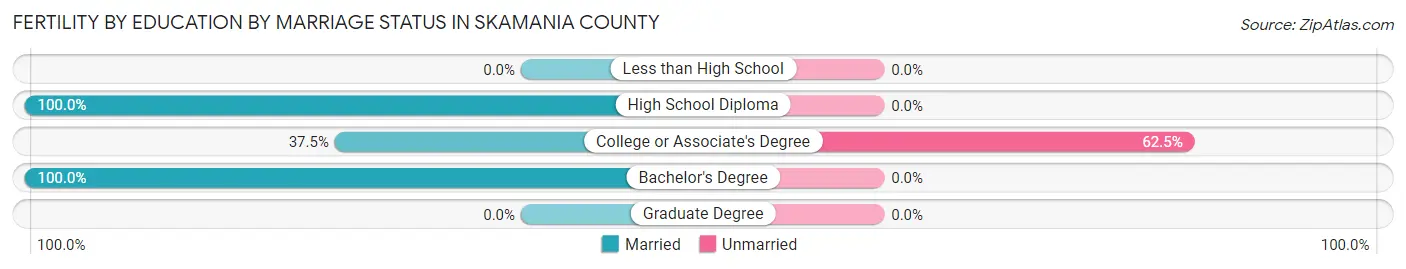
| Educational Attainment | Married | Unmarried |
| Less than High School | 0 (0.0%) | 0 (0.0%) |
| High School Diploma | 19 (100.0%) | 0 (0.0%) |
| College or Associate's Degree | 6 (37.5%) | 10 (62.5%) |
| Bachelor's Degree | 7 (100.0%) | 0 (0.0%) |
| Graduate Degree | 0 (0.0%) | 0 (0.0%) |
| Total | 32 (76.2%) | 10 (23.8%) |
Employment Characteristics in Skamania County
Employment by Class of Employer in Skamania County
Among the 5,511 employed individuals in Skamania County, private company employees (3,387 | 61.5%), self-employed (not incorporated) (449 | 8.2%), and local government employees (439 | 8.0%) make up the most common classes of employment.
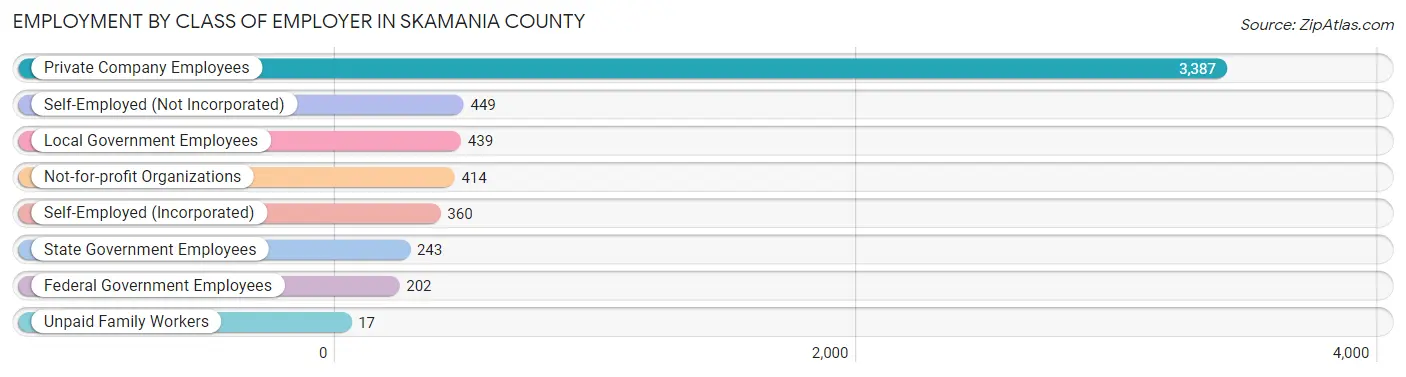
| Employer Class | # Employees | % Employees |
| Private Company Employees | 3,387 | 61.5% |
| Self-Employed (Incorporated) | 360 | 6.5% |
| Self-Employed (Not Incorporated) | 449 | 8.2% |
| Not-for-profit Organizations | 414 | 7.5% |
| Local Government Employees | 439 | 8.0% |
| State Government Employees | 243 | 4.4% |
| Federal Government Employees | 202 | 3.7% |
| Unpaid Family Workers | 17 | 0.3% |
| Total | 5,511 | 100.0% |
Employment Status by Age in Skamania County
According to the labor force statistics for Skamania County, out of the total population over 16 years of age (10,192), 58.4% or 5,952 individuals are in the labor force, with 5.2% or 310 of them unemployed. The age group with the highest labor force participation rate is 20 to 24 years, with 89.6% or 465 individuals in the labor force. Within the labor force, the 16 to 19 years age range has the highest percentage of unemployed individuals, with 21.7% or 55 of them being unemployed.
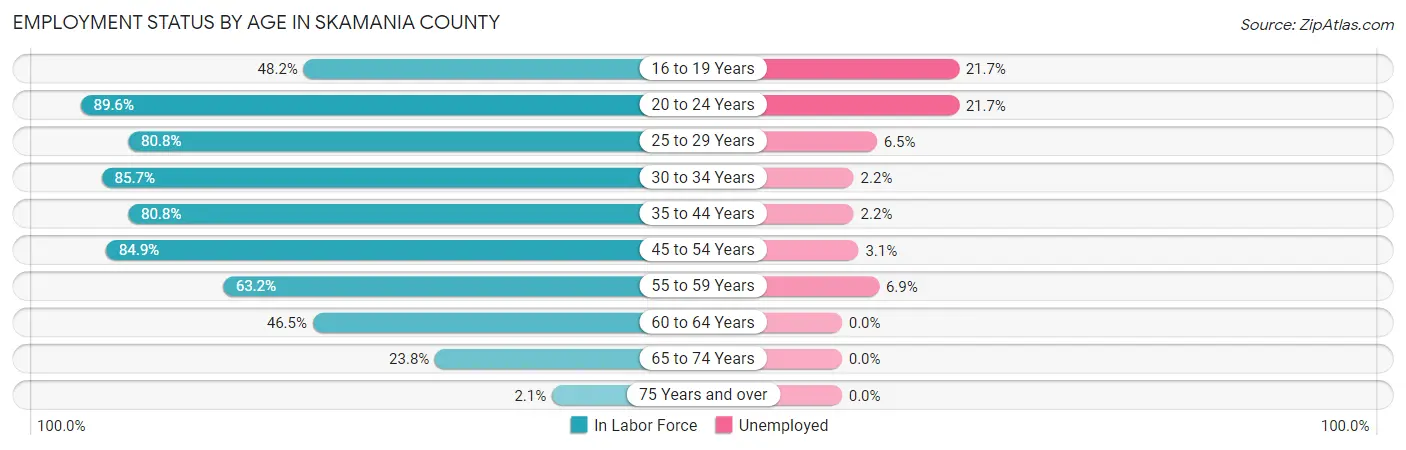
| Age Bracket | In Labor Force | Unemployed |
| 16 to 19 Years | 253 (48.2%) | 55 (21.7%) |
| 20 to 24 Years | 465 (89.6%) | 101 (21.7%) |
| 25 to 29 Years | 428 (80.8%) | 28 (6.5%) |
| 30 to 34 Years | 586 (85.7%) | 13 (2.2%) |
| 35 to 44 Years | 1,180 (80.8%) | 26 (2.2%) |
| 45 to 54 Years | 1,498 (84.9%) | 46 (3.1%) |
| 55 to 59 Years | 592 (63.2%) | 41 (6.9%) |
| 60 to 64 Years | 539 (46.5%) | 0 (0.0%) |
| 65 to 74 Years | 394 (23.8%) | 0 (0.0%) |
| 75 Years and over | 20 (2.1%) | 0 (0.0%) |
| Total | 5,952 (58.4%) | 310 (5.2%) |
Employment Status by Educational Attainment in Skamania County
According to labor force statistics for Skamania County, 73.8% of individuals (4,823) out of the total population between 25 and 64 years of age (6,535) are in the labor force, with 3.2% or 154 of them being unemployed. The group with the highest labor force participation rate are those with the educational attainment of bachelor's degree or higher, with 78.7% or 1,388 individuals in the labor force. Within the labor force, individuals with less than high school education have the highest percentage of unemployment, with 4.1% or 9 of them being unemployed.
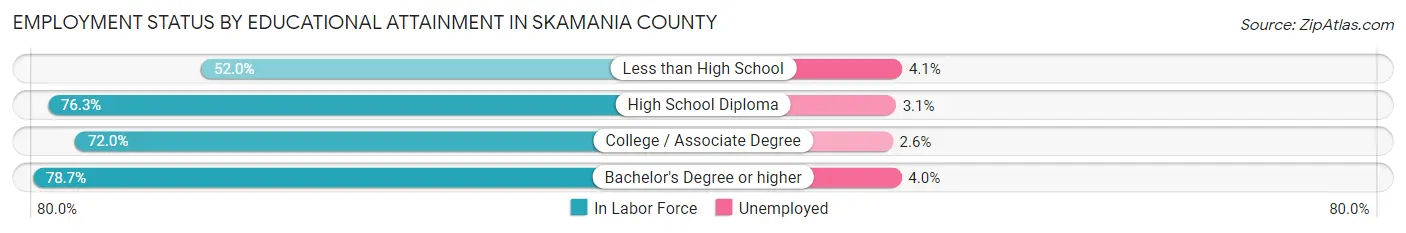
| Educational Attainment | In Labor Force | Unemployed |
| Less than High School | 220 (52.0%) | 17 (4.1%) |
| High School Diploma | 1,514 (76.3%) | 62 (3.1%) |
| College / Associate Degree | 1,702 (72.0%) | 61 (2.6%) |
| Bachelor's Degree or higher | 1,388 (78.7%) | 71 (4.0%) |
| Total | 4,823 (73.8%) | 209 (3.2%) |
Employment Occupations by Sex in Skamania County
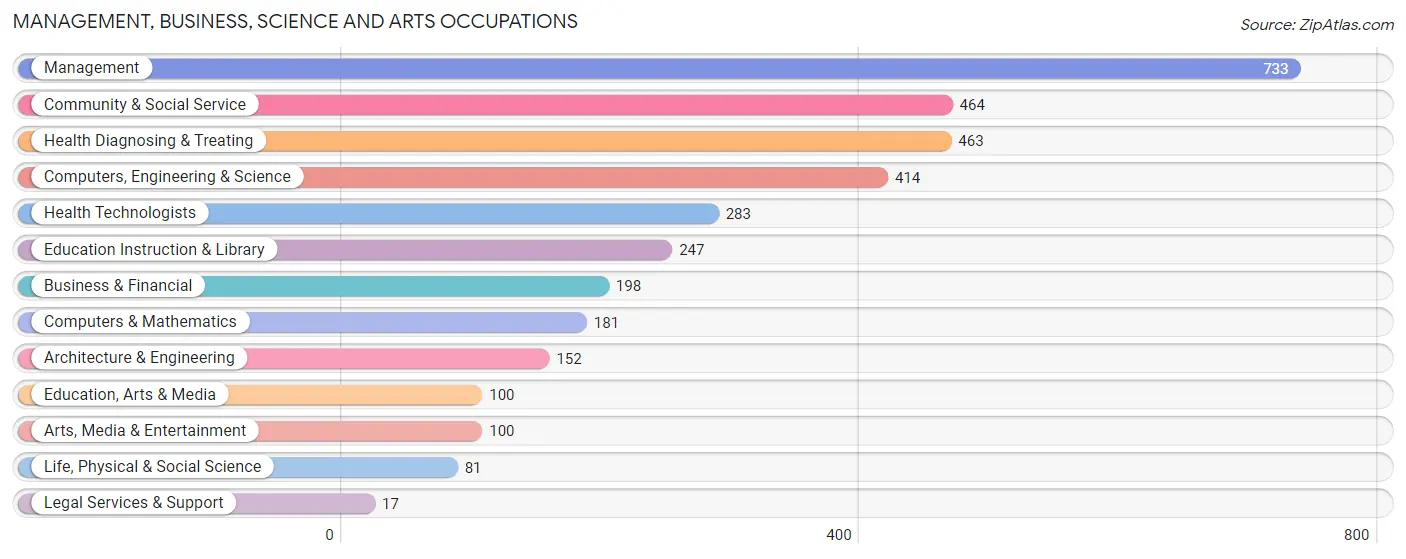
Management, Business, Science and Arts Occupations
The most common Management, Business, Science and Arts occupations in Skamania County are Management (733 | 13.0%), Community & Social Service (464 | 8.2%), Health Diagnosing & Treating (463 | 8.2%), Computers, Engineering & Science (414 | 7.3%), and Health Technologists (283 | 5.0%).
Management, Business, Science and Arts Occupations by Sex
Within the Management, Business, Science and Arts occupations in Skamania County, the most male-oriented occupations are Legal Services & Support (88.2%), Life, Physical & Social Science (74.1%), and Computers & Mathematics (69.6%), while the most female-oriented occupations are Education Instruction & Library (91.1%), Health Diagnosing & Treating (80.3%), and Health Technologists (75.6%).
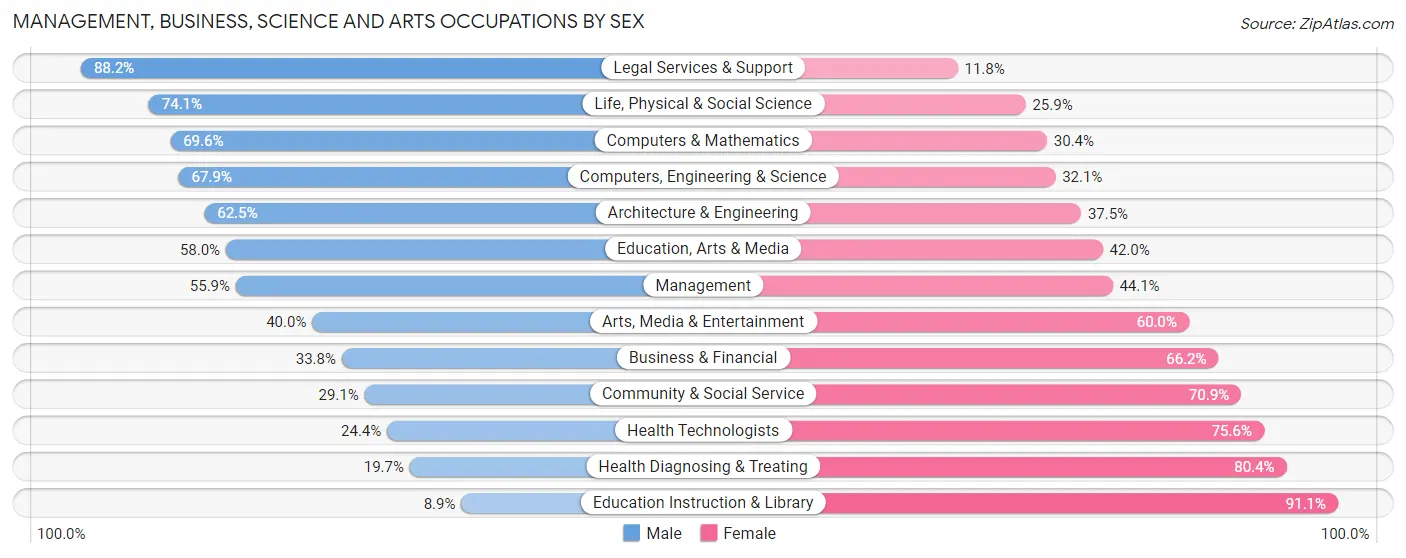
| Occupation | Male | Female |
| Management | 410 (55.9%) | 323 (44.1%) |
| Business & Financial | 67 (33.8%) | 131 (66.2%) |
| Computers, Engineering & Science | 281 (67.9%) | 133 (32.1%) |
| Computers & Mathematics | 126 (69.6%) | 55 (30.4%) |
| Architecture & Engineering | 95 (62.5%) | 57 (37.5%) |
| Life, Physical & Social Science | 60 (74.1%) | 21 (25.9%) |
| Community & Social Service | 135 (29.1%) | 329 (70.9%) |
| Education, Arts & Media | 58 (58.0%) | 42 (42.0%) |
| Legal Services & Support | 15 (88.2%) | 2 (11.8%) |
| Education Instruction & Library | 22 (8.9%) | 225 (91.1%) |
| Arts, Media & Entertainment | 40 (40.0%) | 60 (60.0%) |
| Health Diagnosing & Treating | 91 (19.7%) | 372 (80.3%) |
| Health Technologists | 69 (24.4%) | 214 (75.6%) |
| Total (Category) | 984 (43.3%) | 1,288 (56.7%) |
| Total (Overall) | 2,935 (52.0%) | 2,704 (47.9%) |
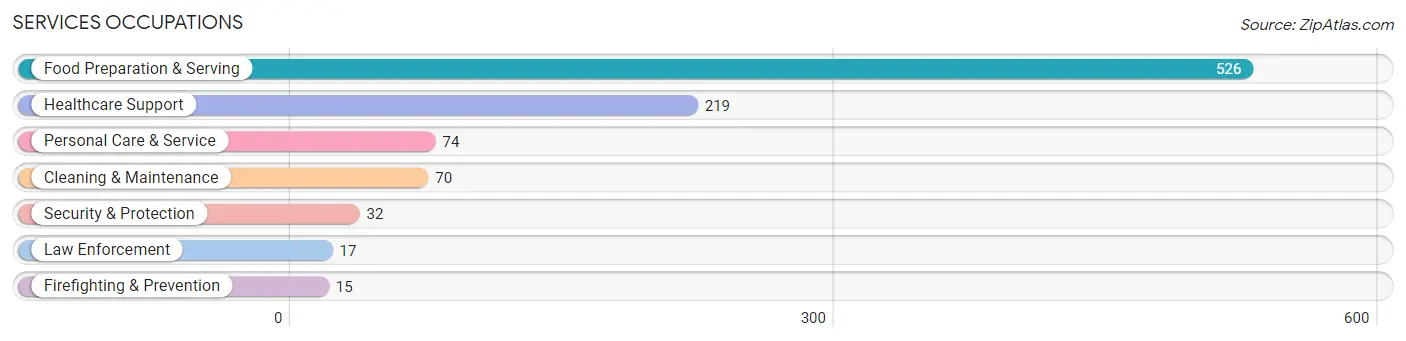
Services Occupations
The most common Services occupations in Skamania County are Food Preparation & Serving (526 | 9.3%), Healthcare Support (219 | 3.9%), Personal Care & Service (74 | 1.3%), Cleaning & Maintenance (70 | 1.2%), and Security & Protection (32 | 0.6%).
Services Occupations by Sex
Within the Services occupations in Skamania County, the most male-oriented occupations are Security & Protection (100.0%), Firefighting & Prevention (100.0%), and Law Enforcement (100.0%), while the most female-oriented occupations are Personal Care & Service (100.0%), Healthcare Support (93.6%), and Food Preparation & Serving (48.7%).
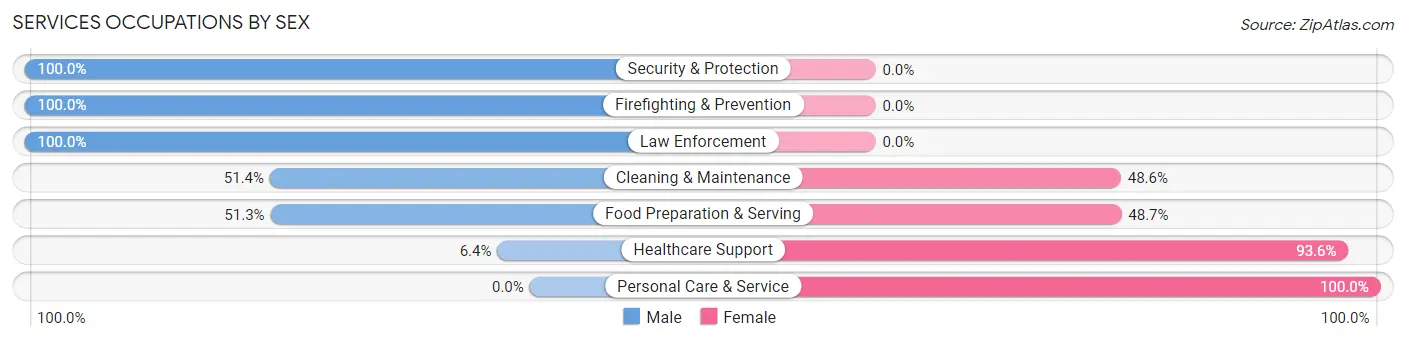
| Occupation | Male | Female |
| Healthcare Support | 14 (6.4%) | 205 (93.6%) |
| Security & Protection | 32 (100.0%) | 0 (0.0%) |
| Firefighting & Prevention | 15 (100.0%) | 0 (0.0%) |
| Law Enforcement | 17 (100.0%) | 0 (0.0%) |
| Food Preparation & Serving | 270 (51.3%) | 256 (48.7%) |
| Cleaning & Maintenance | 36 (51.4%) | 34 (48.6%) |
| Personal Care & Service | 0 (0.0%) | 74 (100.0%) |
| Total (Category) | 352 (38.2%) | 569 (61.8%) |
| Total (Overall) | 2,935 (52.0%) | 2,704 (47.9%) |
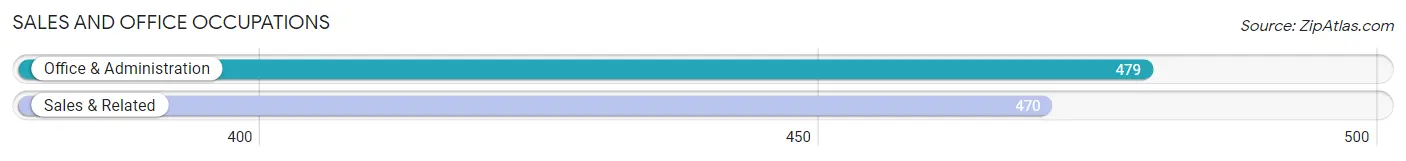
Sales and Office Occupations
The most common Sales and Office occupations in Skamania County are Office & Administration (479 | 8.5%), and Sales & Related (470 | 8.3%).
Sales and Office Occupations by Sex
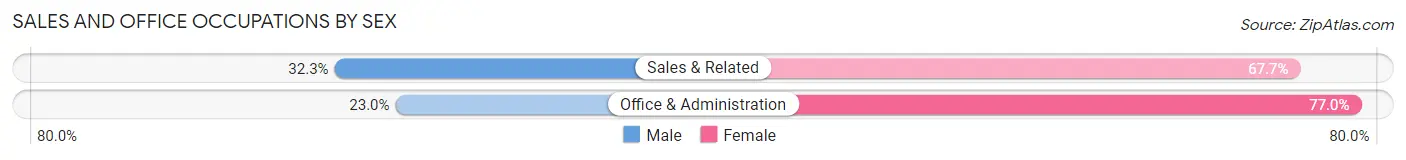
| Occupation | Male | Female |
| Sales & Related | 152 (32.3%) | 318 (67.7%) |
| Office & Administration | 110 (23.0%) | 369 (77.0%) |
| Total (Category) | 262 (27.6%) | 687 (72.4%) |
| Total (Overall) | 2,935 (52.0%) | 2,704 (47.9%) |
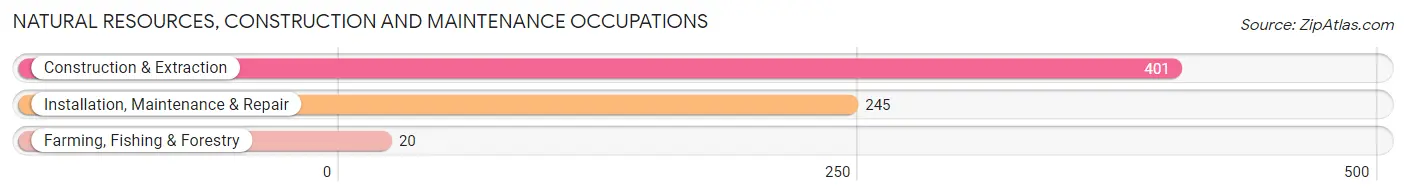
Natural Resources, Construction and Maintenance Occupations
The most common Natural Resources, Construction and Maintenance occupations in Skamania County are Construction & Extraction (401 | 7.1%), Installation, Maintenance & Repair (245 | 4.3%), and Farming, Fishing & Forestry (20 | 0.4%).
Natural Resources, Construction and Maintenance Occupations by Sex
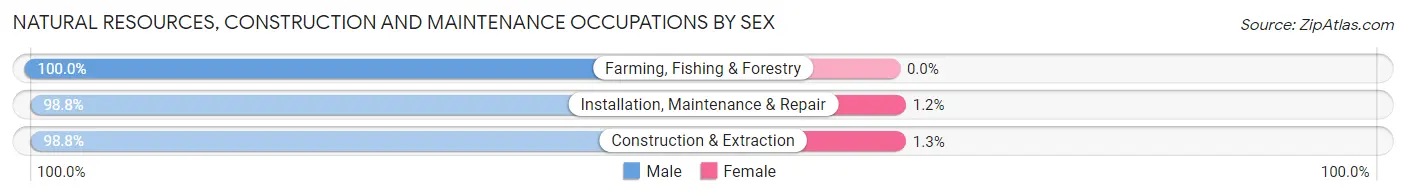
| Occupation | Male | Female |
| Farming, Fishing & Forestry | 20 (100.0%) | 0 (0.0%) |
| Construction & Extraction | 396 (98.8%) | 5 (1.3%) |
| Installation, Maintenance & Repair | 242 (98.8%) | 3 (1.2%) |
| Total (Category) | 658 (98.8%) | 8 (1.2%) |
| Total (Overall) | 2,935 (52.0%) | 2,704 (47.9%) |
Production, Transportation and Moving Occupations
The most common Production, Transportation and Moving occupations in Skamania County are Transportation (392 | 7.0%), Production (327 | 5.8%), and Material Moving (112 | 2.0%).
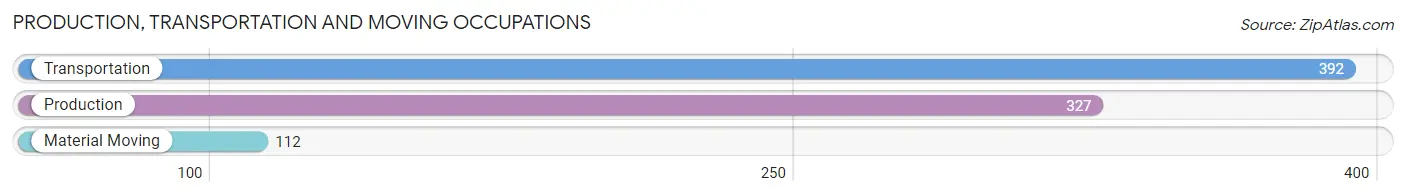
Production, Transportation and Moving Occupations by Sex
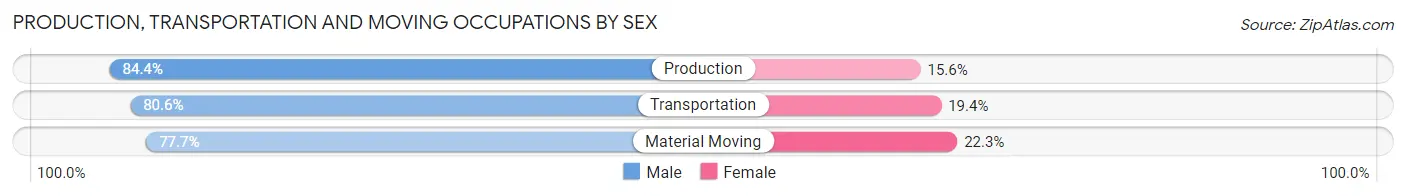
| Occupation | Male | Female |
| Production | 276 (84.4%) | 51 (15.6%) |
| Transportation | 316 (80.6%) | 76 (19.4%) |
| Material Moving | 87 (77.7%) | 25 (22.3%) |
| Total (Category) | 679 (81.7%) | 152 (18.3%) |
| Total (Overall) | 2,935 (52.0%) | 2,704 (47.9%) |
Employment Industries by Sex in Skamania County
Employment Industries in Skamania County
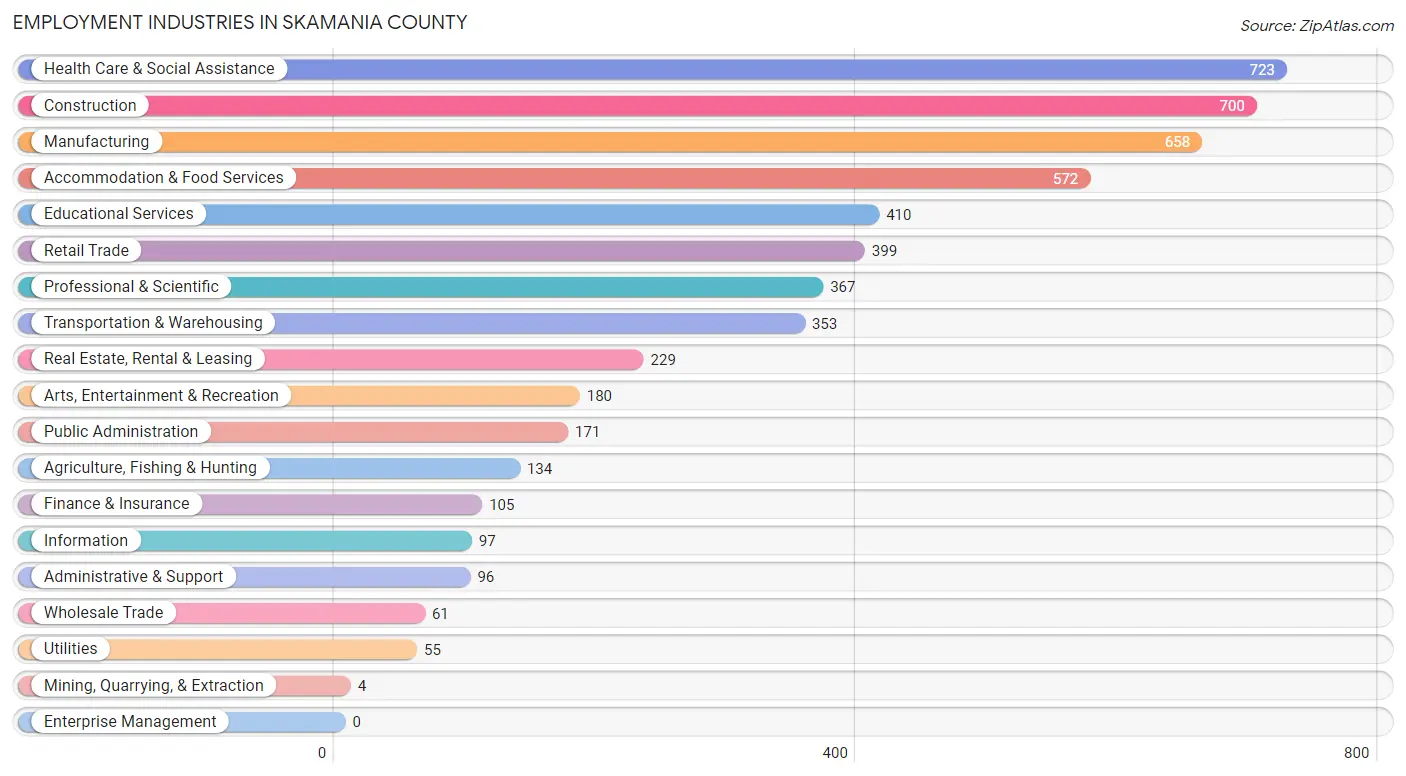
The major employment industries in Skamania County include Health Care & Social Assistance (723 | 12.8%), Construction (700 | 12.4%), Manufacturing (658 | 11.7%), Accommodation & Food Services (572 | 10.1%), and Educational Services (410 | 7.3%).
Employment Industries by Sex in Skamania County
The Skamania County industries that see more men than women are Mining, Quarrying, & Extraction (100.0%), Construction (89.9%), and Information (80.4%), whereas the industries that tend to have a higher number of women are Finance & Insurance (90.5%), Educational Services (89.5%), and Health Care & Social Assistance (85.3%).
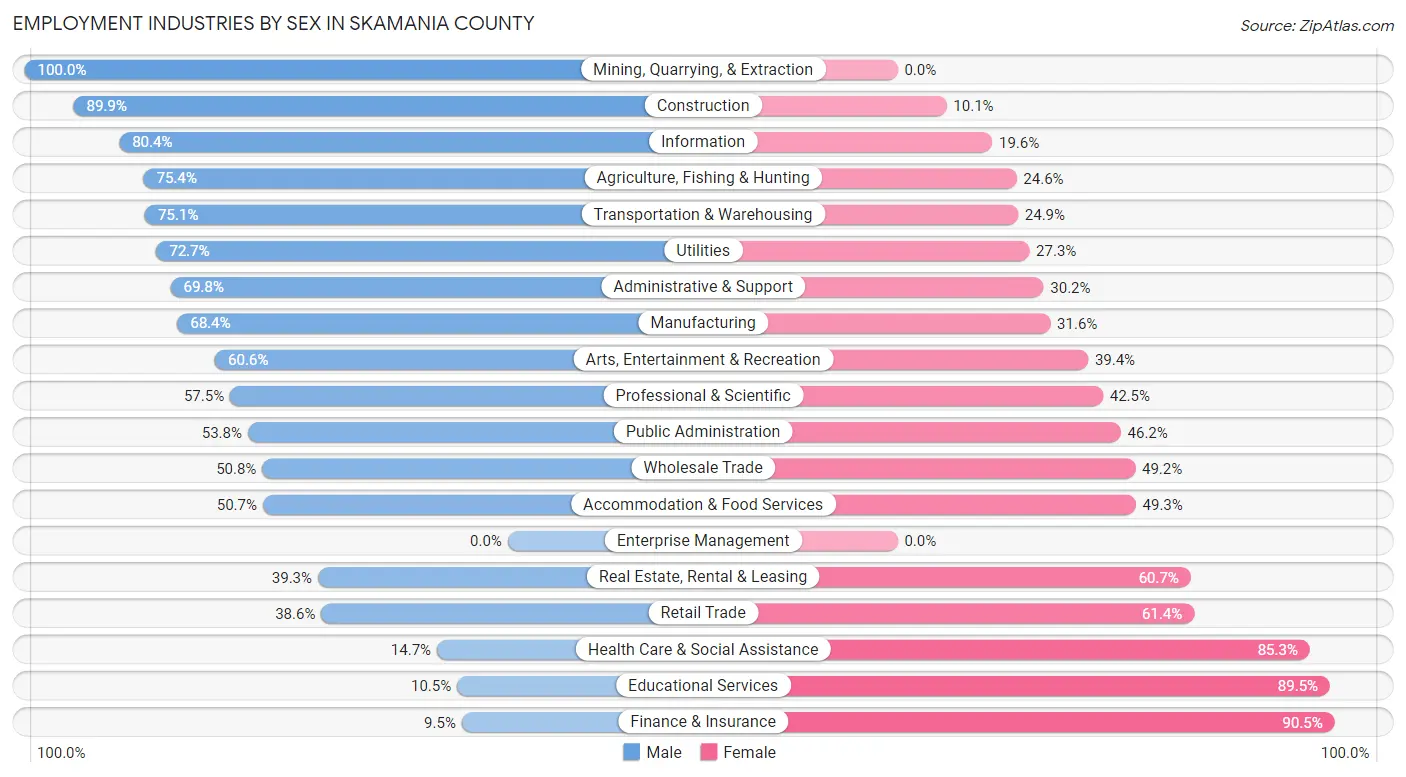
| Industry | Male | Female |
| Agriculture, Fishing & Hunting | 101 (75.4%) | 33 (24.6%) |
| Mining, Quarrying, & Extraction | 4 (100.0%) | 0 (0.0%) |
| Construction | 629 (89.9%) | 71 (10.1%) |
| Manufacturing | 450 (68.4%) | 208 (31.6%) |
| Wholesale Trade | 31 (50.8%) | 30 (49.2%) |
| Retail Trade | 154 (38.6%) | 245 (61.4%) |
| Transportation & Warehousing | 265 (75.1%) | 88 (24.9%) |
| Utilities | 40 (72.7%) | 15 (27.3%) |
| Information | 78 (80.4%) | 19 (19.6%) |
| Finance & Insurance | 10 (9.5%) | 95 (90.5%) |
| Real Estate, Rental & Leasing | 90 (39.3%) | 139 (60.7%) |
| Professional & Scientific | 211 (57.5%) | 156 (42.5%) |
| Enterprise Management | 0 (0.0%) | 0 (0.0%) |
| Administrative & Support | 67 (69.8%) | 29 (30.2%) |
| Educational Services | 43 (10.5%) | 367 (89.5%) |
| Health Care & Social Assistance | 106 (14.7%) | 617 (85.3%) |
| Arts, Entertainment & Recreation | 109 (60.6%) | 71 (39.4%) |
| Accommodation & Food Services | 290 (50.7%) | 282 (49.3%) |
| Public Administration | 92 (53.8%) | 79 (46.2%) |
| Total | 2,935 (52.0%) | 2,704 (47.9%) |
Education in Skamania County
School Enrollment in Skamania County
The most common levels of schooling among the 2,044 students in Skamania County are middle school (548 | 26.8%), high school (476 | 23.3%), and elementary school (422 | 20.6%).
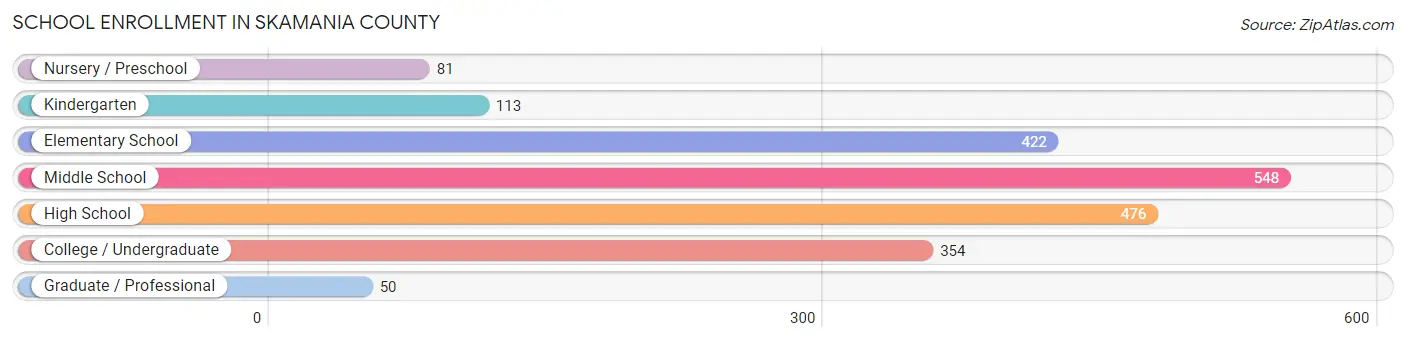
| School Level | # Students | % Students |
| Nursery / Preschool | 81 | 4.0% |
| Kindergarten | 113 | 5.5% |
| Elementary School | 422 | 20.6% |
| Middle School | 548 | 26.8% |
| High School | 476 | 23.3% |
| College / Undergraduate | 354 | 17.3% |
| Graduate / Professional | 50 | 2.5% |
| Total | 2,044 | 100.0% |
School Enrollment by Age by Funding Source in Skamania County
Out of a total of 2,044 students who are enrolled in schools in Skamania County, 217 (10.6%) attend a private institution, while the remaining 1,827 (89.4%) are enrolled in public schools. The age group of 35 years and over has the highest likelihood of being enrolled in private schools, with 42 (25.9% in the age bracket) enrolled. Conversely, the age group of 20 to 24 year olds has the lowest likelihood of being enrolled in a private school, with 107 (97.3% in the age bracket) attending a public institution.
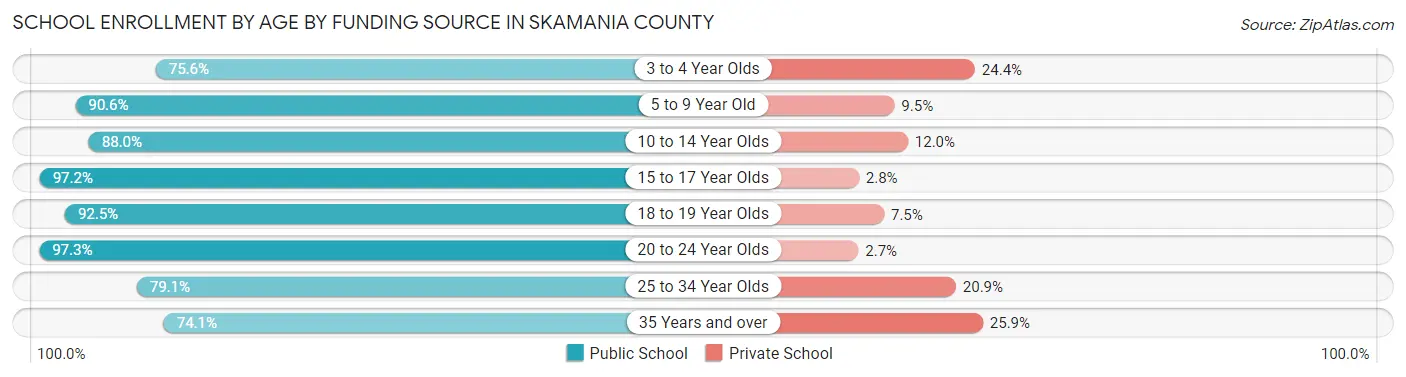
| Age Bracket | Public School | Private School |
| 3 to 4 Year Olds | 34 (75.6%) | 11 (24.4%) |
| 5 to 9 Year Old | 479 (90.5%) | 50 (9.5%) |
| 10 to 14 Year Olds | 567 (88.0%) | 77 (12.0%) |
| 15 to 17 Year Olds | 344 (97.2%) | 10 (2.8%) |
| 18 to 19 Year Olds | 123 (92.5%) | 10 (7.5%) |
| 20 to 24 Year Olds | 107 (97.3%) | 3 (2.7%) |
| 25 to 34 Year Olds | 53 (79.1%) | 14 (20.9%) |
| 35 Years and over | 120 (74.1%) | 42 (25.9%) |
| Total | 1,827 (89.4%) | 217 (10.6%) |
Educational Attainment by Field of Study in Skamania County
Education (378 | 14.5%), business (365 | 14.0%), science & technology (335 | 12.8%), bio, nature & agricultural (234 | 8.9%), and engineering (213 | 8.2%) are the most common fields of study among 2,615 individuals in Skamania County who have obtained a bachelor's degree or higher.
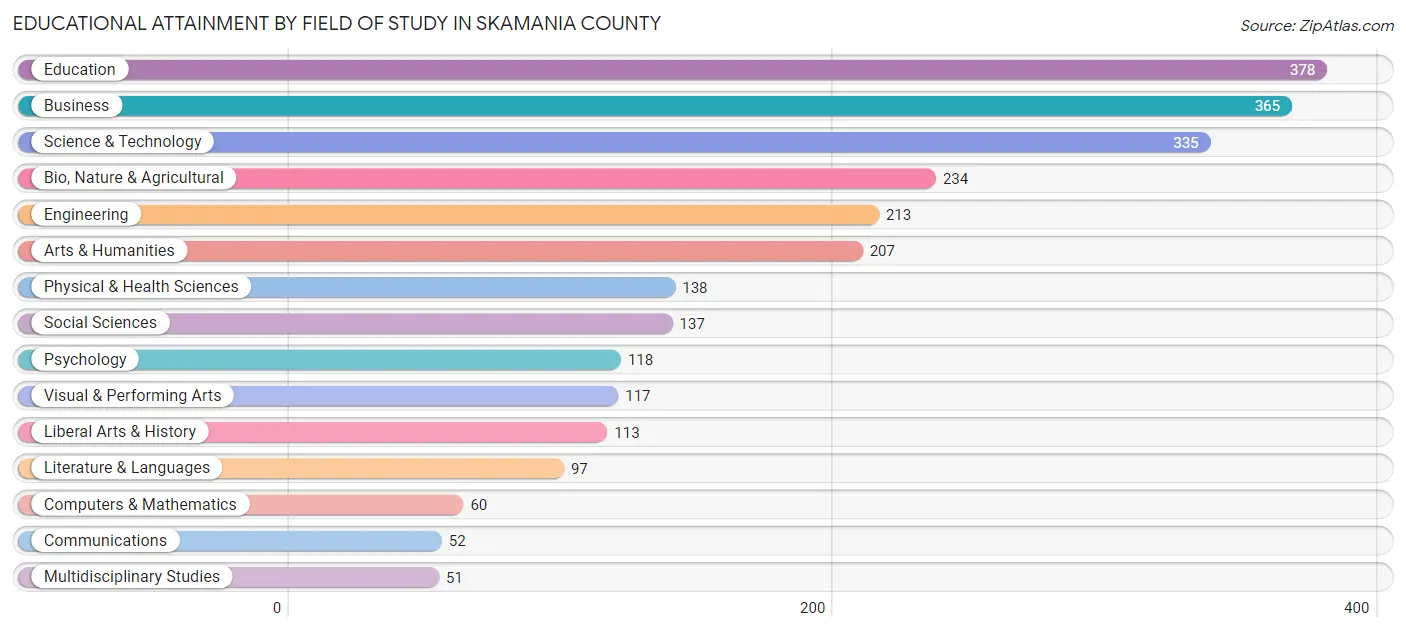
| Field of Study | # Graduates | % Graduates |
| Computers & Mathematics | 60 | 2.3% |
| Bio, Nature & Agricultural | 234 | 8.9% |
| Physical & Health Sciences | 138 | 5.3% |
| Psychology | 118 | 4.5% |
| Social Sciences | 137 | 5.2% |
| Engineering | 213 | 8.2% |
| Multidisciplinary Studies | 51 | 1.9% |
| Science & Technology | 335 | 12.8% |
| Business | 365 | 14.0% |
| Education | 378 | 14.5% |
| Literature & Languages | 97 | 3.7% |
| Liberal Arts & History | 113 | 4.3% |
| Visual & Performing Arts | 117 | 4.5% |
| Communications | 52 | 2.0% |
| Arts & Humanities | 207 | 7.9% |
| Total | 2,615 | 100.0% |
Transportation & Commute in Skamania County
Vehicle Availability by Sex in Skamania County
The most prevalent vehicle ownership categories in Skamania County are males with 2 vehicles (875, accounting for 30.5%) and females with 2 vehicles (773, making up 33.1%).
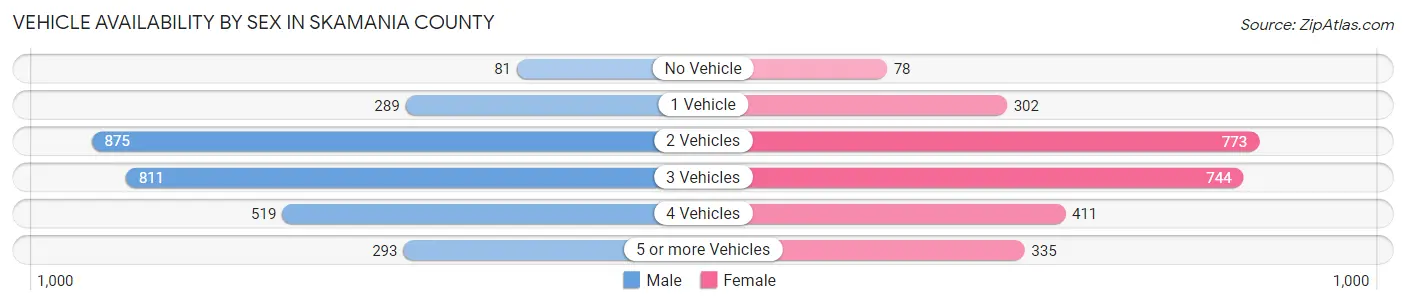
| Vehicles Available | Male | Female |
| No Vehicle | 81 (2.8%) | 78 (2.9%) |
| 1 Vehicle | 289 (10.1%) | 302 (11.4%) |
| 2 Vehicles | 875 (30.5%) | 773 (29.2%) |
| 3 Vehicles | 811 (28.3%) | 744 (28.1%) |
| 4 Vehicles | 519 (18.1%) | 411 (15.5%) |
| 5 or more Vehicles | 293 (10.2%) | 335 (12.7%) |
| Total | 2,868 (100.0%) | 2,643 (100.0%) |
Commute Time in Skamania County
The most frequently occuring commute durations in Skamania County are 30 to 34 minutes (660 commuters, 14.0%), 5 to 9 minutes (589 commuters, 12.5%), and 45 to 59 minutes (503 commuters, 10.7%).
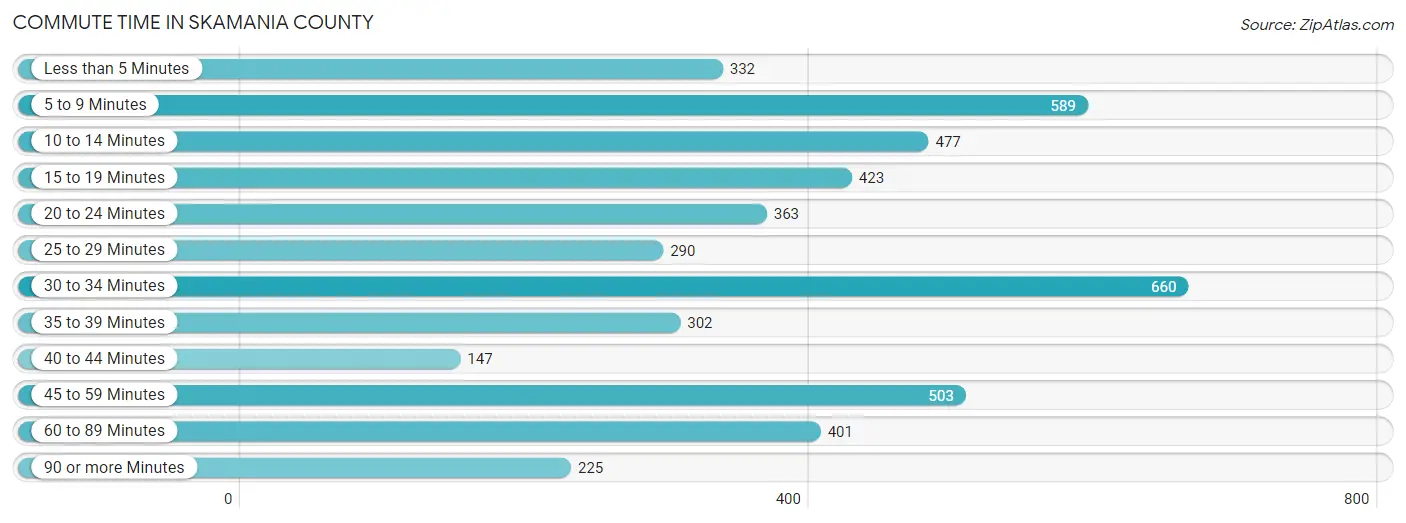
| Commute Time | # Commuters | % Commuters |
| Less than 5 Minutes | 332 | 7.0% |
| 5 to 9 Minutes | 589 | 12.5% |
| 10 to 14 Minutes | 477 | 10.1% |
| 15 to 19 Minutes | 423 | 9.0% |
| 20 to 24 Minutes | 363 | 7.7% |
| 25 to 29 Minutes | 290 | 6.1% |
| 30 to 34 Minutes | 660 | 14.0% |
| 35 to 39 Minutes | 302 | 6.4% |
| 40 to 44 Minutes | 147 | 3.1% |
| 45 to 59 Minutes | 503 | 10.7% |
| 60 to 89 Minutes | 401 | 8.5% |
| 90 or more Minutes | 225 | 4.8% |
Commute Time by Sex in Skamania County
The most common commute times in Skamania County are 30 to 34 minutes (450 commuters, 18.0%) for males and 5 to 9 minutes (308 commuters, 14.0%) for females.
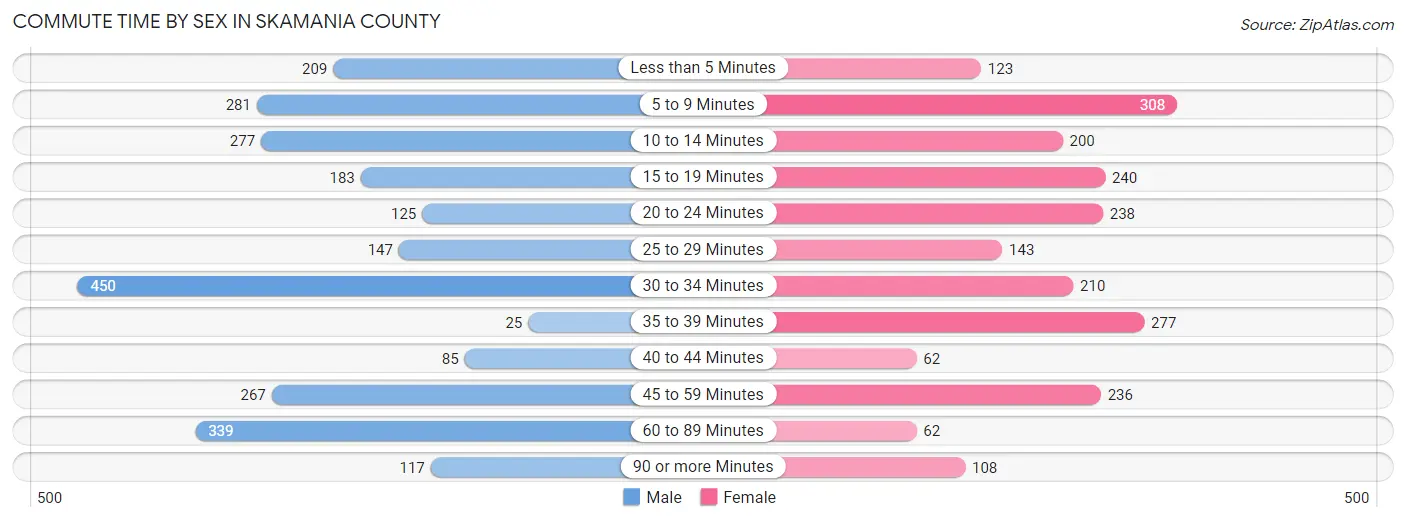
| Commute Time | Male | Female |
| Less than 5 Minutes | 209 (8.3%) | 123 (5.6%) |
| 5 to 9 Minutes | 281 (11.2%) | 308 (14.0%) |
| 10 to 14 Minutes | 277 (11.1%) | 200 (9.1%) |
| 15 to 19 Minutes | 183 (7.3%) | 240 (10.9%) |
| 20 to 24 Minutes | 125 (5.0%) | 238 (10.8%) |
| 25 to 29 Minutes | 147 (5.9%) | 143 (6.5%) |
| 30 to 34 Minutes | 450 (18.0%) | 210 (9.5%) |
| 35 to 39 Minutes | 25 (1.0%) | 277 (12.6%) |
| 40 to 44 Minutes | 85 (3.4%) | 62 (2.8%) |
| 45 to 59 Minutes | 267 (10.7%) | 236 (10.7%) |
| 60 to 89 Minutes | 339 (13.5%) | 62 (2.8%) |
| 90 or more Minutes | 117 (4.7%) | 108 (4.9%) |
Time of Departure to Work by Sex in Skamania County
The most frequent times of departure to work in Skamania County are 12:00 AM to 4:59 AM (442, 17.6%) for males and 6:30 AM to 6:59 AM (372, 16.9%) for females.
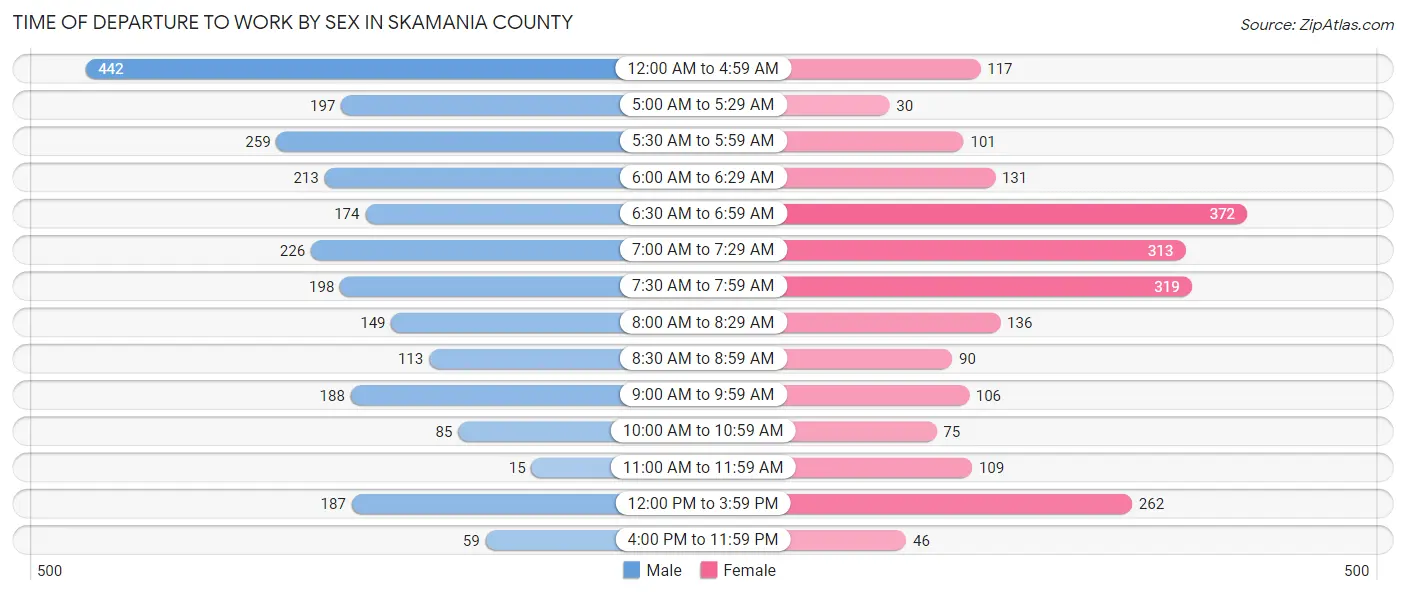
| Time of Departure | Male | Female |
| 12:00 AM to 4:59 AM | 442 (17.6%) | 117 (5.3%) |
| 5:00 AM to 5:29 AM | 197 (7.9%) | 30 (1.4%) |
| 5:30 AM to 5:59 AM | 259 (10.3%) | 101 (4.6%) |
| 6:00 AM to 6:29 AM | 213 (8.5%) | 131 (5.9%) |
| 6:30 AM to 6:59 AM | 174 (7.0%) | 372 (16.9%) |
| 7:00 AM to 7:29 AM | 226 (9.0%) | 313 (14.2%) |
| 7:30 AM to 7:59 AM | 198 (7.9%) | 319 (14.4%) |
| 8:00 AM to 8:29 AM | 149 (5.9%) | 136 (6.2%) |
| 8:30 AM to 8:59 AM | 113 (4.5%) | 90 (4.1%) |
| 9:00 AM to 9:59 AM | 188 (7.5%) | 106 (4.8%) |
| 10:00 AM to 10:59 AM | 85 (3.4%) | 75 (3.4%) |
| 11:00 AM to 11:59 AM | 15 (0.6%) | 109 (4.9%) |
| 12:00 PM to 3:59 PM | 187 (7.5%) | 262 (11.9%) |
| 4:00 PM to 11:59 PM | 59 (2.4%) | 46 (2.1%) |
| Total | 2,505 (100.0%) | 2,207 (100.0%) |
Housing Occupancy in Skamania County
Occupancy by Ownership in Skamania County
Of the total 4,812 dwellings in Skamania County, owner-occupied units account for 3,909 (81.2%), while renter-occupied units make up 903 (18.8%).
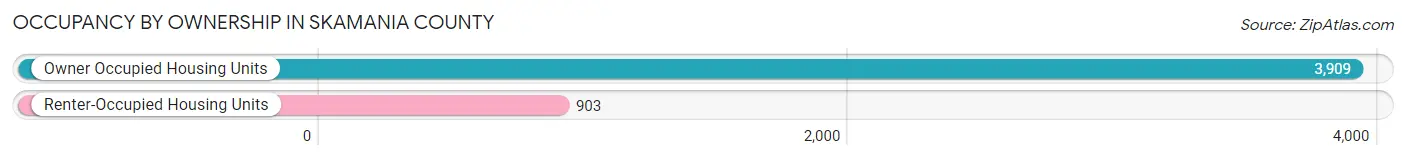
| Occupancy | # Housing Units | % Housing Units |
| Owner Occupied Housing Units | 3,909 | 81.2% |
| Renter-Occupied Housing Units | 903 | 18.8% |
| Total Occupied Housing Units | 4,812 | 100.0% |
Occupancy by Household Size in Skamania County
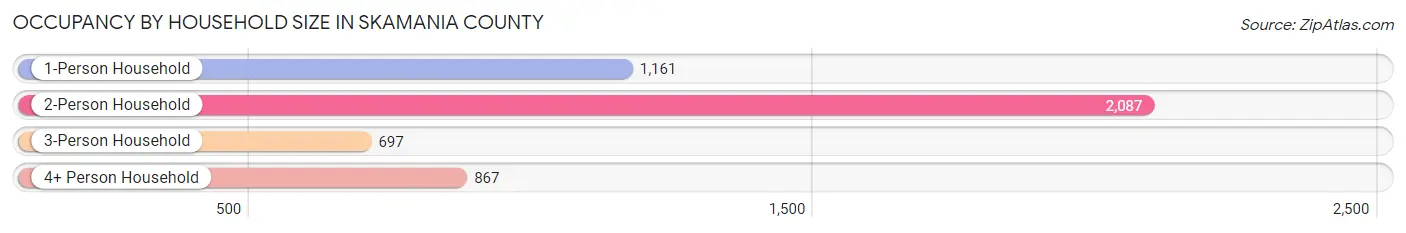
| Household Size | # Housing Units | % Housing Units |
| 1-Person Household | 1,161 | 24.1% |
| 2-Person Household | 2,087 | 43.4% |
| 3-Person Household | 697 | 14.5% |
| 4+ Person Household | 867 | 18.0% |
| Total Housing Units | 4,812 | 100.0% |
Occupancy by Ownership by Household Size in Skamania County
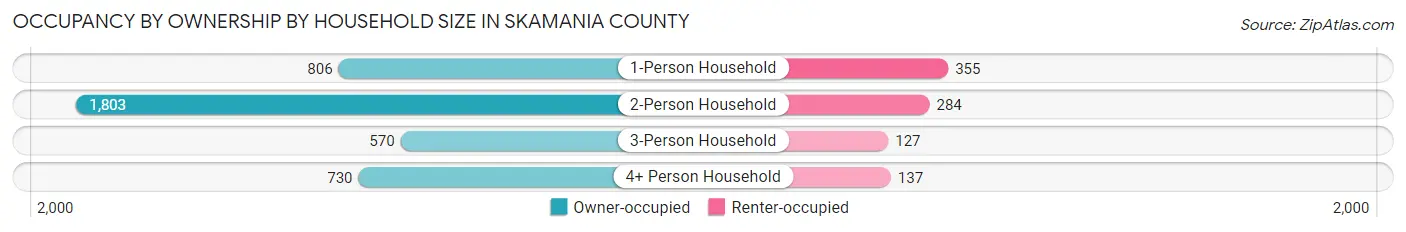
| Household Size | Owner-occupied | Renter-occupied |
| 1-Person Household | 806 (69.4%) | 355 (30.6%) |
| 2-Person Household | 1,803 (86.4%) | 284 (13.6%) |
| 3-Person Household | 570 (81.8%) | 127 (18.2%) |
| 4+ Person Household | 730 (84.2%) | 137 (15.8%) |
| Total Housing Units | 3,909 (81.2%) | 903 (18.8%) |
Occupancy by Educational Attainment in Skamania County
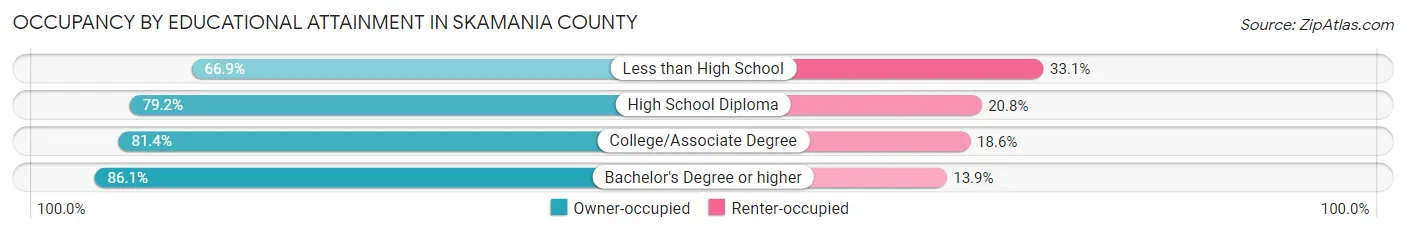
| Household Size | Owner-occupied | Renter-occupied |
| Less than High School | 196 (66.9%) | 97 (33.1%) |
| High School Diploma | 1,064 (79.2%) | 280 (20.8%) |
| College/Associate Degree | 1,454 (81.4%) | 333 (18.6%) |
| Bachelor's Degree or higher | 1,195 (86.1%) | 193 (13.9%) |
Occupancy by Age of Householder in Skamania County
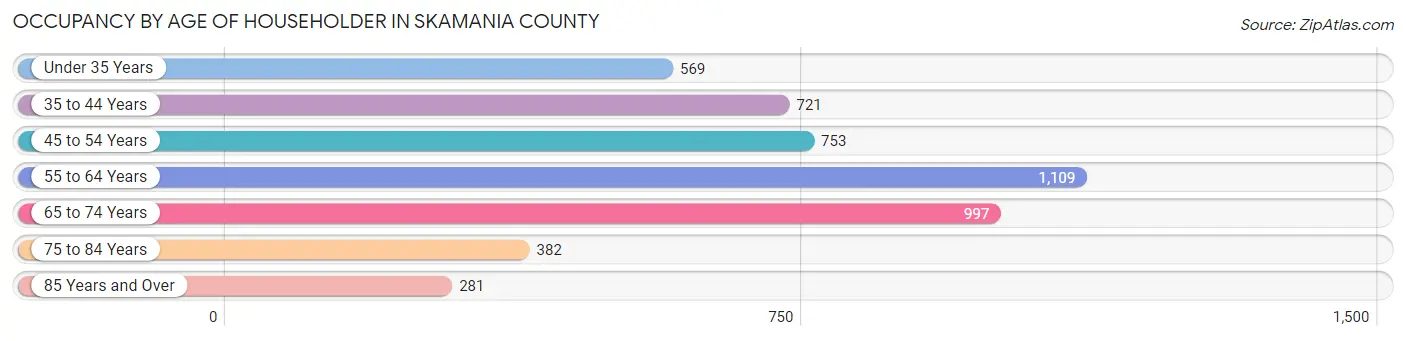
| Age Bracket | # Households | % Households |
| Under 35 Years | 569 | 11.8% |
| 35 to 44 Years | 721 | 15.0% |
| 45 to 54 Years | 753 | 15.7% |
| 55 to 64 Years | 1,109 | 23.1% |
| 65 to 74 Years | 997 | 20.7% |
| 75 to 84 Years | 382 | 7.9% |
| 85 Years and Over | 281 | 5.8% |
| Total | 4,812 | 100.0% |
Housing Finances in Skamania County
Median Income by Occupancy in Skamania County
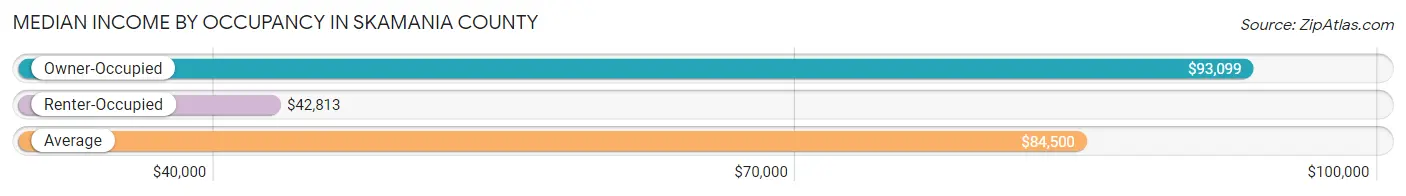
| Occupancy Type | # Households | Median Income |
| Owner-Occupied | 3,909 (81.2%) | $93,099 |
| Renter-Occupied | 903 (18.8%) | $42,813 |
| Average | 4,812 (100.0%) | $84,500 |
Occupancy by Householder Income Bracket in Skamania County
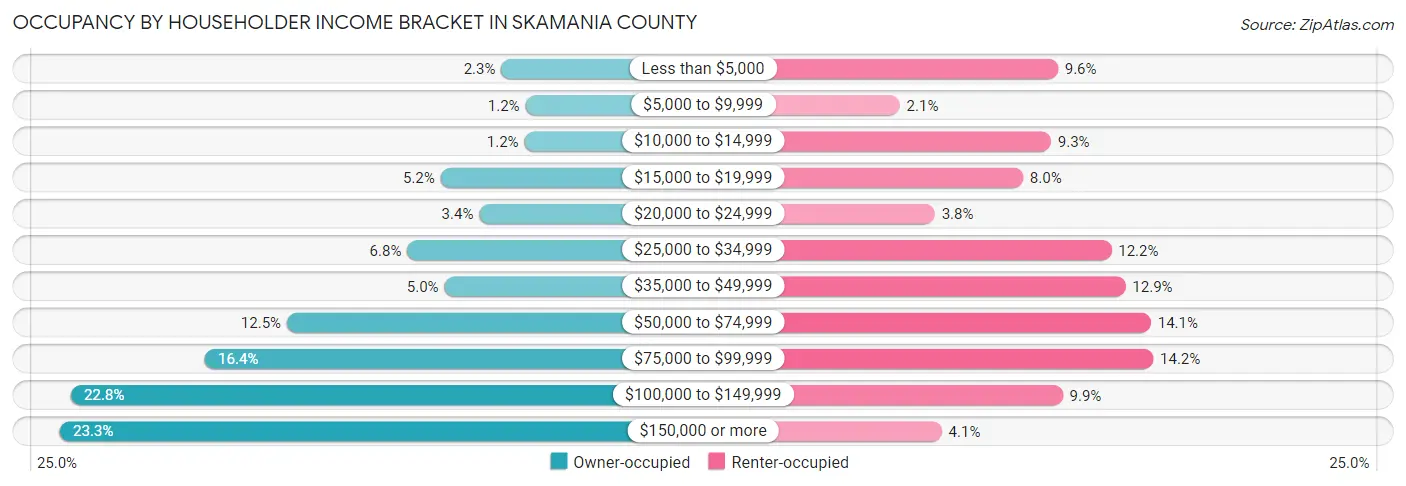
| Income Bracket | Owner-occupied | Renter-occupied |
| Less than $5,000 | 90 (2.3%) | 87 (9.6%) |
| $5,000 to $9,999 | 45 (1.1%) | 19 (2.1%) |
| $10,000 to $14,999 | 47 (1.2%) | 84 (9.3%) |
| $15,000 to $19,999 | 203 (5.2%) | 72 (8.0%) |
| $20,000 to $24,999 | 131 (3.4%) | 34 (3.8%) |
| $25,000 to $34,999 | 265 (6.8%) | 110 (12.2%) |
| $35,000 to $49,999 | 196 (5.0%) | 116 (12.9%) |
| $50,000 to $74,999 | 489 (12.5%) | 127 (14.1%) |
| $75,000 to $99,999 | 641 (16.4%) | 128 (14.2%) |
| $100,000 to $149,999 | 891 (22.8%) | 89 (9.9%) |
| $150,000 or more | 911 (23.3%) | 37 (4.1%) |
| Total | 3,909 (100.0%) | 903 (100.0%) |
Monthly Housing Cost Tiers in Skamania County
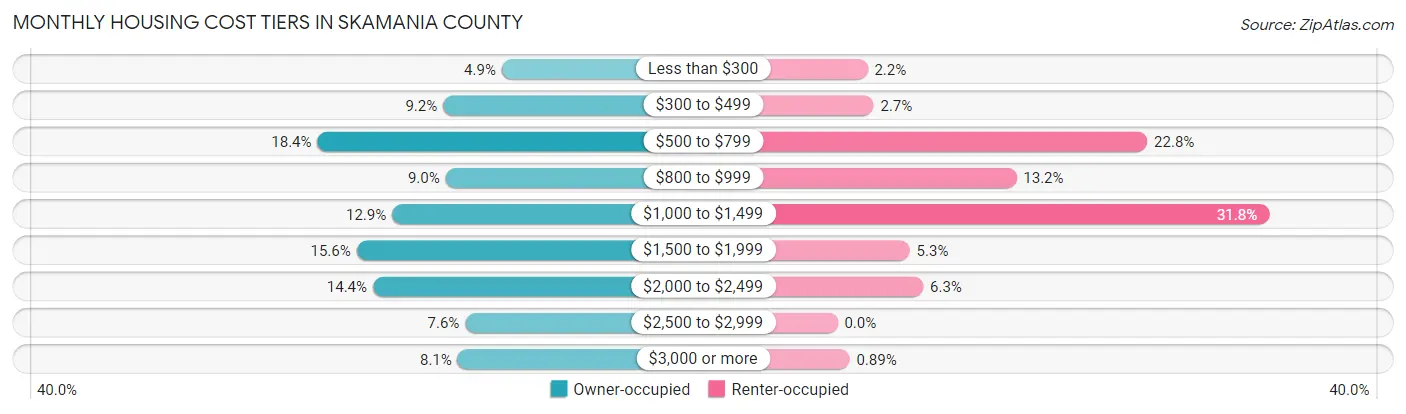
| Monthly Cost | Owner-occupied | Renter-occupied |
| Less than $300 | 190 (4.9%) | 20 (2.2%) |
| $300 to $499 | 359 (9.2%) | 24 (2.7%) |
| $500 to $799 | 721 (18.4%) | 206 (22.8%) |
| $800 to $999 | 352 (9.0%) | 119 (13.2%) |
| $1,000 to $1,499 | 506 (12.9%) | 287 (31.8%) |
| $1,500 to $1,999 | 608 (15.5%) | 48 (5.3%) |
| $2,000 to $2,499 | 561 (14.3%) | 57 (6.3%) |
| $2,500 to $2,999 | 295 (7.5%) | 0 (0.0%) |
| $3,000 or more | 317 (8.1%) | 8 (0.9%) |
| Total | 3,909 (100.0%) | 903 (100.0%) |
Physical Housing Characteristics in Skamania County
Housing Structures in Skamania County
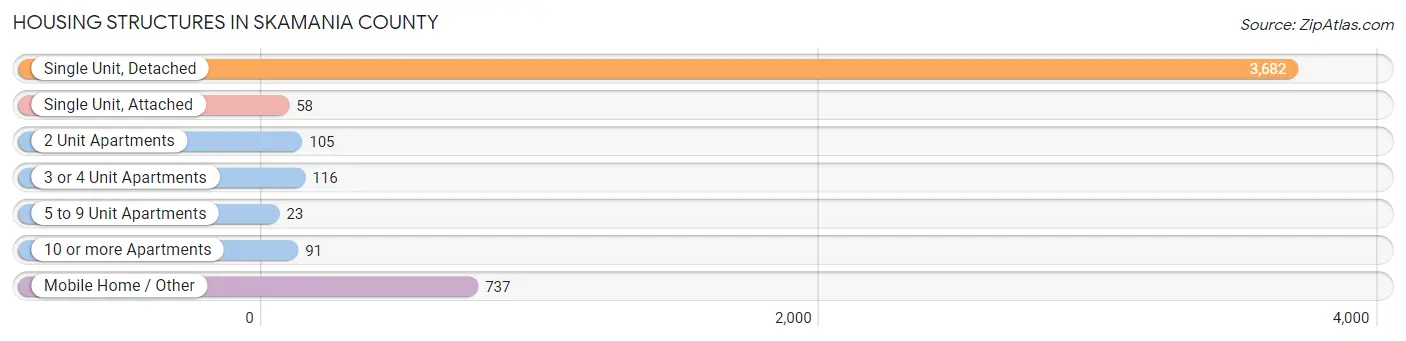
| Structure Type | # Housing Units | % Housing Units |
| Single Unit, Detached | 3,682 | 76.5% |
| Single Unit, Attached | 58 | 1.2% |
| 2 Unit Apartments | 105 | 2.2% |
| 3 or 4 Unit Apartments | 116 | 2.4% |
| 5 to 9 Unit Apartments | 23 | 0.5% |
| 10 or more Apartments | 91 | 1.9% |
| Mobile Home / Other | 737 | 15.3% |
| Total | 4,812 | 100.0% |
Housing Structures by Occupancy in Skamania County
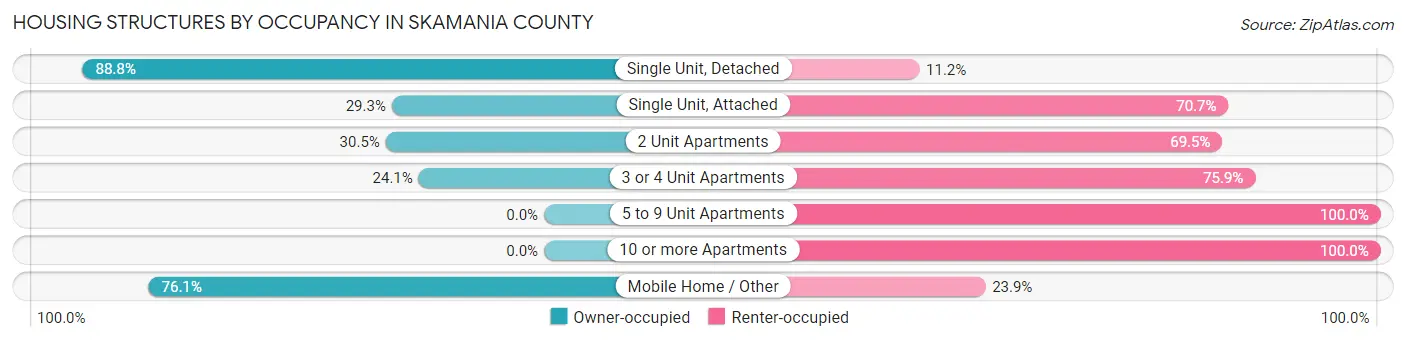
| Structure Type | Owner-occupied | Renter-occupied |
| Single Unit, Detached | 3,271 (88.8%) | 411 (11.2%) |
| Single Unit, Attached | 17 (29.3%) | 41 (70.7%) |
| 2 Unit Apartments | 32 (30.5%) | 73 (69.5%) |
| 3 or 4 Unit Apartments | 28 (24.1%) | 88 (75.9%) |
| 5 to 9 Unit Apartments | 0 (0.0%) | 23 (100.0%) |
| 10 or more Apartments | 0 (0.0%) | 91 (100.0%) |
| Mobile Home / Other | 561 (76.1%) | 176 (23.9%) |
| Total | 3,909 (81.2%) | 903 (18.8%) |
Housing Structures by Number of Rooms in Skamania County
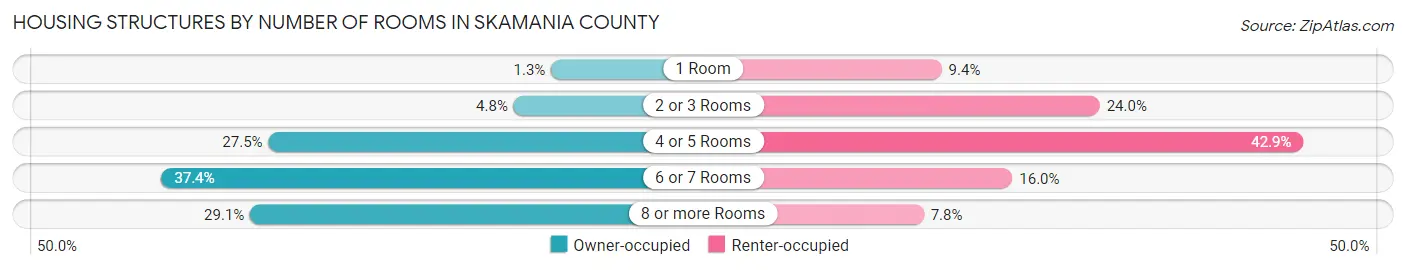
| Number of Rooms | Owner-occupied | Renter-occupied |
| 1 Room | 51 (1.3%) | 85 (9.4%) |
| 2 or 3 Rooms | 186 (4.8%) | 217 (24.0%) |
| 4 or 5 Rooms | 1,073 (27.5%) | 387 (42.9%) |
| 6 or 7 Rooms | 1,460 (37.3%) | 144 (16.0%) |
| 8 or more Rooms | 1,139 (29.1%) | 70 (7.7%) |
| Total | 3,909 (100.0%) | 903 (100.0%) |
Housing Structure by Heating Type in Skamania County
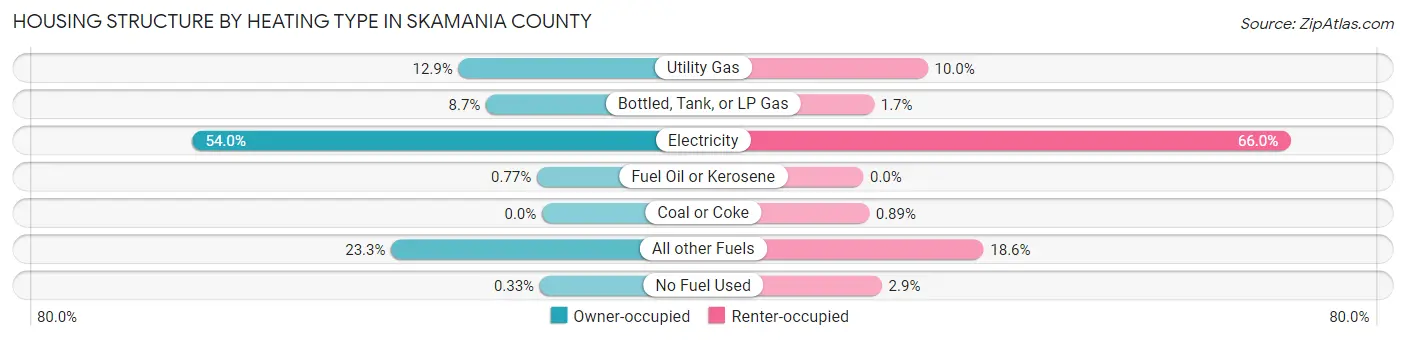
| Heating Type | Owner-occupied | Renter-occupied |
| Utility Gas | 505 (12.9%) | 90 (10.0%) |
| Bottled, Tank, or LP Gas | 338 (8.6%) | 15 (1.7%) |
| Electricity | 2,112 (54.0%) | 596 (66.0%) |
| Fuel Oil or Kerosene | 30 (0.8%) | 0 (0.0%) |
| Coal or Coke | 0 (0.0%) | 8 (0.9%) |
| All other Fuels | 911 (23.3%) | 168 (18.6%) |
| No Fuel Used | 13 (0.3%) | 26 (2.9%) |
| Total | 3,909 (100.0%) | 903 (100.0%) |
Household Vehicle Usage in Skamania County
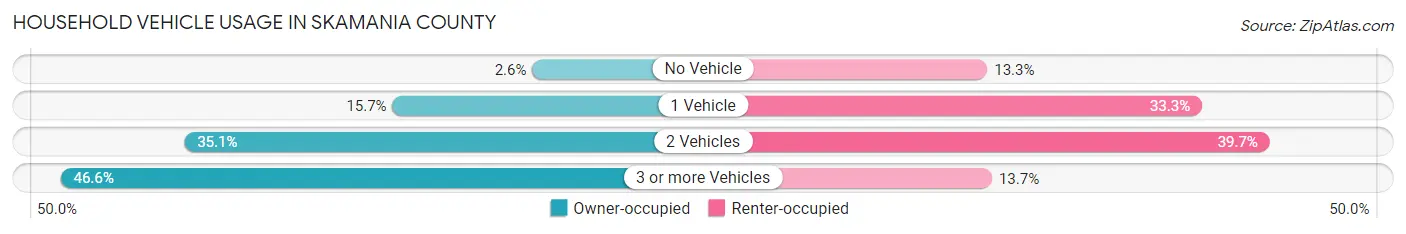
| Vehicles per Household | Owner-occupied | Renter-occupied |
| No Vehicle | 102 (2.6%) | 120 (13.3%) |
| 1 Vehicle | 612 (15.7%) | 301 (33.3%) |
| 2 Vehicles | 1,372 (35.1%) | 358 (39.7%) |
| 3 or more Vehicles | 1,823 (46.6%) | 124 (13.7%) |
| Total | 3,909 (100.0%) | 903 (100.0%) |
Real Estate & Mortgages in Skamania County
Real Estate and Mortgage Overview in Skamania County
| Characteristic | Without Mortgage | With Mortgage |
| Housing Units | 1,635 | 2,274 |
| Median Property Value | $429,400 | $450,800 |
| Median Household Income | $66,250 | $657 |
| Monthly Housing Costs | $616 | $317 |
| Real Estate Taxes | $3,243 | $96 |
Property Value by Mortgage Status in Skamania County
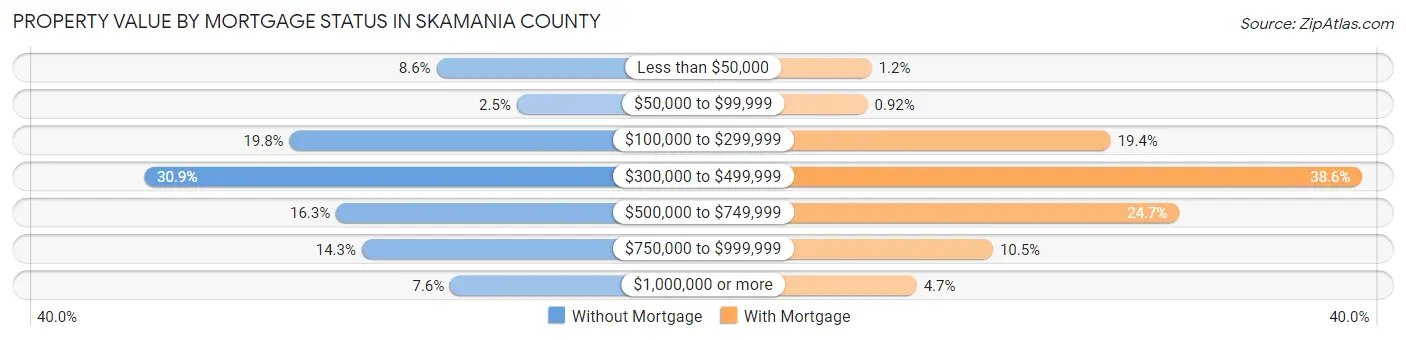
| Property Value | Without Mortgage | With Mortgage |
| Less than $50,000 | 141 (8.6%) | 28 (1.2%) |
| $50,000 to $99,999 | 41 (2.5%) | 21 (0.9%) |
| $100,000 to $299,999 | 324 (19.8%) | 442 (19.4%) |
| $300,000 to $499,999 | 505 (30.9%) | 878 (38.6%) |
| $500,000 to $749,999 | 266 (16.3%) | 561 (24.7%) |
| $750,000 to $999,999 | 234 (14.3%) | 238 (10.5%) |
| $1,000,000 or more | 124 (7.6%) | 106 (4.7%) |
| Total | 1,635 (100.0%) | 2,274 (100.0%) |
Household Income by Mortgage Status in Skamania County
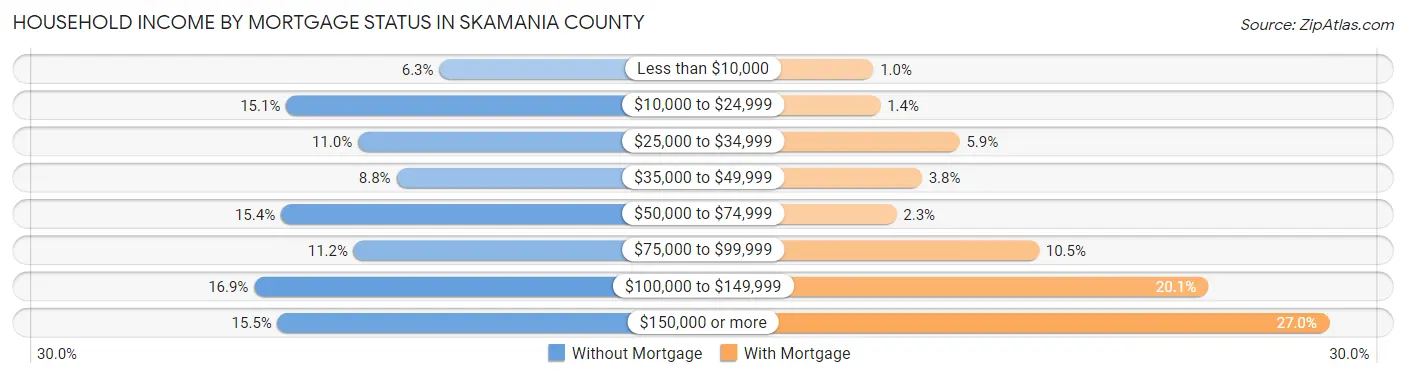
| Household Income | Without Mortgage | With Mortgage |
| Less than $10,000 | 103 (6.3%) | 23 (1.0%) |
| $10,000 to $24,999 | 246 (15.0%) | 32 (1.4%) |
| $25,000 to $34,999 | 179 (11.0%) | 135 (5.9%) |
| $35,000 to $49,999 | 143 (8.7%) | 86 (3.8%) |
| $50,000 to $74,999 | 251 (15.3%) | 53 (2.3%) |
| $75,000 to $99,999 | 183 (11.2%) | 238 (10.5%) |
| $100,000 to $149,999 | 276 (16.9%) | 458 (20.1%) |
| $150,000 or more | 254 (15.5%) | 615 (27.0%) |
| Total | 1,635 (100.0%) | 2,274 (100.0%) |
Property Value to Household Income Ratio in Skamania County
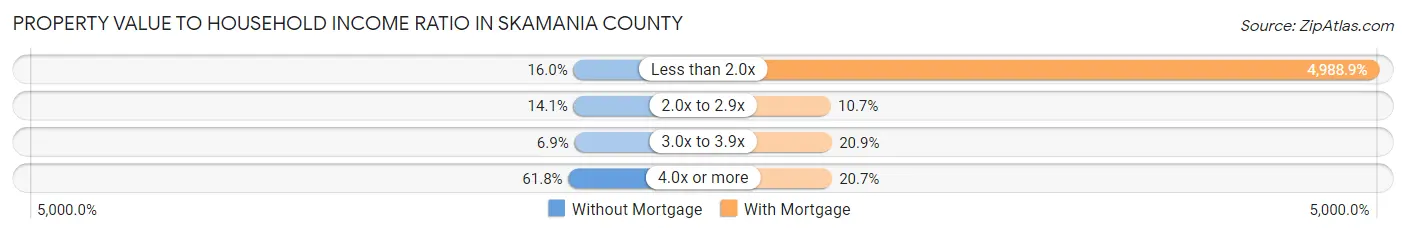
| Value-to-Income Ratio | Without Mortgage | With Mortgage |
| Less than 2.0x | 261 (16.0%) | 113,448 (4,988.9%) |
| 2.0x to 2.9x | 230 (14.1%) | 244 (10.7%) |
| 3.0x to 3.9x | 112 (6.9%) | 476 (20.9%) |
| 4.0x or more | 1,010 (61.8%) | 471 (20.7%) |
| Total | 1,635 (100.0%) | 2,274 (100.0%) |
Real Estate Taxes by Mortgage Status in Skamania County
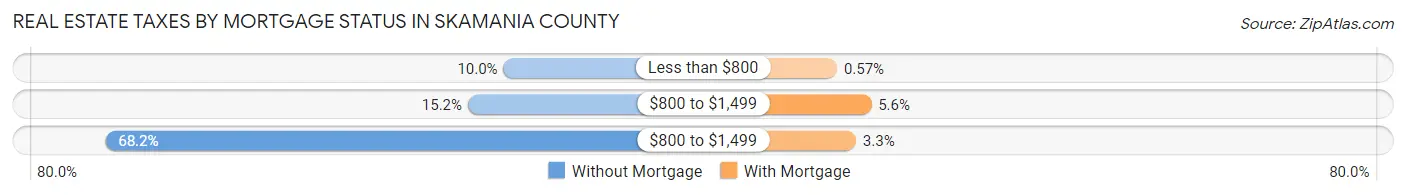
| Property Taxes | Without Mortgage | With Mortgage |
| Less than $800 | 164 (10.0%) | 13 (0.6%) |
| $800 to $1,499 | 249 (15.2%) | 127 (5.6%) |
| $800 to $1,499 | 1,115 (68.2%) | 76 (3.3%) |
| Total | 1,635 (100.0%) | 2,274 (100.0%) |
Health & Disability in Skamania County
Health Insurance Coverage by Age in Skamania County
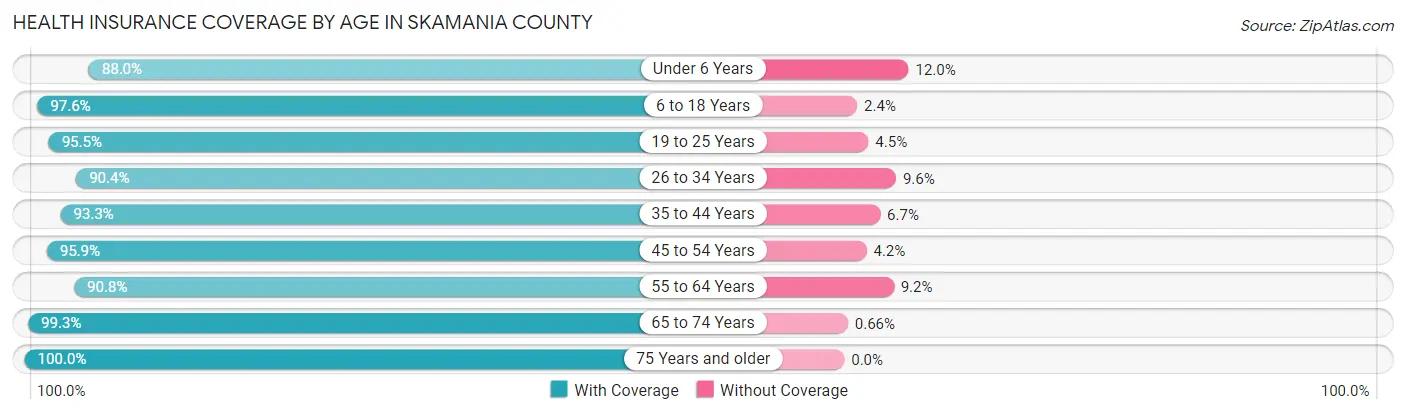
| Age Bracket | With Coverage | Without Coverage |
| Under 6 Years | 587 (88.0%) | 80 (12.0%) |
| 6 to 18 Years | 1,543 (97.6%) | 38 (2.4%) |
| 19 to 25 Years | 807 (95.5%) | 38 (4.5%) |
| 26 to 34 Years | 956 (90.4%) | 102 (9.6%) |
| 35 to 44 Years | 1,354 (93.3%) | 97 (6.7%) |
| 45 to 54 Years | 1,687 (95.9%) | 73 (4.2%) |
| 55 to 64 Years | 1,900 (90.8%) | 193 (9.2%) |
| 65 to 74 Years | 1,644 (99.3%) | 11 (0.7%) |
| 75 Years and older | 958 (100.0%) | 0 (0.0%) |
| Total | 11,436 (94.8%) | 632 (5.2%) |
Health Insurance Coverage by Citizenship Status in Skamania County
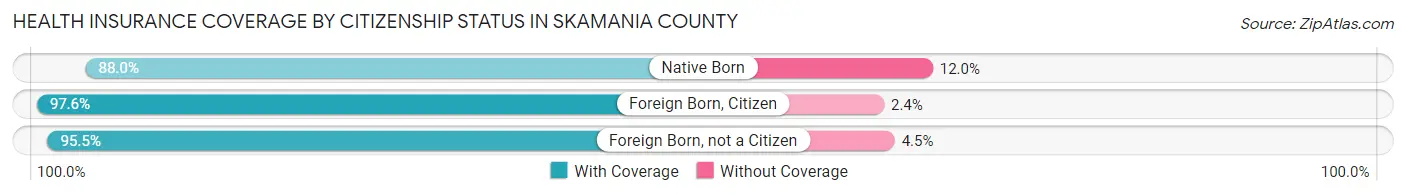
| Citizenship Status | With Coverage | Without Coverage |
| Native Born | 587 (88.0%) | 80 (12.0%) |
| Foreign Born, Citizen | 1,543 (97.6%) | 38 (2.4%) |
| Foreign Born, not a Citizen | 807 (95.5%) | 38 (4.5%) |
Health Insurance Coverage by Household Income in Skamania County
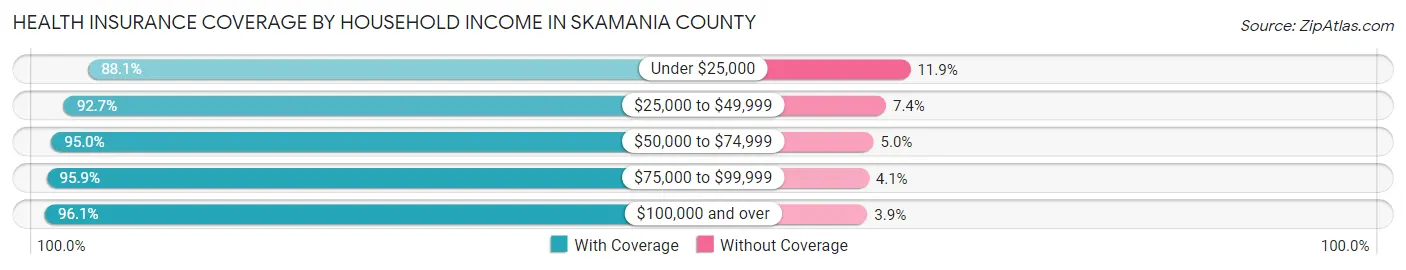
| Household Income | With Coverage | Without Coverage |
| Under $25,000 | 1,041 (88.1%) | 141 (11.9%) |
| $25,000 to $49,999 | 1,336 (92.6%) | 106 (7.3%) |
| $50,000 to $74,999 | 1,418 (95.0%) | 75 (5.0%) |
| $75,000 to $99,999 | 1,905 (95.9%) | 82 (4.1%) |
| $100,000 and over | 5,684 (96.1%) | 228 (3.9%) |
Public vs Private Health Insurance Coverage by Age in Skamania County
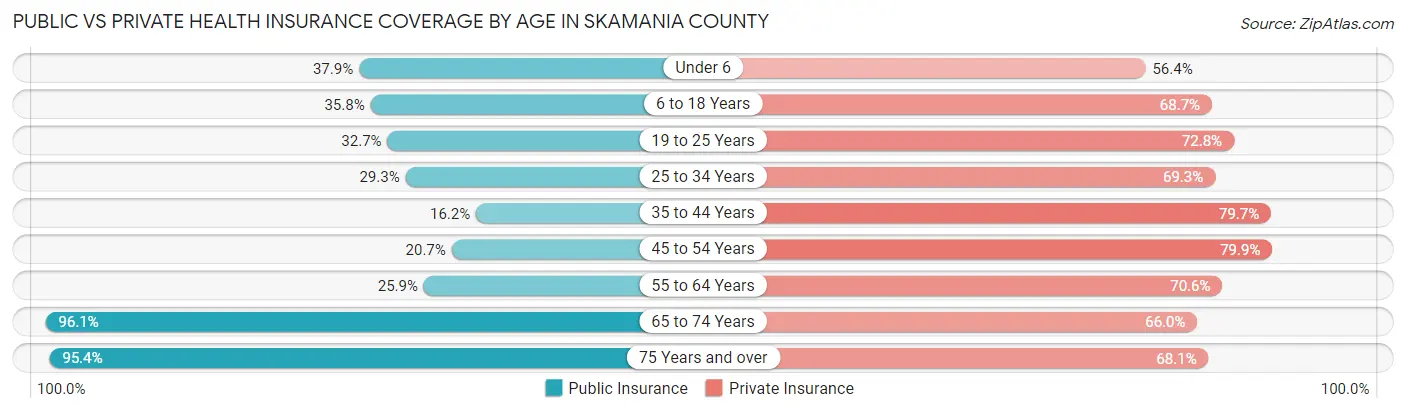
| Age Bracket | Public Insurance | Private Insurance |
| Under 6 | 253 (37.9%) | 376 (56.4%) |
| 6 to 18 Years | 566 (35.8%) | 1,086 (68.7%) |
| 19 to 25 Years | 276 (32.7%) | 615 (72.8%) |
| 25 to 34 Years | 310 (29.3%) | 733 (69.3%) |
| 35 to 44 Years | 235 (16.2%) | 1,156 (79.7%) |
| 45 to 54 Years | 365 (20.7%) | 1,406 (79.9%) |
| 55 to 64 Years | 542 (25.9%) | 1,478 (70.6%) |
| 65 to 74 Years | 1,591 (96.1%) | 1,092 (66.0%) |
| 75 Years and over | 914 (95.4%) | 652 (68.1%) |
| Total | 5,052 (41.9%) | 8,594 (71.2%) |
Disability Status by Sex by Age in Skamania County
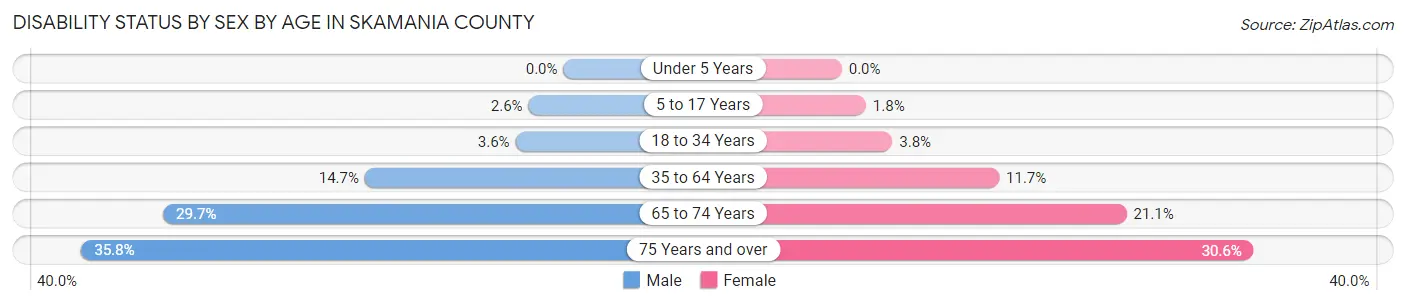
| Age Bracket | Male | Female |
| Under 5 Years | 0 (0.0%) | 0 (0.0%) |
| 5 to 17 Years | 21 (2.6%) | 15 (1.8%) |
| 18 to 34 Years | 37 (3.6%) | 36 (3.7%) |
| 35 to 64 Years | 378 (14.7%) | 320 (11.7%) |
| 65 to 74 Years | 257 (29.7%) | 167 (21.1%) |
| 75 Years and over | 165 (35.8%) | 152 (30.6%) |
Disability Class by Sex by Age in Skamania County
Disability Class: Hearing Difficulty
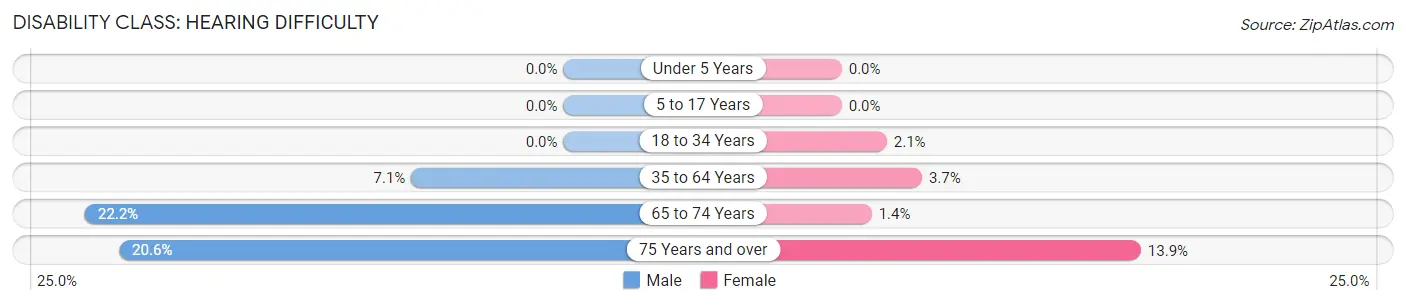
| Age Bracket | Male | Female |
| Under 5 Years | 0 (0.0%) | 0 (0.0%) |
| 5 to 17 Years | 0 (0.0%) | 0 (0.0%) |
| 18 to 34 Years | 0 (0.0%) | 20 (2.1%) |
| 35 to 64 Years | 181 (7.1%) | 102 (3.7%) |
| 65 to 74 Years | 192 (22.2%) | 11 (1.4%) |
| 75 Years and over | 95 (20.6%) | 69 (13.9%) |
Disability Class: Vision Difficulty
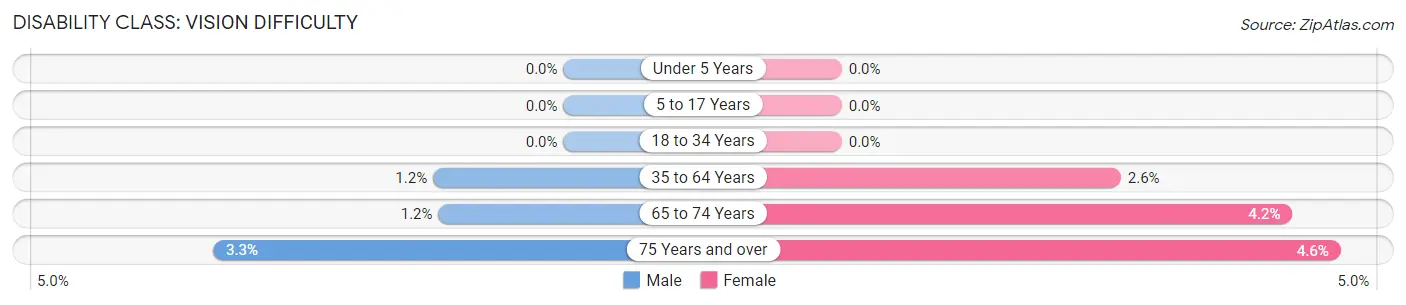
| Age Bracket | Male | Female |
| Under 5 Years | 0 (0.0%) | 0 (0.0%) |
| 5 to 17 Years | 0 (0.0%) | 0 (0.0%) |
| 18 to 34 Years | 0 (0.0%) | 0 (0.0%) |
| 35 to 64 Years | 31 (1.2%) | 71 (2.6%) |
| 65 to 74 Years | 10 (1.2%) | 33 (4.2%) |
| 75 Years and over | 15 (3.3%) | 23 (4.6%) |
Disability Class: Cognitive Difficulty
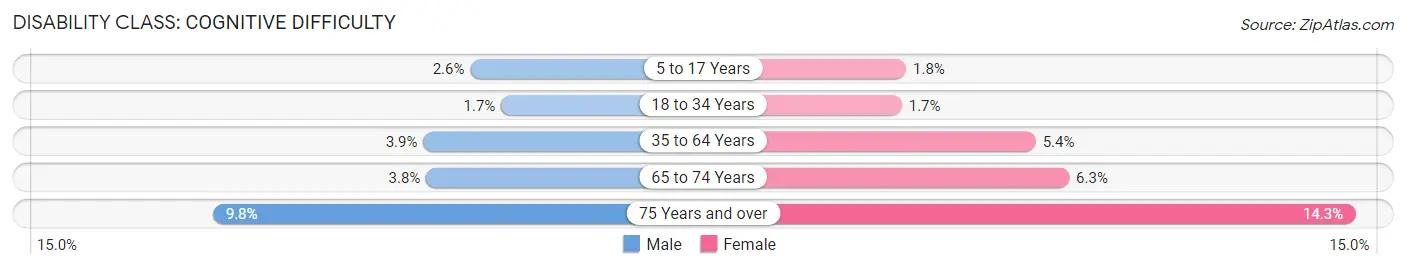
| Age Bracket | Male | Female |
| 5 to 17 Years | 21 (2.6%) | 15 (1.8%) |
| 18 to 34 Years | 18 (1.7%) | 16 (1.7%) |
| 35 to 64 Years | 100 (3.9%) | 148 (5.4%) |
| 65 to 74 Years | 33 (3.8%) | 50 (6.3%) |
| 75 Years and over | 45 (9.8%) | 71 (14.3%) |
Disability Class: Ambulatory Difficulty
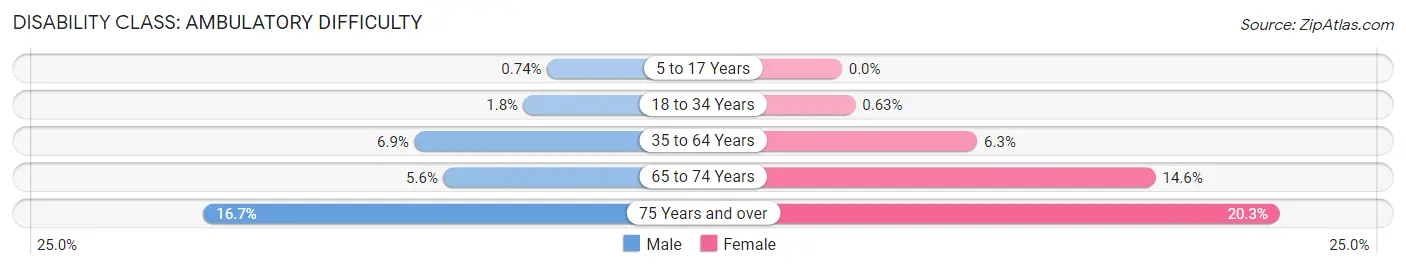
| Age Bracket | Male | Female |
| 5 to 17 Years | 6 (0.7%) | 0 (0.0%) |
| 18 to 34 Years | 19 (1.8%) | 6 (0.6%) |
| 35 to 64 Years | 177 (6.9%) | 172 (6.3%) |
| 65 to 74 Years | 48 (5.6%) | 115 (14.6%) |
| 75 Years and over | 77 (16.7%) | 101 (20.3%) |
Disability Class: Self-Care Difficulty
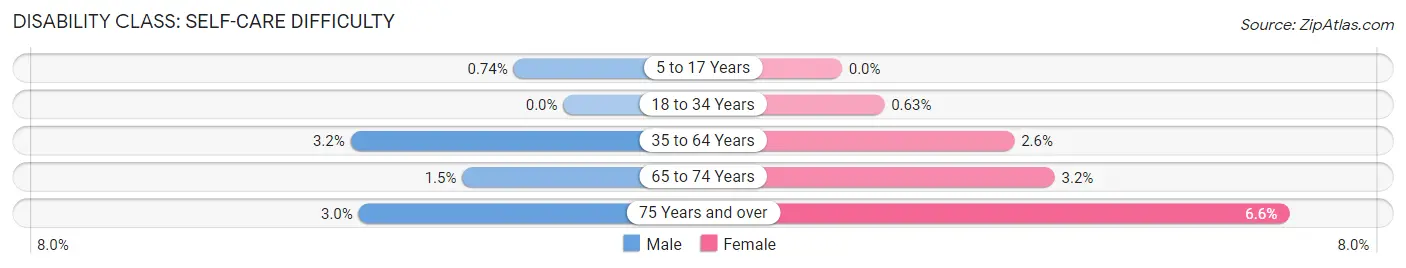
| Age Bracket | Male | Female |
| 5 to 17 Years | 6 (0.7%) | 0 (0.0%) |
| 18 to 34 Years | 0 (0.0%) | 6 (0.6%) |
| 35 to 64 Years | 81 (3.2%) | 70 (2.6%) |
| 65 to 74 Years | 13 (1.5%) | 25 (3.2%) |
| 75 Years and over | 14 (3.0%) | 33 (6.6%) |
Technology Access in Skamania County
Computing Device Access in Skamania County
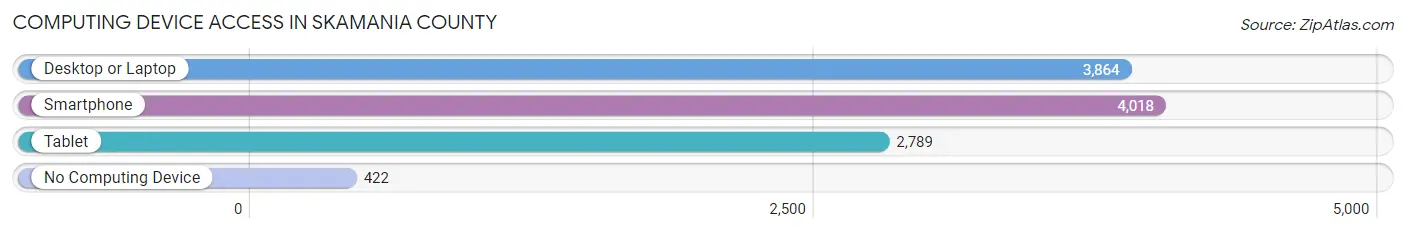
| Device Type | # Households | % Households |
| Desktop or Laptop | 3,864 | 80.3% |
| Smartphone | 4,018 | 83.5% |
| Tablet | 2,789 | 58.0% |
| No Computing Device | 422 | 8.8% |
| Total | 4,812 | 100.0% |
Internet Access in Skamania County
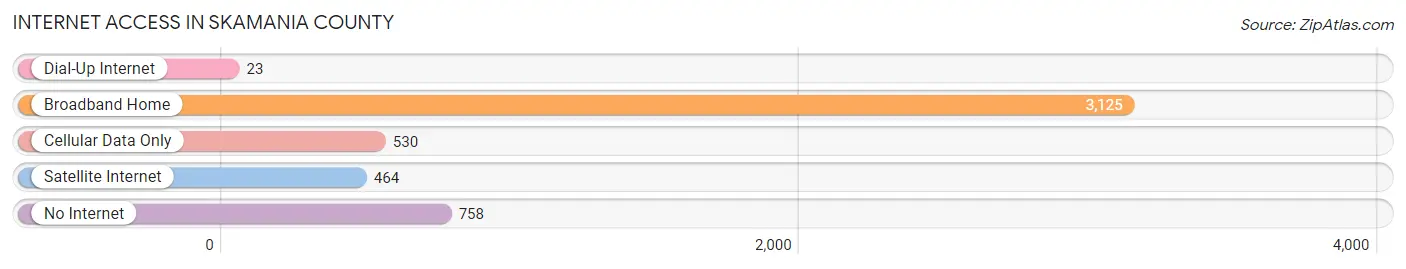
| Internet Type | # Households | % Households |
| Dial-Up Internet | 23 | 0.5% |
| Broadband Home | 3,125 | 64.9% |
| Cellular Data Only | 530 | 11.0% |
| Satellite Internet | 464 | 9.6% |
| No Internet | 758 | 15.8% |
| Total | 4,812 | 100.0% |
Skamania County Summary
Skamania County is located in the southwestern corner of Washington State, and is bordered by the Columbia River to the north, the Cascade Mountains to the east, and the Pacific Ocean to the west. The county is home to a population of approximately 11,000 people, and is known for its natural beauty and outdoor recreation opportunities.
History
Skamania County was established in 1854, and was named after the Native American tribe of the same name. The county was originally part of Clark County, but was split off in 1854. The county was originally home to the Klickitat, Yakama, and Chinook tribes, who lived in the area for thousands of years before the arrival of European settlers.
The first European settlers arrived in the area in the early 1800s, and the county was officially established in 1854. The county was primarily used for logging and farming, and the population grew steadily throughout the 19th century. In the early 20th century, the county began to develop as a tourist destination, and the population began to grow rapidly.
Geography
Skamania County is located in the southwestern corner of Washington State, and is bordered by the Columbia River to the north, the Cascade Mountains to the east, and the Pacific Ocean to the west. The county covers an area of 1,788 square miles, and is home to a variety of landscapes, including forests, mountains, rivers, and lakes. The highest point in the county is Mount Adams, which stands at 12,276 feet.
The county is home to several state parks, including Beacon Rock State Park, Columbia Hills State Park, and Gifford Pinchot National Forest. The county is also home to several rivers, including the Columbia, White Salmon, and Klickitat Rivers.
Economy
Skamania County’s economy is largely based on tourism, forestry, and agriculture. The county is home to several tourist attractions, including the Columbia Gorge National Scenic Area, Mount St. Helens National Volcanic Monument, and the Gifford Pinchot National Forest. The county is also home to several wineries, breweries, and distilleries.
The county’s forestry industry is centered around the production of lumber, and the county is home to several sawmills and wood-processing plants. The county’s agricultural industry is centered around the production of apples, pears, and other fruits and vegetables.
Demographics
As of the 2010 census, Skamania County had a population of 11,066 people. The population is spread out across the county, with the largest population centers being Stevenson, Carson, and North Bonneville. The county is predominantly white, with the largest racial group being non-Hispanic whites, who make up 87.3% of the population. The county is also home to a small Hispanic population, which makes up 4.3% of the population.
The median household income in Skamania County is $50,845, and the median home value is $219,400. The county’s unemployment rate is 5.2%, which is slightly lower than the national average. The county’s poverty rate is 11.2%, which is slightly higher than the national average.
Common Questions
What is Per Capita Income in Skamania County?
Per Capita income in Skamania County is $42,162.
What is the Median Family Income in Skamania County?
Median Family Income in Skamania County is $100,199.
What is the Median Household income in Skamania County?
Median Household Income in Skamania County is $84,500.
What is Income or Wage Gap in Skamania County?
Income or Wage Gap in Skamania County is 36.7%.
Women in Skamania County earn 63.3 cents for every dollar earned by a man.
What is Inequality or Gini Index in Skamania County?
Inequality or Gini Index in Skamania County is 0.44.
What is the Total Population of Skamania County?
Total Population of Skamania County is 12,118.
What is the Total Male Population of Skamania County?
Total Male Population of Skamania County is 5,996.
What is the Total Female Population of Skamania County?
Total Female Population of Skamania County is 6,122.
What is the Ratio of Males per 100 Females in Skamania County?
There are 97.94 Males per 100 Females in Skamania County.
What is the Ratio of Females per 100 Males in Skamania County?
There are 102.10 Females per 100 Males in Skamania County.
What is the Median Population Age in Skamania County?
Median Population Age in Skamania County is 46.6 Years.
What is the Average Family Size in Skamania County
Average Family Size in Skamania County is 3.0 People.
What is the Average Household Size in Skamania County
Average Household Size in Skamania County is 2.5 People.
How Large is the Labor Force in Skamania County?
There are 5,952 People in the Labor Forcein in Skamania County.
What is the Percentage of People in the Labor Force in Skamania County?
58.4% of People are in the Labor Force in Skamania County.
What is the Unemployment Rate in Skamania County?
Unemployment Rate in Skamania County is 5.2%.