San Juan County, WA Map & Demographics
San Juan County Map
San Juan County Overview
$59,650
PER CAPITA INCOME
$98,569
AVG FAMILY INCOME
$76,745
AVG HOUSEHOLD INCOME
40.0%
WAGE / INCOME GAP [ % ]
60.0¢/ $1
WAGE / INCOME GAP [ $ ]
$11,933
FAMILY INCOME DEFICIT
0.54
INEQUALITY / GINI INDEX
18,001
TOTAL POPULATION
8,850
MALE POPULATION
9,151
FEMALE POPULATION
96.71
MALES / 100 FEMALES
103.40
FEMALES / 100 MALES
56.5
MEDIAN AGE
2.5
AVG FAMILY SIZE
2.1
AVG HOUSEHOLD SIZE
8,520
LABOR FORCE [ PEOPLE ]
53.2%
PERCENT IN LABOR FORCE
3.2%
UNEMPLOYMENT RATE
San Juan County Area Codes
Income in San Juan County
Income Overview in San Juan County
Per Capita Income in San Juan County is $59,650, while median incomes of families and households are $98,569 and $76,745 respectively.
| Characteristic | Number | Measure |
| Per Capita Income | 18,001 | $59,650 |
| Median Family Income | 5,333 | $98,569 |
| Mean Family Income | 5,333 | $149,343 |
| Median Household Income | 8,654 | $76,745 |
| Mean Household Income | 8,654 | $123,128 |
| Income Deficit | 5,333 | $11,933 |
| Wage / Income Gap (%) | 18,001 | 40.00% |
| Wage / Income Gap ($) | 18,001 | 60.00¢ per $1 |
| Gini / Inequality Index | 18,001 | 0.54 |
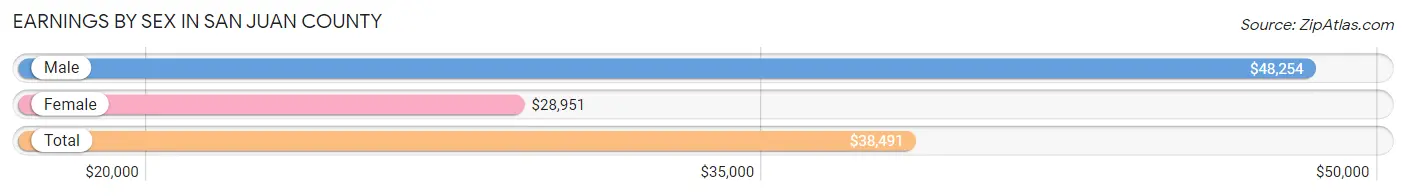
Earnings by Sex in San Juan County
Average Earnings in San Juan County are $38,491, $48,254 for men and $28,951 for women, a difference of 40.0%.
| Sex | Number | Average Earnings |
| Male | 4,884 (52.3%) | $48,254 |
| Female | 4,448 (47.7%) | $28,951 |
| Total | 9,332 (100.0%) | $38,491 |
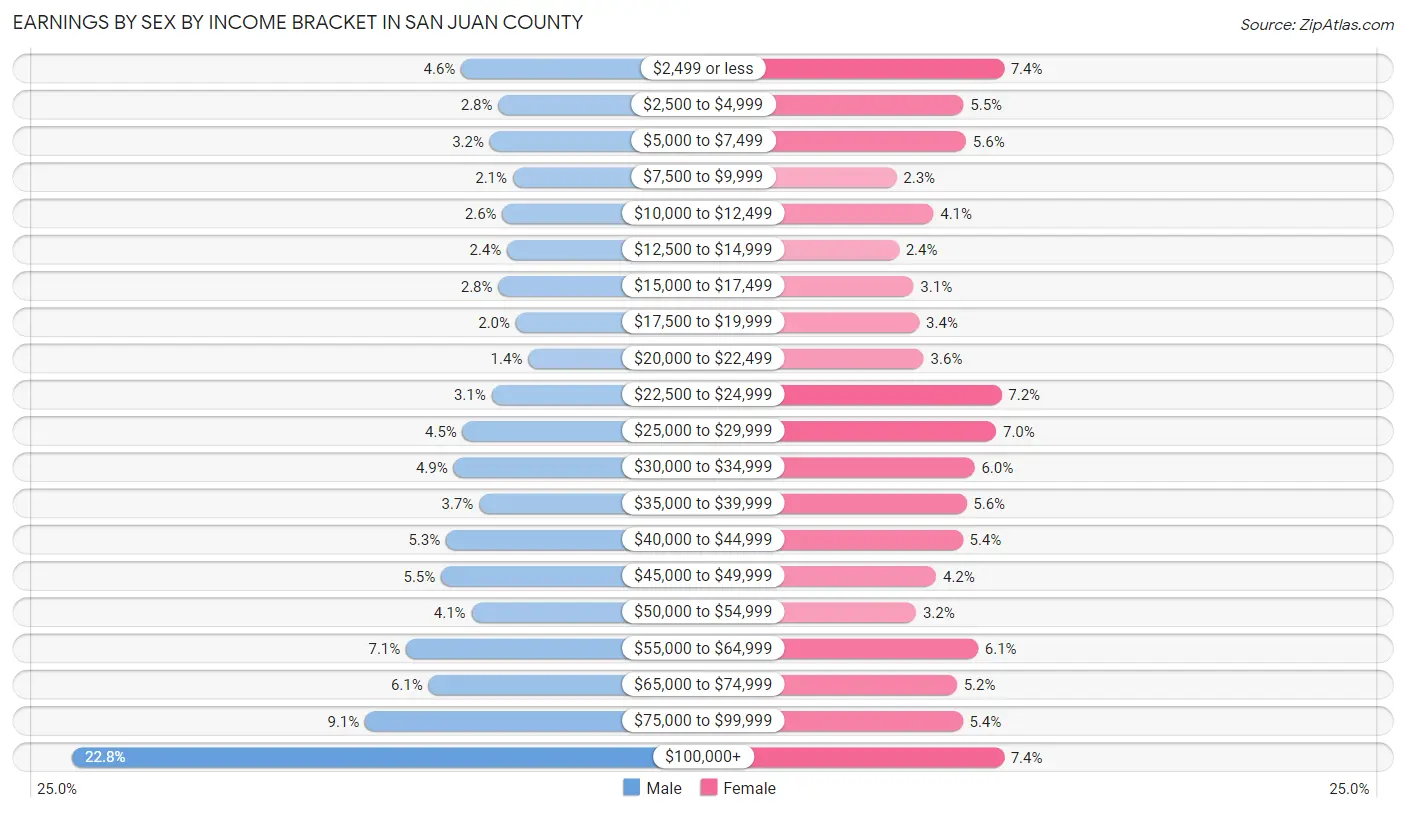
Earnings by Sex by Income Bracket in San Juan County
The most common earnings brackets in San Juan County are $100,000+ for men (1,112 | 22.8%) and $2,499 or less for women (327 | 7.3%).
| Income | Male | Female |
| $2,499 or less | 222 (4.5%) | 327 (7.3%) |
| $2,500 to $4,999 | 137 (2.8%) | 243 (5.5%) |
| $5,000 to $7,499 | 157 (3.2%) | 248 (5.6%) |
| $7,500 to $9,999 | 104 (2.1%) | 103 (2.3%) |
| $10,000 to $12,499 | 128 (2.6%) | 180 (4.1%) |
| $12,500 to $14,999 | 117 (2.4%) | 108 (2.4%) |
| $15,000 to $17,499 | 137 (2.8%) | 139 (3.1%) |
| $17,500 to $19,999 | 97 (2.0%) | 151 (3.4%) |
| $20,000 to $22,499 | 69 (1.4%) | 160 (3.6%) |
| $22,500 to $24,999 | 153 (3.1%) | 322 (7.2%) |
| $25,000 to $29,999 | 219 (4.5%) | 311 (7.0%) |
| $30,000 to $34,999 | 240 (4.9%) | 266 (6.0%) |
| $35,000 to $39,999 | 181 (3.7%) | 249 (5.6%) |
| $40,000 to $44,999 | 257 (5.3%) | 241 (5.4%) |
| $45,000 to $49,999 | 268 (5.5%) | 186 (4.2%) |
| $50,000 to $54,999 | 199 (4.1%) | 144 (3.2%) |
| $55,000 to $64,999 | 348 (7.1%) | 273 (6.1%) |
| $65,000 to $74,999 | 297 (6.1%) | 229 (5.1%) |
| $75,000 to $99,999 | 442 (9.0%) | 241 (5.4%) |
| $100,000+ | 1,112 (22.8%) | 327 (7.3%) |
| Total | 4,884 (100.0%) | 4,448 (100.0%) |
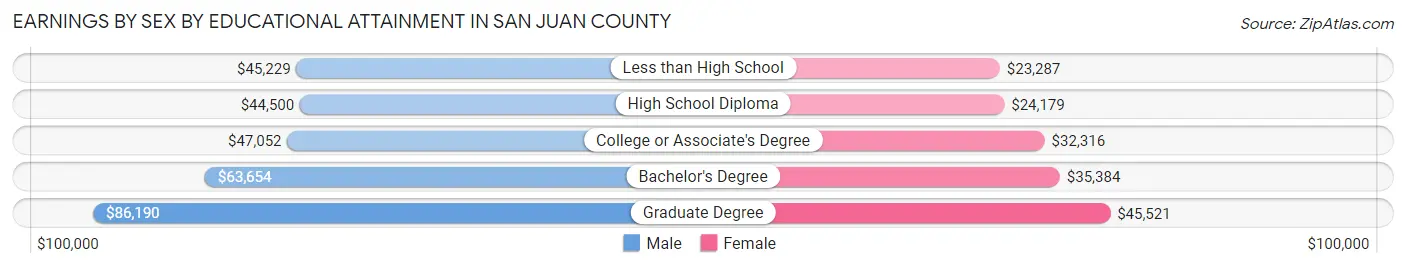
Earnings by Sex by Educational Attainment in San Juan County
Average earnings in San Juan County are $54,425 for men and $32,702 for women, a difference of 39.9%. Men with an educational attainment of graduate degree enjoy the highest average annual earnings of $86,190, while those with high school diploma education earn the least with $44,500. Women with an educational attainment of graduate degree earn the most with the average annual earnings of $45,521, while those with less than high school education have the smallest earnings of $23,287.
| Educational Attainment | Male Income | Female Income |
| Less than High School | $45,229 | $23,287 |
| High School Diploma | $44,500 | $24,179 |
| College or Associate's Degree | $47,052 | $32,316 |
| Bachelor's Degree | $63,654 | $35,384 |
| Graduate Degree | $86,190 | $45,521 |
| Total | $54,425 | $32,702 |
Family Income in San Juan County
Family Income Brackets in San Juan County
According to the San Juan County family income data, there are 1,056 families falling into the $100,000 to $149,999 income range, which is the most common income bracket and makes up 19.8% of all families. Conversely, the $10,000 to $14,999 income bracket is the least frequent group with only 107 families (2.0%) belonging to this category.
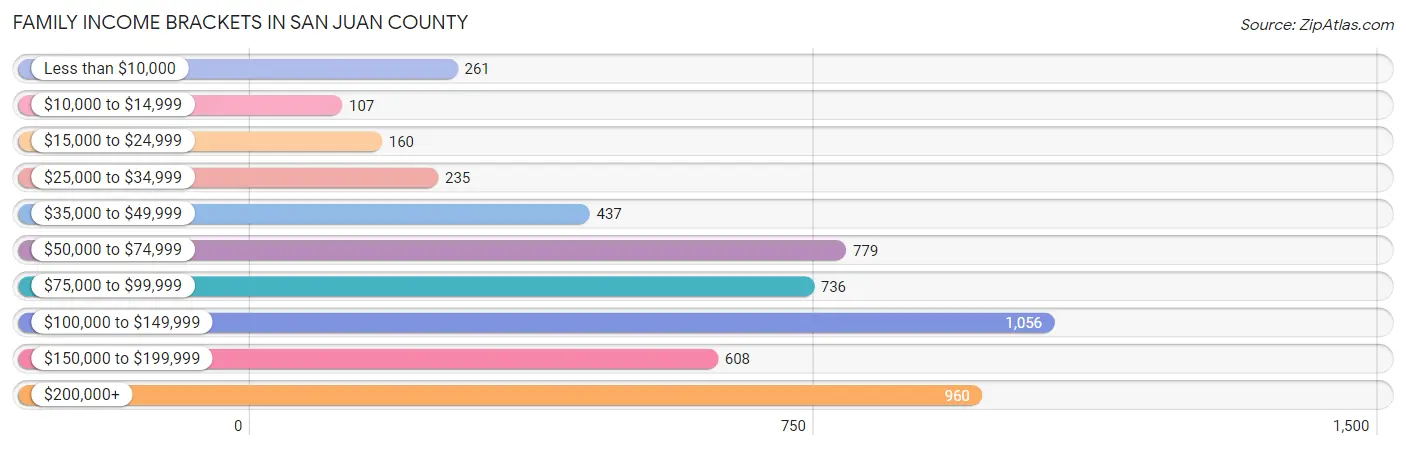
| Income Bracket | # Families | % Families |
| Less than $10,000 | 261 | 4.9% |
| $10,000 to $14,999 | 107 | 2.0% |
| $15,000 to $24,999 | 160 | 3.0% |
| $25,000 to $34,999 | 235 | 4.4% |
| $35,000 to $49,999 | 437 | 8.2% |
| $50,000 to $74,999 | 779 | 14.6% |
| $75,000 to $99,999 | 736 | 13.8% |
| $100,000 to $149,999 | 1,056 | 19.8% |
| $150,000 to $199,999 | 608 | 11.4% |
| $200,000+ | 960 | 18.0% |
Family Income by Famaliy Size in San Juan County
6-person families (100 | 1.9%) account for the highest median family income in San Juan County with $150,000 per family, while 2-person families (3,732 | 70.0%) have the highest median income of $46,546 per family member.
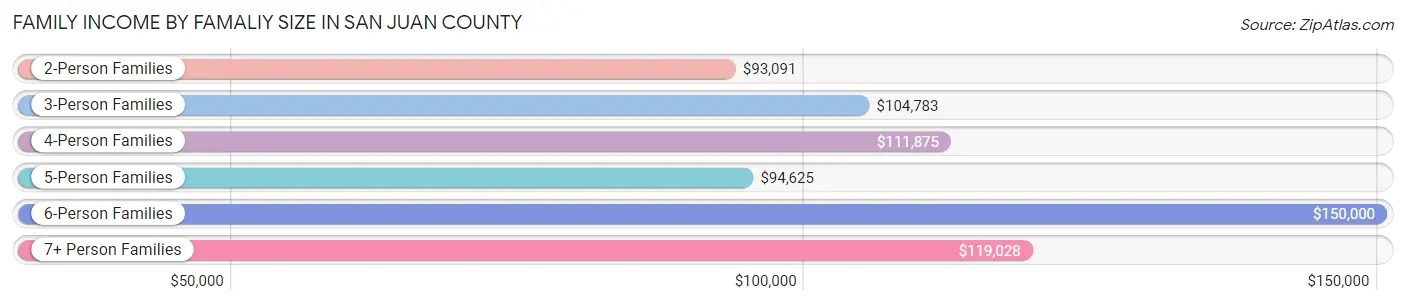
| Income Bracket | # Families | Median Income |
| 2-Person Families | 3,732 (70.0%) | $93,091 |
| 3-Person Families | 774 (14.5%) | $104,783 |
| 4-Person Families | 499 (9.4%) | $111,875 |
| 5-Person Families | 187 (3.5%) | $94,625 |
| 6-Person Families | 100 (1.9%) | $150,000 |
| 7+ Person Families | 41 (0.8%) | $119,028 |
| Total | 5,333 (100.0%) | $98,569 |
Family Income by Number of Earners in San Juan County
The median family income in San Juan County is $98,569, with families comprising 3+ earners (355) having the highest median family income of $139,531, while families with no earners (1,484) have the lowest median family income of $76,912, accounting for 6.7% and 27.8% of families, respectively.
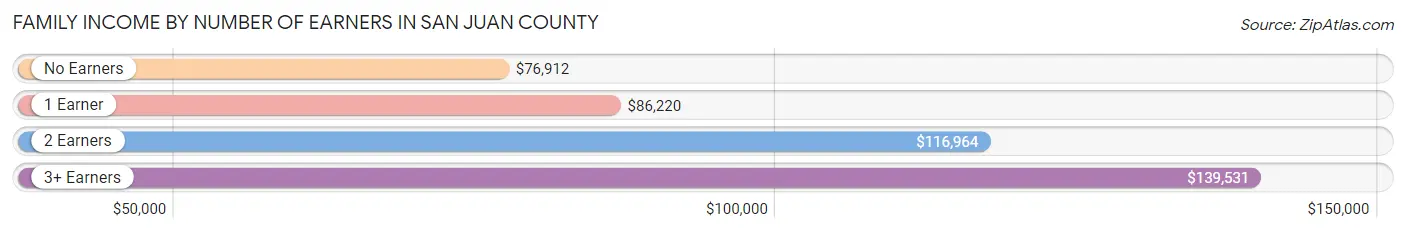
| Number of Earners | # Families | Median Income |
| No Earners | 1,484 (27.8%) | $76,912 |
| 1 Earner | 1,619 (30.4%) | $86,220 |
| 2 Earners | 1,875 (35.2%) | $116,964 |
| 3+ Earners | 355 (6.7%) | $139,531 |
| Total | 5,333 (100.0%) | $98,569 |
Household Income in San Juan County
Household Income Brackets in San Juan County
With 1,445 households falling in the category, the $50,000 to $74,999 income range is the most frequent in San Juan County, accounting for 16.7% of all households. In contrast, only 277 households (3.2%) fall into the $10,000 to $14,999 income bracket, making it the least populous group.
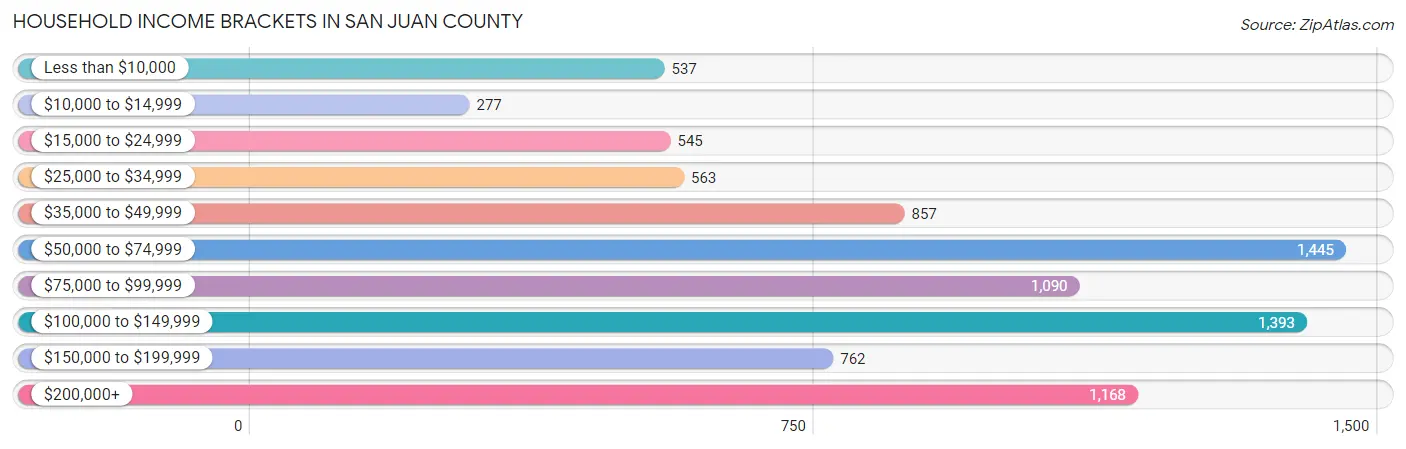
| Income Bracket | # Households | % Households |
| Less than $10,000 | 537 | 6.2% |
| $10,000 to $14,999 | 277 | 3.2% |
| $15,000 to $24,999 | 545 | 6.3% |
| $25,000 to $34,999 | 563 | 6.5% |
| $35,000 to $49,999 | 857 | 9.9% |
| $50,000 to $74,999 | 1,445 | 16.7% |
| $75,000 to $99,999 | 1,090 | 12.6% |
| $100,000 to $149,999 | 1,393 | 16.1% |
| $150,000 to $199,999 | 762 | 8.8% |
| $200,000+ | 1,168 | 13.5% |
Household Income by Householder Age in San Juan County
The median household income in San Juan County is $76,745, with the highest median household income of $89,055 found in the 45 to 64 years age bracket for the primary householder. A total of 3,021 households (34.9%) fall into this category. Meanwhile, the 15 to 24 years age bracket for the primary householder has the lowest median household income of $0, with 130 households (1.5%) in this group.
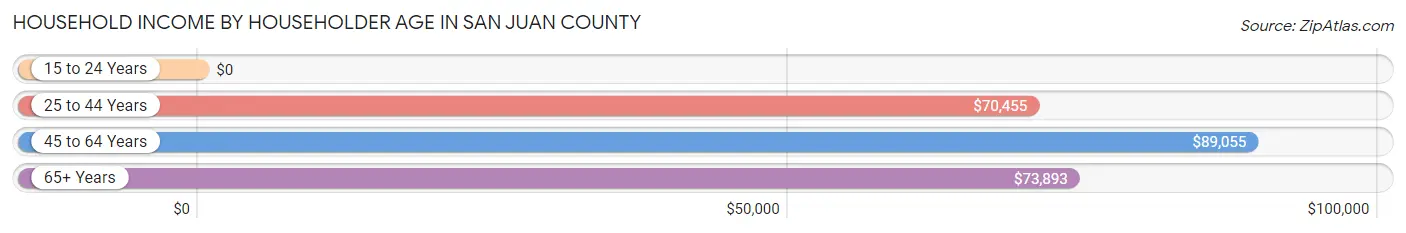
| Income Bracket | # Households | Median Income |
| 15 to 24 Years | 130 (1.5%) | $0 |
| 25 to 44 Years | 1,636 (18.9%) | $70,455 |
| 45 to 64 Years | 3,021 (34.9%) | $89,055 |
| 65+ Years | 3,867 (44.7%) | $73,893 |
| Total | 8,654 (100.0%) | $76,745 |
Poverty in San Juan County
Income Below Poverty by Sex and Age in San Juan County
With 9.2% poverty level for males and 12.7% for females among the residents of San Juan County, under 5 year old males and 5 year old females are the most vulnerable to poverty, with 50 males (21.5%) and 9 females (29.0%) in their respective age groups living below the poverty level.
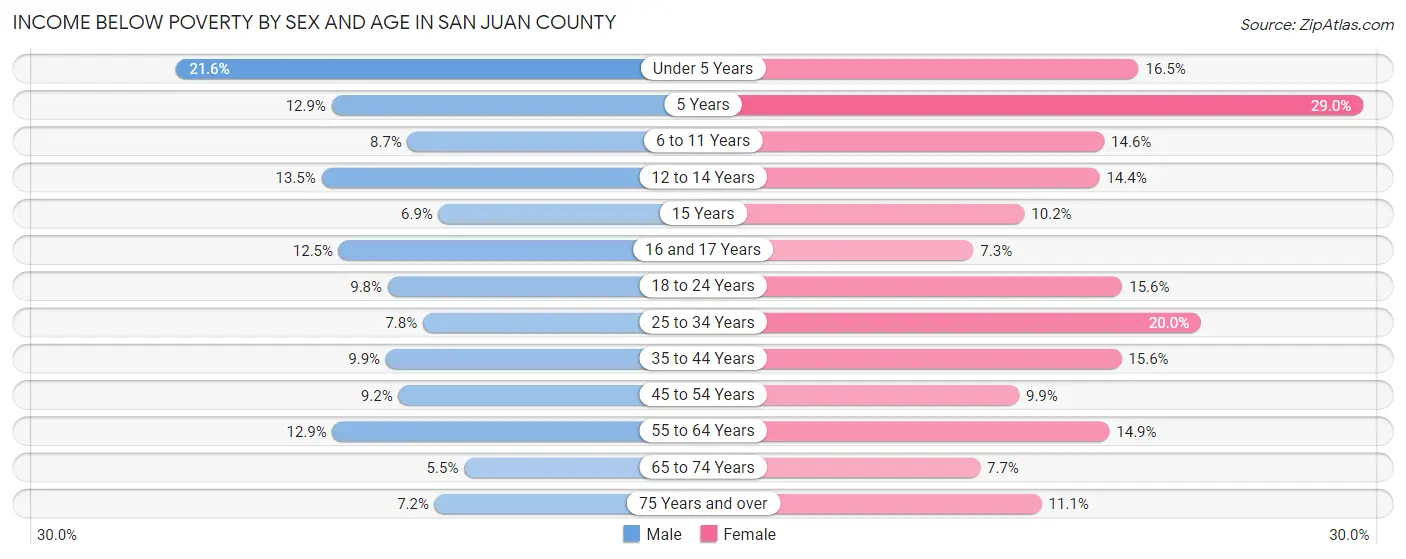
| Age Bracket | Male | Female |
| Under 5 Years | 50 (21.5%) | 41 (16.5%) |
| 5 Years | 8 (12.9%) | 9 (29.0%) |
| 6 to 11 Years | 32 (8.7%) | 58 (14.6%) |
| 12 to 14 Years | 28 (13.5%) | 30 (14.3%) |
| 15 Years | 5 (6.9%) | 6 (10.2%) |
| 16 and 17 Years | 19 (12.5%) | 11 (7.3%) |
| 18 to 24 Years | 42 (9.8%) | 62 (15.6%) |
| 25 to 34 Years | 57 (7.8%) | 149 (20.0%) |
| 35 to 44 Years | 91 (9.9%) | 152 (15.6%) |
| 45 to 54 Years | 96 (9.2%) | 97 (9.9%) |
| 55 to 64 Years | 193 (12.9%) | 251 (14.9%) |
| 65 to 74 Years | 104 (5.5%) | 155 (7.7%) |
| 75 Years and over | 82 (7.2%) | 126 (11.1%) |
| Total | 807 (9.2%) | 1,147 (12.7%) |
Income Above Poverty by Sex and Age in San Juan County
According to the poverty statistics in San Juan County, males aged 65 to 74 years and females aged 16 and 17 years are the age groups that are most secure financially, with 94.5% of males and 92.7% of females in these age groups living above the poverty line.
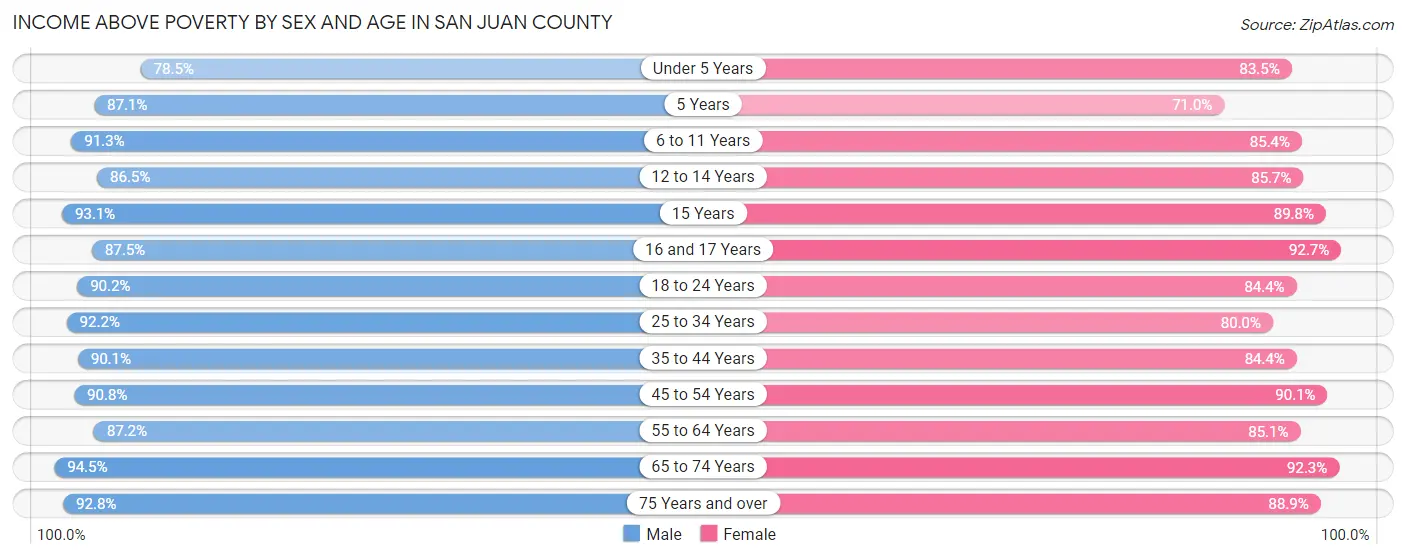
| Age Bracket | Male | Female |
| Under 5 Years | 182 (78.4%) | 207 (83.5%) |
| 5 Years | 54 (87.1%) | 22 (71.0%) |
| 6 to 11 Years | 337 (91.3%) | 339 (85.4%) |
| 12 to 14 Years | 180 (86.5%) | 179 (85.7%) |
| 15 Years | 67 (93.1%) | 53 (89.8%) |
| 16 and 17 Years | 133 (87.5%) | 139 (92.7%) |
| 18 to 24 Years | 388 (90.2%) | 335 (84.4%) |
| 25 to 34 Years | 673 (92.2%) | 596 (80.0%) |
| 35 to 44 Years | 830 (90.1%) | 824 (84.4%) |
| 45 to 54 Years | 950 (90.8%) | 886 (90.1%) |
| 55 to 64 Years | 1,309 (87.2%) | 1,434 (85.1%) |
| 65 to 74 Years | 1,780 (94.5%) | 1,857 (92.3%) |
| 75 Years and over | 1,064 (92.8%) | 1,006 (88.9%) |
| Total | 7,947 (90.8%) | 7,877 (87.3%) |
Income Below Poverty Among Married-Couple Families in San Juan County
The poverty statistics for married-couple families in San Juan County show that 4.5% or 205 of the total 4,507 families live below the poverty line. Families with no children have the highest poverty rate of 5.4%, comprising of 190 families. On the other hand, families with 1 or 2 children have the lowest poverty rate of 1.3%, which includes 10 families.
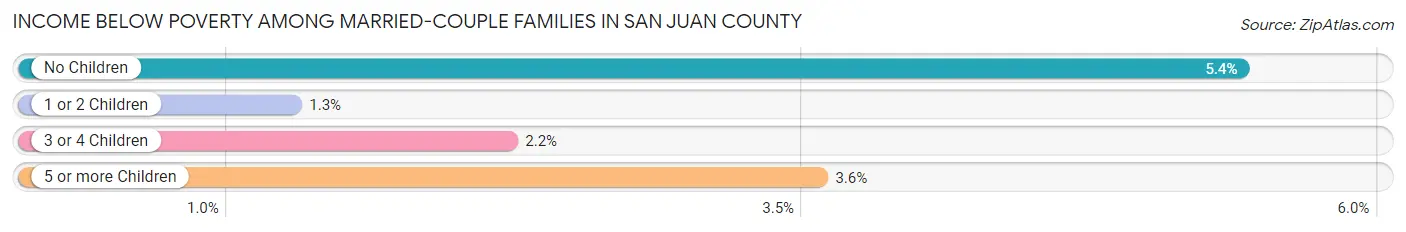
| Children | Above Poverty | Below Poverty |
| No Children | 3,328 (94.6%) | 190 (5.4%) |
| 1 or 2 Children | 771 (98.7%) | 10 (1.3%) |
| 3 or 4 Children | 176 (97.8%) | 4 (2.2%) |
| 5 or more Children | 27 (96.4%) | 1 (3.6%) |
| Total | 4,302 (95.5%) | 205 (4.5%) |
Income Below Poverty Among Single-Parent Households in San Juan County
According to the poverty data in San Juan County, 19.3% or 46 single-father households and 36.6% or 215 single-mother households are living below the poverty line. Among single-father households, those with 1 or 2 children have the highest poverty rate, with 46 households (35.1%) experiencing poverty. Likewise, among single-mother households, those with 5 or more children have the highest poverty rate, with 8 households (100.0%) falling below the poverty line.
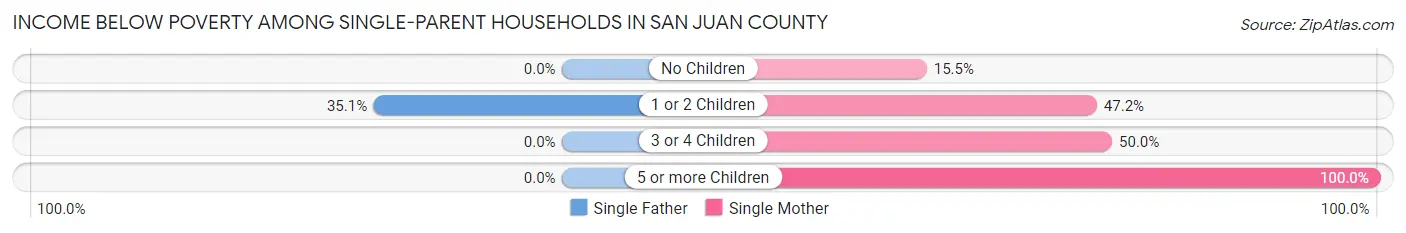
| Children | Single Father | Single Mother |
| No Children | 0 (0.0%) | 33 (15.5%) |
| 1 or 2 Children | 46 (35.1%) | 150 (47.2%) |
| 3 or 4 Children | 0 (0.0%) | 24 (50.0%) |
| 5 or more Children | 0 (0.0%) | 8 (100.0%) |
| Total | 46 (19.3%) | 215 (36.6%) |
Income Below Poverty Among Married-Couple vs Single-Parent Households in San Juan County
The poverty data for San Juan County shows that 205 of the married-couple family households (4.5%) and 261 of the single-parent households (31.6%) are living below the poverty level. Within the married-couple family households, those with no children have the highest poverty rate, with 190 households (5.4%) falling below the poverty line. Among the single-parent households, those with 5 or more children have the highest poverty rate, with 8 household (100.0%) living below poverty.
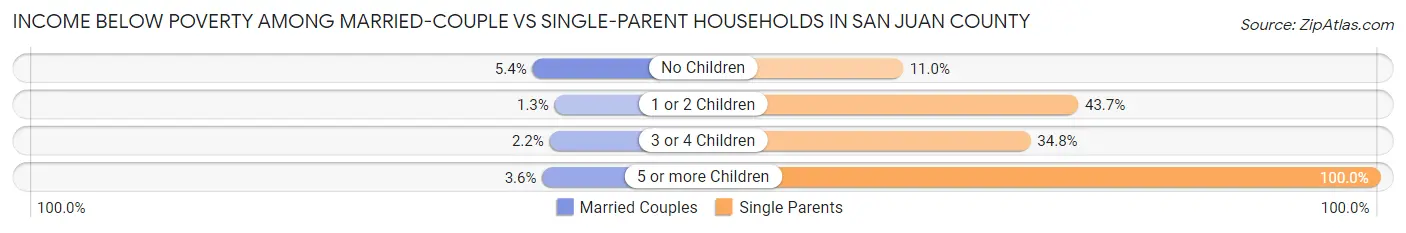
| Children | Married-Couple Families | Single-Parent Households |
| No Children | 190 (5.4%) | 33 (11.0%) |
| 1 or 2 Children | 10 (1.3%) | 196 (43.6%) |
| 3 or 4 Children | 4 (2.2%) | 24 (34.8%) |
| 5 or more Children | 1 (3.6%) | 8 (100.0%) |
| Total | 205 (4.5%) | 261 (31.6%) |
Race in San Juan County
The most populous races in San Juan County are White / Caucasian (16,115 | 89.5%), Hispanic or Latino (1,230 | 6.8%), and Two or more Races (911 | 5.1%).
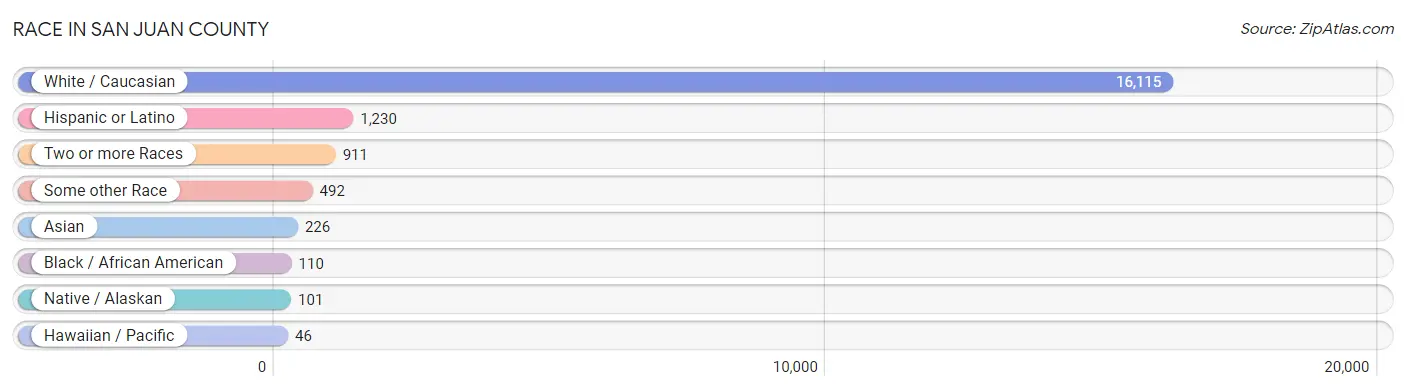
| Race | # Population | % Population |
| Asian | 226 | 1.3% |
| Black / African American | 110 | 0.6% |
| Hawaiian / Pacific | 46 | 0.3% |
| Hispanic or Latino | 1,230 | 6.8% |
| Native / Alaskan | 101 | 0.6% |
| White / Caucasian | 16,115 | 89.5% |
| Two or more Races | 911 | 5.1% |
| Some other Race | 492 | 2.7% |
| Total | 18,001 | 100.0% |
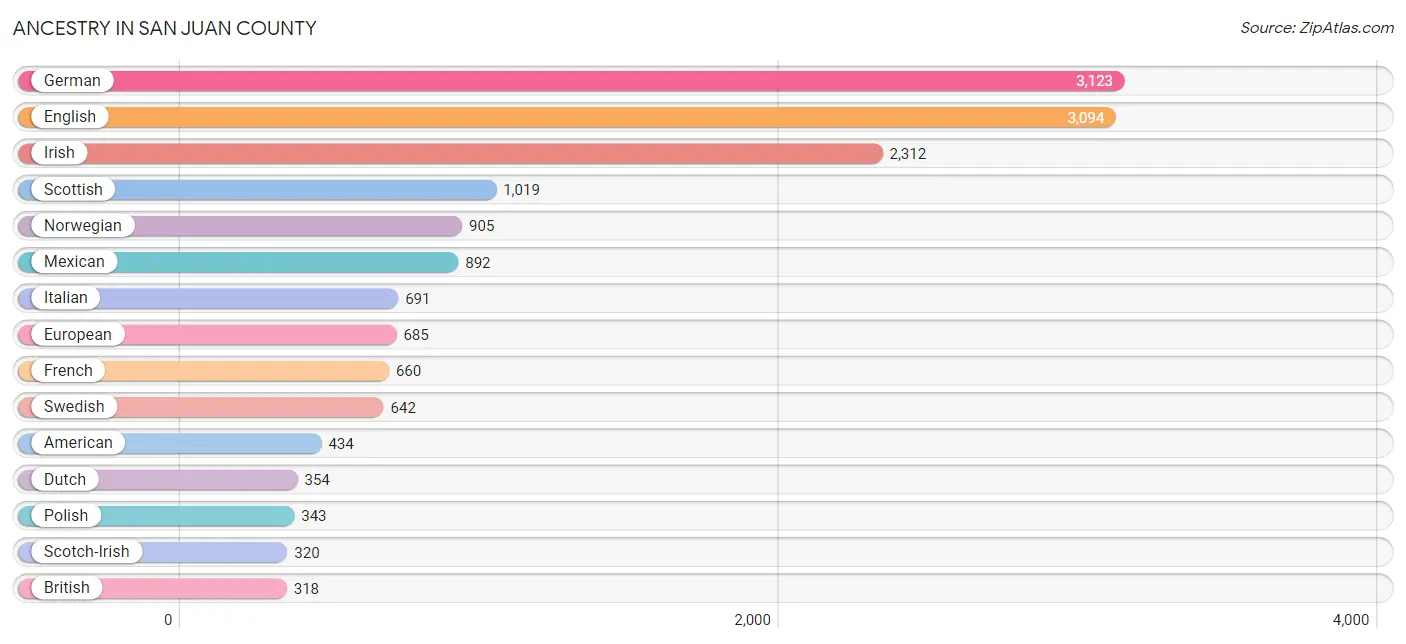
Ancestry in San Juan County
The most populous ancestries reported in San Juan County are German (3,123 | 17.3%), English (3,094 | 17.2%), Irish (2,312 | 12.8%), Scottish (1,019 | 5.7%), and Norwegian (905 | 5.0%), together accounting for 58.1% of all San Juan County residents.
| Ancestry | # Population | % Population |
| African | 18 | 0.1% |
| Alaska Native | 7 | 0.0% |
| Alaskan Athabascan | 7 | 0.0% |
| Aleut | 20 | 0.1% |
| American | 434 | 2.4% |
| Apache | 1 | 0.0% |
| Arab | 78 | 0.4% |
| Argentinean | 5 | 0.0% |
| Armenian | 16 | 0.1% |
| Assyrian / Chaldean / Syriac | 3 | 0.0% |
| Australian | 72 | 0.4% |
| Austrian | 52 | 0.3% |
| Basque | 10 | 0.1% |
| Belgian | 39 | 0.2% |
| Bhutanese | 65 | 0.4% |
| Blackfeet | 12 | 0.1% |
| British | 318 | 1.8% |
| Bulgarian | 3 | 0.0% |
| Burmese | 68 | 0.4% |
| Canadian | 104 | 0.6% |
| Celtic | 12 | 0.1% |
| Central American | 12 | 0.1% |
| Central American Indian | 2 | 0.0% |
| Cherokee | 60 | 0.3% |
| Cheyenne | 5 | 0.0% |
| Chickasaw | 2 | 0.0% |
| Chilean | 23 | 0.1% |
| Chippewa | 6 | 0.0% |
| Colombian | 8 | 0.0% |
| Colville | 1 | 0.0% |
| Croatian | 48 | 0.3% |
| Cuban | 24 | 0.1% |
| Czech | 143 | 0.8% |
| Czechoslovakian | 18 | 0.1% |
| Danish | 215 | 1.2% |
| Dutch | 354 | 2.0% |
| Eastern European | 71 | 0.4% |
| Ecuadorian | 8 | 0.0% |
| Egyptian | 6 | 0.0% |
| English | 3,094 | 17.2% |
| Estonian | 2 | 0.0% |
| Ethiopian | 8 | 0.0% |
| European | 685 | 3.8% |
| Filipino | 5 | 0.0% |
| Finnish | 137 | 0.8% |
| French | 660 | 3.7% |
| French Canadian | 69 | 0.4% |
| German | 3,123 | 17.3% |
| German Russian | 7 | 0.0% |
| Greek | 52 | 0.3% |
| Guamanian / Chamorro | 6 | 0.0% |
| Honduran | 1 | 0.0% |
| Hopi | 5 | 0.0% |
| Hungarian | 68 | 0.4% |
| Icelander | 16 | 0.1% |
| Indian (Asian) | 134 | 0.7% |
| Iranian | 7 | 0.0% |
| Iraqi | 7 | 0.0% |
| Irish | 2,312 | 12.8% |
| Israeli | 2 | 0.0% |
| Italian | 691 | 3.8% |
| Jamaican | 19 | 0.1% |
| Japanese | 5 | 0.0% |
| Kenyan | 3 | 0.0% |
| Korean | 88 | 0.5% |
| Laotian | 23 | 0.1% |
| Latvian | 18 | 0.1% |
| Lebanese | 60 | 0.3% |
| Lithuanian | 97 | 0.5% |
| Luxembourger | 4 | 0.0% |
| Maltese | 1 | 0.0% |
| Mexican | 892 | 5.0% |
| Mexican American Indian | 5 | 0.0% |
| Native Hawaiian | 25 | 0.1% |
| Navajo | 9 | 0.1% |
| New Zealander | 3 | 0.0% |
| Nicaraguan | 6 | 0.0% |
| Northern European | 301 | 1.7% |
| Norwegian | 905 | 5.0% |
| Osage | 4 | 0.0% |
| Pakistani | 11 | 0.1% |
| Pennsylvania German | 7 | 0.0% |
| Polish | 343 | 1.9% |
| Portuguese | 56 | 0.3% |
| Potawatomi | 2 | 0.0% |
| Puerto Rican | 14 | 0.1% |
| Puget Sound Salish | 23 | 0.1% |
| Romanian | 1 | 0.0% |
| Russian | 143 | 0.8% |
| Salvadoran | 5 | 0.0% |
| Samoan | 17 | 0.1% |
| Scandinavian | 204 | 1.1% |
| Scotch-Irish | 320 | 1.8% |
| Scottish | 1,019 | 5.7% |
| Serbian | 45 | 0.3% |
| Sioux | 15 | 0.1% |
| Slavic | 2 | 0.0% |
| Slovak | 21 | 0.1% |
| Slovene | 11 | 0.1% |
| South African | 3 | 0.0% |
| South American | 68 | 0.4% |
| Spaniard | 20 | 0.1% |
| Spanish | 68 | 0.4% |
| Sri Lankan | 8 | 0.0% |
| Subsaharan African | 38 | 0.2% |
| Swedish | 642 | 3.6% |
| Swiss | 144 | 0.8% |
| Syrian | 3 | 0.0% |
| Thai | 2 | 0.0% |
| Tlingit-Haida | 24 | 0.1% |
| Turkish | 5 | 0.0% |
| Ugandan | 5 | 0.0% |
| Ukrainian | 102 | 0.6% |
| Welsh | 260 | 1.4% |
| Yugoslavian | 32 | 0.2% | View All 115 Rows |
Immigrants in San Juan County
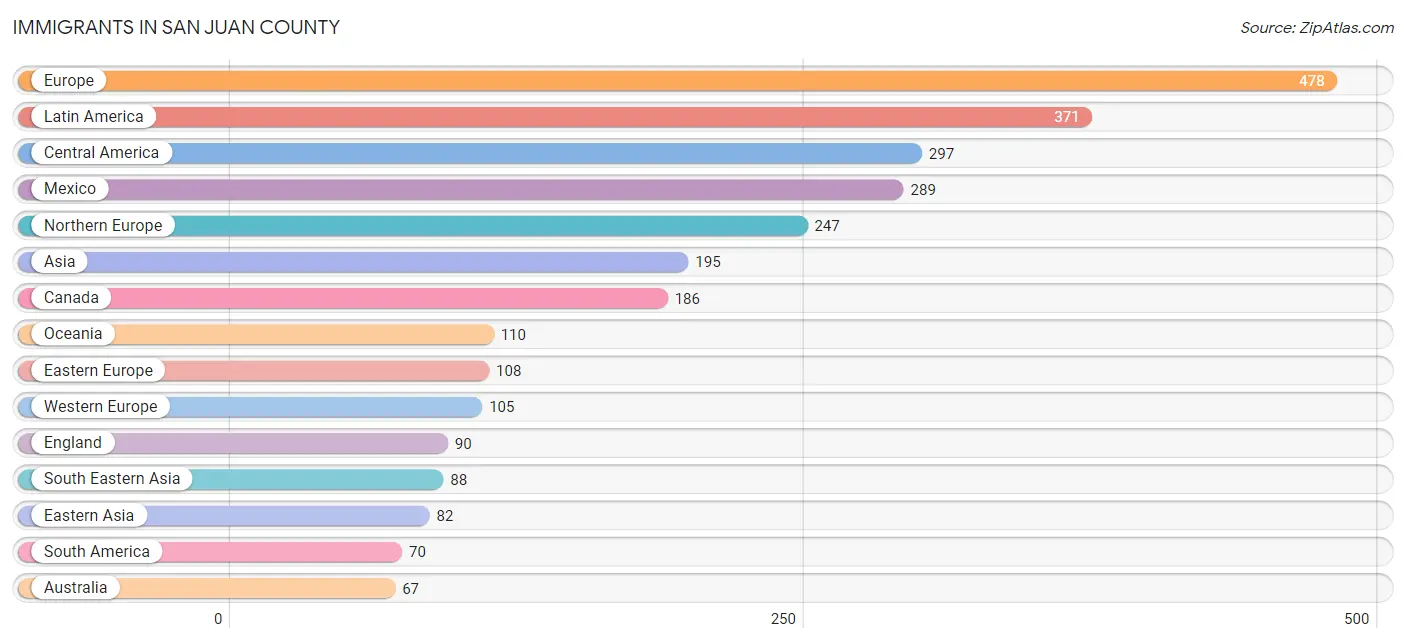
The most numerous immigrant groups reported in San Juan County came from Europe (478 | 2.7%), Latin America (371 | 2.1%), Central America (297 | 1.7%), Mexico (289 | 1.6%), and Northern Europe (247 | 1.4%), together accounting for 9.4% of all San Juan County residents.
| Immigration Origin | # Population | % Population |
| Africa | 32 | 0.2% |
| Argentina | 4 | 0.0% |
| Asia | 195 | 1.1% |
| Australia | 67 | 0.4% |
| Belarus | 6 | 0.0% |
| Belgium | 1 | 0.0% |
| Bolivia | 24 | 0.1% |
| Bosnia and Herzegovina | 6 | 0.0% |
| Bulgaria | 3 | 0.0% |
| Canada | 186 | 1.0% |
| Caribbean | 4 | 0.0% |
| Central America | 297 | 1.7% |
| Chile | 28 | 0.2% |
| China | 55 | 0.3% |
| Colombia | 6 | 0.0% |
| Cuba | 2 | 0.0% |
| Denmark | 4 | 0.0% |
| Eastern Africa | 7 | 0.0% |
| Eastern Asia | 82 | 0.5% |
| Eastern Europe | 108 | 0.6% |
| El Salvador | 1 | 0.0% |
| England | 90 | 0.5% |
| Ethiopia | 7 | 0.0% |
| Europe | 478 | 2.7% |
| France | 13 | 0.1% |
| Germany | 61 | 0.3% |
| Greece | 5 | 0.0% |
| Honduras | 1 | 0.0% |
| Hong Kong | 2 | 0.0% |
| Hungary | 10 | 0.1% |
| India | 10 | 0.1% |
| Indonesia | 16 | 0.1% |
| Iran | 4 | 0.0% |
| Ireland | 14 | 0.1% |
| Israel | 9 | 0.1% |
| Italy | 11 | 0.1% |
| Jamaica | 2 | 0.0% |
| Japan | 11 | 0.1% |
| Korea | 16 | 0.1% |
| Latin America | 371 | 2.1% |
| Latvia | 3 | 0.0% |
| Lithuania | 2 | 0.0% |
| Mexico | 289 | 1.6% |
| Netherlands | 16 | 0.1% |
| Nicaragua | 6 | 0.0% |
| Northern Europe | 247 | 1.4% |
| Norway | 7 | 0.0% |
| Oceania | 110 | 0.6% |
| Philippines | 45 | 0.3% |
| Poland | 8 | 0.0% |
| Russia | 35 | 0.2% |
| Scotland | 24 | 0.1% |
| Singapore | 9 | 0.1% |
| South Africa | 25 | 0.1% |
| South America | 70 | 0.4% |
| South Central Asia | 14 | 0.1% |
| South Eastern Asia | 88 | 0.5% |
| Southern Europe | 18 | 0.1% |
| Spain | 2 | 0.0% |
| Sweden | 10 | 0.1% |
| Switzerland | 14 | 0.1% |
| Taiwan | 13 | 0.1% |
| Thailand | 10 | 0.1% |
| Ukraine | 22 | 0.1% |
| Venezuela | 8 | 0.0% |
| Vietnam | 8 | 0.0% |
| Western Asia | 9 | 0.1% |
| Western Europe | 105 | 0.6% | View All 68 Rows |
Sex and Age in San Juan County
Sex and Age in San Juan County
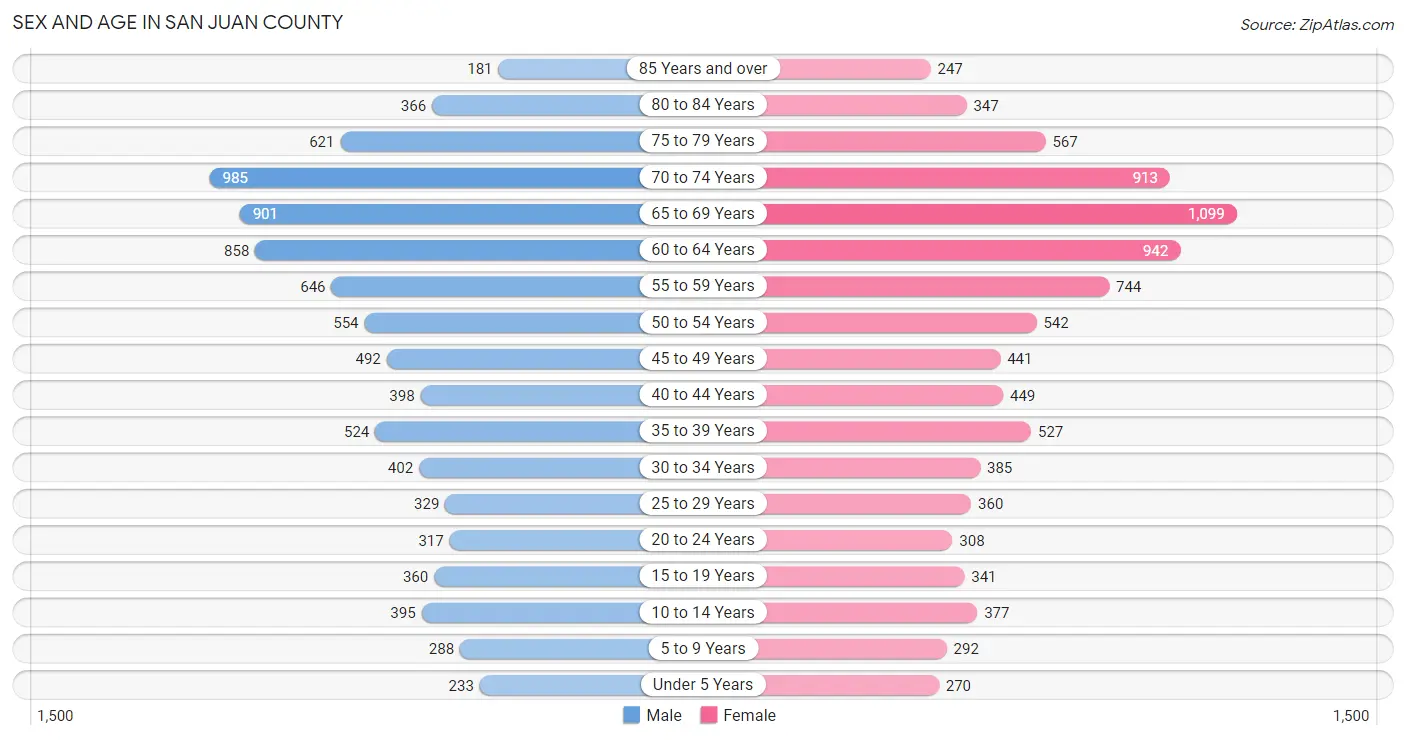
The most populous age groups in San Juan County are 70 to 74 Years (985 | 11.1%) for men and 65 to 69 Years (1,099 | 12.0%) for women.
| Age Bracket | Male | Female |
| Under 5 Years | 233 (2.6%) | 270 (2.9%) |
| 5 to 9 Years | 288 (3.3%) | 292 (3.2%) |
| 10 to 14 Years | 395 (4.5%) | 377 (4.1%) |
| 15 to 19 Years | 360 (4.1%) | 341 (3.7%) |
| 20 to 24 Years | 317 (3.6%) | 308 (3.4%) |
| 25 to 29 Years | 329 (3.7%) | 360 (3.9%) |
| 30 to 34 Years | 402 (4.5%) | 385 (4.2%) |
| 35 to 39 Years | 524 (5.9%) | 527 (5.8%) |
| 40 to 44 Years | 398 (4.5%) | 449 (4.9%) |
| 45 to 49 Years | 492 (5.6%) | 441 (4.8%) |
| 50 to 54 Years | 554 (6.3%) | 542 (5.9%) |
| 55 to 59 Years | 646 (7.3%) | 744 (8.1%) |
| 60 to 64 Years | 858 (9.7%) | 942 (10.3%) |
| 65 to 69 Years | 901 (10.2%) | 1,099 (12.0%) |
| 70 to 74 Years | 985 (11.1%) | 913 (10.0%) |
| 75 to 79 Years | 621 (7.0%) | 567 (6.2%) |
| 80 to 84 Years | 366 (4.1%) | 347 (3.8%) |
| 85 Years and over | 181 (2.1%) | 247 (2.7%) |
| Total | 8,850 (100.0%) | 9,151 (100.0%) |
Families and Households in San Juan County
Median Family Size in San Juan County
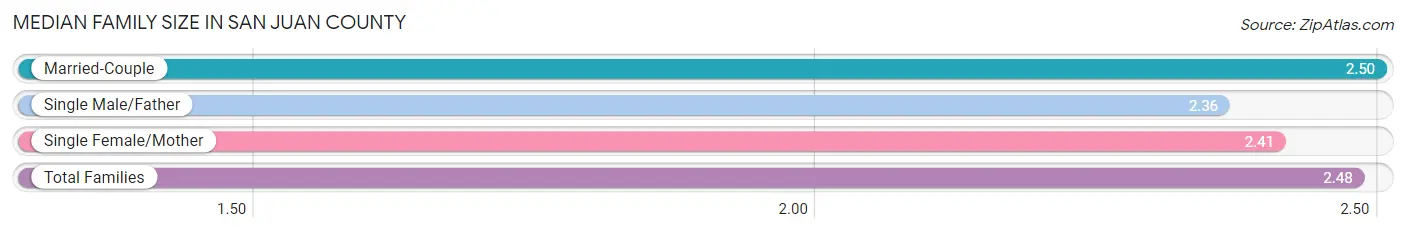
The median family size in San Juan County is 2.48 persons per family, with married-couple families (4,507 | 84.5%) accounting for the largest median family size of 2.5 persons per family. On the other hand, single male/father families (239 | 4.5%) represent the smallest median family size with 2.36 persons per family.
| Family Type | # Families | Family Size |
| Married-Couple | 4,507 (84.5%) | 2.50 |
| Single Male/Father | 239 (4.5%) | 2.36 |
| Single Female/Mother | 587 (11.0%) | 2.41 |
| Total Families | 5,333 (100.0%) | 2.48 |
Median Household Size in San Juan County
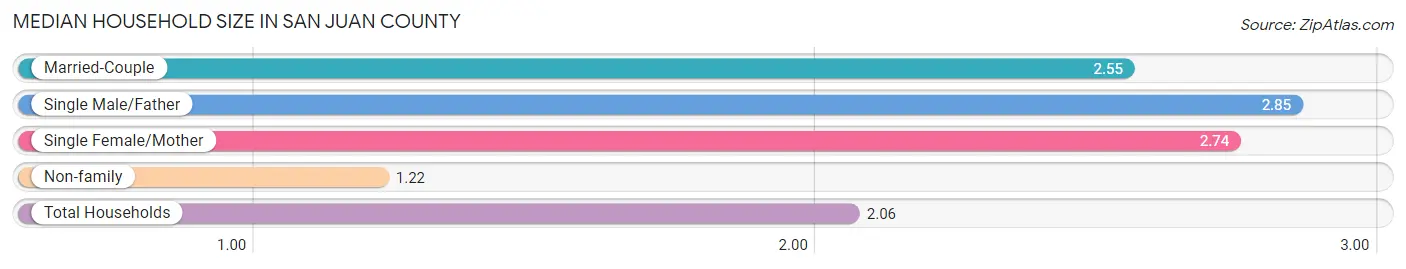
The median household size in San Juan County is 2.06 persons per household, with single male/father households (239 | 2.8%) accounting for the largest median household size of 2.85 persons per household. non-family households (3,321 | 38.4%) represent the smallest median household size with 1.22 persons per household.
| Household Type | # Households | Household Size |
| Married-Couple | 4,507 (52.1%) | 2.55 |
| Single Male/Father | 239 (2.8%) | 2.85 |
| Single Female/Mother | 587 (6.8%) | 2.74 |
| Non-family | 3,321 (38.4%) | 1.22 |
| Total Households | 8,654 (100.0%) | 2.06 |
Household Size by Marriage Status in San Juan County
Out of a total of 8,654 households in San Juan County, 5,333 (61.6%) are family households, while 3,321 (38.4%) are nonfamily households. The most numerous type of family households are 2-person households, comprising 3,477, and the most common type of nonfamily households are 1-person households, comprising 2,654.
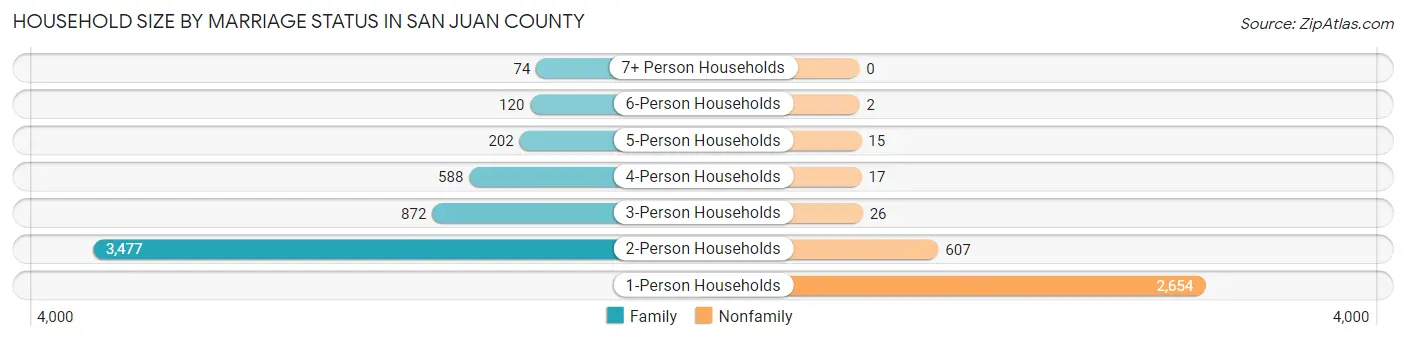
| Household Size | Family Households | Nonfamily Households |
| 1-Person Households | - | 2,654 (30.7%) |
| 2-Person Households | 3,477 (40.2%) | 607 (7.0%) |
| 3-Person Households | 872 (10.1%) | 26 (0.3%) |
| 4-Person Households | 588 (6.8%) | 17 (0.2%) |
| 5-Person Households | 202 (2.3%) | 15 (0.2%) |
| 6-Person Households | 120 (1.4%) | 2 (0.0%) |
| 7+ Person Households | 74 (0.9%) | 0 (0.0%) |
| Total | 5,333 (61.6%) | 3,321 (38.4%) |
Female Fertility in San Juan County
Fertility by Age in San Juan County
Average fertility rate in San Juan County is 42.0 births per 1,000 women. Women in the age bracket of 20 to 34 years have the highest fertility rate with 67.0 births per 1,000 women. Women in the age bracket of 20 to 34 years acount for 57.3% of all women with births.
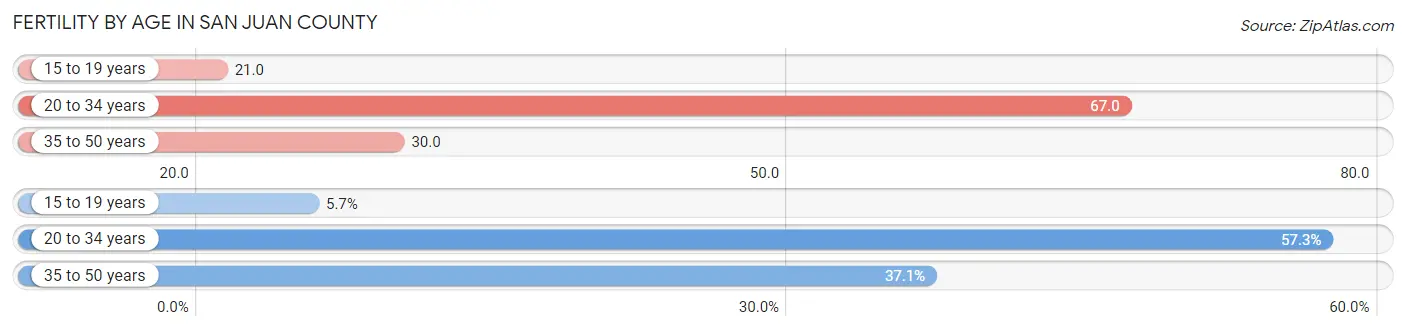
| Age Bracket | Women with Births | Births / 1,000 Women |
| 15 to 19 years | 7 (5.7%) | 21.0 |
| 20 to 34 years | 71 (57.3%) | 67.0 |
| 35 to 50 years | 46 (37.1%) | 30.0 |
| Total | 124 (100.0%) | 42.0 |
Fertility by Age by Marriage Status in San Juan County
75.8% of women with births (124) in San Juan County are married. The highest percentage of unmarried women with births falls into 15 to 19 years age bracket with 100.0% of them unmarried at the time of birth, while the lowest percentage of unmarried women with births belong to 35 to 50 years age bracket with 4.3% of them unmarried.
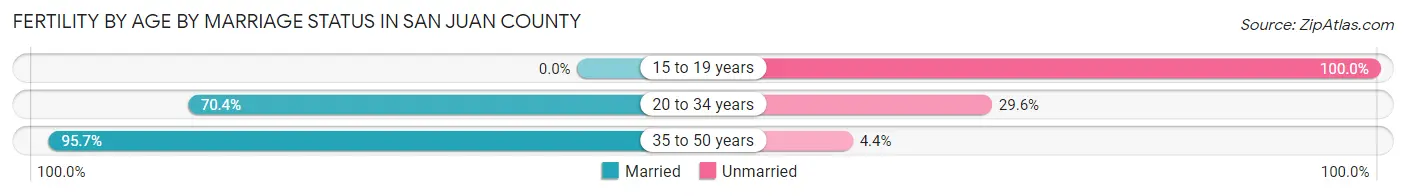
| Age Bracket | Married | Unmarried |
| 15 to 19 years | 0 (0.0%) | 7 (100.0%) |
| 20 to 34 years | 50 (70.4%) | 21 (29.6%) |
| 35 to 50 years | 44 (95.7%) | 2 (4.3%) |
| Total | 94 (75.8%) | 30 (24.2%) |
Fertility by Education in San Juan County
Average fertility rate in San Juan County is 42.0 births per 1,000 women. Women with the education attainment of bachelor's degree have the highest fertility rate of 73.0 births per 1,000 women, while women with the education attainment of college or associate's degree have the lowest fertility at 21.0 births per 1,000 women. Women with the education attainment of bachelor's degree represent 49.2% of all women with births.
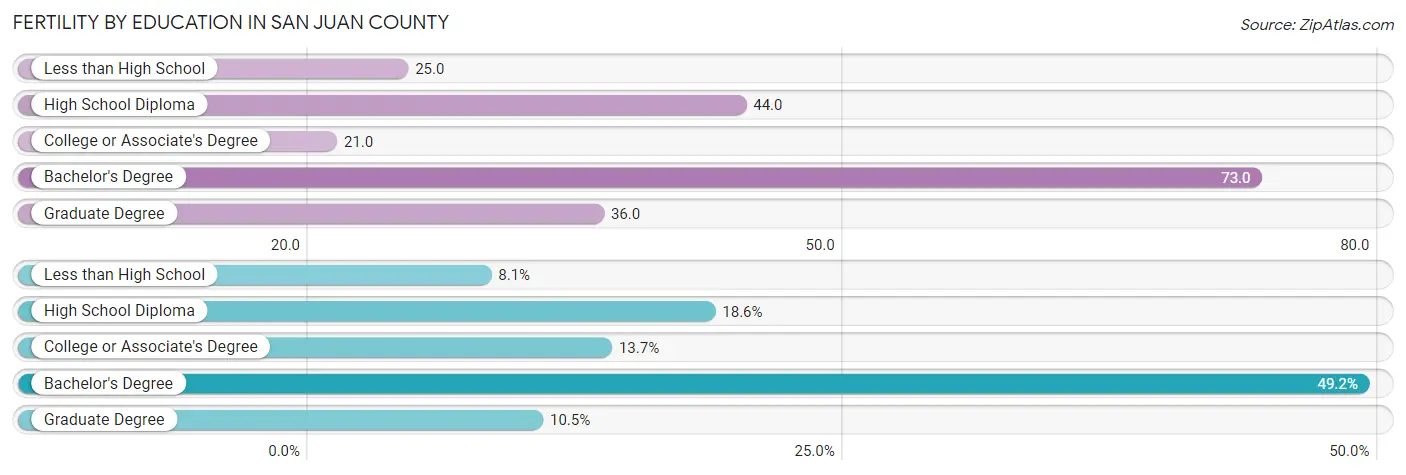
| Educational Attainment | Women with Births | Births / 1,000 Women |
| Less than High School | 10 (8.1%) | 25.0 |
| High School Diploma | 23 (18.5%) | 44.0 |
| College or Associate's Degree | 17 (13.7%) | 21.0 |
| Bachelor's Degree | 61 (49.2%) | 73.0 |
| Graduate Degree | 13 (10.5%) | 36.0 |
| Total | 124 (100.0%) | 42.0 |
Fertility by Education by Marriage Status in San Juan County
24.2% of women with births in San Juan County are unmarried. Women with the educational attainment of college or associate's degree are most likely to be married with 100.0% of them married at childbirth, while women with the educational attainment of less than high school are least likely to be married with 70.0% of them unmarried at childbirth.
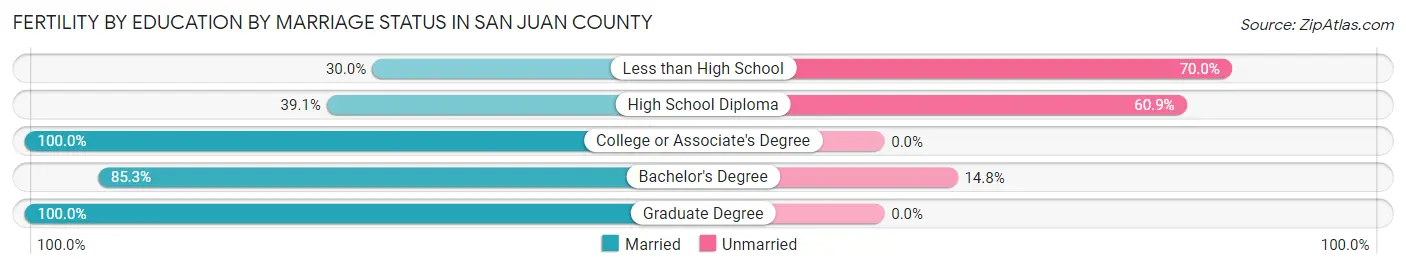
| Educational Attainment | Married | Unmarried |
| Less than High School | 3 (30.0%) | 7 (70.0%) |
| High School Diploma | 9 (39.1%) | 14 (60.9%) |
| College or Associate's Degree | 17 (100.0%) | 0 (0.0%) |
| Bachelor's Degree | 52 (85.3%) | 9 (14.7%) |
| Graduate Degree | 13 (100.0%) | 0 (0.0%) |
| Total | 94 (75.8%) | 30 (24.2%) |
Employment Characteristics in San Juan County
Employment by Class of Employer in San Juan County
Among the 8,106 employed individuals in San Juan County, private company employees (3,669 | 45.3%), self-employed (not incorporated) (1,503 | 18.5%), and self-employed (incorporated) (868 | 10.7%) make up the most common classes of employment.
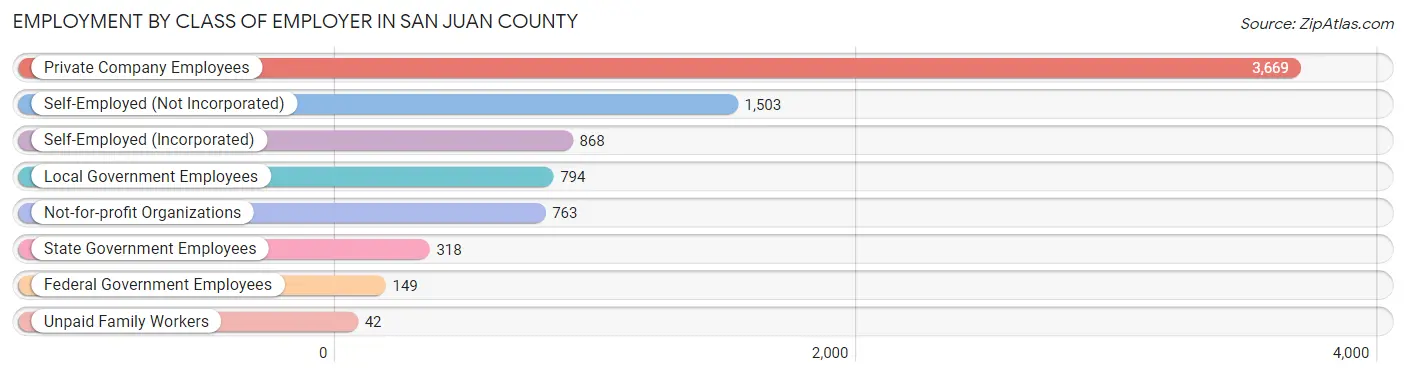
| Employer Class | # Employees | % Employees |
| Private Company Employees | 3,669 | 45.3% |
| Self-Employed (Incorporated) | 868 | 10.7% |
| Self-Employed (Not Incorporated) | 1,503 | 18.5% |
| Not-for-profit Organizations | 763 | 9.4% |
| Local Government Employees | 794 | 9.8% |
| State Government Employees | 318 | 3.9% |
| Federal Government Employees | 149 | 1.8% |
| Unpaid Family Workers | 42 | 0.5% |
| Total | 8,106 | 100.0% |
Employment Status by Age in San Juan County
According to the labor force statistics for San Juan County, out of the total population over 16 years of age (16,015), 53.2% or 8,520 individuals are in the labor force, with 3.2% or 273 of them unemployed. The age group with the highest labor force participation rate is 25 to 29 years, with 88.8% or 612 individuals in the labor force. Within the labor force, the 25 to 29 years age range has the highest percentage of unemployed individuals, with 6.0% or 37 of them being unemployed.
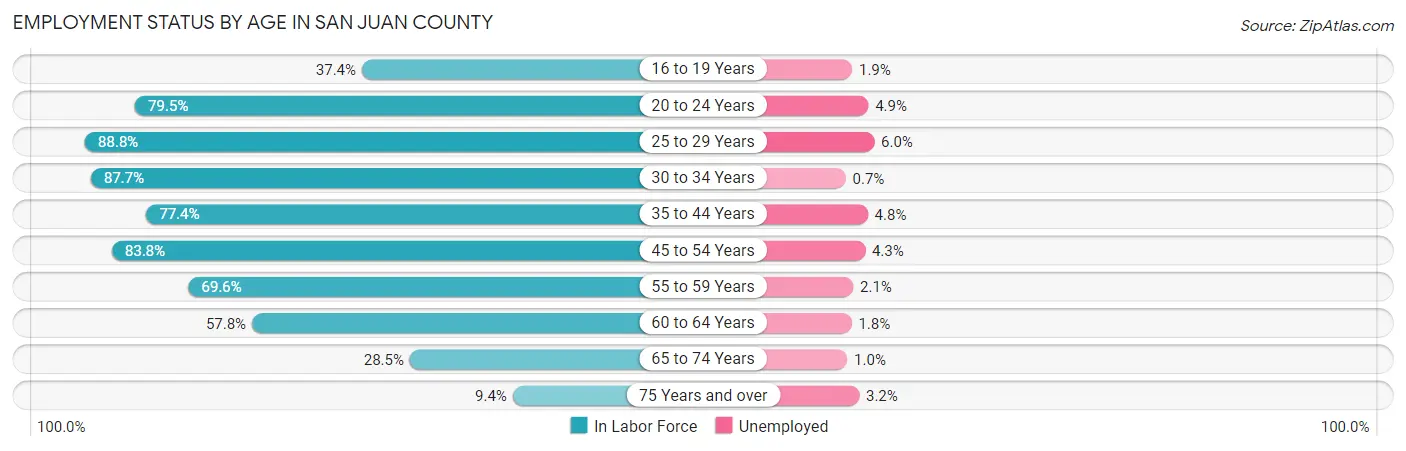
| Age Bracket | In Labor Force | Unemployed |
| 16 to 19 Years | 213 (37.4%) | 4 (1.9%) |
| 20 to 24 Years | 497 (79.5%) | 24 (4.9%) |
| 25 to 29 Years | 612 (88.8%) | 37 (6.0%) |
| 30 to 34 Years | 690 (87.7%) | 5 (0.7%) |
| 35 to 44 Years | 1,469 (77.4%) | 71 (4.8%) |
| 45 to 54 Years | 1,700 (83.8%) | 73 (4.3%) |
| 55 to 59 Years | 967 (69.6%) | 20 (2.1%) |
| 60 to 64 Years | 1,040 (57.8%) | 19 (1.8%) |
| 65 to 74 Years | 1,111 (28.5%) | 11 (1.0%) |
| 75 Years and over | 219 (9.4%) | 7 (3.2%) |
| Total | 8,520 (53.2%) | 273 (3.2%) |
Employment Status by Educational Attainment in San Juan County
According to labor force statistics for San Juan County, 75.4% of individuals (6,479) out of the total population between 25 and 64 years of age (8,593) are in the labor force, with 3.4% or 220 of them being unemployed. The group with the highest labor force participation rate are those with the educational attainment of less than high school, with 78.4% or 391 individuals in the labor force. Within the labor force, individuals with college / associate degree education have the highest percentage of unemployment, with 7.3% or 132 of them being unemployed.
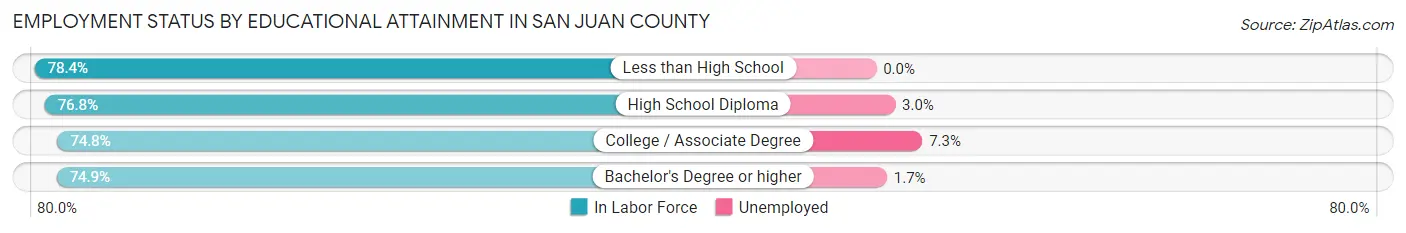
| Educational Attainment | In Labor Force | Unemployed |
| Less than High School | 391 (78.4%) | 0 (0.0%) |
| High School Diploma | 1,289 (76.8%) | 50 (3.0%) |
| College / Associate Degree | 1,809 (74.8%) | 177 (7.3%) |
| Bachelor's Degree or higher | 2,994 (74.9%) | 68 (1.7%) |
| Total | 6,479 (75.4%) | 292 (3.4%) |
Employment Occupations by Sex in San Juan County
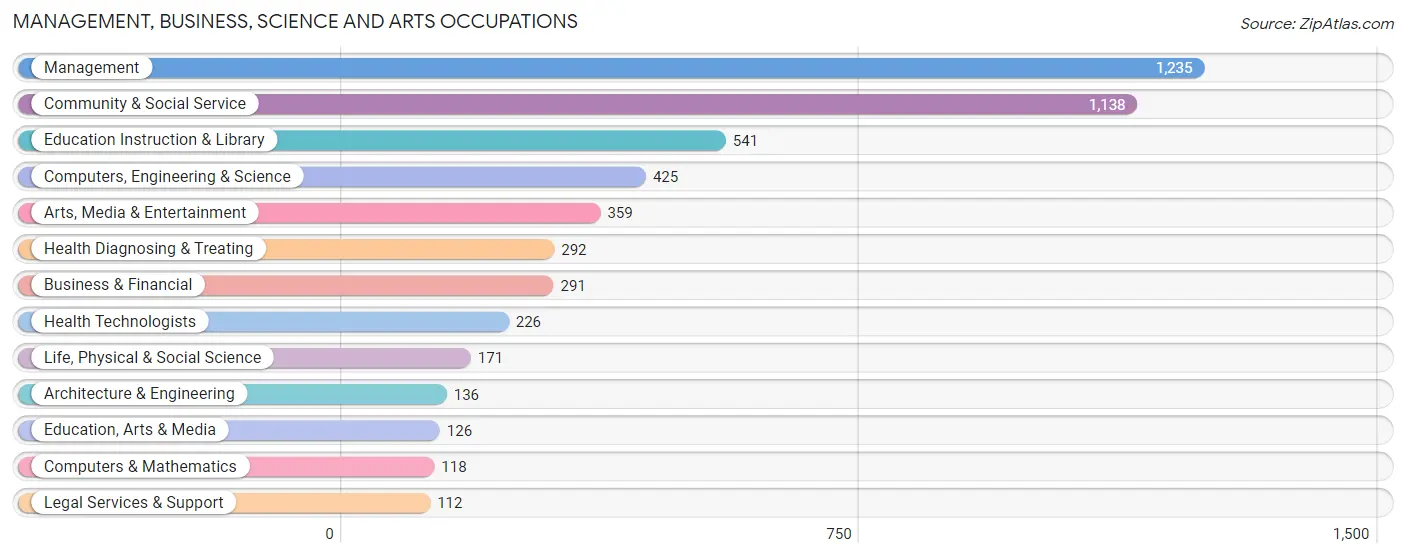
Management, Business, Science and Arts Occupations
The most common Management, Business, Science and Arts occupations in San Juan County are Management (1,235 | 15.0%), Community & Social Service (1,138 | 13.8%), Education Instruction & Library (541 | 6.6%), Computers, Engineering & Science (425 | 5.2%), and Arts, Media & Entertainment (359 | 4.4%).
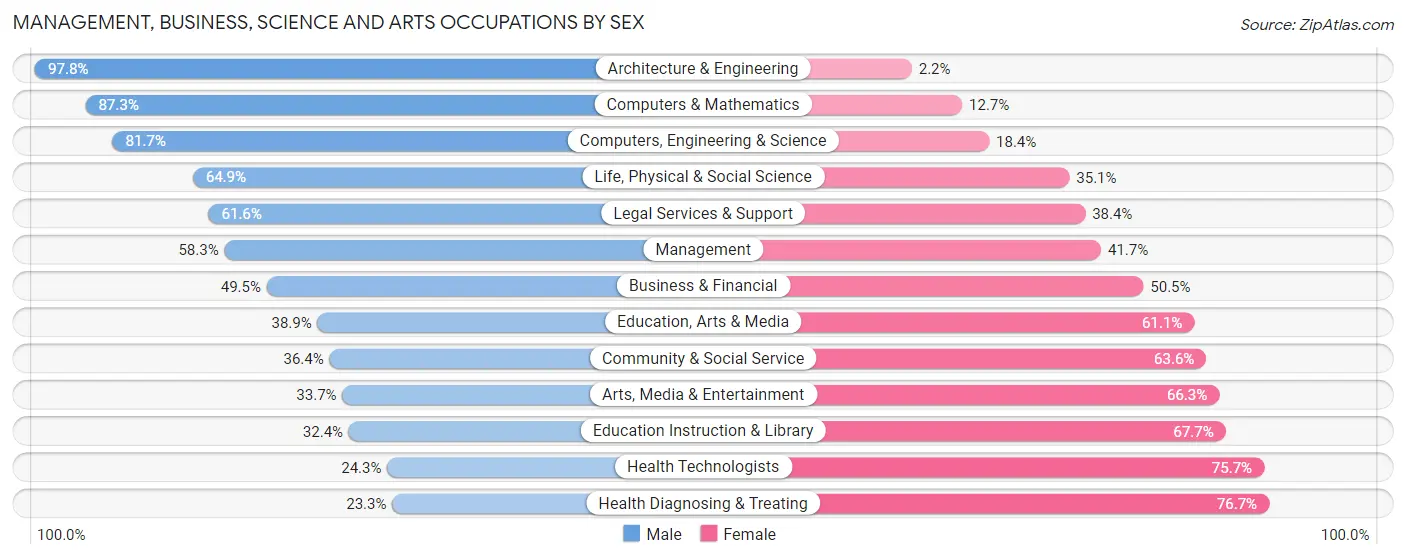
Management, Business, Science and Arts Occupations by Sex
Within the Management, Business, Science and Arts occupations in San Juan County, the most male-oriented occupations are Architecture & Engineering (97.8%), Computers & Mathematics (87.3%), and Computers, Engineering & Science (81.7%), while the most female-oriented occupations are Health Diagnosing & Treating (76.7%), Health Technologists (75.7%), and Education Instruction & Library (67.6%).
| Occupation | Male | Female |
| Management | 720 (58.3%) | 515 (41.7%) |
| Business & Financial | 144 (49.5%) | 147 (50.5%) |
| Computers, Engineering & Science | 347 (81.7%) | 78 (18.3%) |
| Computers & Mathematics | 103 (87.3%) | 15 (12.7%) |
| Architecture & Engineering | 133 (97.8%) | 3 (2.2%) |
| Life, Physical & Social Science | 111 (64.9%) | 60 (35.1%) |
| Community & Social Service | 414 (36.4%) | 724 (63.6%) |
| Education, Arts & Media | 49 (38.9%) | 77 (61.1%) |
| Legal Services & Support | 69 (61.6%) | 43 (38.4%) |
| Education Instruction & Library | 175 (32.4%) | 366 (67.6%) |
| Arts, Media & Entertainment | 121 (33.7%) | 238 (66.3%) |
| Health Diagnosing & Treating | 68 (23.3%) | 224 (76.7%) |
| Health Technologists | 55 (24.3%) | 171 (75.7%) |
| Total (Category) | 1,693 (50.1%) | 1,688 (49.9%) |
| Total (Overall) | 4,302 (52.3%) | 3,928 (47.7%) |
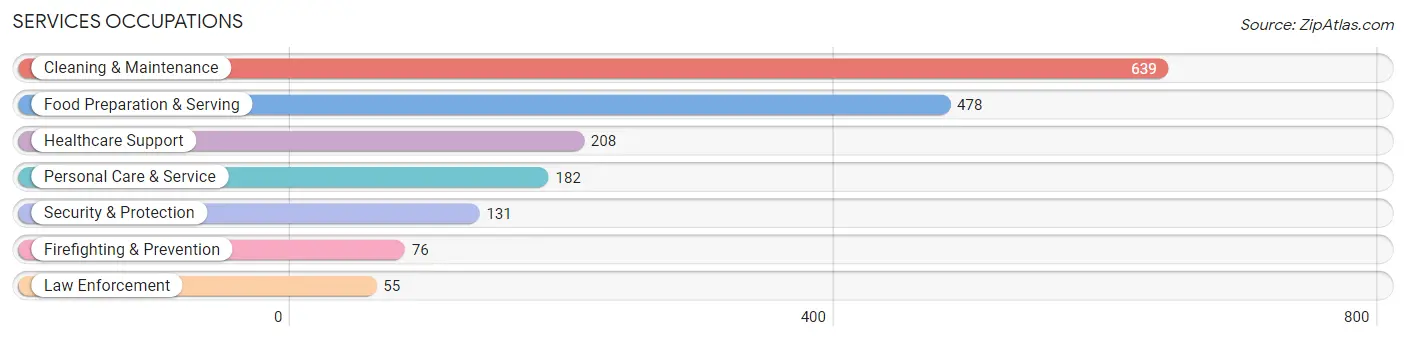
Services Occupations
The most common Services occupations in San Juan County are Cleaning & Maintenance (639 | 7.8%), Food Preparation & Serving (478 | 5.8%), Healthcare Support (208 | 2.5%), Personal Care & Service (182 | 2.2%), and Security & Protection (131 | 1.6%).
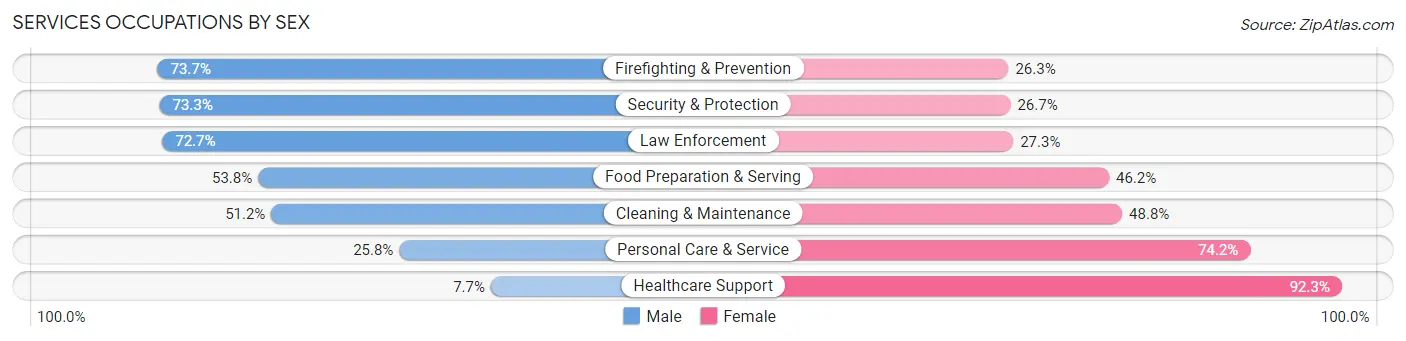
Services Occupations by Sex
Within the Services occupations in San Juan County, the most male-oriented occupations are Firefighting & Prevention (73.7%), Security & Protection (73.3%), and Law Enforcement (72.7%), while the most female-oriented occupations are Healthcare Support (92.3%), Personal Care & Service (74.2%), and Cleaning & Maintenance (48.8%).
| Occupation | Male | Female |
| Healthcare Support | 16 (7.7%) | 192 (92.3%) |
| Security & Protection | 96 (73.3%) | 35 (26.7%) |
| Firefighting & Prevention | 56 (73.7%) | 20 (26.3%) |
| Law Enforcement | 40 (72.7%) | 15 (27.3%) |
| Food Preparation & Serving | 257 (53.8%) | 221 (46.2%) |
| Cleaning & Maintenance | 327 (51.2%) | 312 (48.8%) |
| Personal Care & Service | 47 (25.8%) | 135 (74.2%) |
| Total (Category) | 743 (45.4%) | 895 (54.6%) |
| Total (Overall) | 4,302 (52.3%) | 3,928 (47.7%) |
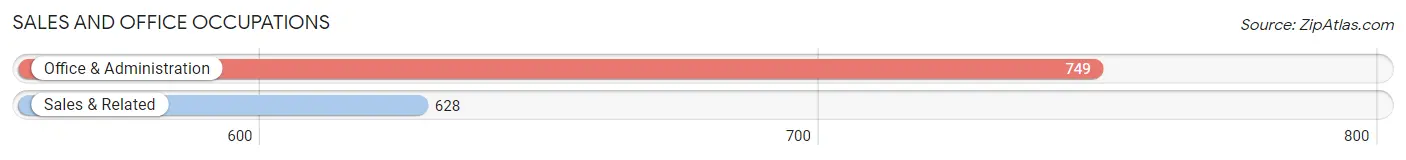
Sales and Office Occupations
The most common Sales and Office occupations in San Juan County are Office & Administration (749 | 9.1%), and Sales & Related (628 | 7.6%).
Sales and Office Occupations by Sex
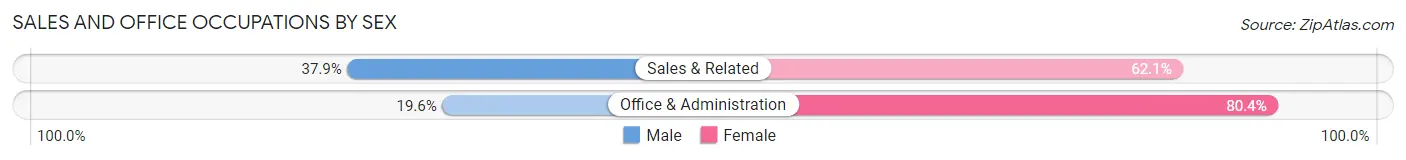
| Occupation | Male | Female |
| Sales & Related | 238 (37.9%) | 390 (62.1%) |
| Office & Administration | 147 (19.6%) | 602 (80.4%) |
| Total (Category) | 385 (28.0%) | 992 (72.0%) |
| Total (Overall) | 4,302 (52.3%) | 3,928 (47.7%) |
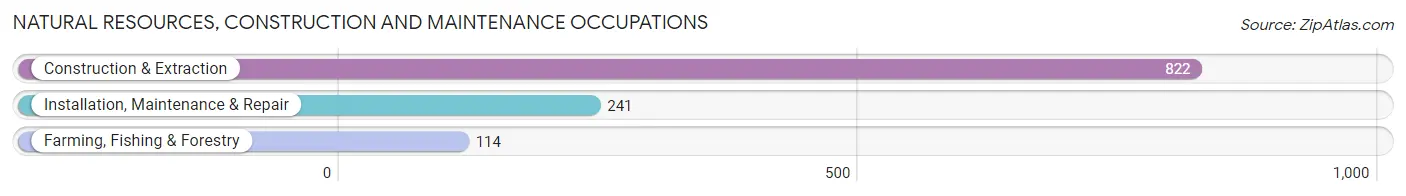
Natural Resources, Construction and Maintenance Occupations
The most common Natural Resources, Construction and Maintenance occupations in San Juan County are Construction & Extraction (822 | 10.0%), Installation, Maintenance & Repair (241 | 2.9%), and Farming, Fishing & Forestry (114 | 1.4%).
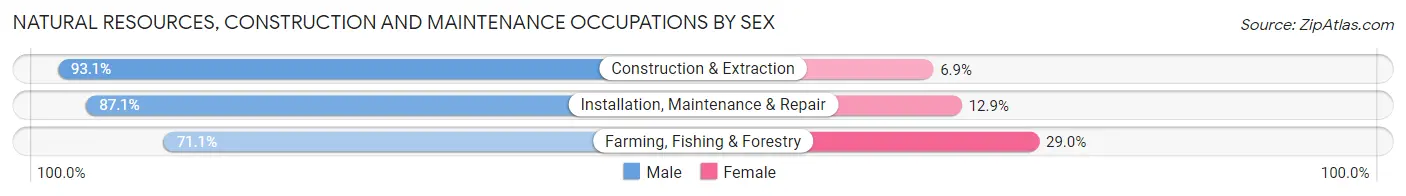
Natural Resources, Construction and Maintenance Occupations by Sex
| Occupation | Male | Female |
| Farming, Fishing & Forestry | 81 (71.1%) | 33 (28.9%) |
| Construction & Extraction | 765 (93.1%) | 57 (6.9%) |
| Installation, Maintenance & Repair | 210 (87.1%) | 31 (12.9%) |
| Total (Category) | 1,056 (89.7%) | 121 (10.3%) |
| Total (Overall) | 4,302 (52.3%) | 3,928 (47.7%) |
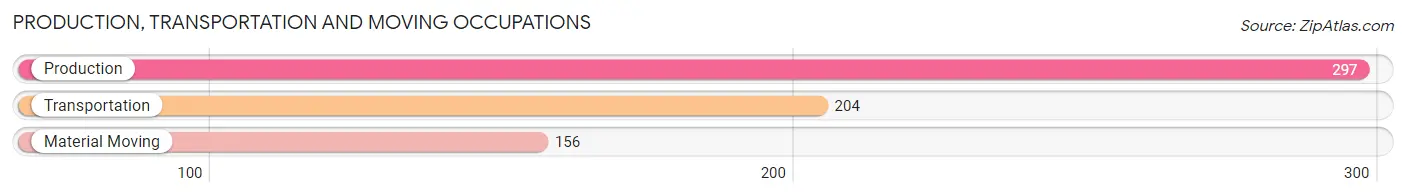
Production, Transportation and Moving Occupations
The most common Production, Transportation and Moving occupations in San Juan County are Production (297 | 3.6%), Transportation (204 | 2.5%), and Material Moving (156 | 1.9%).
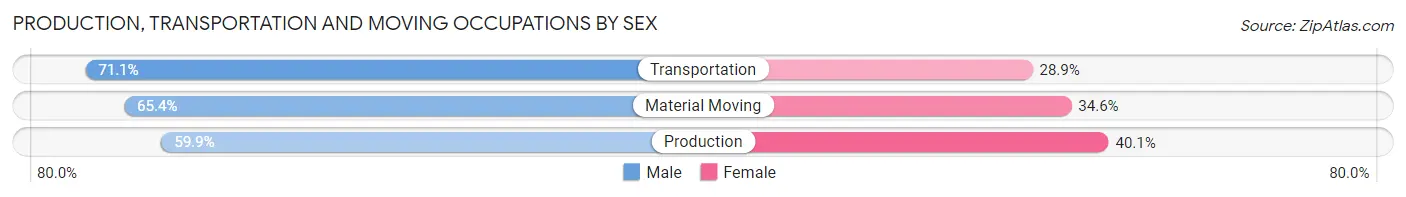
Production, Transportation and Moving Occupations by Sex
| Occupation | Male | Female |
| Production | 178 (59.9%) | 119 (40.1%) |
| Transportation | 145 (71.1%) | 59 (28.9%) |
| Material Moving | 102 (65.4%) | 54 (34.6%) |
| Total (Category) | 425 (64.7%) | 232 (35.3%) |
| Total (Overall) | 4,302 (52.3%) | 3,928 (47.7%) |
Employment Industries by Sex in San Juan County
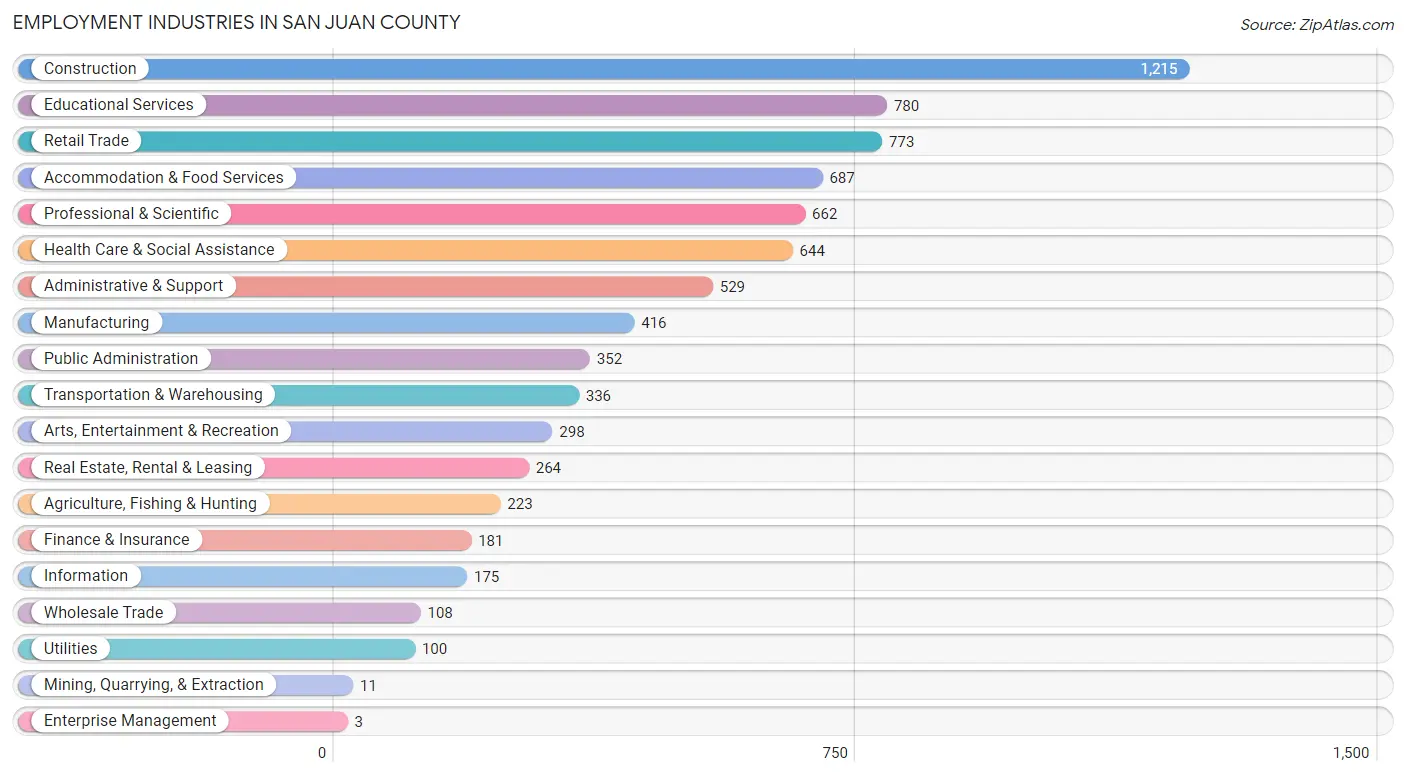
Employment Industries in San Juan County
The major employment industries in San Juan County include Construction (1,215 | 14.8%), Educational Services (780 | 9.5%), Retail Trade (773 | 9.4%), Accommodation & Food Services (687 | 8.4%), and Professional & Scientific (662 | 8.0%).
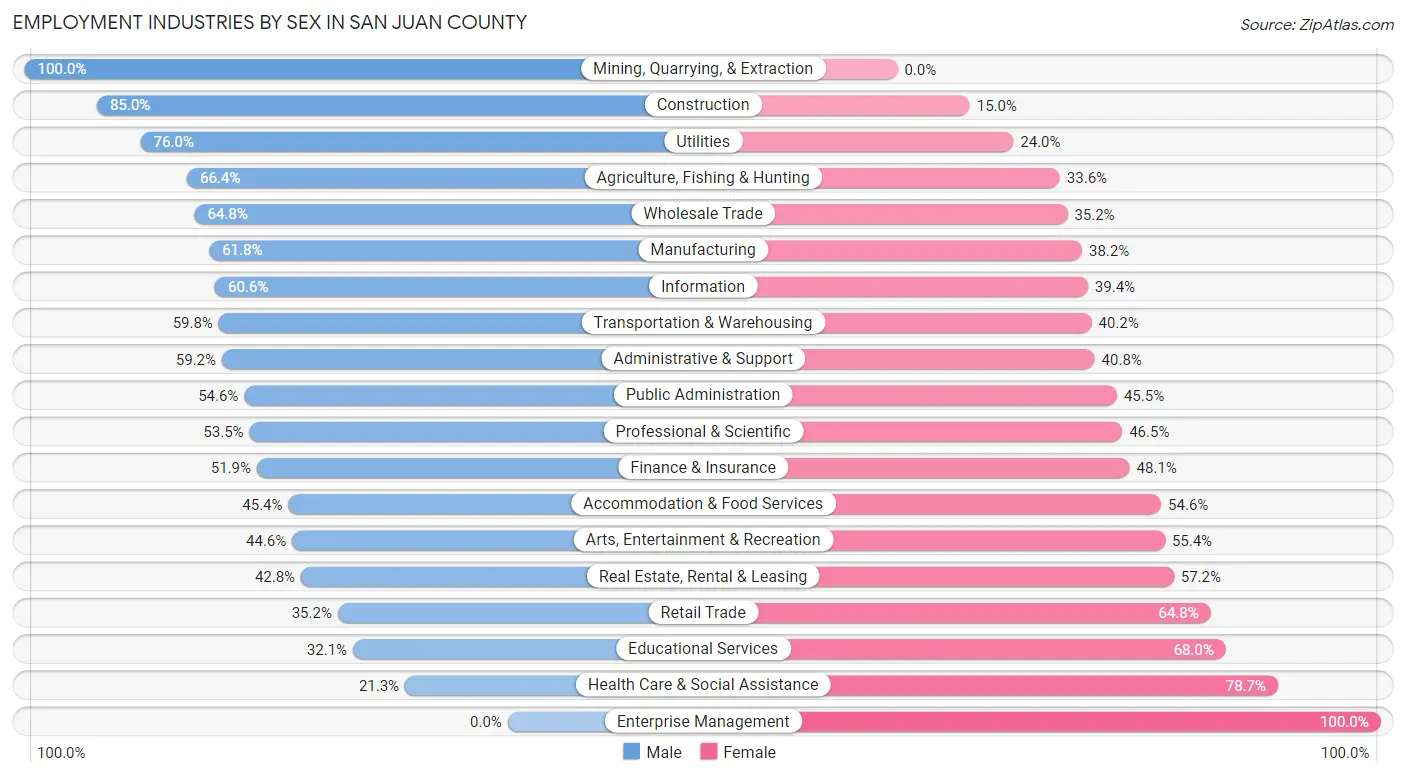
Employment Industries by Sex in San Juan County
The San Juan County industries that see more men than women are Mining, Quarrying, & Extraction (100.0%), Construction (85.0%), and Utilities (76.0%), whereas the industries that tend to have a higher number of women are Enterprise Management (100.0%), Health Care & Social Assistance (78.7%), and Educational Services (67.9%).
| Industry | Male | Female |
| Agriculture, Fishing & Hunting | 148 (66.4%) | 75 (33.6%) |
| Mining, Quarrying, & Extraction | 11 (100.0%) | 0 (0.0%) |
| Construction | 1,033 (85.0%) | 182 (15.0%) |
| Manufacturing | 257 (61.8%) | 159 (38.2%) |
| Wholesale Trade | 70 (64.8%) | 38 (35.2%) |
| Retail Trade | 272 (35.2%) | 501 (64.8%) |
| Transportation & Warehousing | 201 (59.8%) | 135 (40.2%) |
| Utilities | 76 (76.0%) | 24 (24.0%) |
| Information | 106 (60.6%) | 69 (39.4%) |
| Finance & Insurance | 94 (51.9%) | 87 (48.1%) |
| Real Estate, Rental & Leasing | 113 (42.8%) | 151 (57.2%) |
| Professional & Scientific | 354 (53.5%) | 308 (46.5%) |
| Enterprise Management | 0 (0.0%) | 3 (100.0%) |
| Administrative & Support | 313 (59.2%) | 216 (40.8%) |
| Educational Services | 250 (32.1%) | 530 (67.9%) |
| Health Care & Social Assistance | 137 (21.3%) | 507 (78.7%) |
| Arts, Entertainment & Recreation | 133 (44.6%) | 165 (55.4%) |
| Accommodation & Food Services | 312 (45.4%) | 375 (54.6%) |
| Public Administration | 192 (54.5%) | 160 (45.5%) |
| Total | 4,302 (52.3%) | 3,928 (47.7%) |
Education in San Juan County
School Enrollment in San Juan County
The most common levels of schooling among the 2,315 students in San Juan County are high school (644 | 27.8%), middle school (595 | 25.7%), and elementary school (505 | 21.8%).
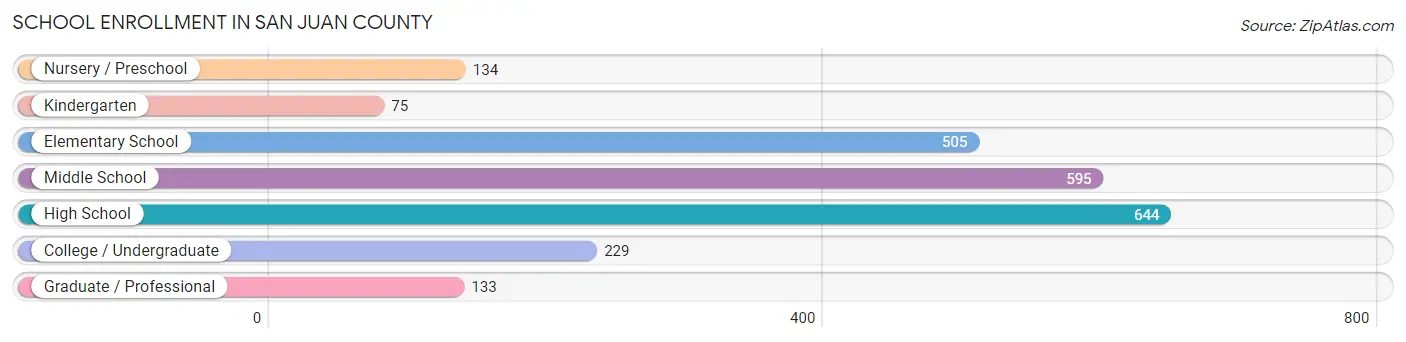
| School Level | # Students | % Students |
| Nursery / Preschool | 134 | 5.8% |
| Kindergarten | 75 | 3.2% |
| Elementary School | 505 | 21.8% |
| Middle School | 595 | 25.7% |
| High School | 644 | 27.8% |
| College / Undergraduate | 229 | 9.9% |
| Graduate / Professional | 133 | 5.8% |
| Total | 2,315 | 100.0% |
School Enrollment by Age by Funding Source in San Juan County
Out of a total of 2,315 students who are enrolled in schools in San Juan County, 530 (22.9%) attend a private institution, while the remaining 1,785 (77.1%) are enrolled in public schools. The age group of 3 to 4 year olds has the highest likelihood of being enrolled in private schools, with 50 (60.2% in the age bracket) enrolled. Conversely, the age group of 18 to 19 year olds has the lowest likelihood of being enrolled in a private school, with 194 (88.6% in the age bracket) attending a public institution.
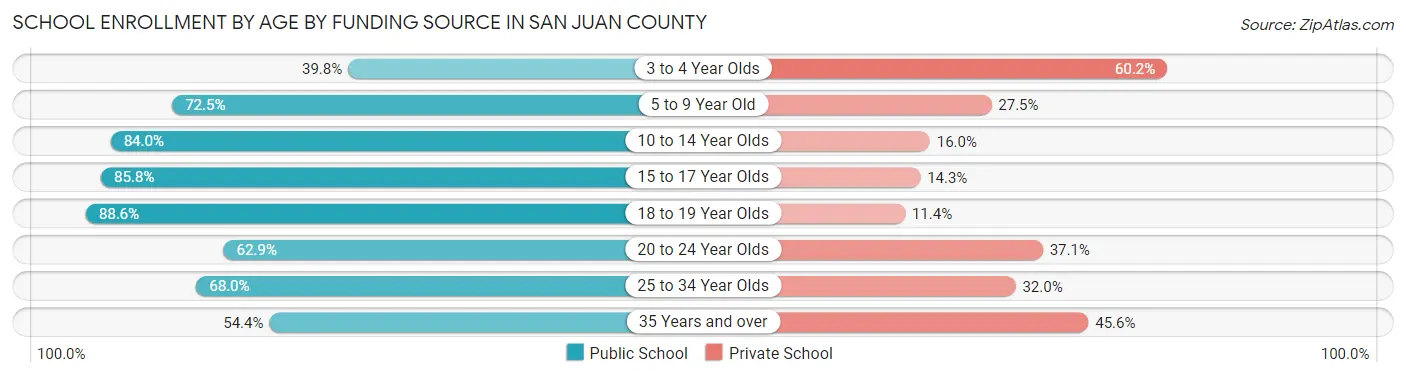
| Age Bracket | Public School | Private School |
| 3 to 4 Year Olds | 33 (39.8%) | 50 (60.2%) |
| 5 to 9 Year Old | 382 (72.5%) | 145 (27.5%) |
| 10 to 14 Year Olds | 628 (84.0%) | 120 (16.0%) |
| 15 to 17 Year Olds | 355 (85.8%) | 59 (14.2%) |
| 18 to 19 Year Olds | 194 (88.6%) | 25 (11.4%) |
| 20 to 24 Year Olds | 73 (62.9%) | 43 (37.1%) |
| 25 to 34 Year Olds | 34 (68.0%) | 16 (32.0%) |
| 35 Years and over | 86 (54.4%) | 72 (45.6%) |
| Total | 1,785 (77.1%) | 530 (22.9%) |
Educational Attainment by Field of Study in San Juan County
Business (1,013 | 12.1%), bio, nature & agricultural (955 | 11.4%), social sciences (918 | 11.0%), education (856 | 10.2%), and science & technology (640 | 7.6%) are the most common fields of study among 8,382 individuals in San Juan County who have obtained a bachelor's degree or higher.
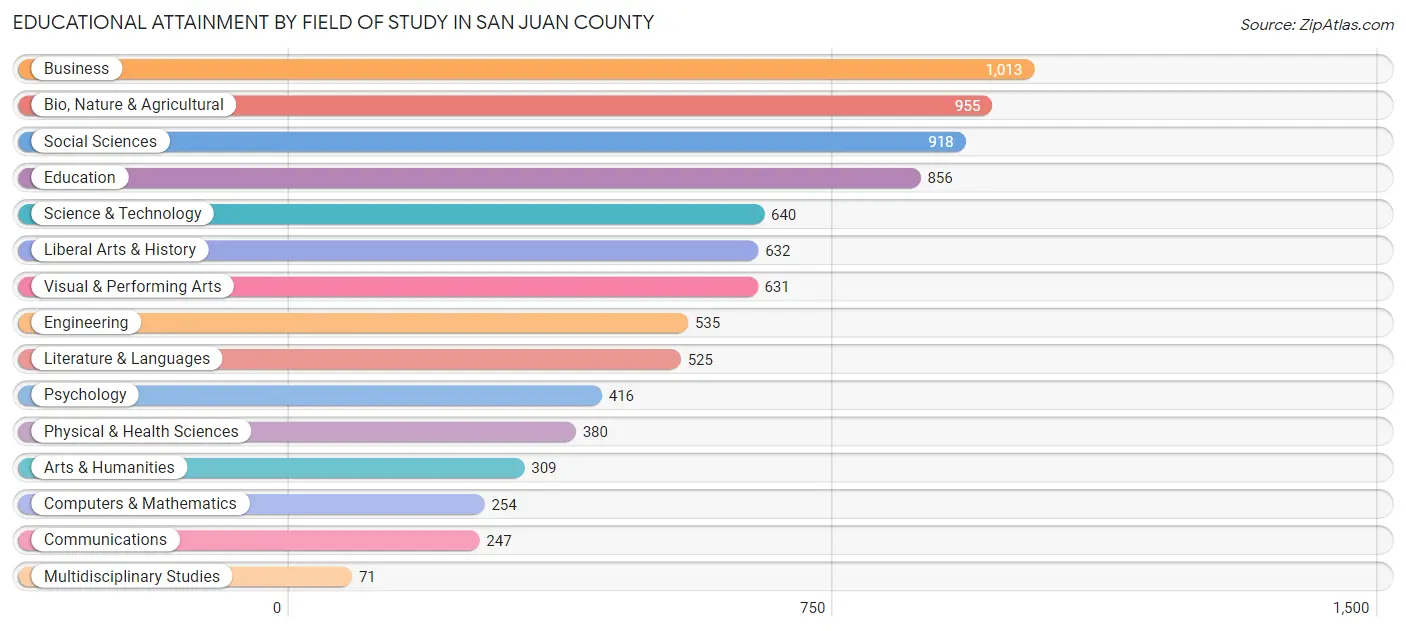
| Field of Study | # Graduates | % Graduates |
| Computers & Mathematics | 254 | 3.0% |
| Bio, Nature & Agricultural | 955 | 11.4% |
| Physical & Health Sciences | 380 | 4.5% |
| Psychology | 416 | 5.0% |
| Social Sciences | 918 | 11.0% |
| Engineering | 535 | 6.4% |
| Multidisciplinary Studies | 71 | 0.9% |
| Science & Technology | 640 | 7.6% |
| Business | 1,013 | 12.1% |
| Education | 856 | 10.2% |
| Literature & Languages | 525 | 6.3% |
| Liberal Arts & History | 632 | 7.5% |
| Visual & Performing Arts | 631 | 7.5% |
| Communications | 247 | 2.9% |
| Arts & Humanities | 309 | 3.7% |
| Total | 8,382 | 100.0% |
Transportation & Commute in San Juan County
Vehicle Availability by Sex in San Juan County
The most prevalent vehicle ownership categories in San Juan County are males with 2 vehicles (1,556, accounting for 37.1%) and females with 2 vehicles (1,438, making up 40.5%).
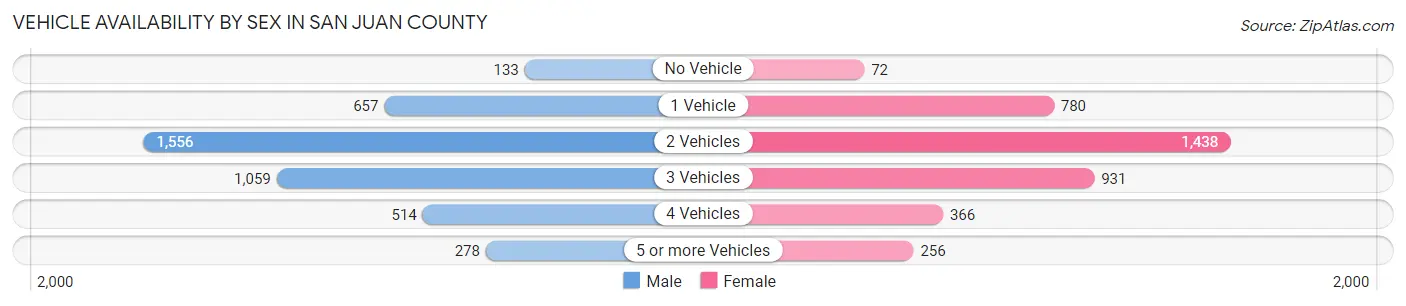
| Vehicles Available | Male | Female |
| No Vehicle | 133 (3.2%) | 72 (1.9%) |
| 1 Vehicle | 657 (15.7%) | 780 (20.3%) |
| 2 Vehicles | 1,556 (37.1%) | 1,438 (37.4%) |
| 3 Vehicles | 1,059 (25.2%) | 931 (24.2%) |
| 4 Vehicles | 514 (12.2%) | 366 (9.5%) |
| 5 or more Vehicles | 278 (6.6%) | 256 (6.7%) |
| Total | 4,197 (100.0%) | 3,843 (100.0%) |
Commute Time in San Juan County
The most frequently occuring commute durations in San Juan County are 10 to 14 minutes (1,498 commuters, 23.0%), 5 to 9 minutes (1,475 commuters, 22.7%), and 15 to 19 minutes (1,177 commuters, 18.1%).
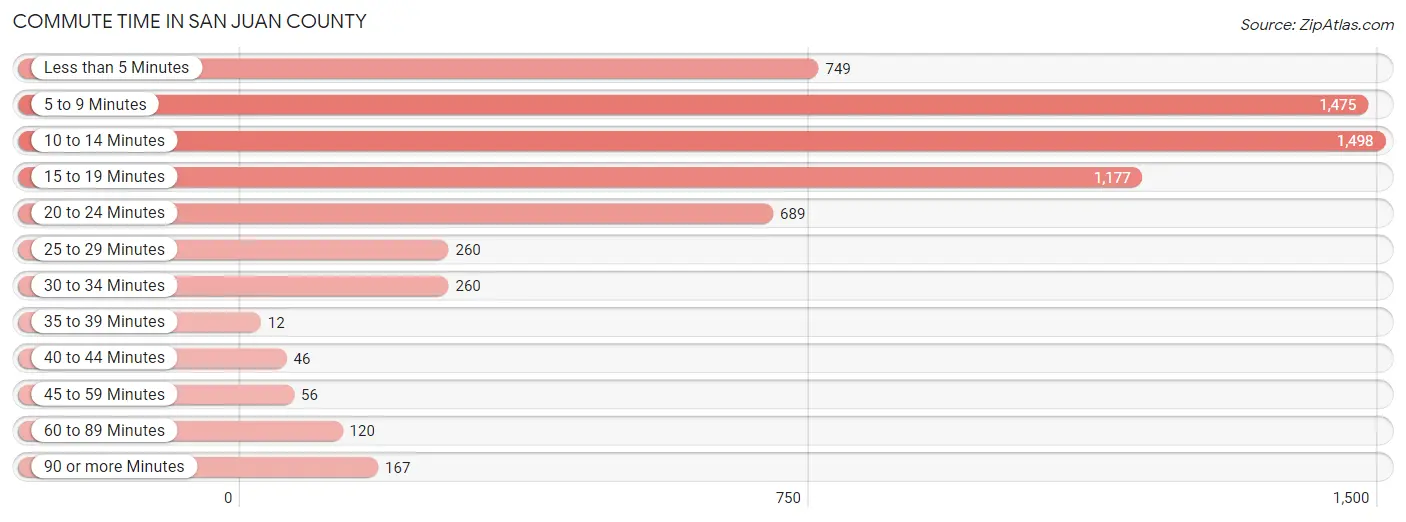
| Commute Time | # Commuters | % Commuters |
| Less than 5 Minutes | 749 | 11.5% |
| 5 to 9 Minutes | 1,475 | 22.7% |
| 10 to 14 Minutes | 1,498 | 23.0% |
| 15 to 19 Minutes | 1,177 | 18.1% |
| 20 to 24 Minutes | 689 | 10.6% |
| 25 to 29 Minutes | 260 | 4.0% |
| 30 to 34 Minutes | 260 | 4.0% |
| 35 to 39 Minutes | 12 | 0.2% |
| 40 to 44 Minutes | 46 | 0.7% |
| 45 to 59 Minutes | 56 | 0.9% |
| 60 to 89 Minutes | 120 | 1.8% |
| 90 or more Minutes | 167 | 2.6% |
Commute Time by Sex in San Juan County
The most common commute times in San Juan County are 10 to 14 minutes (807 commuters, 23.8%) for males and 5 to 9 minutes (800 commuters, 25.7%) for females.
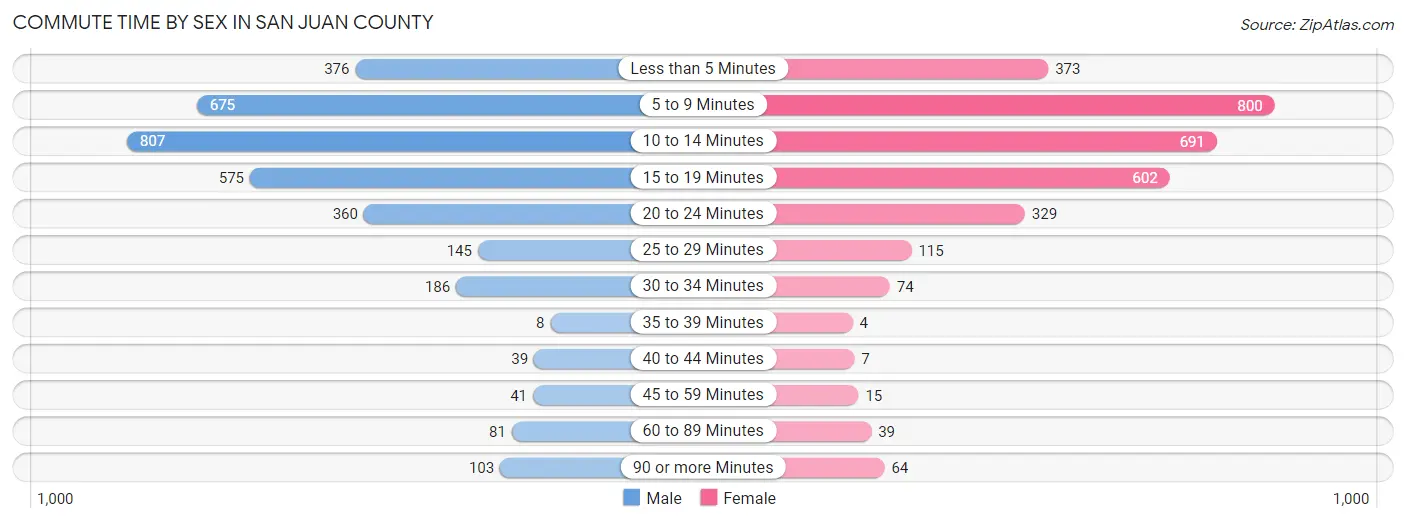
| Commute Time | Male | Female |
| Less than 5 Minutes | 376 (11.1%) | 373 (12.0%) |
| 5 to 9 Minutes | 675 (19.9%) | 800 (25.7%) |
| 10 to 14 Minutes | 807 (23.8%) | 691 (22.2%) |
| 15 to 19 Minutes | 575 (16.9%) | 602 (19.3%) |
| 20 to 24 Minutes | 360 (10.6%) | 329 (10.6%) |
| 25 to 29 Minutes | 145 (4.3%) | 115 (3.7%) |
| 30 to 34 Minutes | 186 (5.5%) | 74 (2.4%) |
| 35 to 39 Minutes | 8 (0.2%) | 4 (0.1%) |
| 40 to 44 Minutes | 39 (1.1%) | 7 (0.2%) |
| 45 to 59 Minutes | 41 (1.2%) | 15 (0.5%) |
| 60 to 89 Minutes | 81 (2.4%) | 39 (1.3%) |
| 90 or more Minutes | 103 (3.0%) | 64 (2.1%) |
Time of Departure to Work by Sex in San Juan County
The most frequent times of departure to work in San Juan County are 7:30 AM to 7:59 AM (633, 18.6%) for males and 8:00 AM to 8:29 AM (504, 16.2%) for females.
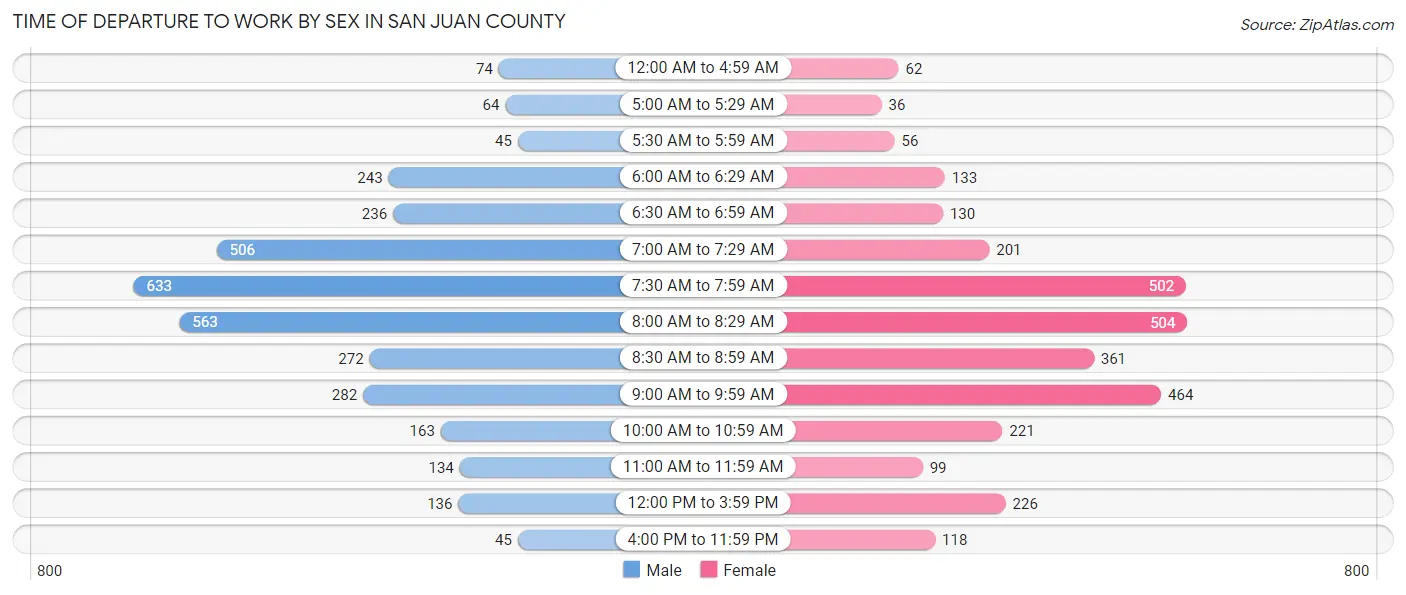
| Time of Departure | Male | Female |
| 12:00 AM to 4:59 AM | 74 (2.2%) | 62 (2.0%) |
| 5:00 AM to 5:29 AM | 64 (1.9%) | 36 (1.2%) |
| 5:30 AM to 5:59 AM | 45 (1.3%) | 56 (1.8%) |
| 6:00 AM to 6:29 AM | 243 (7.2%) | 133 (4.3%) |
| 6:30 AM to 6:59 AM | 236 (7.0%) | 130 (4.2%) |
| 7:00 AM to 7:29 AM | 506 (14.9%) | 201 (6.5%) |
| 7:30 AM to 7:59 AM | 633 (18.6%) | 502 (16.1%) |
| 8:00 AM to 8:29 AM | 563 (16.6%) | 504 (16.2%) |
| 8:30 AM to 8:59 AM | 272 (8.0%) | 361 (11.6%) |
| 9:00 AM to 9:59 AM | 282 (8.3%) | 464 (14.9%) |
| 10:00 AM to 10:59 AM | 163 (4.8%) | 221 (7.1%) |
| 11:00 AM to 11:59 AM | 134 (4.0%) | 99 (3.2%) |
| 12:00 PM to 3:59 PM | 136 (4.0%) | 226 (7.3%) |
| 4:00 PM to 11:59 PM | 45 (1.3%) | 118 (3.8%) |
| Total | 3,396 (100.0%) | 3,113 (100.0%) |
Housing Occupancy in San Juan County
Occupancy by Ownership in San Juan County
Of the total 8,654 dwellings in San Juan County, owner-occupied units account for 6,709 (77.5%), while renter-occupied units make up 1,945 (22.5%).
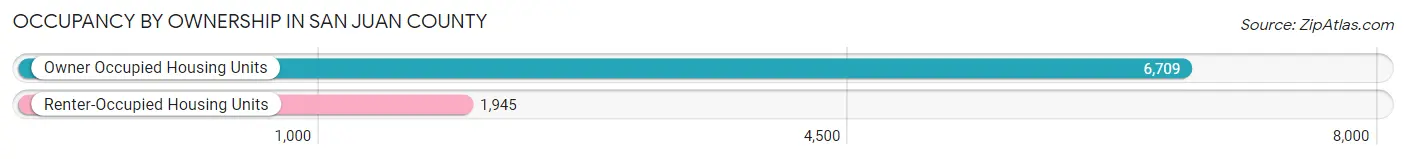
| Occupancy | # Housing Units | % Housing Units |
| Owner Occupied Housing Units | 6,709 | 77.5% |
| Renter-Occupied Housing Units | 1,945 | 22.5% |
| Total Occupied Housing Units | 8,654 | 100.0% |
Occupancy by Household Size in San Juan County
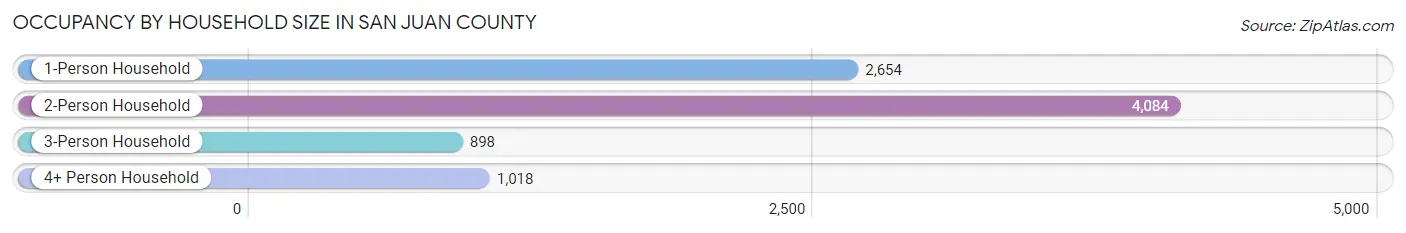
| Household Size | # Housing Units | % Housing Units |
| 1-Person Household | 2,654 | 30.7% |
| 2-Person Household | 4,084 | 47.2% |
| 3-Person Household | 898 | 10.4% |
| 4+ Person Household | 1,018 | 11.8% |
| Total Housing Units | 8,654 | 100.0% |
Occupancy by Ownership by Household Size in San Juan County
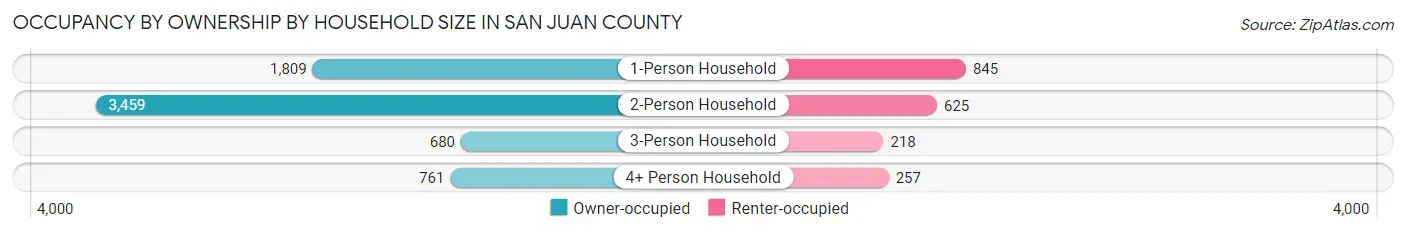
| Household Size | Owner-occupied | Renter-occupied |
| 1-Person Household | 1,809 (68.2%) | 845 (31.8%) |
| 2-Person Household | 3,459 (84.7%) | 625 (15.3%) |
| 3-Person Household | 680 (75.7%) | 218 (24.3%) |
| 4+ Person Household | 761 (74.8%) | 257 (25.3%) |
| Total Housing Units | 6,709 (77.5%) | 1,945 (22.5%) |
Occupancy by Educational Attainment in San Juan County
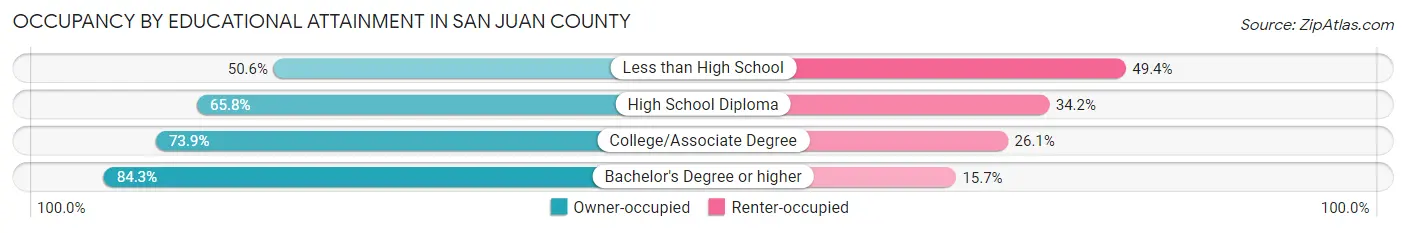
| Household Size | Owner-occupied | Renter-occupied |
| Less than High School | 169 (50.6%) | 165 (49.4%) |
| High School Diploma | 765 (65.8%) | 398 (34.2%) |
| College/Associate Degree | 1,839 (73.9%) | 648 (26.1%) |
| Bachelor's Degree or higher | 3,936 (84.3%) | 734 (15.7%) |
Occupancy by Age of Householder in San Juan County
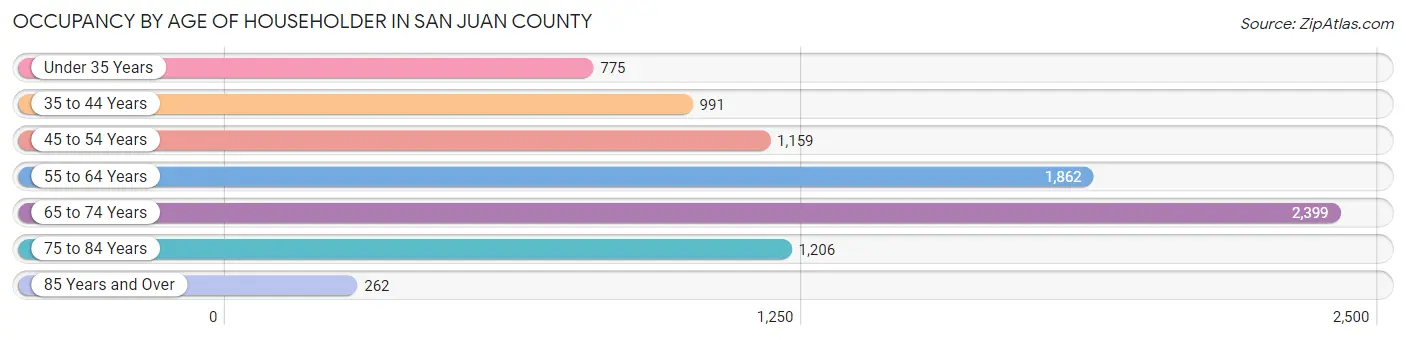
| Age Bracket | # Households | % Households |
| Under 35 Years | 775 | 9.0% |
| 35 to 44 Years | 991 | 11.5% |
| 45 to 54 Years | 1,159 | 13.4% |
| 55 to 64 Years | 1,862 | 21.5% |
| 65 to 74 Years | 2,399 | 27.7% |
| 75 to 84 Years | 1,206 | 13.9% |
| 85 Years and Over | 262 | 3.0% |
| Total | 8,654 | 100.0% |
Housing Finances in San Juan County
Median Income by Occupancy in San Juan County
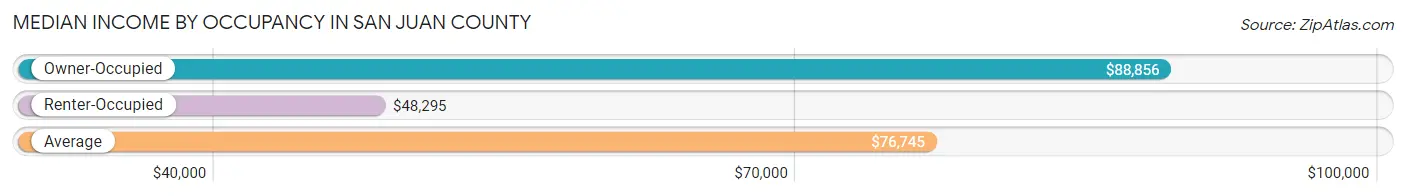
| Occupancy Type | # Households | Median Income |
| Owner-Occupied | 6,709 (77.5%) | $88,856 |
| Renter-Occupied | 1,945 (22.5%) | $48,295 |
| Average | 8,654 (100.0%) | $76,745 |
Occupancy by Householder Income Bracket in San Juan County
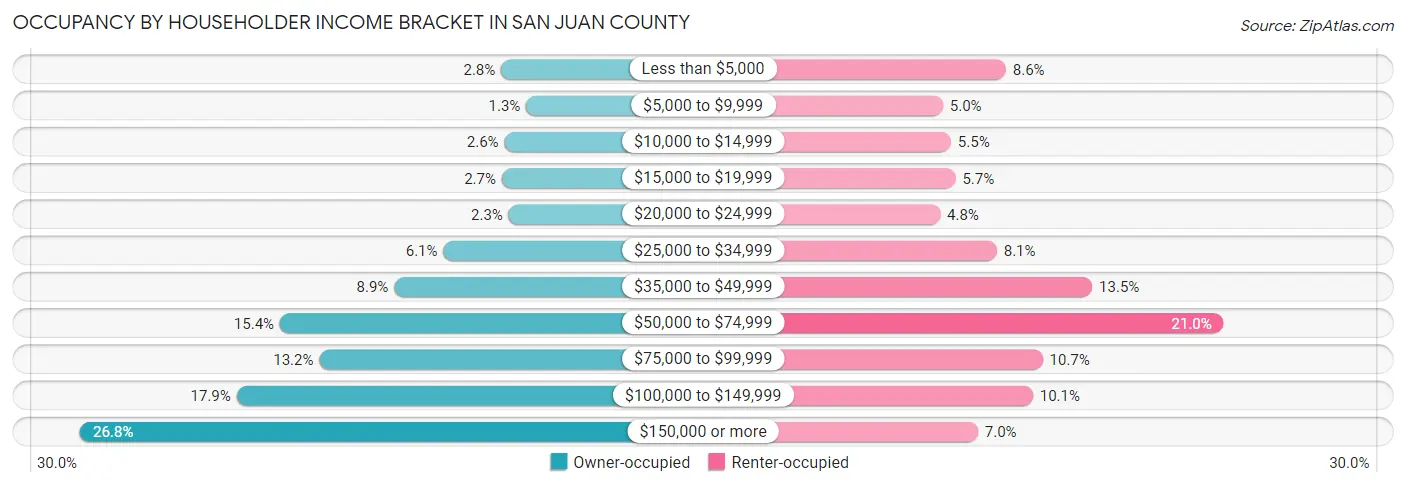
| Income Bracket | Owner-occupied | Renter-occupied |
| Less than $5,000 | 186 (2.8%) | 167 (8.6%) |
| $5,000 to $9,999 | 90 (1.3%) | 97 (5.0%) |
| $10,000 to $14,999 | 173 (2.6%) | 106 (5.4%) |
| $15,000 to $19,999 | 183 (2.7%) | 111 (5.7%) |
| $20,000 to $24,999 | 157 (2.3%) | 94 (4.8%) |
| $25,000 to $34,999 | 407 (6.1%) | 157 (8.1%) |
| $35,000 to $49,999 | 596 (8.9%) | 263 (13.5%) |
| $50,000 to $74,999 | 1,034 (15.4%) | 409 (21.0%) |
| $75,000 to $99,999 | 883 (13.2%) | 208 (10.7%) |
| $100,000 to $149,999 | 1,200 (17.9%) | 197 (10.1%) |
| $150,000 or more | 1,800 (26.8%) | 136 (7.0%) |
| Total | 6,709 (100.0%) | 1,945 (100.0%) |
Monthly Housing Cost Tiers in San Juan County
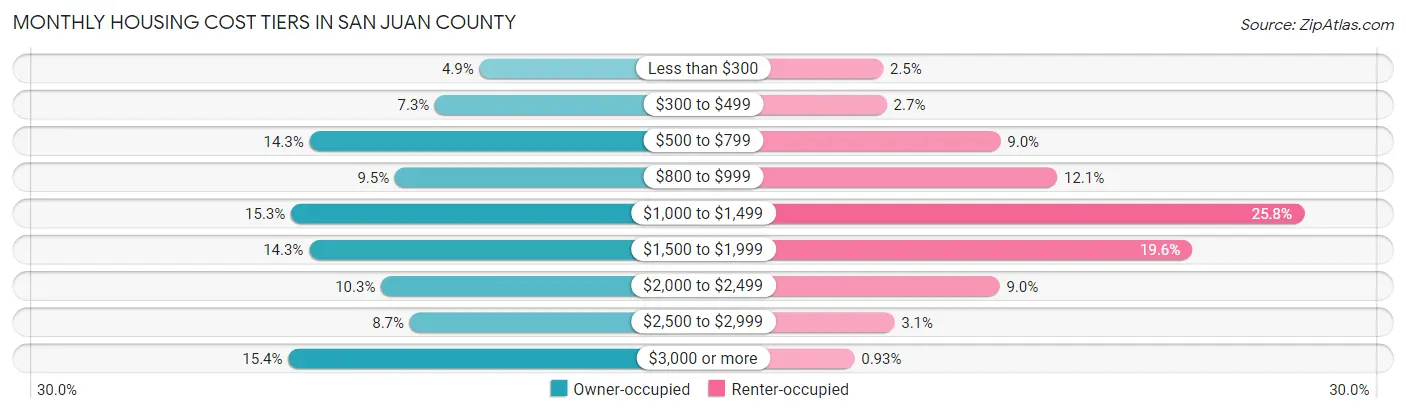
| Monthly Cost | Owner-occupied | Renter-occupied |
| Less than $300 | 327 (4.9%) | 49 (2.5%) |
| $300 to $499 | 491 (7.3%) | 53 (2.7%) |
| $500 to $799 | 957 (14.3%) | 175 (9.0%) |
| $800 to $999 | 640 (9.5%) | 236 (12.1%) |
| $1,000 to $1,499 | 1,025 (15.3%) | 501 (25.8%) |
| $1,500 to $1,999 | 958 (14.3%) | 381 (19.6%) |
| $2,000 to $2,499 | 691 (10.3%) | 174 (8.9%) |
| $2,500 to $2,999 | 585 (8.7%) | 61 (3.1%) |
| $3,000 or more | 1,035 (15.4%) | 18 (0.9%) |
| Total | 6,709 (100.0%) | 1,945 (100.0%) |
Physical Housing Characteristics in San Juan County
Housing Structures in San Juan County
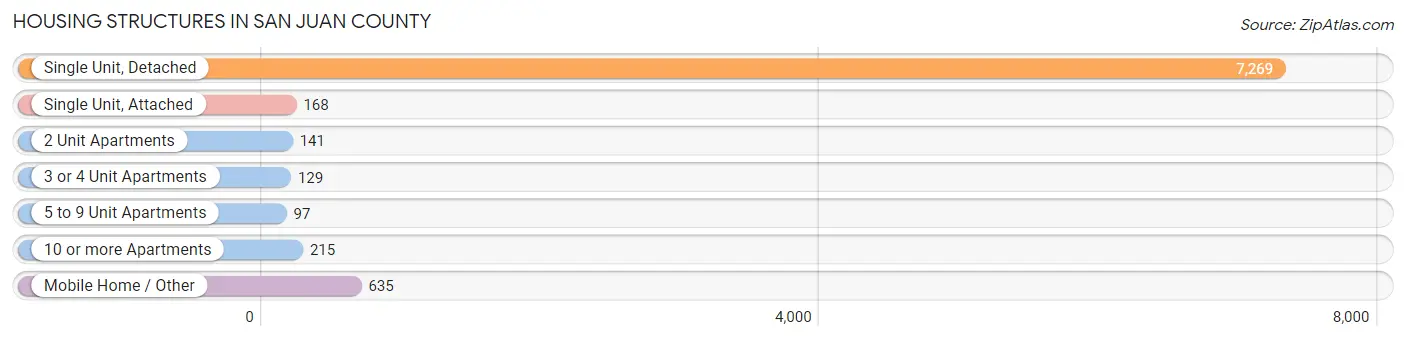
| Structure Type | # Housing Units | % Housing Units |
| Single Unit, Detached | 7,269 | 84.0% |
| Single Unit, Attached | 168 | 1.9% |
| 2 Unit Apartments | 141 | 1.6% |
| 3 or 4 Unit Apartments | 129 | 1.5% |
| 5 to 9 Unit Apartments | 97 | 1.1% |
| 10 or more Apartments | 215 | 2.5% |
| Mobile Home / Other | 635 | 7.3% |
| Total | 8,654 | 100.0% |
Housing Structures by Occupancy in San Juan County
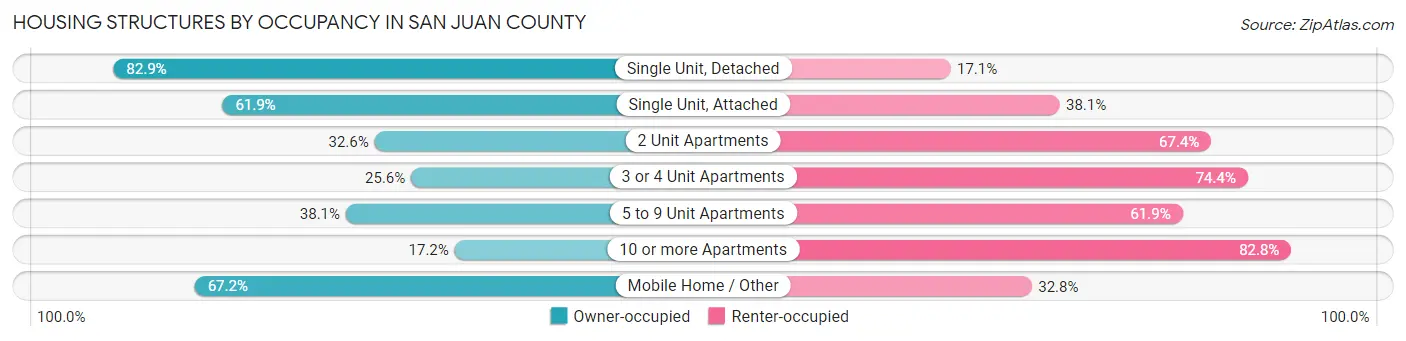
| Structure Type | Owner-occupied | Renter-occupied |
| Single Unit, Detached | 6,025 (82.9%) | 1,244 (17.1%) |
| Single Unit, Attached | 104 (61.9%) | 64 (38.1%) |
| 2 Unit Apartments | 46 (32.6%) | 95 (67.4%) |
| 3 or 4 Unit Apartments | 33 (25.6%) | 96 (74.4%) |
| 5 to 9 Unit Apartments | 37 (38.1%) | 60 (61.9%) |
| 10 or more Apartments | 37 (17.2%) | 178 (82.8%) |
| Mobile Home / Other | 427 (67.2%) | 208 (32.8%) |
| Total | 6,709 (77.5%) | 1,945 (22.5%) |
Housing Structures by Number of Rooms in San Juan County
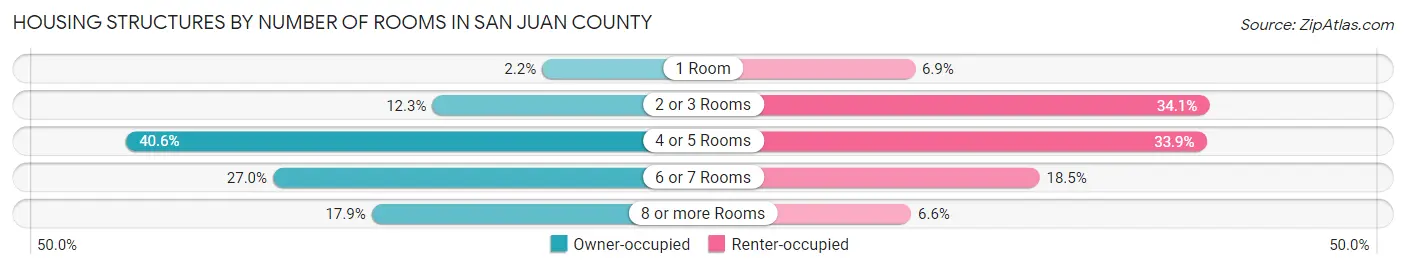
| Number of Rooms | Owner-occupied | Renter-occupied |
| 1 Room | 144 (2.1%) | 135 (6.9%) |
| 2 or 3 Rooms | 825 (12.3%) | 664 (34.1%) |
| 4 or 5 Rooms | 2,724 (40.6%) | 659 (33.9%) |
| 6 or 7 Rooms | 1,814 (27.0%) | 359 (18.5%) |
| 8 or more Rooms | 1,202 (17.9%) | 128 (6.6%) |
| Total | 6,709 (100.0%) | 1,945 (100.0%) |
Housing Structure by Heating Type in San Juan County
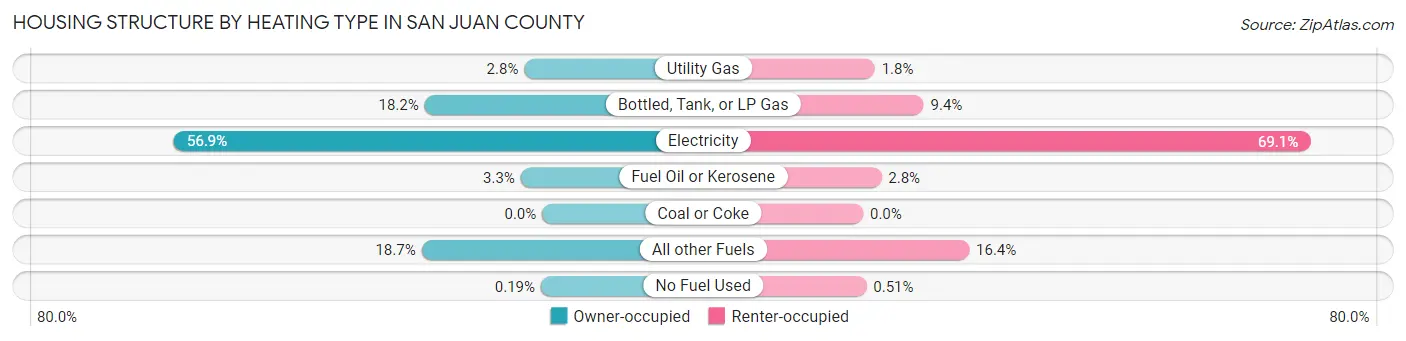
| Heating Type | Owner-occupied | Renter-occupied |
| Utility Gas | 185 (2.8%) | 35 (1.8%) |
| Bottled, Tank, or LP Gas | 1,219 (18.2%) | 182 (9.4%) |
| Electricity | 3,819 (56.9%) | 1,344 (69.1%) |
| Fuel Oil or Kerosene | 222 (3.3%) | 55 (2.8%) |
| Coal or Coke | 0 (0.0%) | 0 (0.0%) |
| All other Fuels | 1,251 (18.6%) | 319 (16.4%) |
| No Fuel Used | 13 (0.2%) | 10 (0.5%) |
| Total | 6,709 (100.0%) | 1,945 (100.0%) |
Household Vehicle Usage in San Juan County
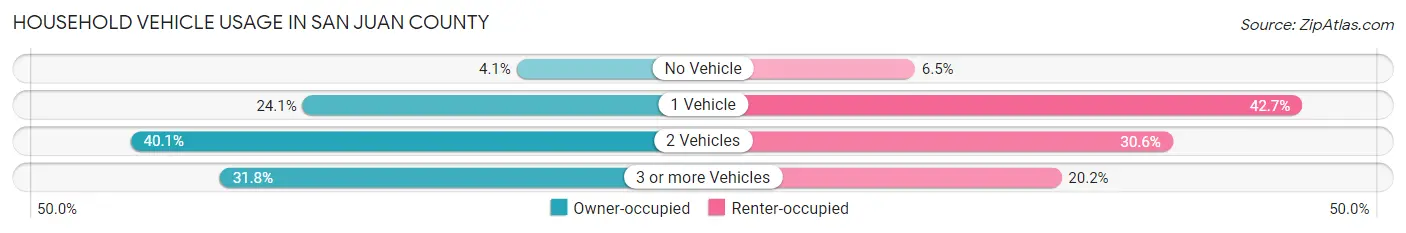
| Vehicles per Household | Owner-occupied | Renter-occupied |
| No Vehicle | 273 (4.1%) | 127 (6.5%) |
| 1 Vehicle | 1,614 (24.1%) | 830 (42.7%) |
| 2 Vehicles | 2,690 (40.1%) | 595 (30.6%) |
| 3 or more Vehicles | 2,132 (31.8%) | 393 (20.2%) |
| Total | 6,709 (100.0%) | 1,945 (100.0%) |
Real Estate & Mortgages in San Juan County
Real Estate and Mortgage Overview in San Juan County
| Characteristic | Without Mortgage | With Mortgage |
| Housing Units | 3,226 | 3,483 |
| Median Property Value | $694,900 | $658,100 |
| Median Household Income | $74,737 | $1,020 |
| Monthly Housing Costs | $770 | $977 |
| Real Estate Taxes | $4,183 | $52 |
Property Value by Mortgage Status in San Juan County
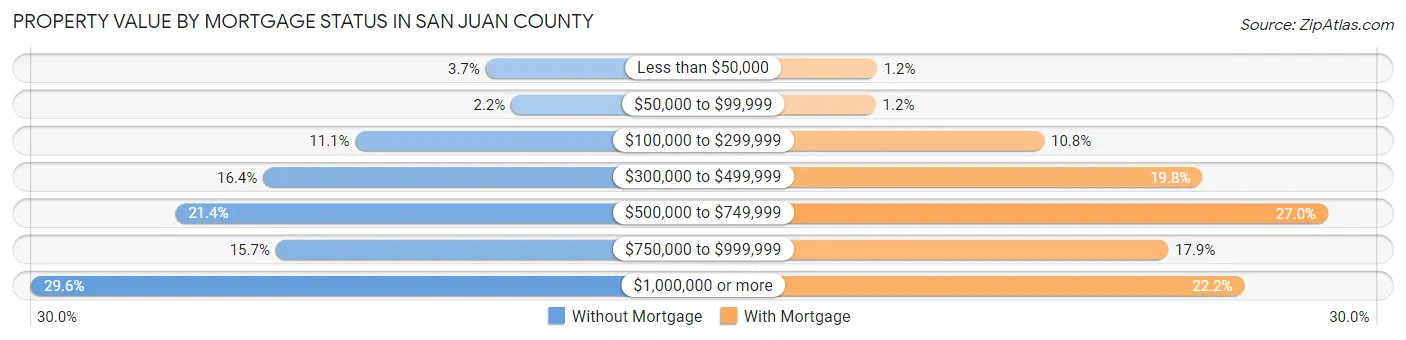
| Property Value | Without Mortgage | With Mortgage |
| Less than $50,000 | 118 (3.7%) | 42 (1.2%) |
| $50,000 to $99,999 | 71 (2.2%) | 40 (1.1%) |
| $100,000 to $299,999 | 358 (11.1%) | 375 (10.8%) |
| $300,000 to $499,999 | 528 (16.4%) | 690 (19.8%) |
| $500,000 to $749,999 | 690 (21.4%) | 940 (27.0%) |
| $750,000 to $999,999 | 505 (15.7%) | 622 (17.9%) |
| $1,000,000 or more | 956 (29.6%) | 774 (22.2%) |
| Total | 3,226 (100.0%) | 3,483 (100.0%) |
Household Income by Mortgage Status in San Juan County
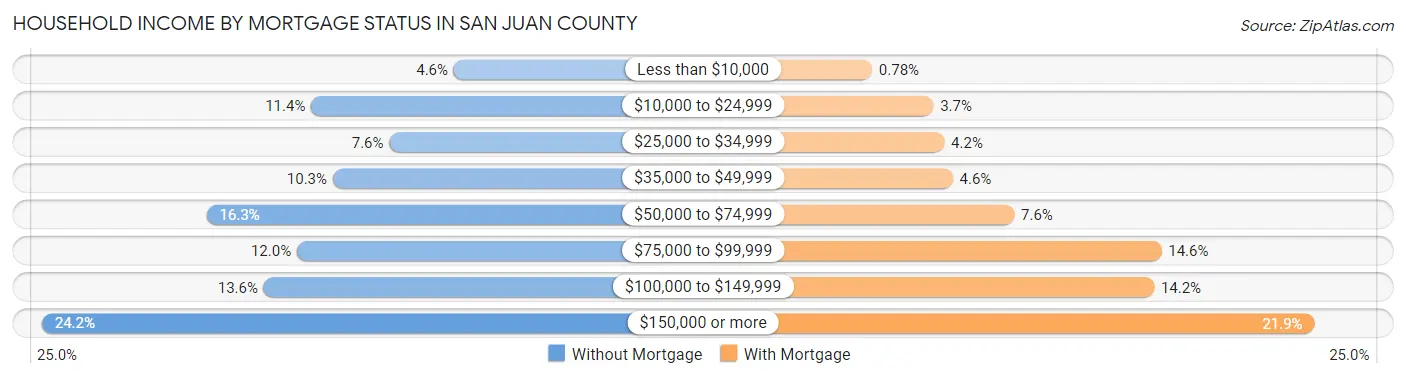
| Household Income | Without Mortgage | With Mortgage |
| Less than $10,000 | 147 (4.6%) | 27 (0.8%) |
| $10,000 to $24,999 | 366 (11.4%) | 129 (3.7%) |
| $25,000 to $34,999 | 246 (7.6%) | 147 (4.2%) |
| $35,000 to $49,999 | 333 (10.3%) | 161 (4.6%) |
| $50,000 to $74,999 | 527 (16.3%) | 263 (7.5%) |
| $75,000 to $99,999 | 388 (12.0%) | 507 (14.6%) |
| $100,000 to $149,999 | 439 (13.6%) | 495 (14.2%) |
| $150,000 or more | 780 (24.2%) | 761 (21.8%) |
| Total | 3,226 (100.0%) | 3,483 (100.0%) |
Property Value to Household Income Ratio in San Juan County
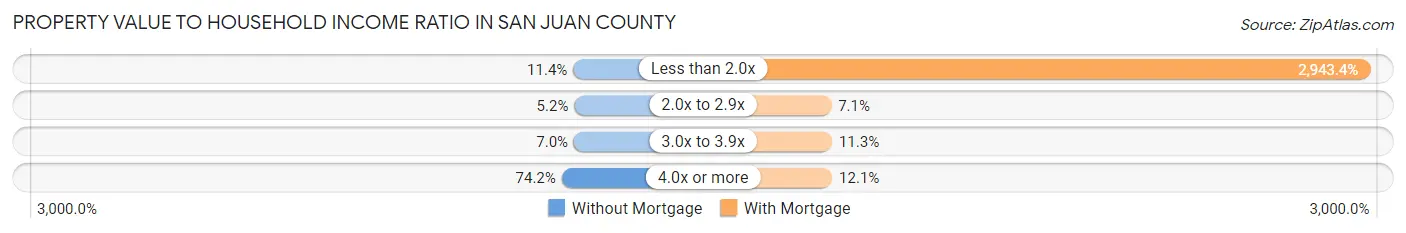
| Value-to-Income Ratio | Without Mortgage | With Mortgage |
| Less than 2.0x | 366 (11.4%) | 102,520 (2,943.4%) |
| 2.0x to 2.9x | 169 (5.2%) | 247 (7.1%) |
| 3.0x to 3.9x | 225 (7.0%) | 393 (11.3%) |
| 4.0x or more | 2,395 (74.2%) | 420 (12.1%) |
| Total | 3,226 (100.0%) | 3,483 (100.0%) |
Real Estate Taxes by Mortgage Status in San Juan County
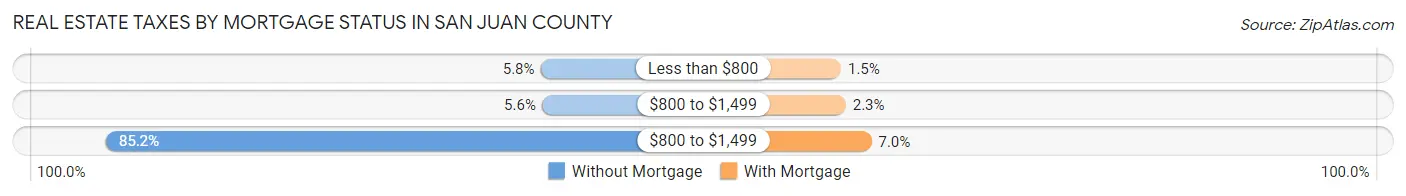
| Property Taxes | Without Mortgage | With Mortgage |
| Less than $800 | 187 (5.8%) | 51 (1.5%) |
| $800 to $1,499 | 179 (5.6%) | 81 (2.3%) |
| $800 to $1,499 | 2,747 (85.2%) | 245 (7.0%) |
| Total | 3,226 (100.0%) | 3,483 (100.0%) |
Health & Disability in San Juan County
Health Insurance Coverage by Age in San Juan County
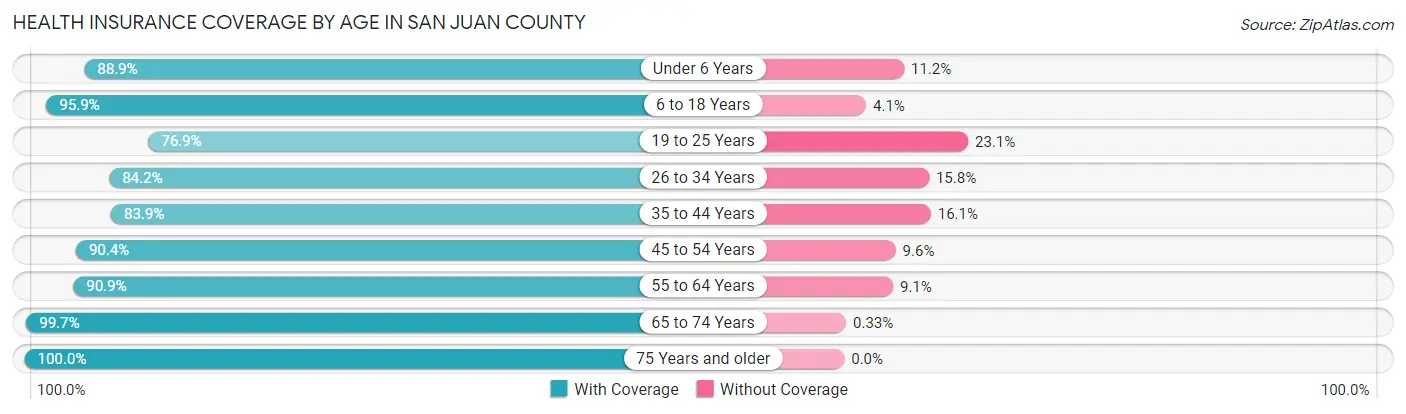
| Age Bracket | With Coverage | Without Coverage |
| Under 6 Years | 534 (88.8%) | 67 (11.2%) |
| 6 to 18 Years | 1,792 (95.9%) | 76 (4.1%) |
| 19 to 25 Years | 627 (76.9%) | 188 (23.1%) |
| 26 to 34 Years | 1,141 (84.2%) | 214 (15.8%) |
| 35 to 44 Years | 1,591 (83.9%) | 306 (16.1%) |
| 45 to 54 Years | 1,830 (90.4%) | 194 (9.6%) |
| 55 to 64 Years | 2,900 (90.9%) | 290 (9.1%) |
| 65 to 74 Years | 3,883 (99.7%) | 13 (0.3%) |
| 75 Years and older | 2,278 (100.0%) | 0 (0.0%) |
| Total | 16,576 (92.5%) | 1,348 (7.5%) |
Health Insurance Coverage by Citizenship Status in San Juan County
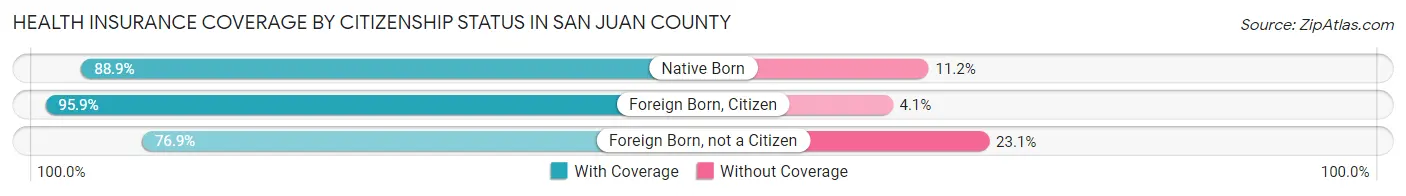
| Citizenship Status | With Coverage | Without Coverage |
| Native Born | 534 (88.8%) | 67 (11.2%) |
| Foreign Born, Citizen | 1,792 (95.9%) | 76 (4.1%) |
| Foreign Born, not a Citizen | 627 (76.9%) | 188 (23.1%) |
Health Insurance Coverage by Household Income in San Juan County
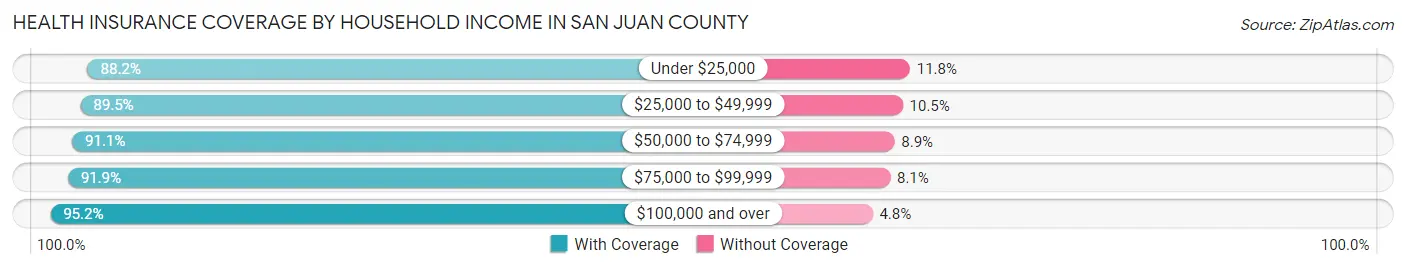
| Household Income | With Coverage | Without Coverage |
| Under $25,000 | 1,732 (88.2%) | 232 (11.8%) |
| $25,000 to $49,999 | 2,234 (89.5%) | 261 (10.5%) |
| $50,000 to $74,999 | 2,557 (91.1%) | 250 (8.9%) |
| $75,000 to $99,999 | 2,201 (91.9%) | 194 (8.1%) |
| $100,000 and over | 7,743 (95.2%) | 391 (4.8%) |
Public vs Private Health Insurance Coverage by Age in San Juan County
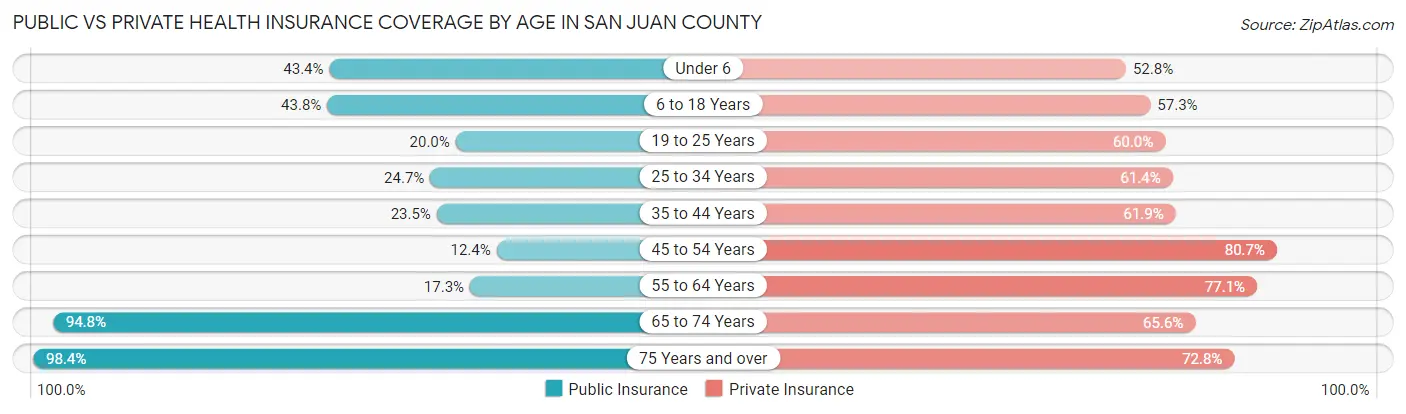
| Age Bracket | Public Insurance | Private Insurance |
| Under 6 | 261 (43.4%) | 317 (52.7%) |
| 6 to 18 Years | 819 (43.8%) | 1,070 (57.3%) |
| 19 to 25 Years | 163 (20.0%) | 489 (60.0%) |
| 25 to 34 Years | 335 (24.7%) | 832 (61.4%) |
| 35 to 44 Years | 446 (23.5%) | 1,175 (61.9%) |
| 45 to 54 Years | 251 (12.4%) | 1,634 (80.7%) |
| 55 to 64 Years | 553 (17.3%) | 2,458 (77.0%) |
| 65 to 74 Years | 3,692 (94.8%) | 2,555 (65.6%) |
| 75 Years and over | 2,242 (98.4%) | 1,659 (72.8%) |
| Total | 8,762 (48.9%) | 12,189 (68.0%) |
Disability Status by Sex by Age in San Juan County
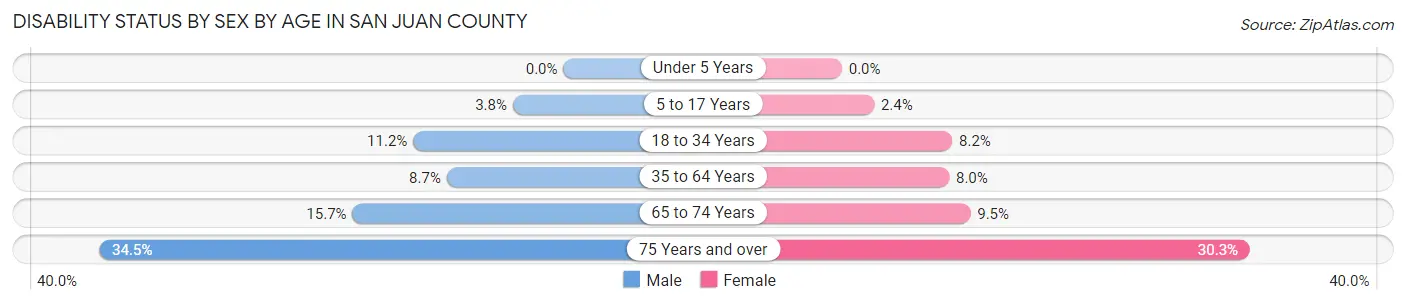
| Age Bracket | Male | Female |
| Under 5 Years | 0 (0.0%) | 0 (0.0%) |
| 5 to 17 Years | 34 (3.7%) | 21 (2.4%) |
| 18 to 34 Years | 130 (11.2%) | 97 (8.2%) |
| 35 to 64 Years | 300 (8.7%) | 290 (8.0%) |
| 65 to 74 Years | 295 (15.7%) | 192 (9.5%) |
| 75 Years and over | 395 (34.5%) | 343 (30.3%) |
Disability Class by Sex by Age in San Juan County
Disability Class: Hearing Difficulty
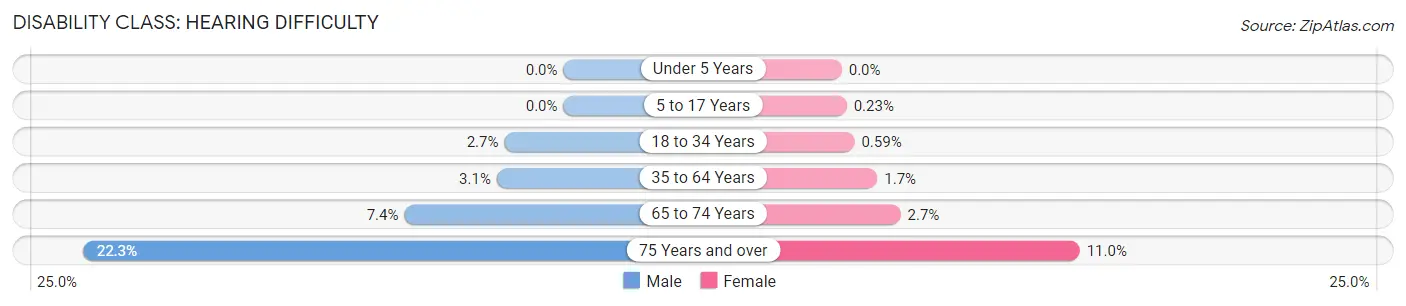
| Age Bracket | Male | Female |
| Under 5 Years | 0 (0.0%) | 0 (0.0%) |
| 5 to 17 Years | 0 (0.0%) | 2 (0.2%) |
| 18 to 34 Years | 32 (2.7%) | 7 (0.6%) |
| 35 to 64 Years | 107 (3.1%) | 60 (1.7%) |
| 65 to 74 Years | 139 (7.4%) | 55 (2.7%) |
| 75 Years and over | 255 (22.3%) | 125 (11.0%) |
Disability Class: Vision Difficulty
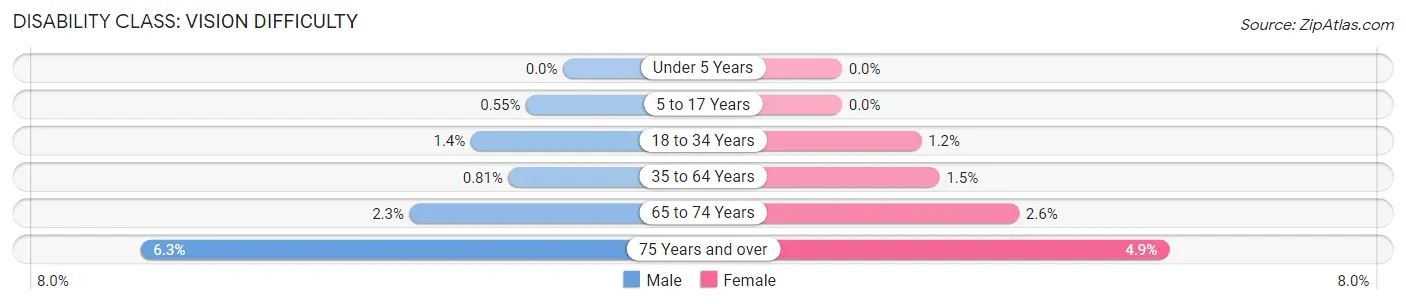
| Age Bracket | Male | Female |
| Under 5 Years | 0 (0.0%) | 0 (0.0%) |
| 5 to 17 Years | 5 (0.5%) | 0 (0.0%) |
| 18 to 34 Years | 16 (1.4%) | 14 (1.2%) |
| 35 to 64 Years | 28 (0.8%) | 53 (1.5%) |
| 65 to 74 Years | 43 (2.3%) | 53 (2.6%) |
| 75 Years and over | 72 (6.3%) | 55 (4.9%) |
Disability Class: Cognitive Difficulty
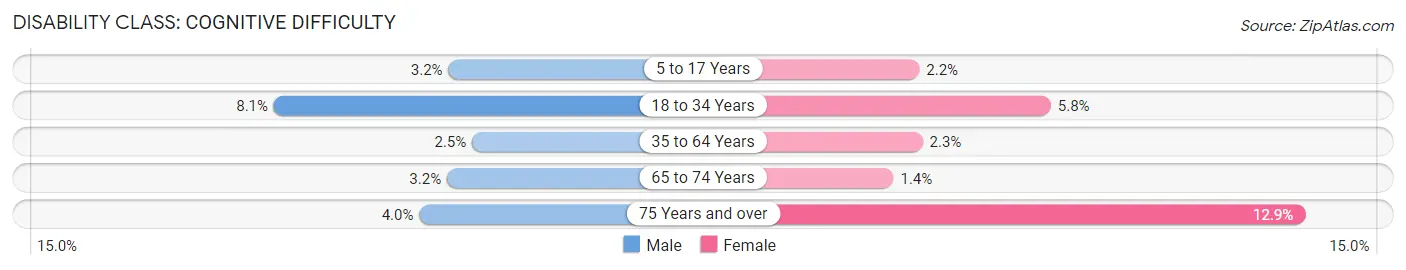
| Age Bracket | Male | Female |
| 5 to 17 Years | 29 (3.2%) | 19 (2.2%) |
| 18 to 34 Years | 94 (8.1%) | 69 (5.8%) |
| 35 to 64 Years | 88 (2.5%) | 82 (2.2%) |
| 65 to 74 Years | 61 (3.2%) | 29 (1.4%) |
| 75 Years and over | 46 (4.0%) | 146 (12.9%) |
Disability Class: Ambulatory Difficulty
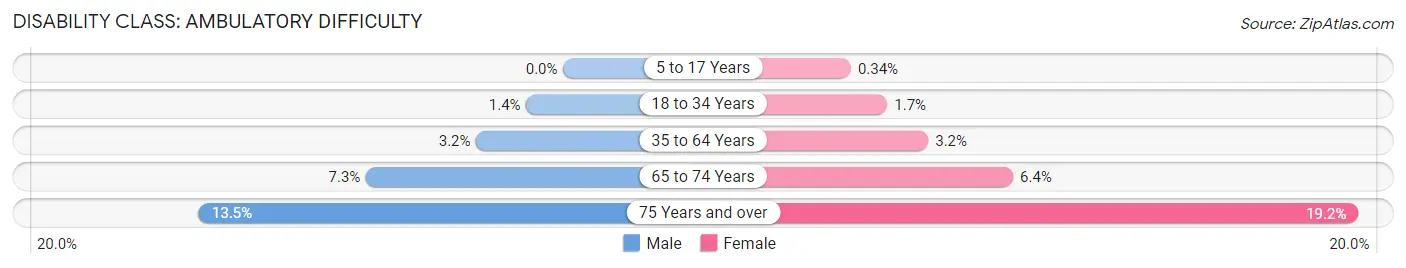
| Age Bracket | Male | Female |
| 5 to 17 Years | 0 (0.0%) | 3 (0.3%) |
| 18 to 34 Years | 16 (1.4%) | 20 (1.7%) |
| 35 to 64 Years | 112 (3.2%) | 117 (3.2%) |
| 65 to 74 Years | 138 (7.3%) | 128 (6.4%) |
| 75 Years and over | 155 (13.5%) | 217 (19.2%) |
Disability Class: Self-Care Difficulty
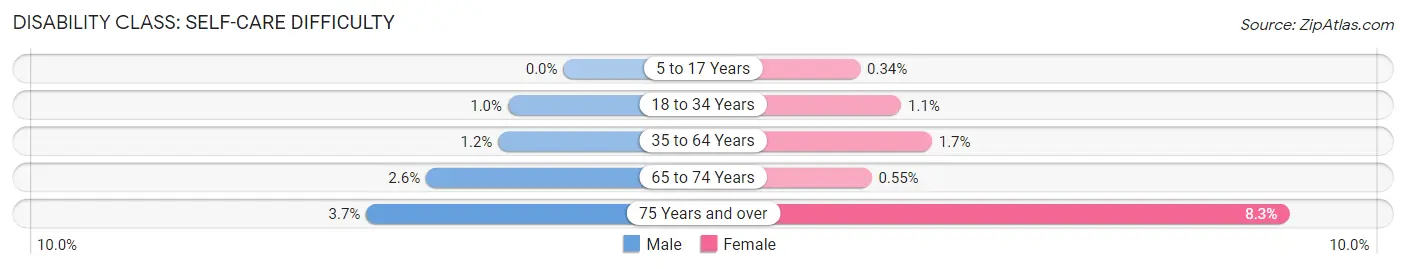
| Age Bracket | Male | Female |
| 5 to 17 Years | 0 (0.0%) | 3 (0.3%) |
| 18 to 34 Years | 12 (1.0%) | 13 (1.1%) |
| 35 to 64 Years | 42 (1.2%) | 61 (1.7%) |
| 65 to 74 Years | 48 (2.5%) | 11 (0.5%) |
| 75 Years and over | 42 (3.7%) | 94 (8.3%) |
Technology Access in San Juan County
Computing Device Access in San Juan County
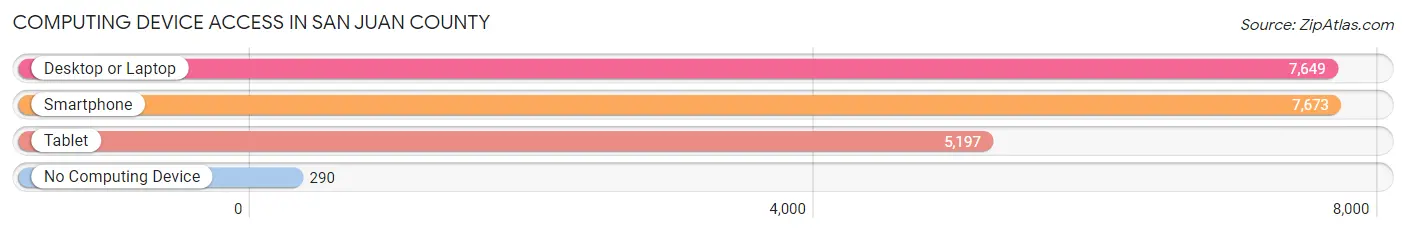
| Device Type | # Households | % Households |
| Desktop or Laptop | 7,649 | 88.4% |
| Smartphone | 7,673 | 88.7% |
| Tablet | 5,197 | 60.1% |
| No Computing Device | 290 | 3.4% |
| Total | 8,654 | 100.0% |
Internet Access in San Juan County
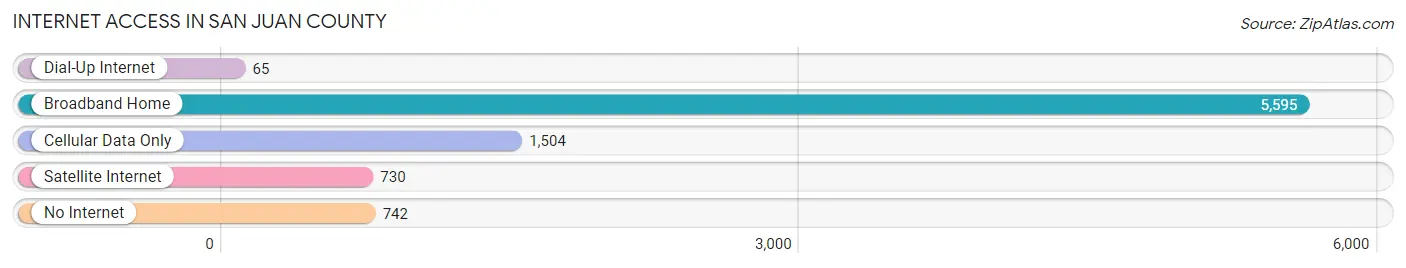
| Internet Type | # Households | % Households |
| Dial-Up Internet | 65 | 0.7% |
| Broadband Home | 5,595 | 64.6% |
| Cellular Data Only | 1,504 | 17.4% |
| Satellite Internet | 730 | 8.4% |
| No Internet | 742 | 8.6% |
| Total | 8,654 | 100.0% |
San Juan County Summary
San Juan County is located in the northwest corner of Washington State, and is the second smallest county in the state. It is bordered by Skagit County to the north, Island County to the east, and the Strait of Juan de Fuca to the west. The county is made up of four main islands: San Juan Island, Orcas Island, Lopez Island, and Shaw Island. The county seat is Friday Harbor, located on San Juan Island.
History
The San Juan Islands were first inhabited by the Coast Salish people, who lived in the area for thousands of years before the arrival of Europeans. The first Europeans to explore the islands were Spanish explorers, who named them after Juan de Fuca, a Greek navigator who explored the area in 1592.
In 1841, the United States and Great Britain signed the Oregon Treaty, which established the border between the two countries at the 49th parallel. This placed the San Juan Islands in American territory. In 1853, the US and Great Britain agreed to a joint occupation of the islands, which lasted until 1872. During this period, the islands were used for farming, fishing, and logging.
In 1872, the US and Great Britain agreed to a boundary arbitration, which awarded the islands to the United States. In 1873, San Juan County was established, and the county seat was established in Friday Harbor.
Geography
San Juan County is located in the northwest corner of Washington State, and is the second smallest county in the state. It is bordered by Skagit County to the north, Island County to the east, and the Strait of Juan de Fuca to the west. The county is made up of four main islands: San Juan Island, Orcas Island, Lopez Island, and Shaw Island. The county also includes numerous smaller islands, including Sucia Island, Matia Island, and Patos Island.
The county has a total area of 517 square miles, of which 486 square miles is land and 31 square miles is water. The highest point in the county is Mount Constitution, located on Orcas Island, which has an elevation of 2,409 feet.
Economy
The economy of San Juan County is largely based on tourism, with the islands being a popular destination for visitors from around the world. The county is also home to a number of small businesses, including restaurants, retail stores, and art galleries.
The county is also home to a number of agricultural operations, including dairy farms, fruit orchards, and vineyards. Fishing is also an important part of the local economy, with the county’s waters being home to a variety of fish, including salmon, halibut, and cod.
Demographics
As of the 2010 census, the population of San Juan County was 15,769. The population is spread out over the four main islands, with the largest population being on San Juan Island (7,921). The population is predominantly white (90.2%), with the next largest group being Hispanic or Latino (4.2%).
The median household income in the county is $60,945, and the median home value is $521,400. The unemployment rate is 4.2%, and the poverty rate is 8.2%.
Conclusion
San Juan County is a unique and beautiful part of Washington State, with a rich history and a vibrant economy. The county is home to a diverse population, and is a popular destination for visitors from around the world. With its stunning scenery, vibrant culture, and diverse economy, San Juan County is a great place to live, work, and visit.
Common Questions
What is Per Capita Income in San Juan County?
Per Capita income in San Juan County is $59,650.
What is the Median Family Income in San Juan County?
Median Family Income in San Juan County is $98,569.
What is the Median Household income in San Juan County?
Median Household Income in San Juan County is $76,745.
What is Income or Wage Gap in San Juan County?
Income or Wage Gap in San Juan County is 40.0%.
Women in San Juan County earn 60.0 cents for every dollar earned by a man.
What is Family Income Deficit in San Juan County?
Family Income Deficit in San Juan County is $11,933.
Families that are below poverty line in San Juan County earn $11,933 less on average than the poverty threshold level.
What is Inequality or Gini Index in San Juan County?
Inequality or Gini Index in San Juan County is 0.54.
What is the Total Population of San Juan County?
Total Population of San Juan County is 18,001.
What is the Total Male Population of San Juan County?
Total Male Population of San Juan County is 8,850.
What is the Total Female Population of San Juan County?
Total Female Population of San Juan County is 9,151.
What is the Ratio of Males per 100 Females in San Juan County?
There are 96.71 Males per 100 Females in San Juan County.
What is the Ratio of Females per 100 Males in San Juan County?
There are 103.40 Females per 100 Males in San Juan County.
What is the Median Population Age in San Juan County?
Median Population Age in San Juan County is 56.5 Years.
What is the Average Family Size in San Juan County
Average Family Size in San Juan County is 2.5 People.
What is the Average Household Size in San Juan County
Average Household Size in San Juan County is 2.1 People.
How Large is the Labor Force in San Juan County?
There are 8,520 People in the Labor Forcein in San Juan County.
What is the Percentage of People in the Labor Force in San Juan County?
53.2% of People are in the Labor Force in San Juan County.
What is the Unemployment Rate in San Juan County?
Unemployment Rate in San Juan County is 3.2%.