Pend Oreille County, WA Map & Demographics
Pend Oreille County Map
Pend Oreille County Overview
$33,981
PER CAPITA INCOME
$75,593
AVG FAMILY INCOME
$59,353
AVG HOUSEHOLD INCOME
31.8%
WAGE / INCOME GAP [ % ]
68.2¢/ $1
WAGE / INCOME GAP [ $ ]
$10,334
FAMILY INCOME DEFICIT
0.43
INEQUALITY / GINI INDEX
13,570
TOTAL POPULATION
7,057
MALE POPULATION
6,513
FEMALE POPULATION
108.35
MALES / 100 FEMALES
92.29
FEMALES / 100 MALES
50.4
MEDIAN AGE
2.7
AVG FAMILY SIZE
2.3
AVG HOUSEHOLD SIZE
5,256
LABOR FORCE [ PEOPLE ]
46.7%
PERCENT IN LABOR FORCE
6.1%
UNEMPLOYMENT RATE
Pend Oreille County Area Codes
Income in Pend Oreille County
Income Overview in Pend Oreille County
Per Capita Income in Pend Oreille County is $33,981, while median incomes of families and households are $75,593 and $59,353 respectively.
| Characteristic | Number | Measure |
| Per Capita Income | 13,570 | $33,981 |
| Median Family Income | 3,956 | $75,593 |
| Mean Family Income | 3,956 | $93,682 |
| Median Household Income | 5,737 | $59,353 |
| Mean Household Income | 5,737 | $81,442 |
| Income Deficit | 3,956 | $10,334 |
| Wage / Income Gap (%) | 13,570 | 31.79% |
| Wage / Income Gap ($) | 13,570 | 68.21¢ per $1 |
| Gini / Inequality Index | 13,570 | 0.43 |
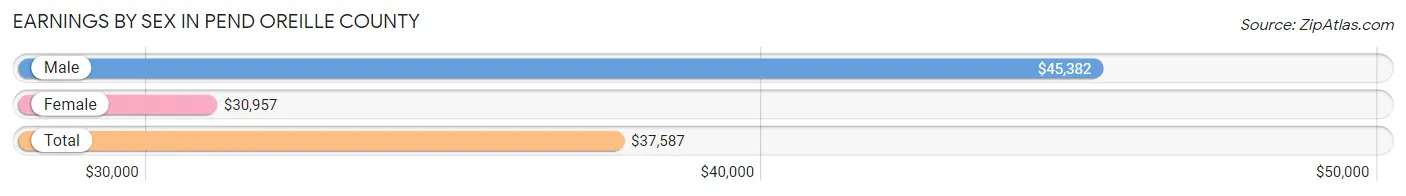
Earnings by Sex in Pend Oreille County
Average Earnings in Pend Oreille County are $37,587, $45,382 for men and $30,957 for women, a difference of 31.8%.
| Sex | Number | Average Earnings |
| Male | 3,093 (55.2%) | $45,382 |
| Female | 2,510 (44.8%) | $30,957 |
| Total | 5,603 (100.0%) | $37,587 |
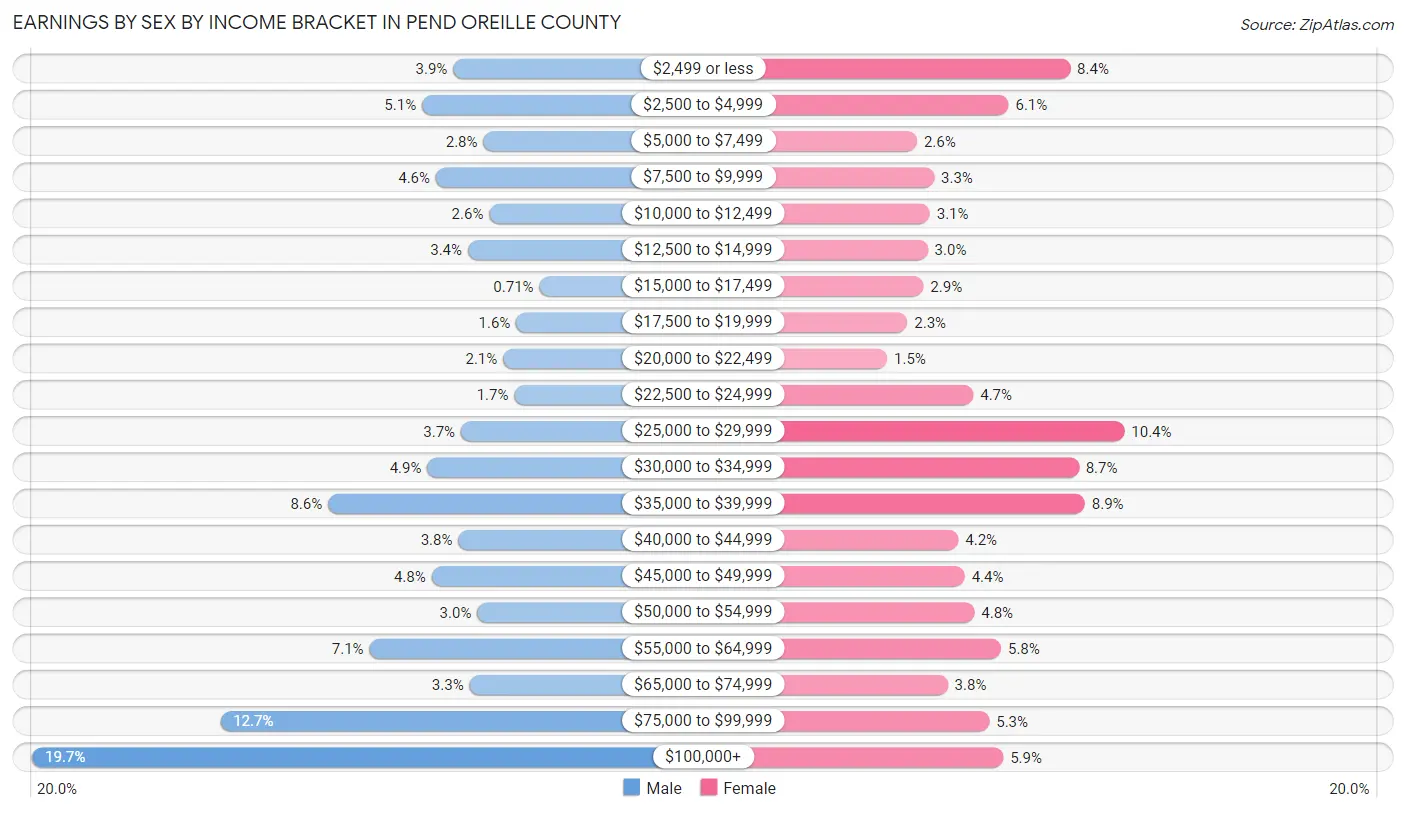
Earnings by Sex by Income Bracket in Pend Oreille County
The most common earnings brackets in Pend Oreille County are $100,000+ for men (610 | 19.7%) and $25,000 to $29,999 for women (261 | 10.4%).
| Income | Male | Female |
| $2,499 or less | 122 (3.9%) | 210 (8.4%) |
| $2,500 to $4,999 | 158 (5.1%) | 152 (6.1%) |
| $5,000 to $7,499 | 87 (2.8%) | 66 (2.6%) |
| $7,500 to $9,999 | 142 (4.6%) | 82 (3.3%) |
| $10,000 to $12,499 | 80 (2.6%) | 78 (3.1%) |
| $12,500 to $14,999 | 105 (3.4%) | 76 (3.0%) |
| $15,000 to $17,499 | 22 (0.7%) | 72 (2.9%) |
| $17,500 to $19,999 | 49 (1.6%) | 57 (2.3%) |
| $20,000 to $22,499 | 64 (2.1%) | 38 (1.5%) |
| $22,500 to $24,999 | 51 (1.7%) | 119 (4.7%) |
| $25,000 to $29,999 | 113 (3.6%) | 261 (10.4%) |
| $30,000 to $34,999 | 152 (4.9%) | 218 (8.7%) |
| $35,000 to $39,999 | 267 (8.6%) | 224 (8.9%) |
| $40,000 to $44,999 | 116 (3.7%) | 105 (4.2%) |
| $45,000 to $49,999 | 147 (4.8%) | 111 (4.4%) |
| $50,000 to $54,999 | 94 (3.0%) | 120 (4.8%) |
| $55,000 to $64,999 | 219 (7.1%) | 145 (5.8%) |
| $65,000 to $74,999 | 103 (3.3%) | 95 (3.8%) |
| $75,000 to $99,999 | 392 (12.7%) | 134 (5.3%) |
| $100,000+ | 610 (19.7%) | 147 (5.9%) |
| Total | 3,093 (100.0%) | 2,510 (100.0%) |
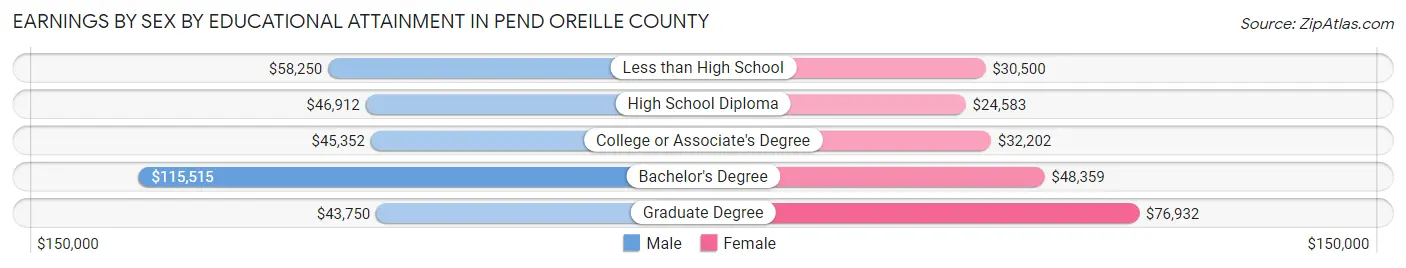
Earnings by Sex by Educational Attainment in Pend Oreille County
Average earnings in Pend Oreille County are $53,305 for men and $33,653 for women, a difference of 36.9%. Men with an educational attainment of bachelor's degree enjoy the highest average annual earnings of $115,515, while those with graduate degree education earn the least with $43,750. Women with an educational attainment of graduate degree earn the most with the average annual earnings of $76,932, while those with high school diploma education have the smallest earnings of $24,583.
| Educational Attainment | Male Income | Female Income |
| Less than High School | $58,250 | $30,500 |
| High School Diploma | $46,912 | $24,583 |
| College or Associate's Degree | $45,352 | $32,202 |
| Bachelor's Degree | $115,515 | $48,359 |
| Graduate Degree | $43,750 | $76,932 |
| Total | $53,305 | $33,653 |
Family Income in Pend Oreille County
Family Income Brackets in Pend Oreille County
According to the Pend Oreille County family income data, there are 752 families falling into the $75,000 to $99,999 income range, which is the most common income bracket and makes up 19.0% of all families. Conversely, the $10,000 to $14,999 income bracket is the least frequent group with only 83 families (2.1%) belonging to this category.
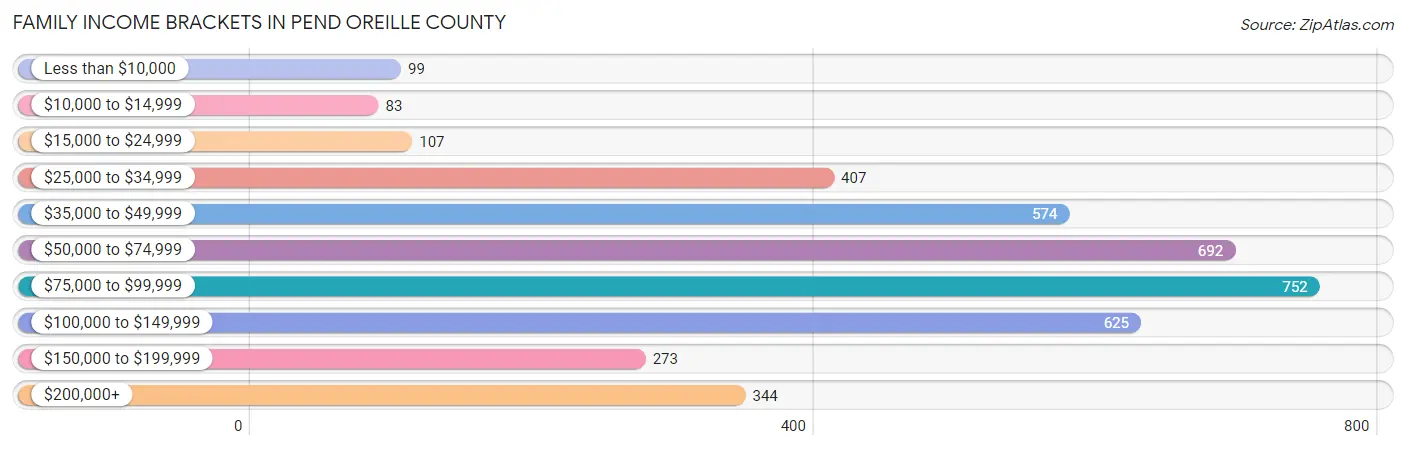
| Income Bracket | # Families | % Families |
| Less than $10,000 | 99 | 2.5% |
| $10,000 to $14,999 | 83 | 2.1% |
| $15,000 to $24,999 | 107 | 2.7% |
| $25,000 to $34,999 | 407 | 10.3% |
| $35,000 to $49,999 | 574 | 14.5% |
| $50,000 to $74,999 | 692 | 17.5% |
| $75,000 to $99,999 | 752 | 19.0% |
| $100,000 to $149,999 | 625 | 15.8% |
| $150,000 to $199,999 | 273 | 6.9% |
| $200,000+ | 344 | 8.7% |
Family Income by Famaliy Size in Pend Oreille County
6-person families (58 | 1.5%) account for the highest median family income in Pend Oreille County with $120,500 per family, while 2-person families (2,378 | 60.1%) have the highest median income of $33,510 per family member.
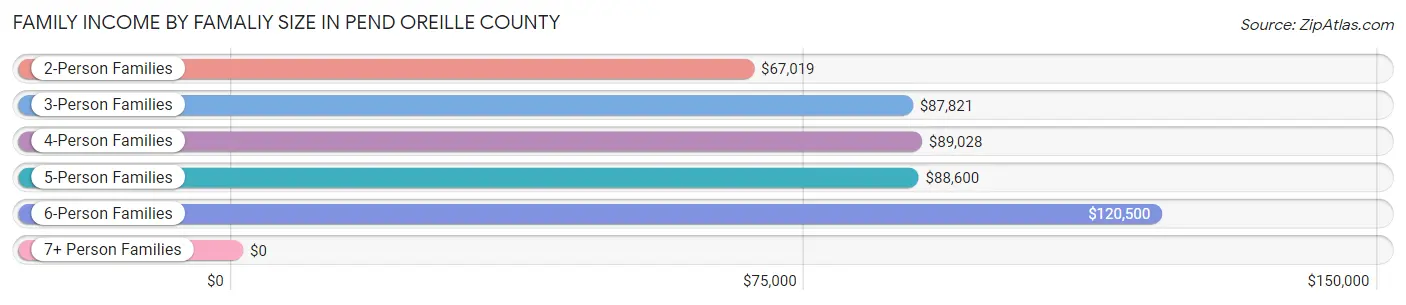
| Income Bracket | # Families | Median Income |
| 2-Person Families | 2,378 (60.1%) | $67,019 |
| 3-Person Families | 841 (21.3%) | $87,821 |
| 4-Person Families | 400 (10.1%) | $89,028 |
| 5-Person Families | 222 (5.6%) | $88,600 |
| 6-Person Families | 58 (1.5%) | $120,500 |
| 7+ Person Families | 57 (1.4%) | $0 |
| Total | 3,956 (100.0%) | $75,593 |
Family Income by Number of Earners in Pend Oreille County
The median family income in Pend Oreille County is $75,593, with families comprising 3+ earners (273) having the highest median family income of $122,375, while families with no earners (1,082) have the lowest median family income of $53,514, accounting for 6.9% and 27.4% of families, respectively.
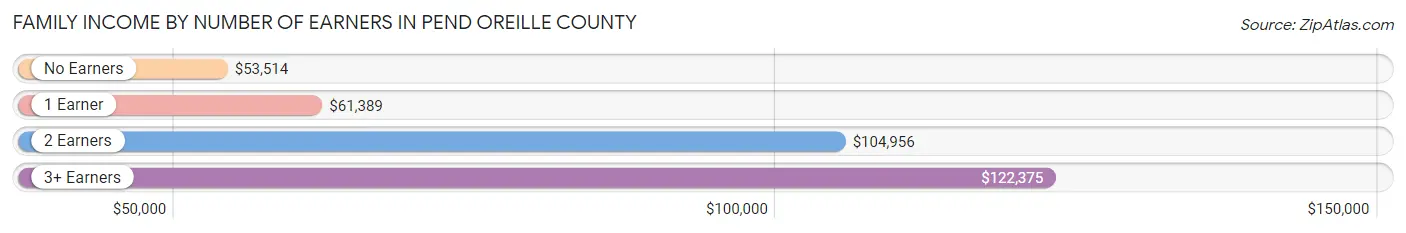
| Number of Earners | # Families | Median Income |
| No Earners | 1,082 (27.4%) | $53,514 |
| 1 Earner | 1,546 (39.1%) | $61,389 |
| 2 Earners | 1,055 (26.7%) | $104,956 |
| 3+ Earners | 273 (6.9%) | $122,375 |
| Total | 3,956 (100.0%) | $75,593 |
Household Income in Pend Oreille County
Household Income Brackets in Pend Oreille County
With 964 households falling in the category, the $50,000 to $74,999 income range is the most frequent in Pend Oreille County, accounting for 16.8% of all households. In contrast, only 184 households (3.2%) fall into the $10,000 to $14,999 income bracket, making it the least populous group.
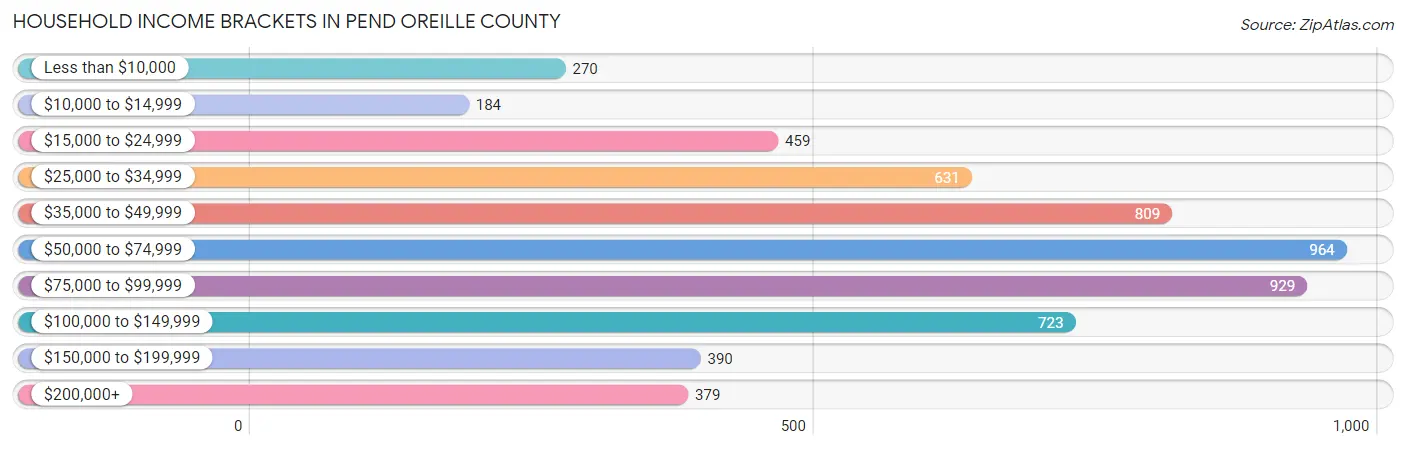
| Income Bracket | # Households | % Households |
| Less than $10,000 | 270 | 4.7% |
| $10,000 to $14,999 | 184 | 3.2% |
| $15,000 to $24,999 | 459 | 8.0% |
| $25,000 to $34,999 | 631 | 11.0% |
| $35,000 to $49,999 | 809 | 14.1% |
| $50,000 to $74,999 | 964 | 16.8% |
| $75,000 to $99,999 | 929 | 16.2% |
| $100,000 to $149,999 | 723 | 12.6% |
| $150,000 to $199,999 | 390 | 6.8% |
| $200,000+ | 379 | 6.6% |
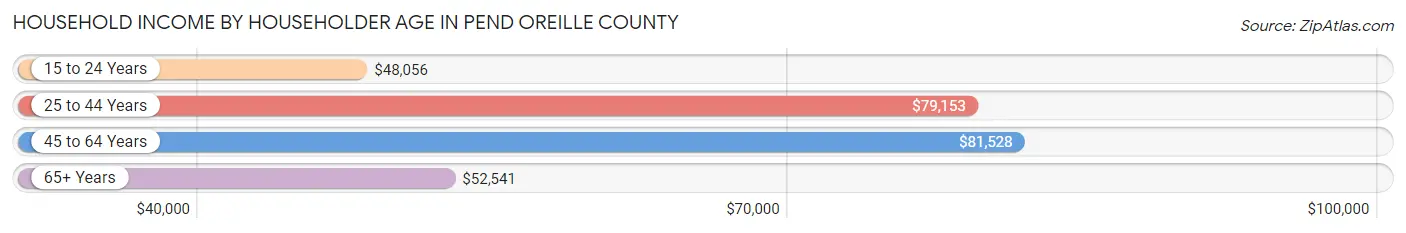
Household Income by Householder Age in Pend Oreille County
The median household income in Pend Oreille County is $59,353, with the highest median household income of $81,528 found in the 45 to 64 years age bracket for the primary householder. A total of 2,191 households (38.2%) fall into this category. Meanwhile, the 15 to 24 years age bracket for the primary householder has the lowest median household income of $48,056, with 202 households (3.5%) in this group.
| Income Bracket | # Households | Median Income |
| 15 to 24 Years | 202 (3.5%) | $48,056 |
| 25 to 44 Years | 1,079 (18.8%) | $79,153 |
| 45 to 64 Years | 2,191 (38.2%) | $81,528 |
| 65+ Years | 2,265 (39.5%) | $52,541 |
| Total | 5,737 (100.0%) | $59,353 |
Poverty in Pend Oreille County
Income Below Poverty by Sex and Age in Pend Oreille County
With 13.1% poverty level for males and 12.7% for females among the residents of Pend Oreille County, 16 and 17 year old males and 12 to 14 year old females are the most vulnerable to poverty, with 83 males (49.4%) and 44 females (23.4%) in their respective age groups living below the poverty level.
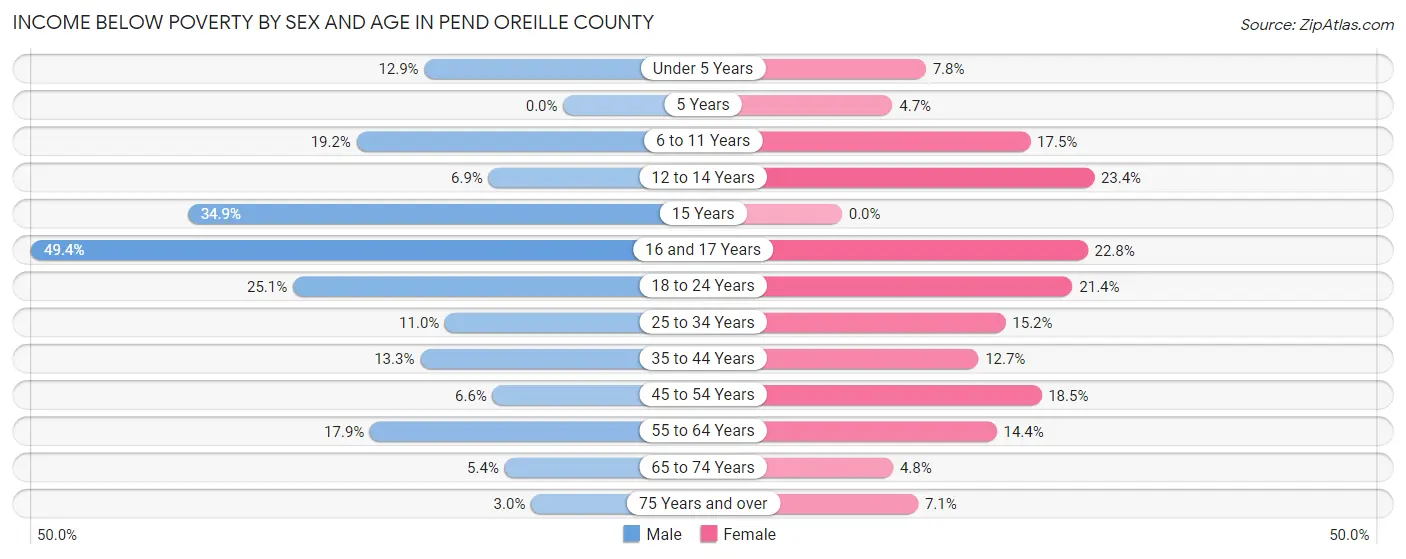
| Age Bracket | Male | Female |
| Under 5 Years | 33 (12.9%) | 25 (7.8%) |
| 5 Years | 0 (0.0%) | 6 (4.7%) |
| 6 to 11 Years | 80 (19.2%) | 61 (17.5%) |
| 12 to 14 Years | 16 (6.9%) | 44 (23.4%) |
| 15 Years | 61 (34.9%) | 0 (0.0%) |
| 16 and 17 Years | 83 (49.4%) | 26 (22.8%) |
| 18 to 24 Years | 139 (25.1%) | 95 (21.4%) |
| 25 to 34 Years | 67 (11.0%) | 92 (15.2%) |
| 35 to 44 Years | 79 (13.3%) | 77 (12.7%) |
| 45 to 54 Years | 53 (6.6%) | 129 (18.5%) |
| 55 to 64 Years | 211 (17.9%) | 170 (14.4%) |
| 65 to 74 Years | 67 (5.4%) | 52 (4.8%) |
| 75 Years and over | 18 (3.0%) | 46 (7.1%) |
| Total | 907 (13.1%) | 823 (12.7%) |
Income Above Poverty by Sex and Age in Pend Oreille County
According to the poverty statistics in Pend Oreille County, males aged 5 years and females aged 15 years are the age groups that are most secure financially, with 100.0% of males and 100.0% of females in these age groups living above the poverty line.
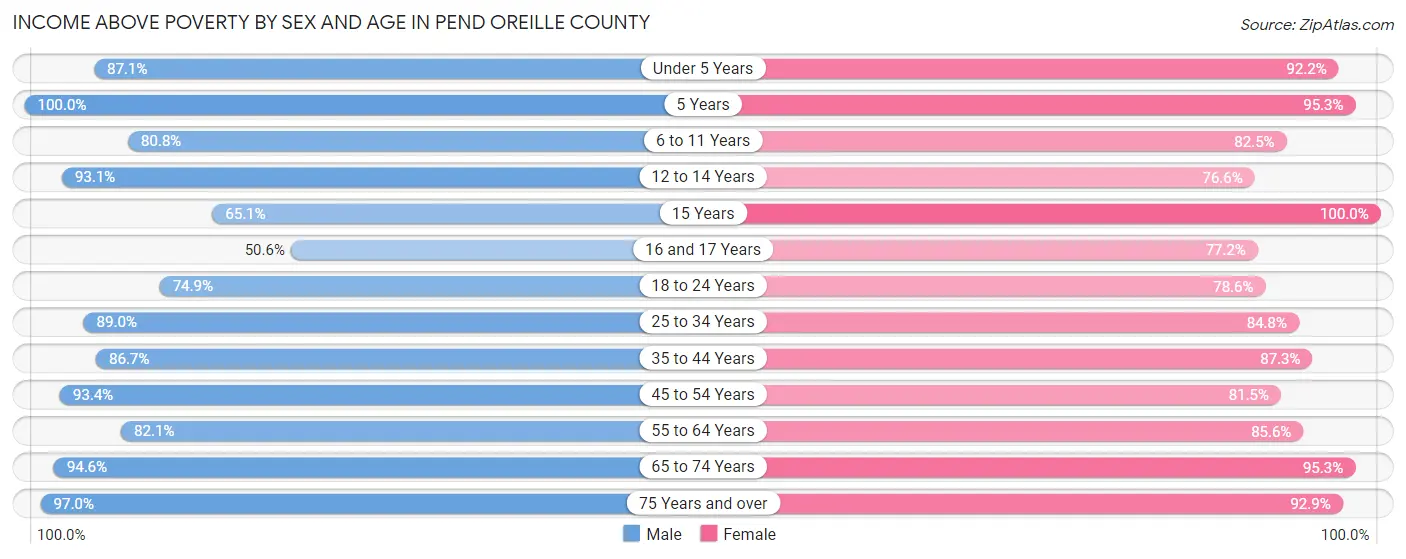
| Age Bracket | Male | Female |
| Under 5 Years | 223 (87.1%) | 296 (92.2%) |
| 5 Years | 89 (100.0%) | 122 (95.3%) |
| 6 to 11 Years | 337 (80.8%) | 288 (82.5%) |
| 12 to 14 Years | 215 (93.1%) | 144 (76.6%) |
| 15 Years | 114 (65.1%) | 80 (100.0%) |
| 16 and 17 Years | 85 (50.6%) | 88 (77.2%) |
| 18 to 24 Years | 415 (74.9%) | 349 (78.6%) |
| 25 to 34 Years | 544 (89.0%) | 514 (84.8%) |
| 35 to 44 Years | 516 (86.7%) | 531 (87.3%) |
| 45 to 54 Years | 755 (93.4%) | 568 (81.5%) |
| 55 to 64 Years | 966 (82.1%) | 1,014 (85.6%) |
| 65 to 74 Years | 1,164 (94.6%) | 1,043 (95.3%) |
| 75 Years and over | 586 (97.0%) | 605 (92.9%) |
| Total | 6,009 (86.9%) | 5,642 (87.3%) |
Income Below Poverty Among Married-Couple Families in Pend Oreille County
The poverty statistics for married-couple families in Pend Oreille County show that 4.8% or 139 of the total 2,883 families live below the poverty line. Families with 3 or 4 children have the highest poverty rate of 31.5%, comprising of 39 families. On the other hand, families with 5 or more children have the lowest poverty rate of 0.0%, which includes 0 families.
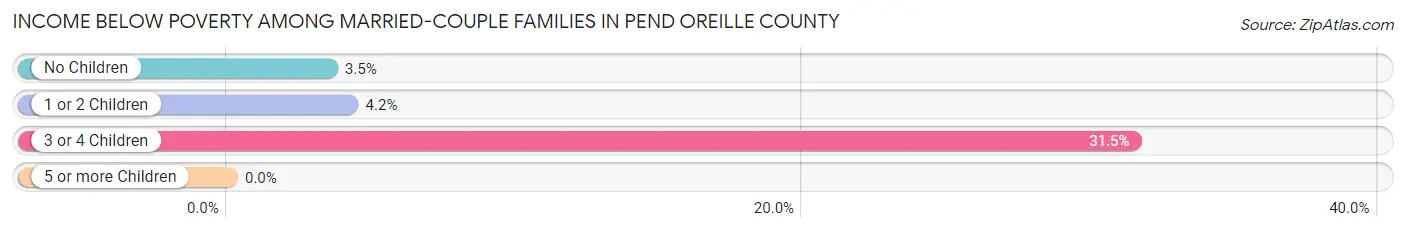
| Children | Above Poverty | Below Poverty |
| No Children | 1,997 (96.5%) | 72 (3.5%) |
| 1 or 2 Children | 639 (95.8%) | 28 (4.2%) |
| 3 or 4 Children | 85 (68.5%) | 39 (31.5%) |
| 5 or more Children | 23 (100.0%) | 0 (0.0%) |
| Total | 2,744 (95.2%) | 139 (4.8%) |
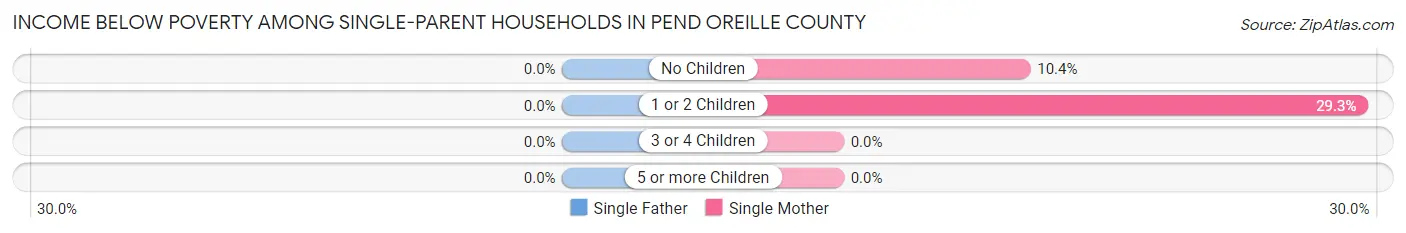
Income Below Poverty Among Single-Parent Households in Pend Oreille County
| Children | Single Father | Single Mother |
| No Children | 0 (0.0%) | 34 (10.4%) |
| 1 or 2 Children | 0 (0.0%) | 85 (29.3%) |
| 3 or 4 Children | 0 (0.0%) | 0 (0.0%) |
| 5 or more Children | 0 (0.0%) | 0 (0.0%) |
| Total | 0 (0.0%) | 119 (18.5%) |
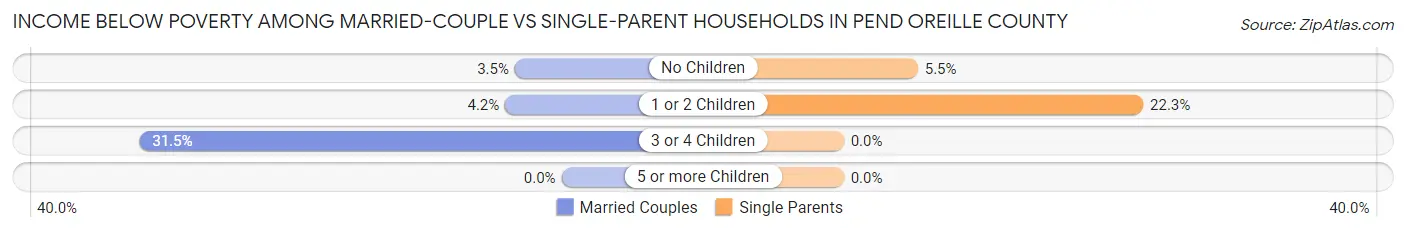
Income Below Poverty Among Married-Couple vs Single-Parent Households in Pend Oreille County
The poverty data for Pend Oreille County shows that 139 of the married-couple family households (4.8%) and 119 of the single-parent households (11.1%) are living below the poverty level. Within the married-couple family households, those with 3 or 4 children have the highest poverty rate, with 39 households (31.5%) falling below the poverty line. Among the single-parent households, those with 1 or 2 children have the highest poverty rate, with 85 household (22.3%) living below poverty.
| Children | Married-Couple Families | Single-Parent Households |
| No Children | 72 (3.5%) | 34 (5.5%) |
| 1 or 2 Children | 28 (4.2%) | 85 (22.3%) |
| 3 or 4 Children | 39 (31.5%) | 0 (0.0%) |
| 5 or more Children | 0 (0.0%) | 0 (0.0%) |
| Total | 139 (4.8%) | 119 (11.1%) |
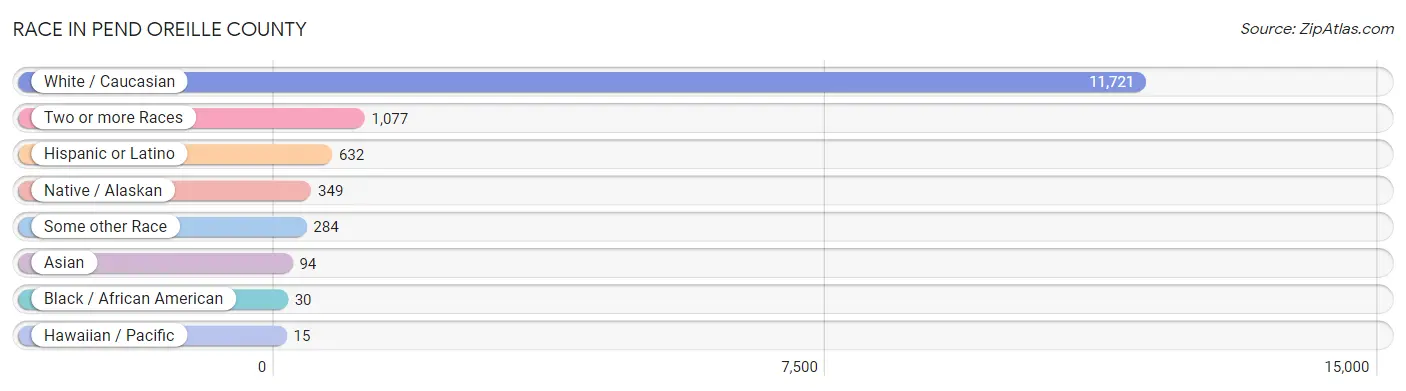
Race in Pend Oreille County
The most populous races in Pend Oreille County are White / Caucasian (11,721 | 86.4%), Two or more Races (1,077 | 7.9%), and Hispanic or Latino (632 | 4.7%).
| Race | # Population | % Population |
| Asian | 94 | 0.7% |
| Black / African American | 30 | 0.2% |
| Hawaiian / Pacific | 15 | 0.1% |
| Hispanic or Latino | 632 | 4.7% |
| Native / Alaskan | 349 | 2.6% |
| White / Caucasian | 11,721 | 86.4% |
| Two or more Races | 1,077 | 7.9% |
| Some other Race | 284 | 2.1% |
| Total | 13,570 | 100.0% |
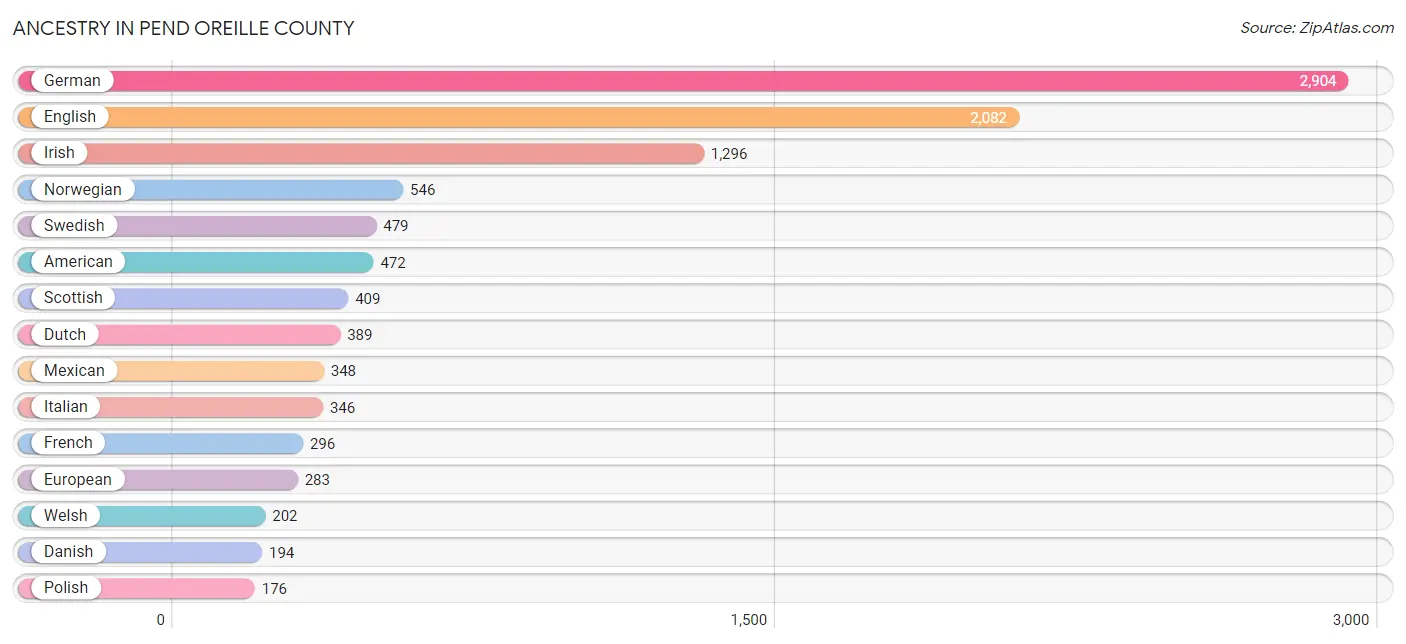
Ancestry in Pend Oreille County
The most populous ancestries reported in Pend Oreille County are German (2,904 | 21.4%), English (2,082 | 15.3%), Irish (1,296 | 9.6%), Norwegian (546 | 4.0%), and Swedish (479 | 3.5%), together accounting for 53.8% of all Pend Oreille County residents.
| Ancestry | # Population | % Population |
| American | 472 | 3.5% |
| Armenian | 7 | 0.1% |
| Assyrian / Chaldean / Syriac | 9 | 0.1% |
| Austrian | 4 | 0.0% |
| Belgian | 22 | 0.2% |
| Bhutanese | 89 | 0.7% |
| Blackfeet | 21 | 0.2% |
| British | 156 | 1.1% |
| Canadian | 37 | 0.3% |
| Central American | 67 | 0.5% |
| Cherokee | 83 | 0.6% |
| Chilean | 8 | 0.1% |
| Chippewa | 8 | 0.1% |
| Choctaw | 10 | 0.1% |
| Colville | 37 | 0.3% |
| Comanche | 2 | 0.0% |
| Croatian | 23 | 0.2% |
| Cuban | 35 | 0.3% |
| Czech | 171 | 1.3% |
| Czechoslovakian | 5 | 0.0% |
| Danish | 194 | 1.4% |
| Dutch | 389 | 2.9% |
| English | 2,082 | 15.3% |
| European | 283 | 2.1% |
| Finnish | 57 | 0.4% |
| French | 296 | 2.2% |
| French American Indian | 23 | 0.2% |
| French Canadian | 89 | 0.7% |
| German | 2,904 | 21.4% |
| Guamanian / Chamorro | 3 | 0.0% |
| Honduran | 9 | 0.1% |
| Hungarian | 16 | 0.1% |
| Icelander | 20 | 0.2% |
| Irish | 1,296 | 9.6% |
| Iroquois | 8 | 0.1% |
| Italian | 346 | 2.5% |
| Jamaican | 3 | 0.0% |
| Kenyan | 1 | 0.0% |
| Korean | 89 | 0.7% |
| Laotian | 12 | 0.1% |
| Lithuanian | 7 | 0.1% |
| Luxembourger | 1 | 0.0% |
| Mexican | 348 | 2.6% |
| Native Hawaiian | 4 | 0.0% |
| Nicaraguan | 58 | 0.4% |
| Northern European | 68 | 0.5% |
| Norwegian | 546 | 4.0% |
| Pakistani | 7 | 0.1% |
| Pennsylvania German | 15 | 0.1% |
| Polish | 176 | 1.3% |
| Portuguese | 104 | 0.8% |
| Potawatomi | 21 | 0.2% |
| Romanian | 7 | 0.1% |
| Russian | 55 | 0.4% |
| Samoan | 12 | 0.1% |
| Scandinavian | 158 | 1.2% |
| Scotch-Irish | 149 | 1.1% |
| Scottish | 409 | 3.0% |
| Shoshone | 89 | 0.7% |
| Sioux | 42 | 0.3% |
| Slavic | 5 | 0.0% |
| South American | 9 | 0.1% |
| Spaniard | 78 | 0.6% |
| Spanish | 86 | 0.6% |
| Sri Lankan | 13 | 0.1% |
| Subsaharan African | 1 | 0.0% |
| Swedish | 479 | 3.5% |
| Swiss | 11 | 0.1% |
| Ukrainian | 10 | 0.1% |
| Venezuelan | 1 | 0.0% |
| Welsh | 202 | 1.5% |
| Yakama | 12 | 0.1% |
| Yugoslavian | 105 | 0.8% | View All 73 Rows |
Immigrants in Pend Oreille County
The most numerous immigrant groups reported in Pend Oreille County came from Asia (105 | 0.8%), Eastern Asia (58 | 0.4%), Europe (58 | 0.4%), Japan (58 | 0.4%), and South Eastern Asia (31 | 0.2%), together accounting for 2.3% of all Pend Oreille County residents.
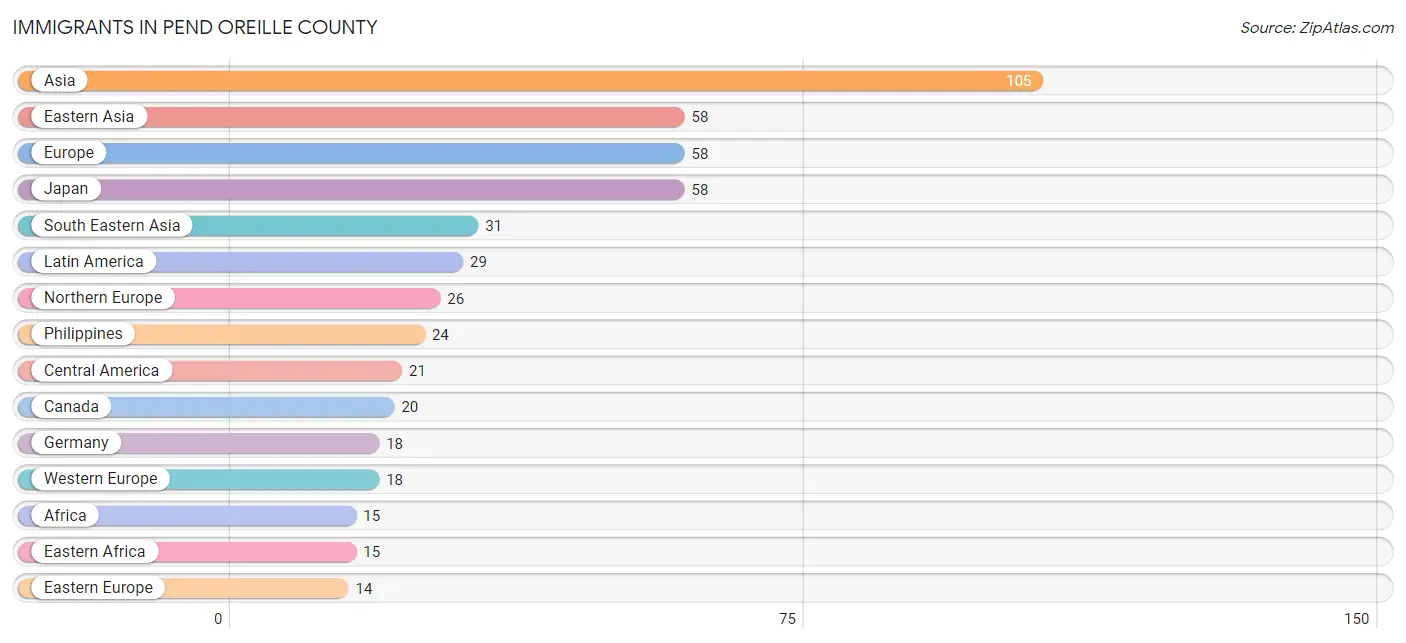
| Immigration Origin | # Population | % Population |
| Africa | 15 | 0.1% |
| Asia | 105 | 0.8% |
| Canada | 20 | 0.2% |
| Central America | 21 | 0.2% |
| Chile | 8 | 0.1% |
| Eastern Africa | 15 | 0.1% |
| Eastern Asia | 58 | 0.4% |
| Eastern Europe | 14 | 0.1% |
| Europe | 58 | 0.4% |
| Germany | 18 | 0.1% |
| Honduras | 9 | 0.1% |
| Iran | 9 | 0.1% |
| Japan | 58 | 0.4% |
| Jordan | 7 | 0.1% |
| Kenya | 1 | 0.0% |
| Latin America | 29 | 0.2% |
| Lithuania | 7 | 0.1% |
| Mexico | 12 | 0.1% |
| Northern Europe | 26 | 0.2% |
| Philippines | 24 | 0.2% |
| Romania | 7 | 0.1% |
| South America | 8 | 0.1% |
| South Central Asia | 9 | 0.1% |
| South Eastern Asia | 31 | 0.2% |
| Thailand | 7 | 0.1% |
| Western Asia | 7 | 0.1% |
| Western Europe | 18 | 0.1% |
| Zimbabwe | 14 | 0.1% | View All 28 Rows |
Sex and Age in Pend Oreille County
Sex and Age in Pend Oreille County
The most populous age groups in Pend Oreille County are 65 to 69 Years (664 | 9.4%) for men and 60 to 64 Years (724 | 11.1%) for women.
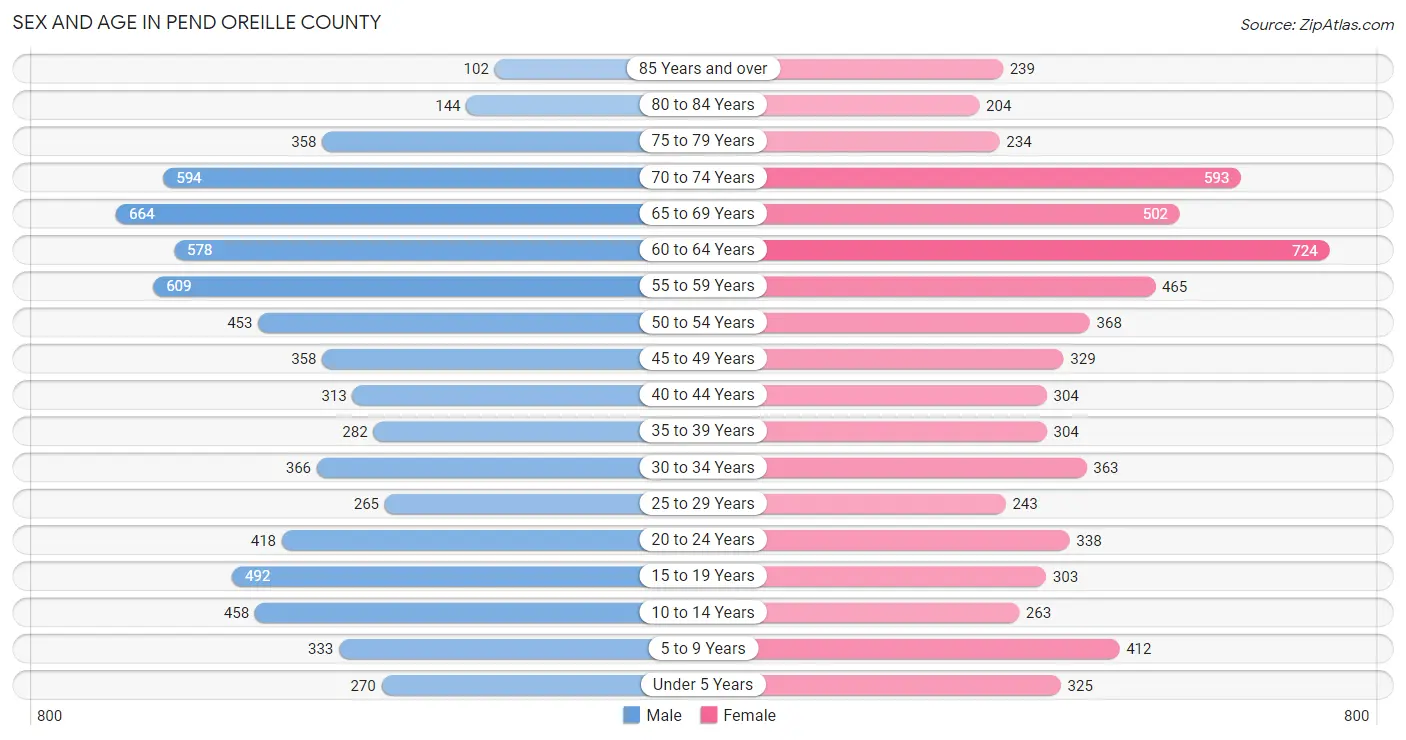
| Age Bracket | Male | Female |
| Under 5 Years | 270 (3.8%) | 325 (5.0%) |
| 5 to 9 Years | 333 (4.7%) | 412 (6.3%) |
| 10 to 14 Years | 458 (6.5%) | 263 (4.0%) |
| 15 to 19 Years | 492 (7.0%) | 303 (4.6%) |
| 20 to 24 Years | 418 (5.9%) | 338 (5.2%) |
| 25 to 29 Years | 265 (3.8%) | 243 (3.7%) |
| 30 to 34 Years | 366 (5.2%) | 363 (5.6%) |
| 35 to 39 Years | 282 (4.0%) | 304 (4.7%) |
| 40 to 44 Years | 313 (4.4%) | 304 (4.7%) |
| 45 to 49 Years | 358 (5.1%) | 329 (5.1%) |
| 50 to 54 Years | 453 (6.4%) | 368 (5.7%) |
| 55 to 59 Years | 609 (8.6%) | 465 (7.1%) |
| 60 to 64 Years | 578 (8.2%) | 724 (11.1%) |
| 65 to 69 Years | 664 (9.4%) | 502 (7.7%) |
| 70 to 74 Years | 594 (8.4%) | 593 (9.1%) |
| 75 to 79 Years | 358 (5.1%) | 234 (3.6%) |
| 80 to 84 Years | 144 (2.0%) | 204 (3.1%) |
| 85 Years and over | 102 (1.5%) | 239 (3.7%) |
| Total | 7,057 (100.0%) | 6,513 (100.0%) |
Families and Households in Pend Oreille County
Median Family Size in Pend Oreille County
The median family size in Pend Oreille County is 2.66 persons per family, with married-couple families (2,883 | 72.9%) accounting for the largest median family size of 2.74 persons per family. On the other hand, single male/father families (430 | 10.9%) represent the smallest median family size with 2.07 persons per family.

| Family Type | # Families | Family Size |
| Married-Couple | 2,883 (72.9%) | 2.74 |
| Single Male/Father | 430 (10.9%) | 2.07 |
| Single Female/Mother | 643 (16.3%) | 2.68 |
| Total Families | 3,956 (100.0%) | 2.66 |
Median Household Size in Pend Oreille County
The median household size in Pend Oreille County is 2.34 persons per household, with single female/mother households (643 | 11.2%) accounting for the largest median household size of 3.1 persons per household. non-family households (1,781 | 31.0%) represent the smallest median household size with 1.34 persons per household.

| Household Type | # Households | Household Size |
| Married-Couple | 2,883 (50.2%) | 2.78 |
| Single Male/Father | 430 (7.5%) | 2.42 |
| Single Female/Mother | 643 (11.2%) | 3.10 |
| Non-family | 1,781 (31.0%) | 1.34 |
| Total Households | 5,737 (100.0%) | 2.34 |
Household Size by Marriage Status in Pend Oreille County
Out of a total of 5,737 households in Pend Oreille County, 3,956 (69.0%) are family households, while 1,781 (31.0%) are nonfamily households. The most numerous type of family households are 2-person households, comprising 2,052, and the most common type of nonfamily households are 1-person households, comprising 1,354.
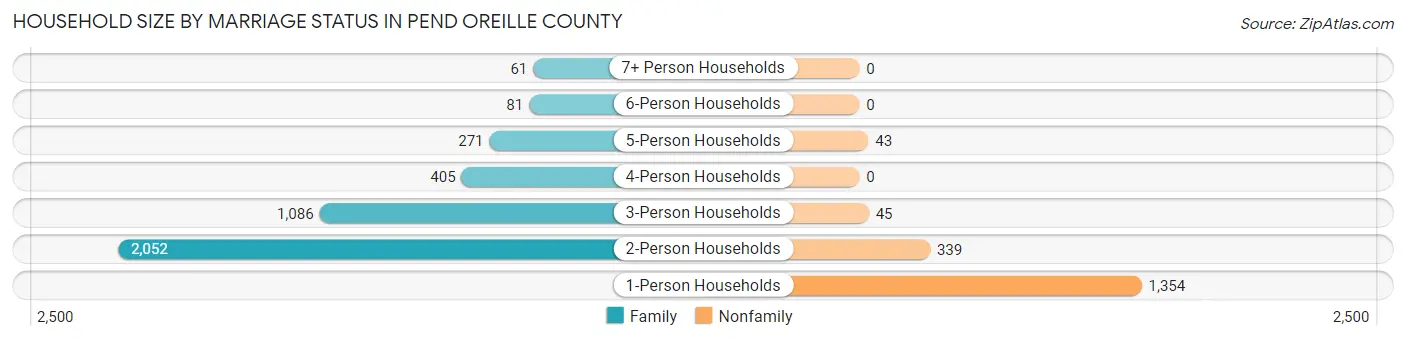
| Household Size | Family Households | Nonfamily Households |
| 1-Person Households | - | 1,354 (23.6%) |
| 2-Person Households | 2,052 (35.8%) | 339 (5.9%) |
| 3-Person Households | 1,086 (18.9%) | 45 (0.8%) |
| 4-Person Households | 405 (7.1%) | 0 (0.0%) |
| 5-Person Households | 271 (4.7%) | 43 (0.7%) |
| 6-Person Households | 81 (1.4%) | 0 (0.0%) |
| 7+ Person Households | 61 (1.1%) | 0 (0.0%) |
| Total | 3,956 (69.0%) | 1,781 (31.0%) |
Female Fertility in Pend Oreille County
Fertility by Age in Pend Oreille County
Average fertility rate in Pend Oreille County is 124.0 births per 1,000 women. Women in the age bracket of 35 to 50 years have the highest fertility rate with 151.0 births per 1,000 women. Women in the age bracket of 35 to 50 years acount for 54.3% of all women with births.
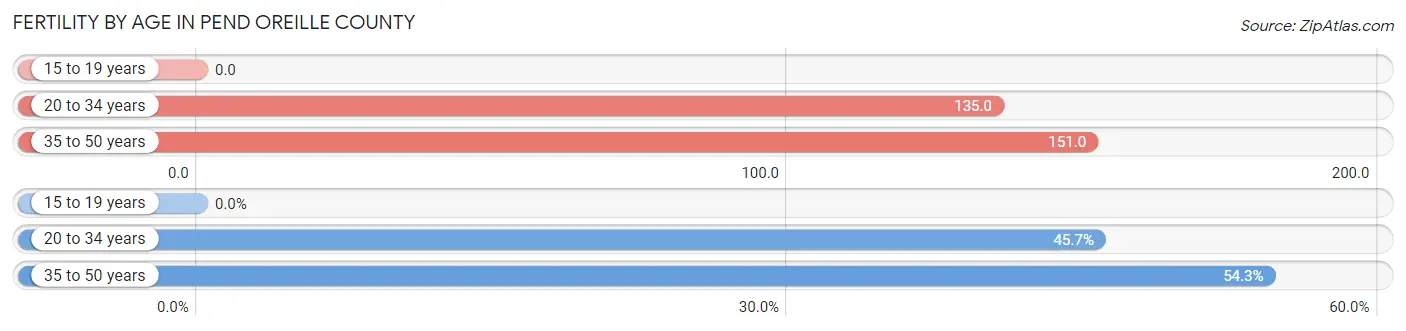
| Age Bracket | Women with Births | Births / 1,000 Women |
| 15 to 19 years | 0 (0.0%) | 0.0 |
| 20 to 34 years | 127 (45.7%) | 135.0 |
| 35 to 50 years | 151 (54.3%) | 151.0 |
| Total | 278 (100.0%) | 124.0 |
Fertility by Age by Marriage Status in Pend Oreille County
73.7% of women with births (278) in Pend Oreille County are married. The highest percentage of unmarried women with births falls into 20 to 34 years age bracket with 48.0% of them unmarried at the time of birth, while the lowest percentage of unmarried women with births belong to 35 to 50 years age bracket with 8.0% of them unmarried.
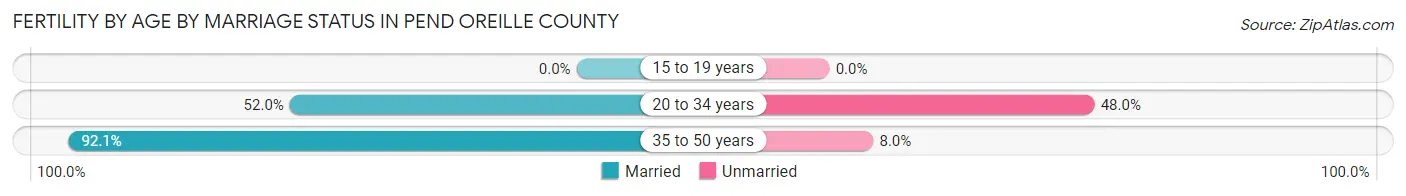
| Age Bracket | Married | Unmarried |
| 15 to 19 years | 0 (0.0%) | 0 (0.0%) |
| 20 to 34 years | 66 (52.0%) | 61 (48.0%) |
| 35 to 50 years | 139 (92.0%) | 12 (8.0%) |
| Total | 205 (73.7%) | 73 (26.3%) |
Fertility by Education in Pend Oreille County
Average fertility rate in Pend Oreille County is 124.0 births per 1,000 women. Women with the education attainment of high school diploma have the highest fertility rate of 194.0 births per 1,000 women, while women with the education attainment of less than high school have the lowest fertility at 61.0 births per 1,000 women. Women with the education attainment of high school diploma represent 43.5% of all women with births.
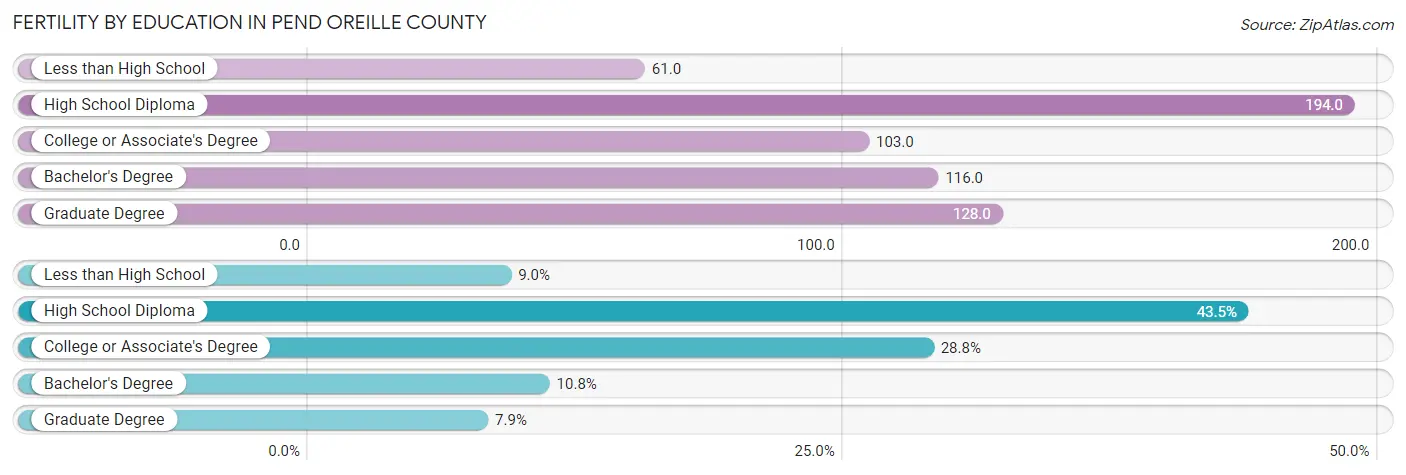
| Educational Attainment | Women with Births | Births / 1,000 Women |
| Less than High School | 25 (9.0%) | 61.0 |
| High School Diploma | 121 (43.5%) | 194.0 |
| College or Associate's Degree | 80 (28.8%) | 103.0 |
| Bachelor's Degree | 30 (10.8%) | 116.0 |
| Graduate Degree | 22 (7.9%) | 128.0 |
| Total | 278 (100.0%) | 124.0 |
Fertility by Education by Marriage Status in Pend Oreille County
26.3% of women with births in Pend Oreille County are unmarried. Women with the educational attainment of less than high school are most likely to be married with 100.0% of them married at childbirth, while women with the educational attainment of high school diploma are least likely to be married with 51.2% of them unmarried at childbirth.
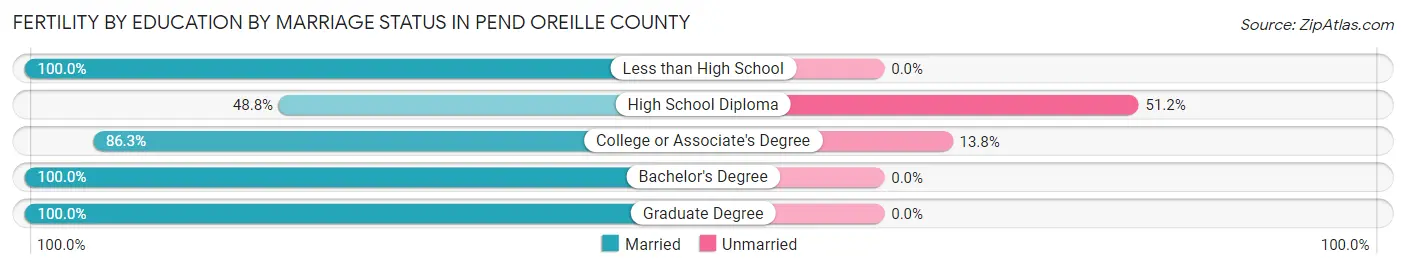
| Educational Attainment | Married | Unmarried |
| Less than High School | 25 (100.0%) | 0 (0.0%) |
| High School Diploma | 59 (48.8%) | 62 (51.2%) |
| College or Associate's Degree | 69 (86.3%) | 11 (13.8%) |
| Bachelor's Degree | 30 (100.0%) | 0 (0.0%) |
| Graduate Degree | 22 (100.0%) | 0 (0.0%) |
| Total | 205 (73.7%) | 73 (26.3%) |
Employment Characteristics in Pend Oreille County
Employment by Class of Employer in Pend Oreille County
Among the 4,806 employed individuals in Pend Oreille County, private company employees (2,925 | 60.9%), local government employees (545 | 11.3%), and self-employed (not incorporated) (354 | 7.4%) make up the most common classes of employment.
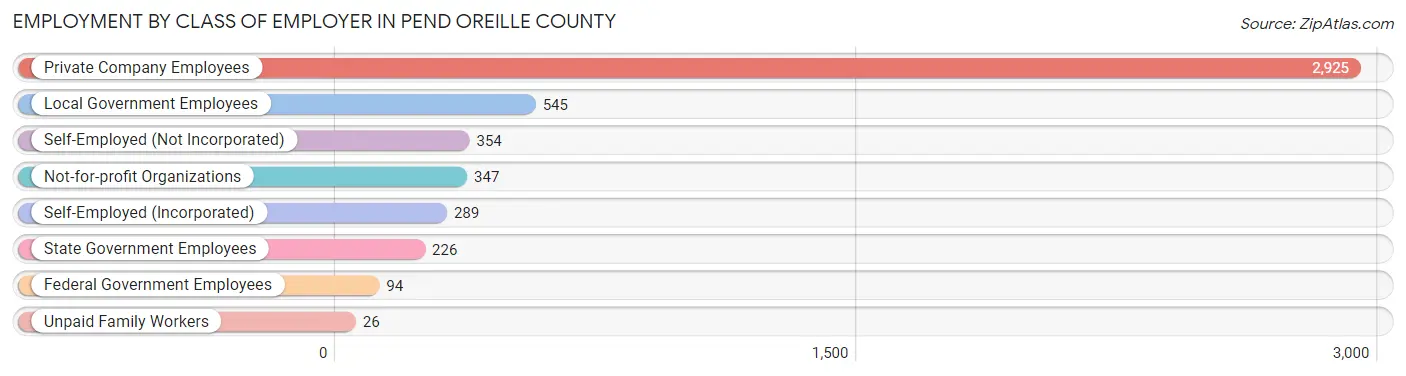
| Employer Class | # Employees | % Employees |
| Private Company Employees | 2,925 | 60.9% |
| Self-Employed (Incorporated) | 289 | 6.0% |
| Self-Employed (Not Incorporated) | 354 | 7.4% |
| Not-for-profit Organizations | 347 | 7.2% |
| Local Government Employees | 545 | 11.3% |
| State Government Employees | 226 | 4.7% |
| Federal Government Employees | 94 | 2.0% |
| Unpaid Family Workers | 26 | 0.5% |
| Total | 4,806 | 100.0% |
Employment Status by Age in Pend Oreille County
According to the labor force statistics for Pend Oreille County, out of the total population over 16 years of age (11,254), 46.7% or 5,256 individuals are in the labor force, with 6.1% or 321 of them unemployed. The age group with the highest labor force participation rate is 25 to 29 years, with 86.4% or 439 individuals in the labor force. Within the labor force, the 16 to 19 years age range has the highest percentage of unemployed individuals, with 25.0% or 62 of them being unemployed.
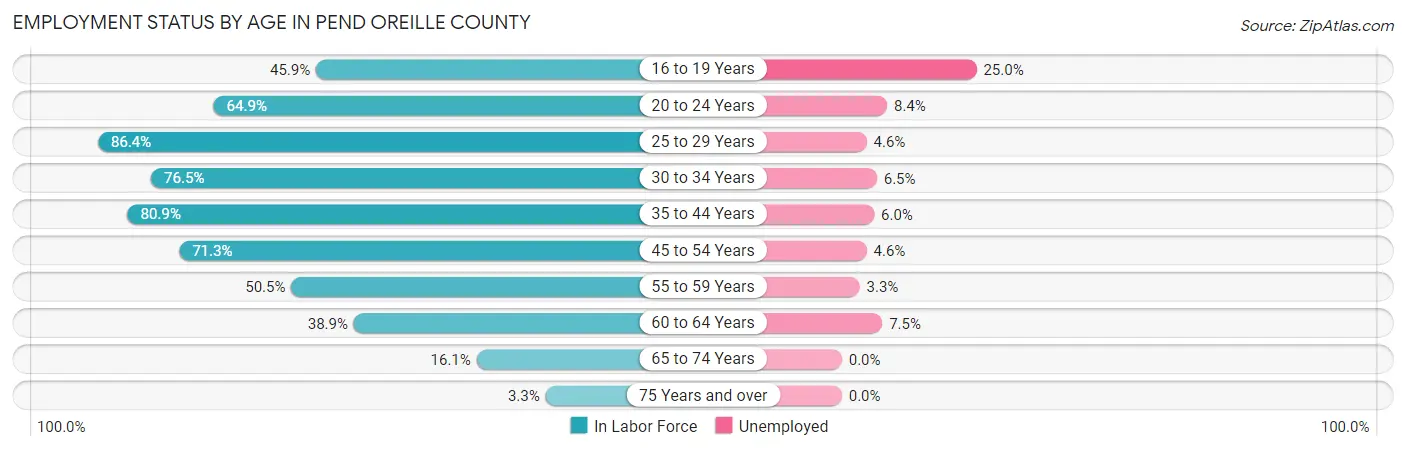
| Age Bracket | In Labor Force | Unemployed |
| 16 to 19 Years | 248 (45.9%) | 62 (25.0%) |
| 20 to 24 Years | 491 (64.9%) | 41 (8.4%) |
| 25 to 29 Years | 439 (86.4%) | 20 (4.6%) |
| 30 to 34 Years | 558 (76.5%) | 36 (6.5%) |
| 35 to 44 Years | 973 (80.9%) | 58 (6.0%) |
| 45 to 54 Years | 1,075 (71.3%) | 49 (4.6%) |
| 55 to 59 Years | 542 (50.5%) | 18 (3.3%) |
| 60 to 64 Years | 506 (38.9%) | 38 (7.5%) |
| 65 to 74 Years | 379 (16.1%) | 0 (0.0%) |
| 75 Years and over | 42 (3.3%) | 0 (0.0%) |
| Total | 5,256 (46.7%) | 321 (6.1%) |
Employment Status by Educational Attainment in Pend Oreille County
According to labor force statistics for Pend Oreille County, 64.7% of individuals (4,092) out of the total population between 25 and 64 years of age (6,324) are in the labor force, with 5.3% or 217 of them being unemployed. The group with the highest labor force participation rate are those with the educational attainment of bachelor's degree or higher, with 68.1% or 896 individuals in the labor force. Within the labor force, individuals with high school diploma education have the highest percentage of unemployment, with 9.1% or 129 of them being unemployed.
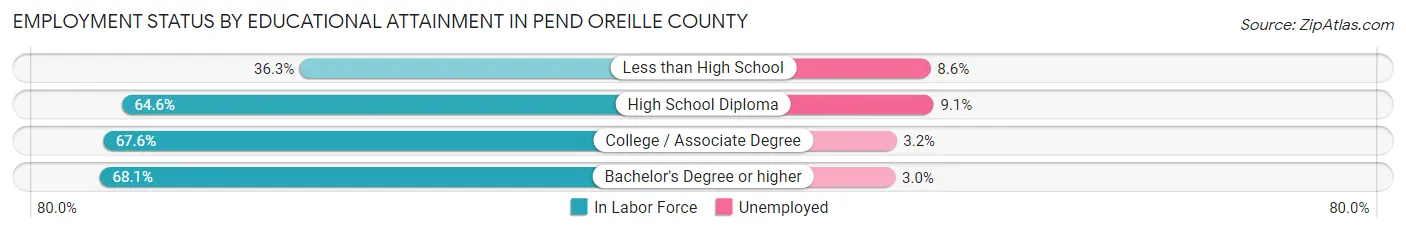
| Educational Attainment | In Labor Force | Unemployed |
| Less than High School | 139 (36.3%) | 33 (8.6%) |
| High School Diploma | 1,414 (64.6%) | 199 (9.1%) |
| College / Associate Degree | 1,647 (67.6%) | 78 (3.2%) |
| Bachelor's Degree or higher | 896 (68.1%) | 39 (3.0%) |
| Total | 4,092 (64.7%) | 335 (5.3%) |
Employment Occupations by Sex in Pend Oreille County
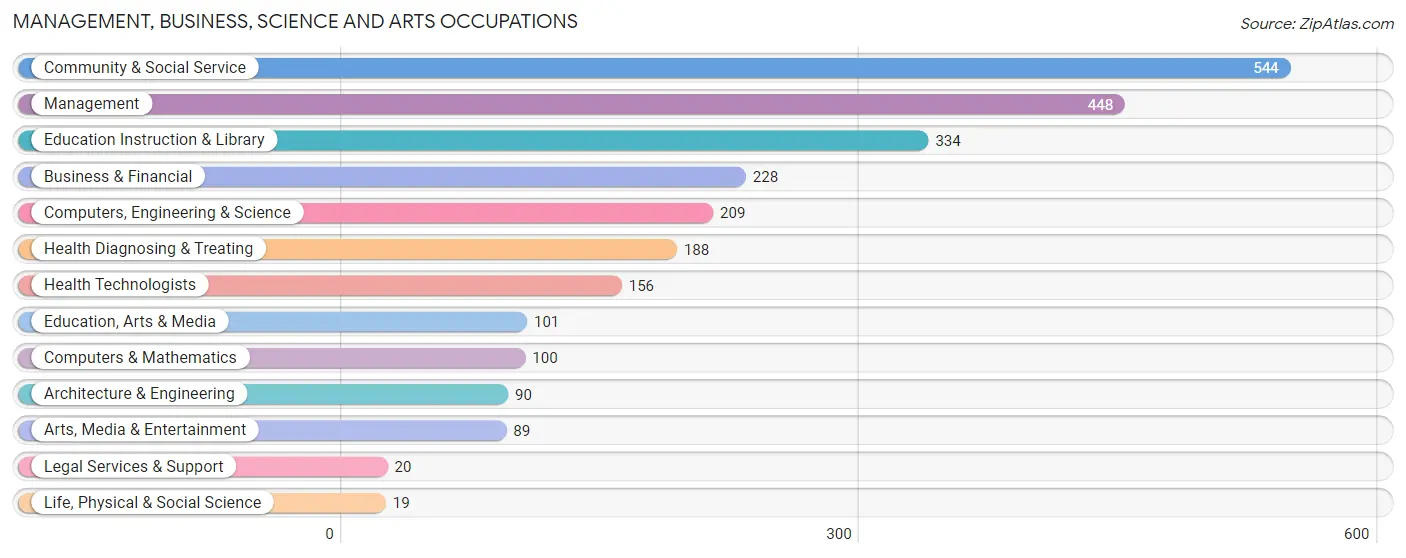
Management, Business, Science and Arts Occupations
The most common Management, Business, Science and Arts occupations in Pend Oreille County are Community & Social Service (544 | 11.0%), Management (448 | 9.1%), Education Instruction & Library (334 | 6.8%), Business & Financial (228 | 4.6%), and Computers, Engineering & Science (209 | 4.2%).
Management, Business, Science and Arts Occupations by Sex
Within the Management, Business, Science and Arts occupations in Pend Oreille County, the most male-oriented occupations are Life, Physical & Social Science (100.0%), Computers & Mathematics (83.0%), and Computers, Engineering & Science (78.5%), while the most female-oriented occupations are Health Diagnosing & Treating (76.1%), Health Technologists (71.2%), and Legal Services & Support (70.0%).
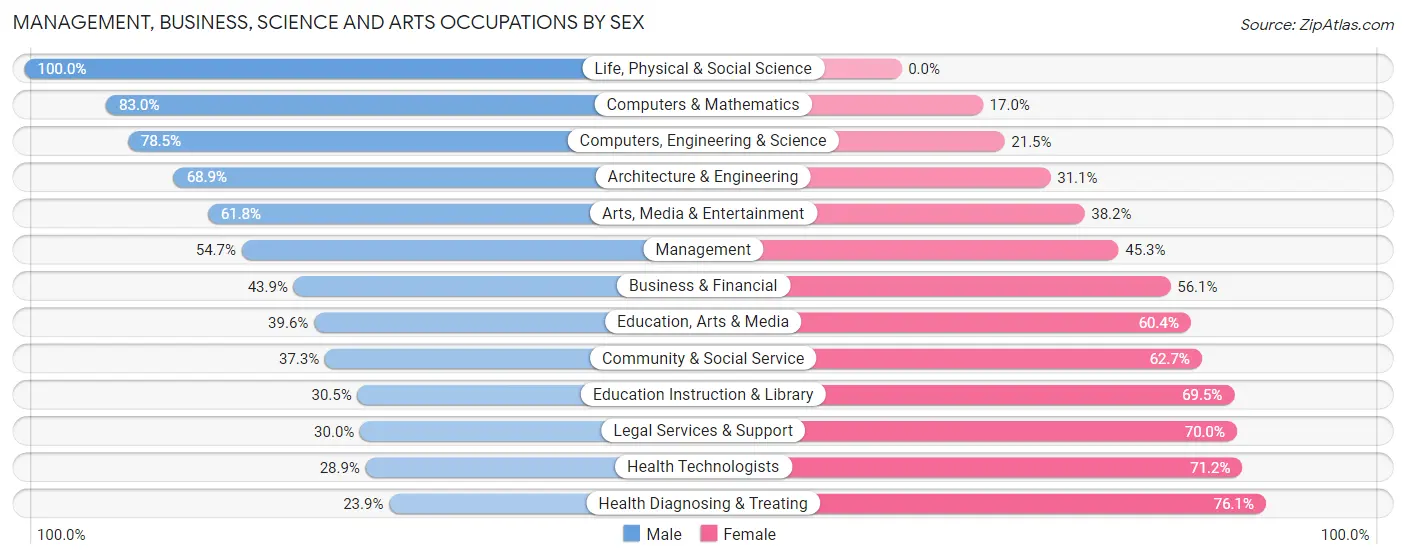
| Occupation | Male | Female |
| Management | 245 (54.7%) | 203 (45.3%) |
| Business & Financial | 100 (43.9%) | 128 (56.1%) |
| Computers, Engineering & Science | 164 (78.5%) | 45 (21.5%) |
| Computers & Mathematics | 83 (83.0%) | 17 (17.0%) |
| Architecture & Engineering | 62 (68.9%) | 28 (31.1%) |
| Life, Physical & Social Science | 19 (100.0%) | 0 (0.0%) |
| Community & Social Service | 203 (37.3%) | 341 (62.7%) |
| Education, Arts & Media | 40 (39.6%) | 61 (60.4%) |
| Legal Services & Support | 6 (30.0%) | 14 (70.0%) |
| Education Instruction & Library | 102 (30.5%) | 232 (69.5%) |
| Arts, Media & Entertainment | 55 (61.8%) | 34 (38.2%) |
| Health Diagnosing & Treating | 45 (23.9%) | 143 (76.1%) |
| Health Technologists | 45 (28.8%) | 111 (71.2%) |
| Total (Category) | 757 (46.8%) | 860 (53.2%) |
| Total (Overall) | 2,716 (55.1%) | 2,216 (44.9%) |
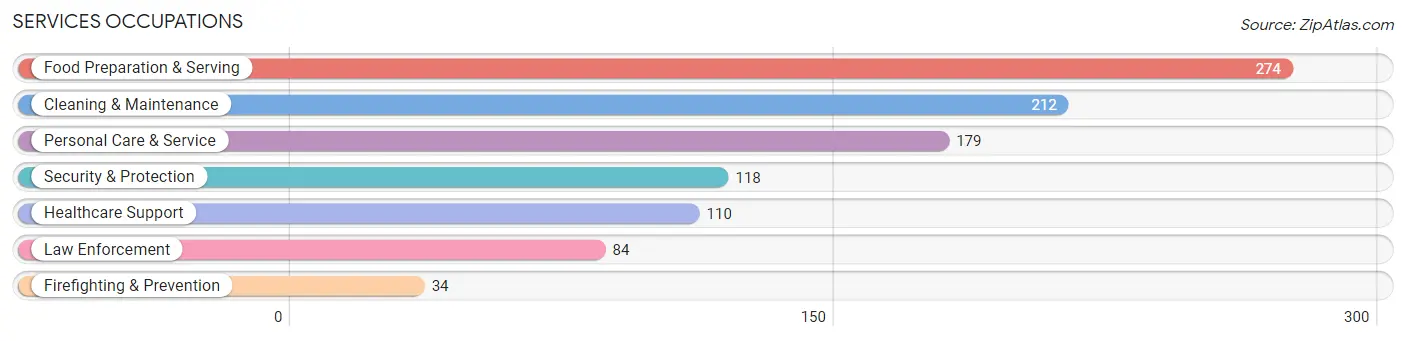
Services Occupations
The most common Services occupations in Pend Oreille County are Food Preparation & Serving (274 | 5.6%), Cleaning & Maintenance (212 | 4.3%), Personal Care & Service (179 | 3.6%), Security & Protection (118 | 2.4%), and Healthcare Support (110 | 2.2%).
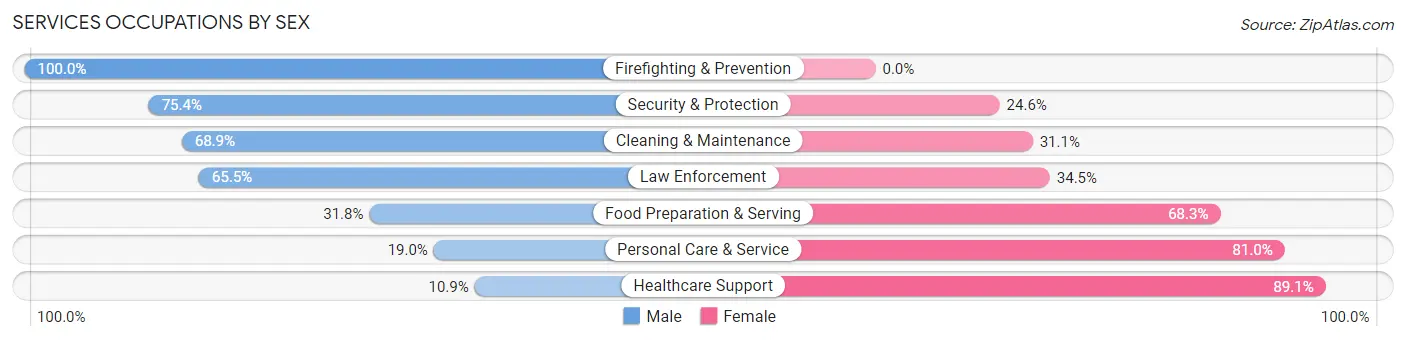
Services Occupations by Sex
Within the Services occupations in Pend Oreille County, the most male-oriented occupations are Firefighting & Prevention (100.0%), Security & Protection (75.4%), and Cleaning & Maintenance (68.9%), while the most female-oriented occupations are Healthcare Support (89.1%), Personal Care & Service (81.0%), and Food Preparation & Serving (68.2%).
| Occupation | Male | Female |
| Healthcare Support | 12 (10.9%) | 98 (89.1%) |
| Security & Protection | 89 (75.4%) | 29 (24.6%) |
| Firefighting & Prevention | 34 (100.0%) | 0 (0.0%) |
| Law Enforcement | 55 (65.5%) | 29 (34.5%) |
| Food Preparation & Serving | 87 (31.8%) | 187 (68.2%) |
| Cleaning & Maintenance | 146 (68.9%) | 66 (31.1%) |
| Personal Care & Service | 34 (19.0%) | 145 (81.0%) |
| Total (Category) | 368 (41.2%) | 525 (58.8%) |
| Total (Overall) | 2,716 (55.1%) | 2,216 (44.9%) |
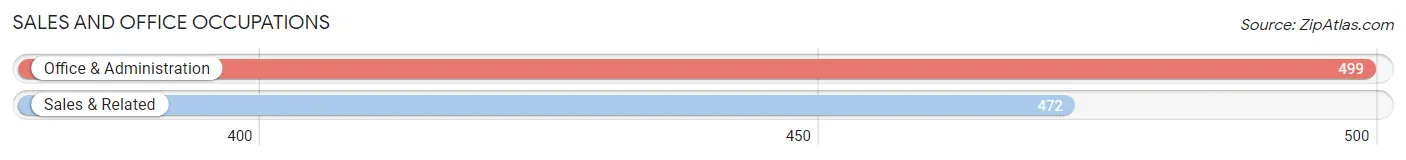
Sales and Office Occupations
The most common Sales and Office occupations in Pend Oreille County are Office & Administration (499 | 10.1%), and Sales & Related (472 | 9.6%).
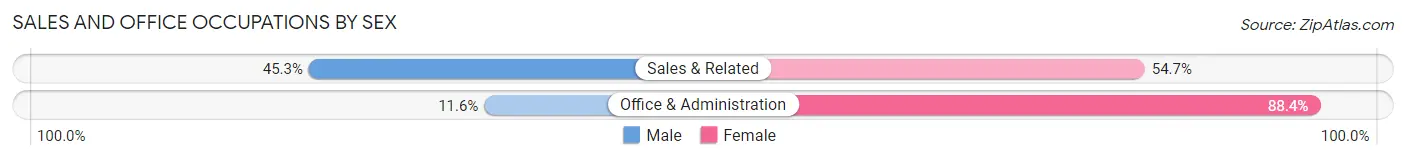
Sales and Office Occupations by Sex
| Occupation | Male | Female |
| Sales & Related | 214 (45.3%) | 258 (54.7%) |
| Office & Administration | 58 (11.6%) | 441 (88.4%) |
| Total (Category) | 272 (28.0%) | 699 (72.0%) |
| Total (Overall) | 2,716 (55.1%) | 2,216 (44.9%) |
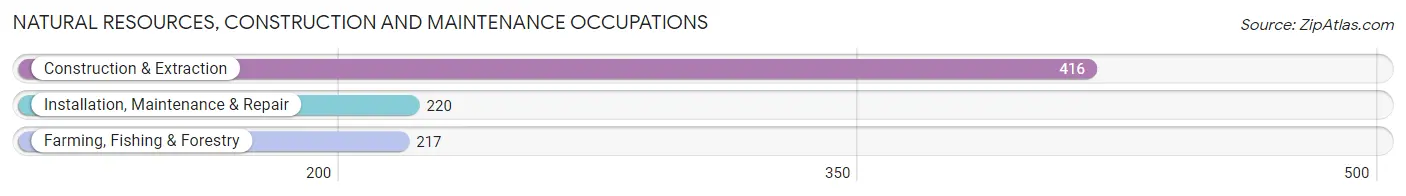
Natural Resources, Construction and Maintenance Occupations
The most common Natural Resources, Construction and Maintenance occupations in Pend Oreille County are Construction & Extraction (416 | 8.4%), Installation, Maintenance & Repair (220 | 4.5%), and Farming, Fishing & Forestry (217 | 4.4%).
Natural Resources, Construction and Maintenance Occupations by Sex
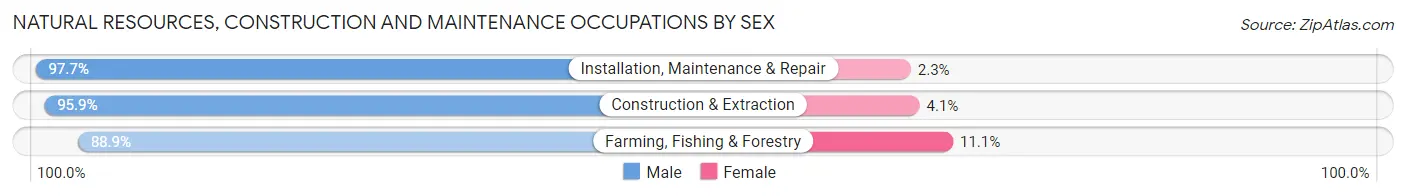
| Occupation | Male | Female |
| Farming, Fishing & Forestry | 193 (88.9%) | 24 (11.1%) |
| Construction & Extraction | 399 (95.9%) | 17 (4.1%) |
| Installation, Maintenance & Repair | 215 (97.7%) | 5 (2.3%) |
| Total (Category) | 807 (94.6%) | 46 (5.4%) |
| Total (Overall) | 2,716 (55.1%) | 2,216 (44.9%) |
Production, Transportation and Moving Occupations
The most common Production, Transportation and Moving occupations in Pend Oreille County are Material Moving (227 | 4.6%), Production (225 | 4.6%), and Transportation (146 | 3.0%).

Production, Transportation and Moving Occupations by Sex
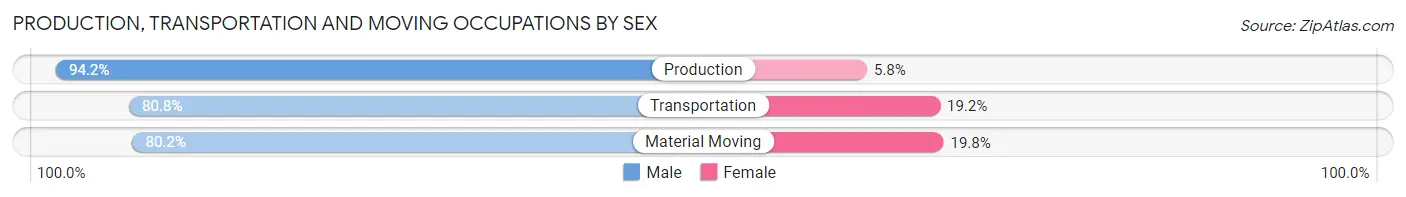
| Occupation | Male | Female |
| Production | 212 (94.2%) | 13 (5.8%) |
| Transportation | 118 (80.8%) | 28 (19.2%) |
| Material Moving | 182 (80.2%) | 45 (19.8%) |
| Total (Category) | 512 (85.6%) | 86 (14.4%) |
| Total (Overall) | 2,716 (55.1%) | 2,216 (44.9%) |
Employment Industries by Sex in Pend Oreille County
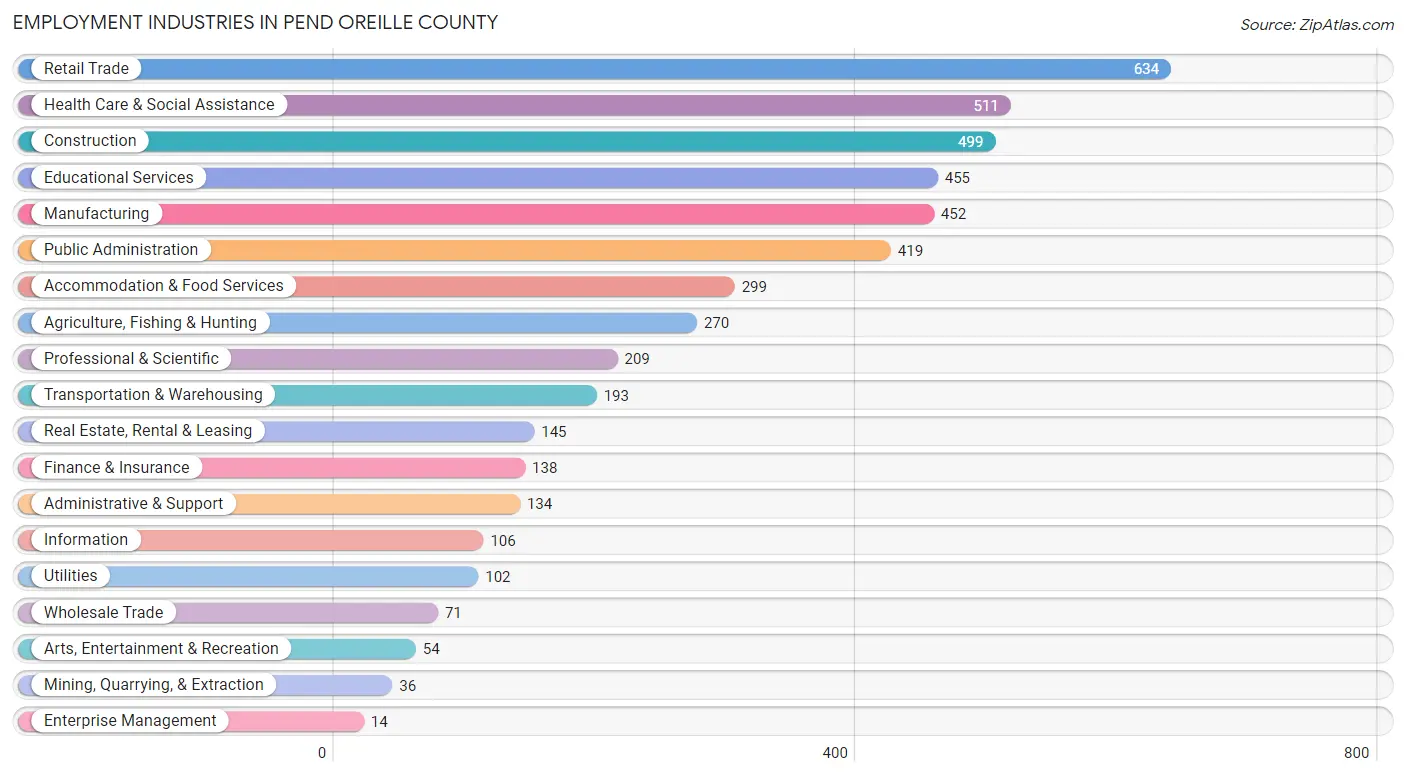
Employment Industries in Pend Oreille County
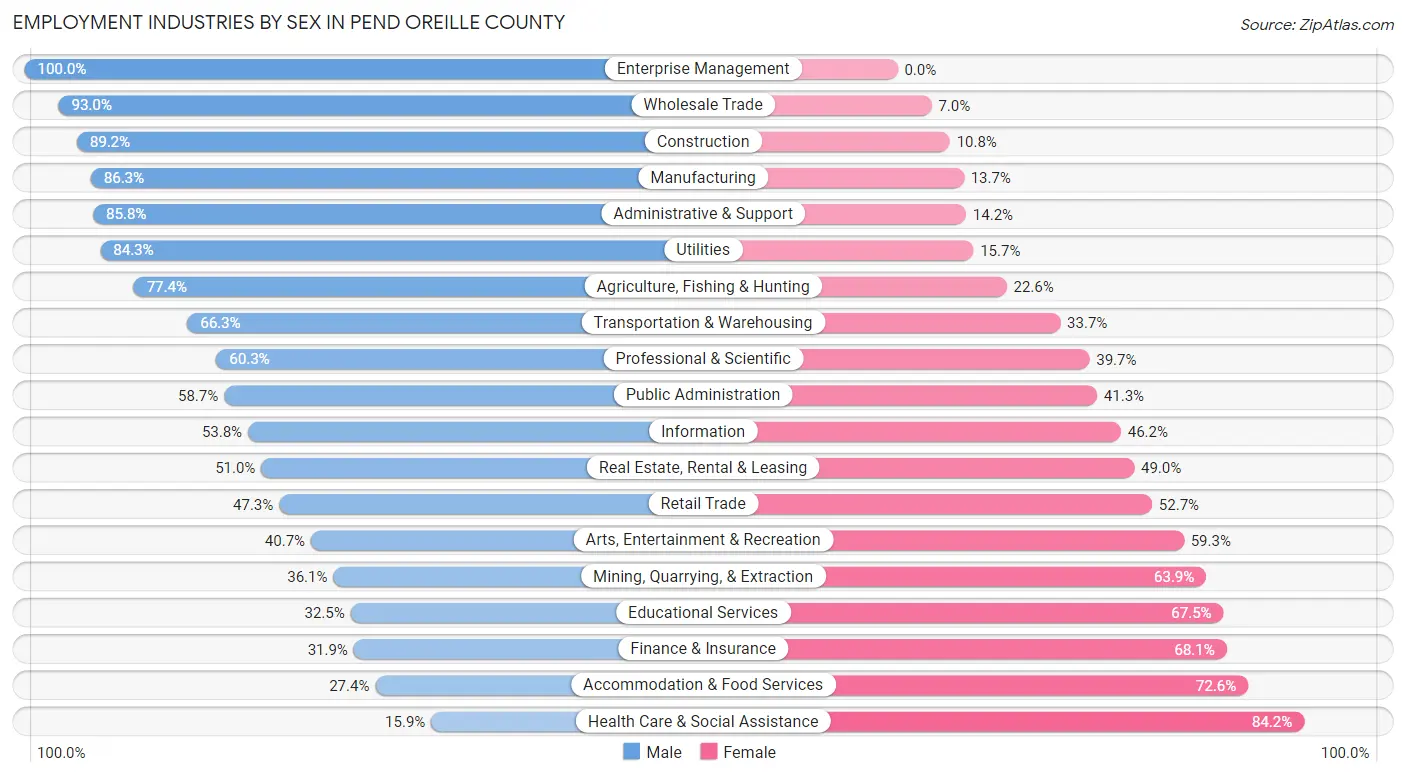
The major employment industries in Pend Oreille County include Retail Trade (634 | 12.9%), Health Care & Social Assistance (511 | 10.4%), Construction (499 | 10.1%), Educational Services (455 | 9.2%), and Manufacturing (452 | 9.2%).
Employment Industries by Sex in Pend Oreille County
The Pend Oreille County industries that see more men than women are Enterprise Management (100.0%), Wholesale Trade (93.0%), and Construction (89.2%), whereas the industries that tend to have a higher number of women are Health Care & Social Assistance (84.2%), Accommodation & Food Services (72.6%), and Finance & Insurance (68.1%).
| Industry | Male | Female |
| Agriculture, Fishing & Hunting | 209 (77.4%) | 61 (22.6%) |
| Mining, Quarrying, & Extraction | 13 (36.1%) | 23 (63.9%) |
| Construction | 445 (89.2%) | 54 (10.8%) |
| Manufacturing | 390 (86.3%) | 62 (13.7%) |
| Wholesale Trade | 66 (93.0%) | 5 (7.0%) |
| Retail Trade | 300 (47.3%) | 334 (52.7%) |
| Transportation & Warehousing | 128 (66.3%) | 65 (33.7%) |
| Utilities | 86 (84.3%) | 16 (15.7%) |
| Information | 57 (53.8%) | 49 (46.2%) |
| Finance & Insurance | 44 (31.9%) | 94 (68.1%) |
| Real Estate, Rental & Leasing | 74 (51.0%) | 71 (49.0%) |
| Professional & Scientific | 126 (60.3%) | 83 (39.7%) |
| Enterprise Management | 14 (100.0%) | 0 (0.0%) |
| Administrative & Support | 115 (85.8%) | 19 (14.2%) |
| Educational Services | 148 (32.5%) | 307 (67.5%) |
| Health Care & Social Assistance | 81 (15.9%) | 430 (84.2%) |
| Arts, Entertainment & Recreation | 22 (40.7%) | 32 (59.3%) |
| Accommodation & Food Services | 82 (27.4%) | 217 (72.6%) |
| Public Administration | 246 (58.7%) | 173 (41.3%) |
| Total | 2,716 (55.1%) | 2,216 (44.9%) |
Education in Pend Oreille County
School Enrollment in Pend Oreille County
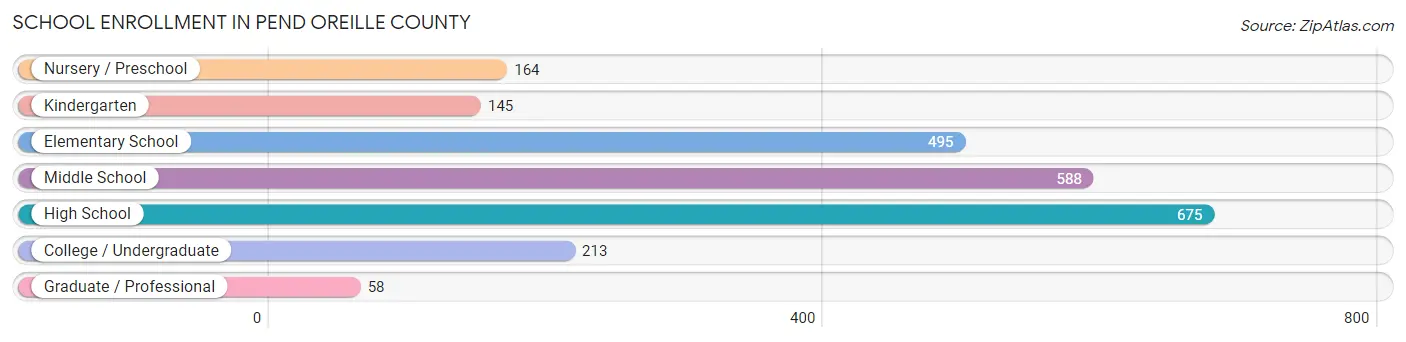
The most common levels of schooling among the 2,338 students in Pend Oreille County are high school (675 | 28.9%), middle school (588 | 25.2%), and elementary school (495 | 21.2%).
| School Level | # Students | % Students |
| Nursery / Preschool | 164 | 7.0% |
| Kindergarten | 145 | 6.2% |
| Elementary School | 495 | 21.2% |
| Middle School | 588 | 25.2% |
| High School | 675 | 28.9% |
| College / Undergraduate | 213 | 9.1% |
| Graduate / Professional | 58 | 2.5% |
| Total | 2,338 | 100.0% |
School Enrollment by Age by Funding Source in Pend Oreille County
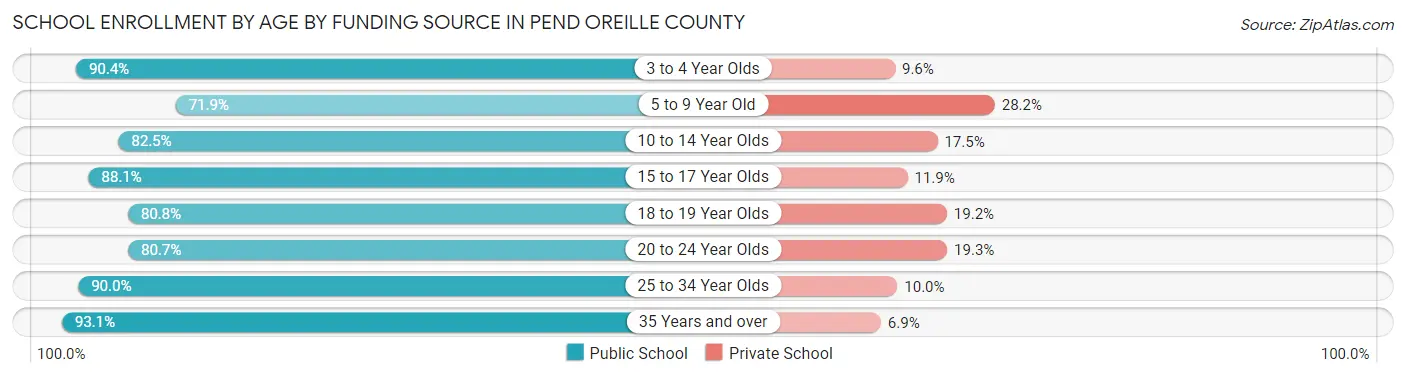
Out of a total of 2,338 students who are enrolled in schools in Pend Oreille County, 423 (18.1%) attend a private institution, while the remaining 1,915 (81.9%) are enrolled in public schools. The age group of 5 to 9 year old has the highest likelihood of being enrolled in private schools, with 170 (28.1% in the age bracket) enrolled. Conversely, the age group of 35 years and over has the lowest likelihood of being enrolled in a private school, with 67 (93.1% in the age bracket) attending a public institution.
| Age Bracket | Public School | Private School |
| 3 to 4 Year Olds | 104 (90.4%) | 11 (9.6%) |
| 5 to 9 Year Old | 434 (71.9%) | 170 (28.1%) |
| 10 to 14 Year Olds | 581 (82.5%) | 123 (17.5%) |
| 15 to 17 Year Olds | 467 (88.1%) | 63 (11.9%) |
| 18 to 19 Year Olds | 105 (80.8%) | 25 (19.2%) |
| 20 to 24 Year Olds | 67 (80.7%) | 16 (19.3%) |
| 25 to 34 Year Olds | 90 (90.0%) | 10 (10.0%) |
| 35 Years and over | 67 (93.1%) | 5 (6.9%) |
| Total | 1,915 (81.9%) | 423 (18.1%) |
Educational Attainment by Field of Study in Pend Oreille County
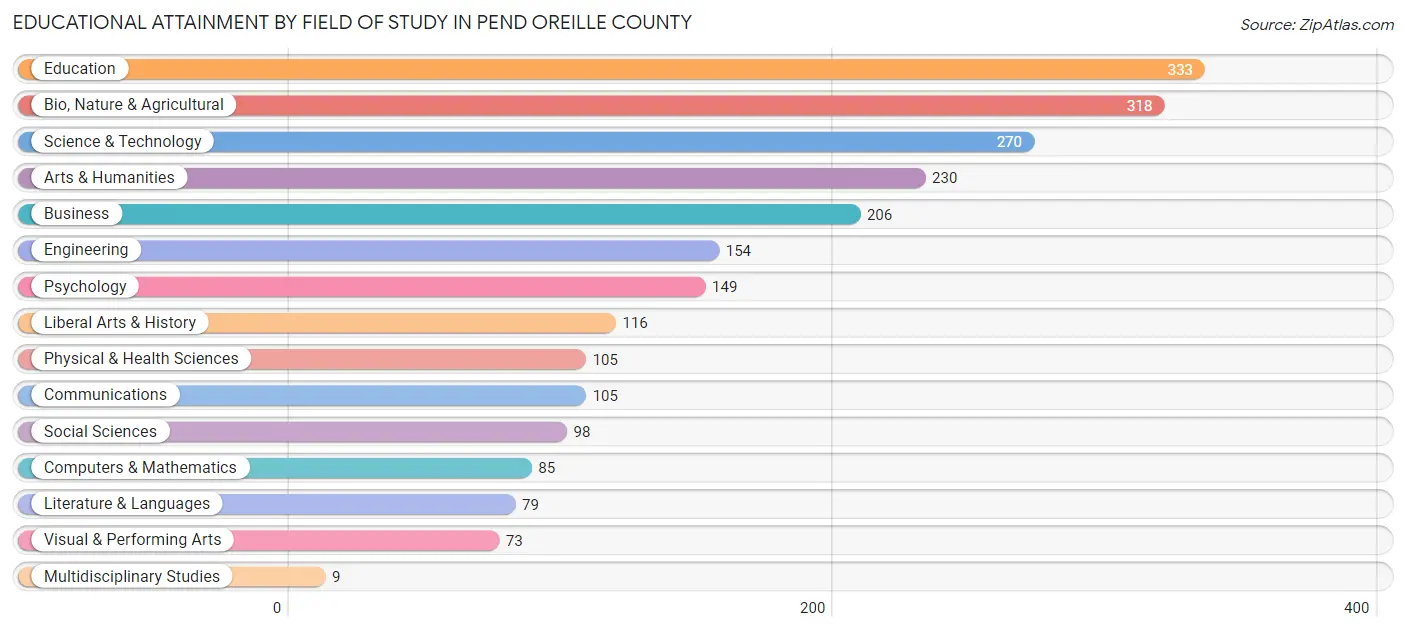
Education (333 | 14.3%), bio, nature & agricultural (318 | 13.7%), science & technology (270 | 11.6%), arts & humanities (230 | 9.9%), and business (206 | 8.8%) are the most common fields of study among 2,330 individuals in Pend Oreille County who have obtained a bachelor's degree or higher.
| Field of Study | # Graduates | % Graduates |
| Computers & Mathematics | 85 | 3.6% |
| Bio, Nature & Agricultural | 318 | 13.7% |
| Physical & Health Sciences | 105 | 4.5% |
| Psychology | 149 | 6.4% |
| Social Sciences | 98 | 4.2% |
| Engineering | 154 | 6.6% |
| Multidisciplinary Studies | 9 | 0.4% |
| Science & Technology | 270 | 11.6% |
| Business | 206 | 8.8% |
| Education | 333 | 14.3% |
| Literature & Languages | 79 | 3.4% |
| Liberal Arts & History | 116 | 5.0% |
| Visual & Performing Arts | 73 | 3.1% |
| Communications | 105 | 4.5% |
| Arts & Humanities | 230 | 9.9% |
| Total | 2,330 | 100.0% |
Transportation & Commute in Pend Oreille County
Vehicle Availability by Sex in Pend Oreille County
The most prevalent vehicle ownership categories in Pend Oreille County are males with 2 vehicles (1,034, accounting for 38.9%) and females with 2 vehicles (687, making up 48.3%).
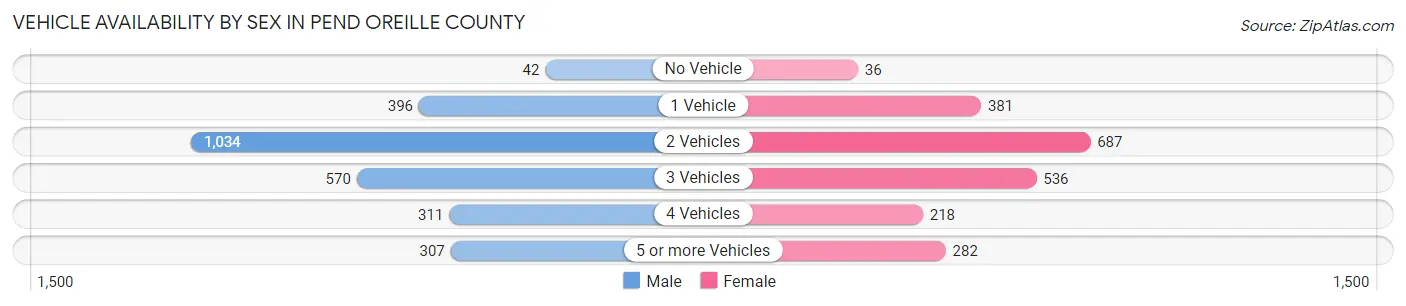
| Vehicles Available | Male | Female |
| No Vehicle | 42 (1.6%) | 36 (1.7%) |
| 1 Vehicle | 396 (14.9%) | 381 (17.8%) |
| 2 Vehicles | 1,034 (38.9%) | 687 (32.1%) |
| 3 Vehicles | 570 (21.4%) | 536 (25.1%) |
| 4 Vehicles | 311 (11.7%) | 218 (10.2%) |
| 5 or more Vehicles | 307 (11.5%) | 282 (13.2%) |
| Total | 2,660 (100.0%) | 2,140 (100.0%) |
Commute Time in Pend Oreille County
The most frequently occuring commute durations in Pend Oreille County are 60 to 89 minutes (822 commuters, 19.0%), 15 to 19 minutes (616 commuters, 14.3%), and 45 to 59 minutes (556 commuters, 12.9%).
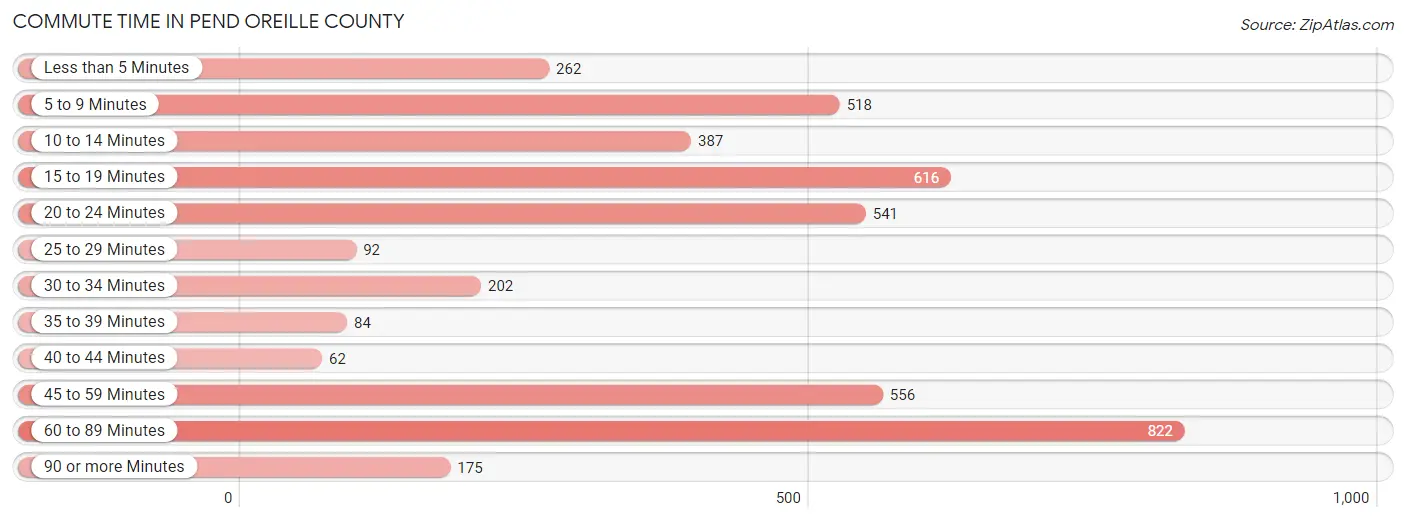
| Commute Time | # Commuters | % Commuters |
| Less than 5 Minutes | 262 | 6.1% |
| 5 to 9 Minutes | 518 | 12.0% |
| 10 to 14 Minutes | 387 | 9.0% |
| 15 to 19 Minutes | 616 | 14.3% |
| 20 to 24 Minutes | 541 | 12.5% |
| 25 to 29 Minutes | 92 | 2.1% |
| 30 to 34 Minutes | 202 | 4.7% |
| 35 to 39 Minutes | 84 | 1.9% |
| 40 to 44 Minutes | 62 | 1.4% |
| 45 to 59 Minutes | 556 | 12.9% |
| 60 to 89 Minutes | 822 | 19.0% |
| 90 or more Minutes | 175 | 4.1% |
Commute Time by Sex in Pend Oreille County
The most common commute times in Pend Oreille County are 60 to 89 minutes (542 commuters, 22.7%) for males and 5 to 9 minutes (322 commuters, 16.7%) for females.
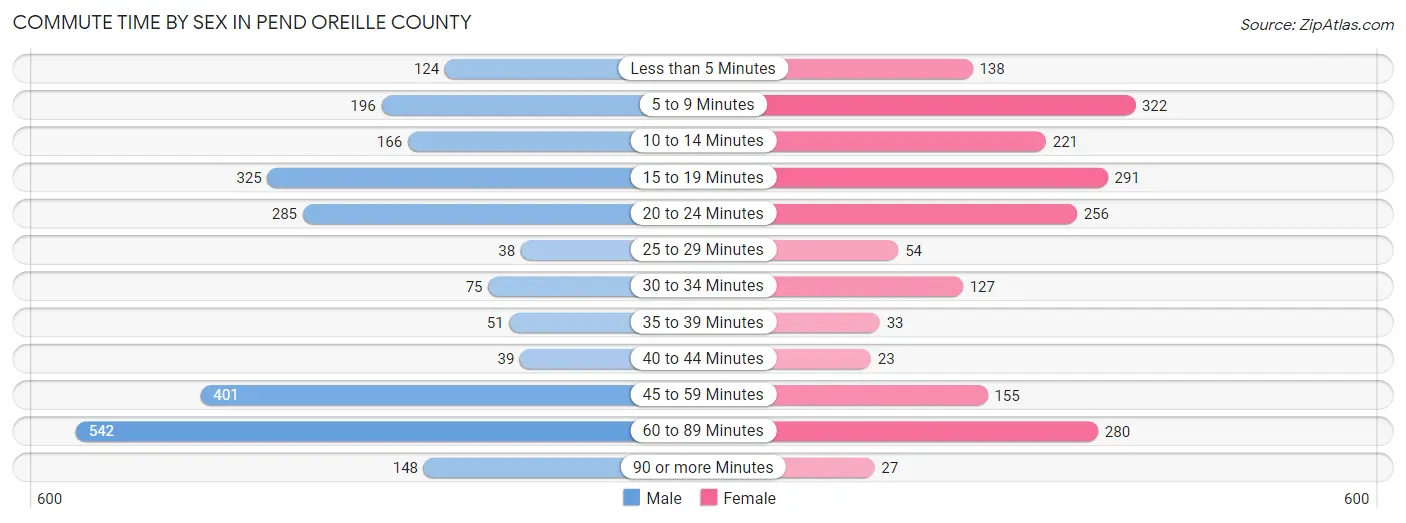
| Commute Time | Male | Female |
| Less than 5 Minutes | 124 (5.2%) | 138 (7.2%) |
| 5 to 9 Minutes | 196 (8.2%) | 322 (16.7%) |
| 10 to 14 Minutes | 166 (7.0%) | 221 (11.5%) |
| 15 to 19 Minutes | 325 (13.6%) | 291 (15.1%) |
| 20 to 24 Minutes | 285 (11.9%) | 256 (13.3%) |
| 25 to 29 Minutes | 38 (1.6%) | 54 (2.8%) |
| 30 to 34 Minutes | 75 (3.1%) | 127 (6.6%) |
| 35 to 39 Minutes | 51 (2.1%) | 33 (1.7%) |
| 40 to 44 Minutes | 39 (1.6%) | 23 (1.2%) |
| 45 to 59 Minutes | 401 (16.8%) | 155 (8.0%) |
| 60 to 89 Minutes | 542 (22.7%) | 280 (14.5%) |
| 90 or more Minutes | 148 (6.2%) | 27 (1.4%) |
Time of Departure to Work by Sex in Pend Oreille County
The most frequent times of departure to work in Pend Oreille County are 7:00 AM to 7:29 AM (390, 16.3%) for males and 6:30 AM to 6:59 AM (362, 18.8%) for females.
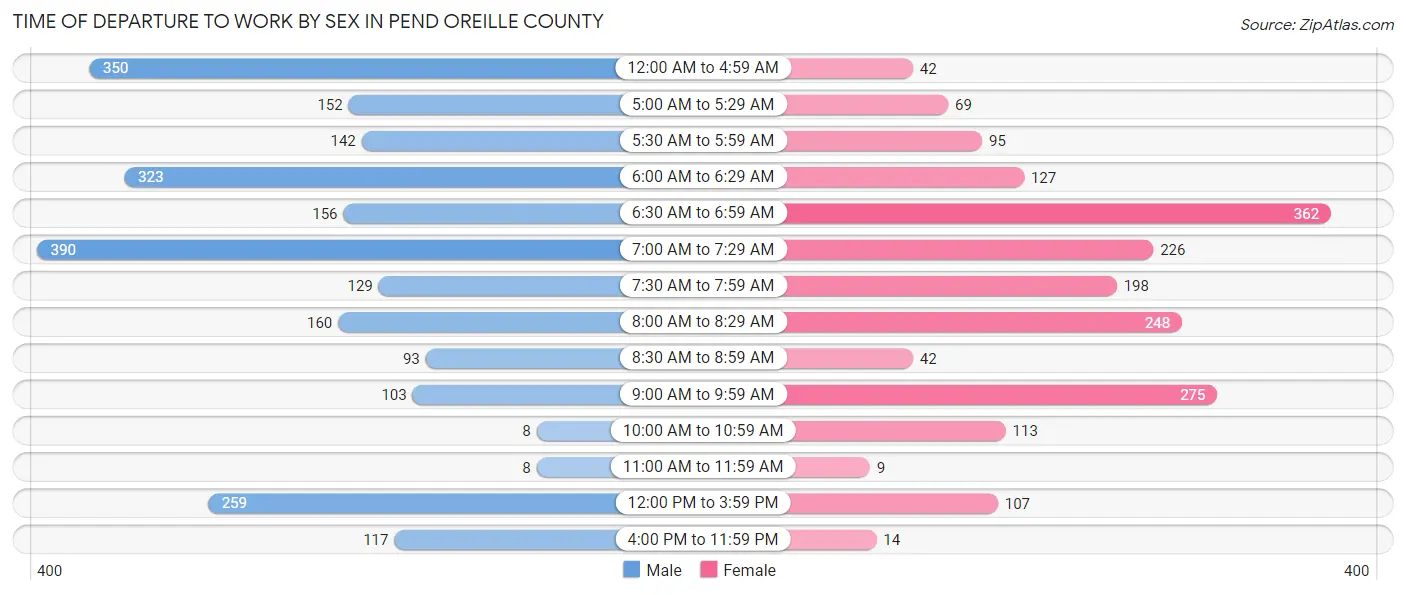
| Time of Departure | Male | Female |
| 12:00 AM to 4:59 AM | 350 (14.6%) | 42 (2.2%) |
| 5:00 AM to 5:29 AM | 152 (6.4%) | 69 (3.6%) |
| 5:30 AM to 5:59 AM | 142 (5.9%) | 95 (4.9%) |
| 6:00 AM to 6:29 AM | 323 (13.5%) | 127 (6.6%) |
| 6:30 AM to 6:59 AM | 156 (6.5%) | 362 (18.8%) |
| 7:00 AM to 7:29 AM | 390 (16.3%) | 226 (11.7%) |
| 7:30 AM to 7:59 AM | 129 (5.4%) | 198 (10.3%) |
| 8:00 AM to 8:29 AM | 160 (6.7%) | 248 (12.9%) |
| 8:30 AM to 8:59 AM | 93 (3.9%) | 42 (2.2%) |
| 9:00 AM to 9:59 AM | 103 (4.3%) | 275 (14.3%) |
| 10:00 AM to 10:59 AM | 8 (0.3%) | 113 (5.9%) |
| 11:00 AM to 11:59 AM | 8 (0.3%) | 9 (0.5%) |
| 12:00 PM to 3:59 PM | 259 (10.8%) | 107 (5.6%) |
| 4:00 PM to 11:59 PM | 117 (4.9%) | 14 (0.7%) |
| Total | 2,390 (100.0%) | 1,927 (100.0%) |
Housing Occupancy in Pend Oreille County
Occupancy by Ownership in Pend Oreille County
Of the total 5,737 dwellings in Pend Oreille County, owner-occupied units account for 4,363 (76.0%), while renter-occupied units make up 1,374 (23.9%).
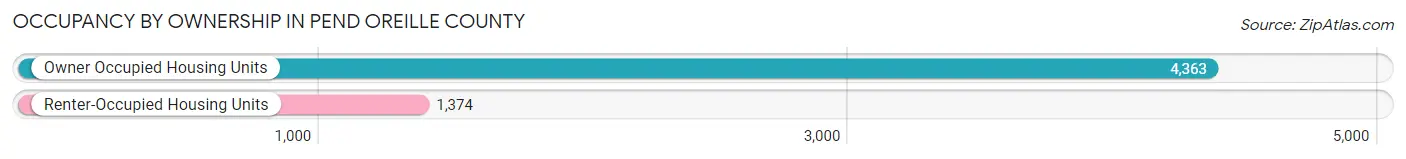
| Occupancy | # Housing Units | % Housing Units |
| Owner Occupied Housing Units | 4,363 | 76.0% |
| Renter-Occupied Housing Units | 1,374 | 23.9% |
| Total Occupied Housing Units | 5,737 | 100.0% |
Occupancy by Household Size in Pend Oreille County
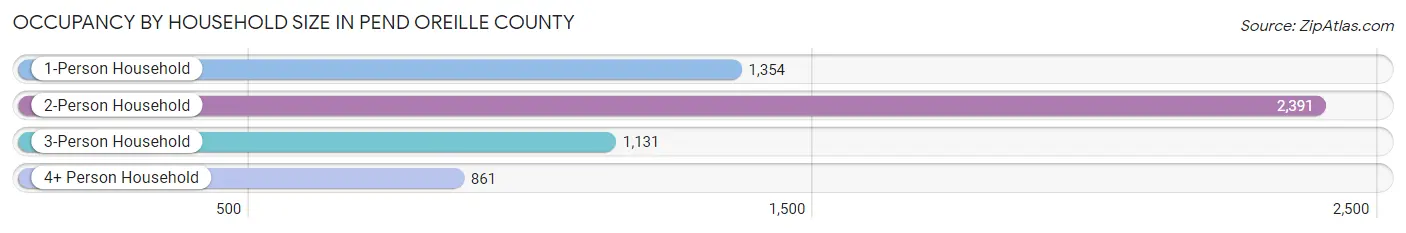
| Household Size | # Housing Units | % Housing Units |
| 1-Person Household | 1,354 | 23.6% |
| 2-Person Household | 2,391 | 41.7% |
| 3-Person Household | 1,131 | 19.7% |
| 4+ Person Household | 861 | 15.0% |
| Total Housing Units | 5,737 | 100.0% |
Occupancy by Ownership by Household Size in Pend Oreille County
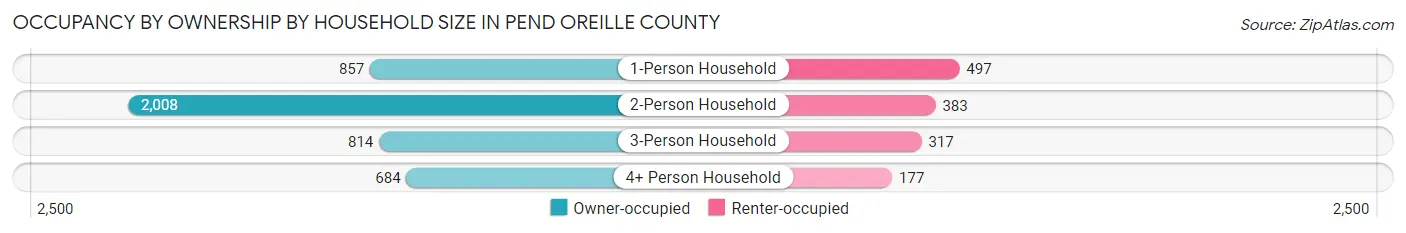
| Household Size | Owner-occupied | Renter-occupied |
| 1-Person Household | 857 (63.3%) | 497 (36.7%) |
| 2-Person Household | 2,008 (84.0%) | 383 (16.0%) |
| 3-Person Household | 814 (72.0%) | 317 (28.0%) |
| 4+ Person Household | 684 (79.4%) | 177 (20.6%) |
| Total Housing Units | 4,363 (76.0%) | 1,374 (23.9%) |
Occupancy by Educational Attainment in Pend Oreille County
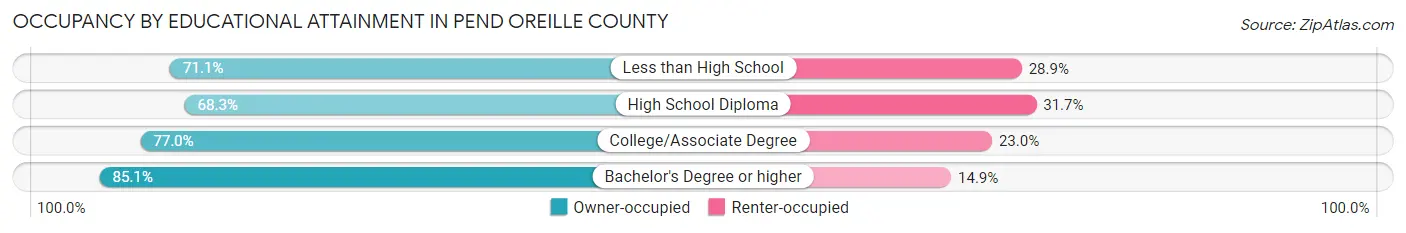
| Household Size | Owner-occupied | Renter-occupied |
| Less than High School | 249 (71.1%) | 101 (28.9%) |
| High School Diploma | 1,112 (68.3%) | 517 (31.7%) |
| College/Associate Degree | 1,879 (77.0%) | 560 (23.0%) |
| Bachelor's Degree or higher | 1,123 (85.1%) | 196 (14.9%) |
Occupancy by Age of Householder in Pend Oreille County
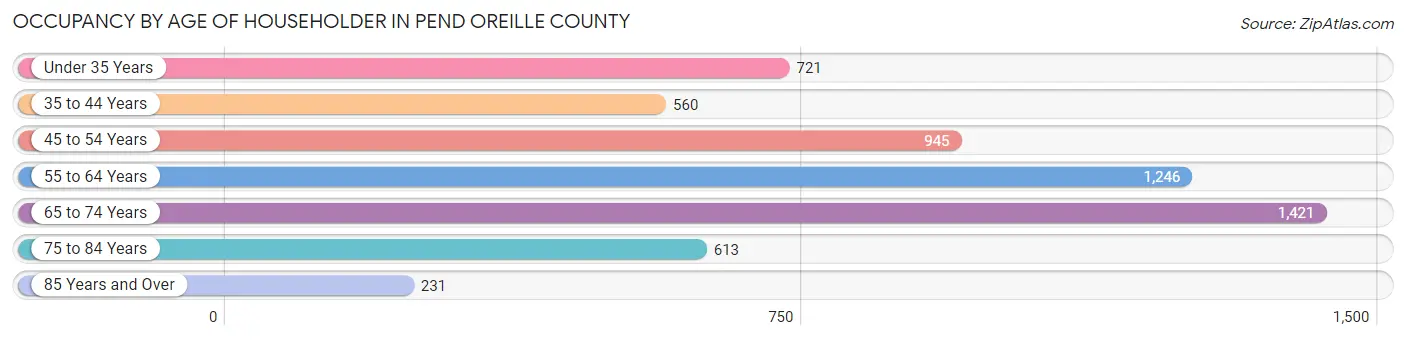
| Age Bracket | # Households | % Households |
| Under 35 Years | 721 | 12.6% |
| 35 to 44 Years | 560 | 9.8% |
| 45 to 54 Years | 945 | 16.5% |
| 55 to 64 Years | 1,246 | 21.7% |
| 65 to 74 Years | 1,421 | 24.8% |
| 75 to 84 Years | 613 | 10.7% |
| 85 Years and Over | 231 | 4.0% |
| Total | 5,737 | 100.0% |
Housing Finances in Pend Oreille County
Median Income by Occupancy in Pend Oreille County
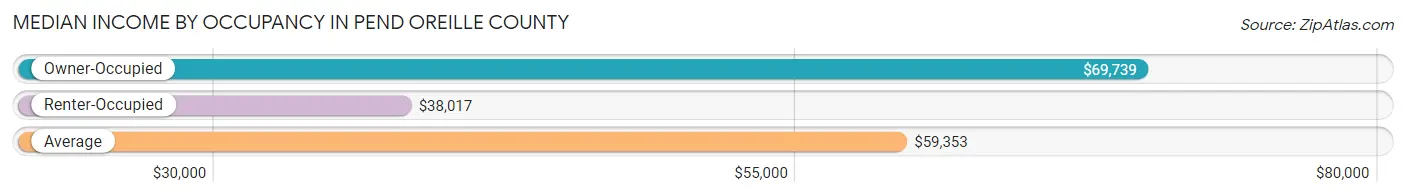
| Occupancy Type | # Households | Median Income |
| Owner-Occupied | 4,363 (76.0%) | $69,739 |
| Renter-Occupied | 1,374 (23.9%) | $38,017 |
| Average | 5,737 (100.0%) | $59,353 |
Occupancy by Householder Income Bracket in Pend Oreille County
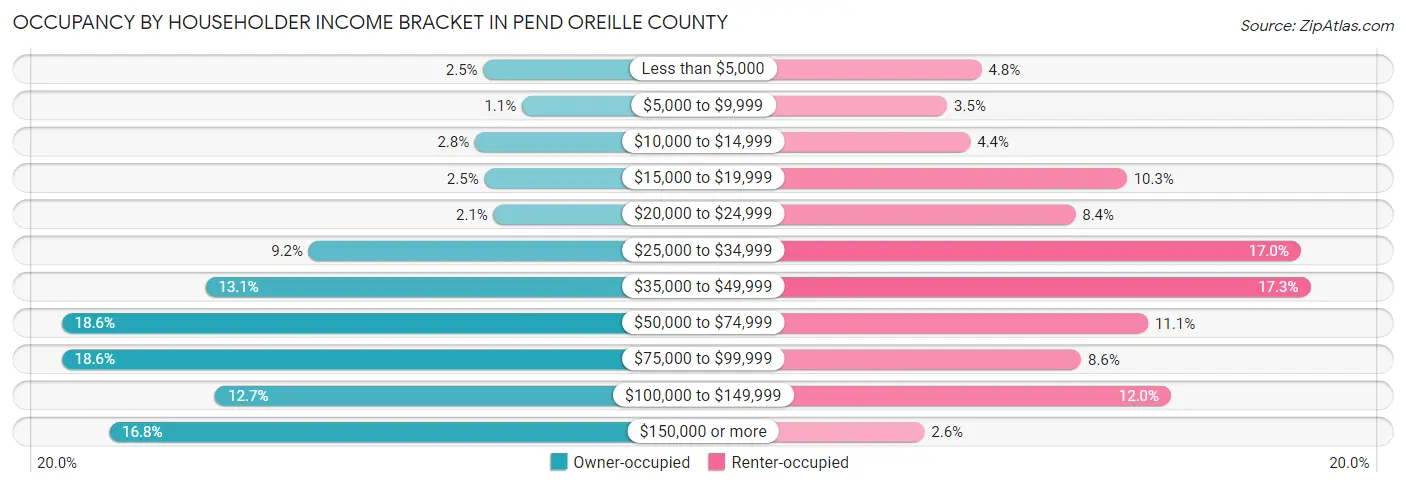
| Income Bracket | Owner-occupied | Renter-occupied |
| Less than $5,000 | 110 (2.5%) | 66 (4.8%) |
| $5,000 to $9,999 | 46 (1.1%) | 48 (3.5%) |
| $10,000 to $14,999 | 124 (2.8%) | 60 (4.4%) |
| $15,000 to $19,999 | 108 (2.5%) | 142 (10.3%) |
| $20,000 to $24,999 | 93 (2.1%) | 115 (8.4%) |
| $25,000 to $34,999 | 400 (9.2%) | 233 (17.0%) |
| $35,000 to $49,999 | 572 (13.1%) | 238 (17.3%) |
| $50,000 to $74,999 | 811 (18.6%) | 153 (11.1%) |
| $75,000 to $99,999 | 811 (18.6%) | 118 (8.6%) |
| $100,000 to $149,999 | 556 (12.7%) | 165 (12.0%) |
| $150,000 or more | 732 (16.8%) | 36 (2.6%) |
| Total | 4,363 (100.0%) | 1,374 (100.0%) |
Monthly Housing Cost Tiers in Pend Oreille County
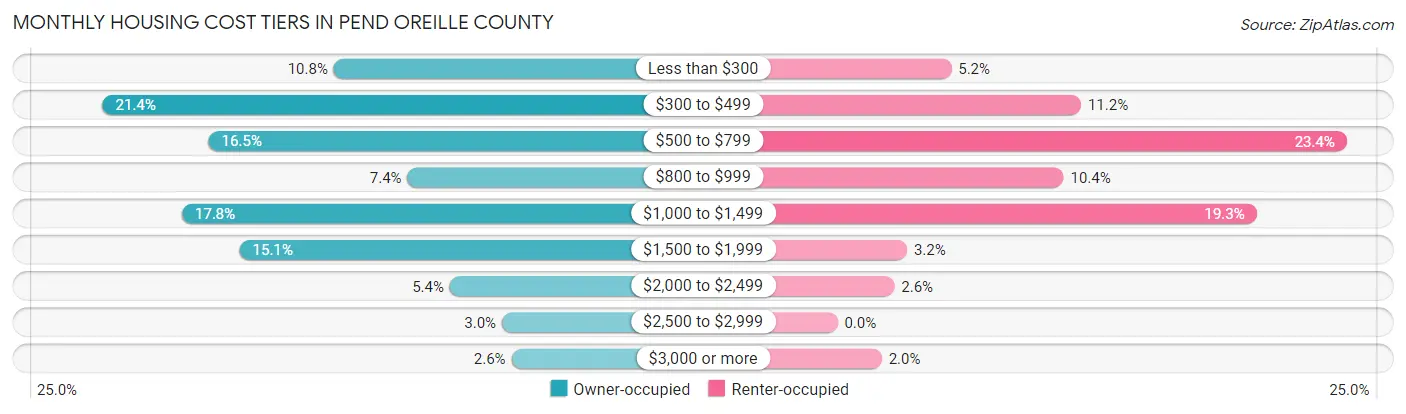
| Monthly Cost | Owner-occupied | Renter-occupied |
| Less than $300 | 470 (10.8%) | 72 (5.2%) |
| $300 to $499 | 934 (21.4%) | 154 (11.2%) |
| $500 to $799 | 721 (16.5%) | 322 (23.4%) |
| $800 to $999 | 322 (7.4%) | 143 (10.4%) |
| $1,000 to $1,499 | 775 (17.8%) | 265 (19.3%) |
| $1,500 to $1,999 | 659 (15.1%) | 44 (3.2%) |
| $2,000 to $2,499 | 237 (5.4%) | 36 (2.6%) |
| $2,500 to $2,999 | 132 (3.0%) | 0 (0.0%) |
| $3,000 or more | 113 (2.6%) | 28 (2.0%) |
| Total | 4,363 (100.0%) | 1,374 (100.0%) |
Physical Housing Characteristics in Pend Oreille County
Housing Structures in Pend Oreille County
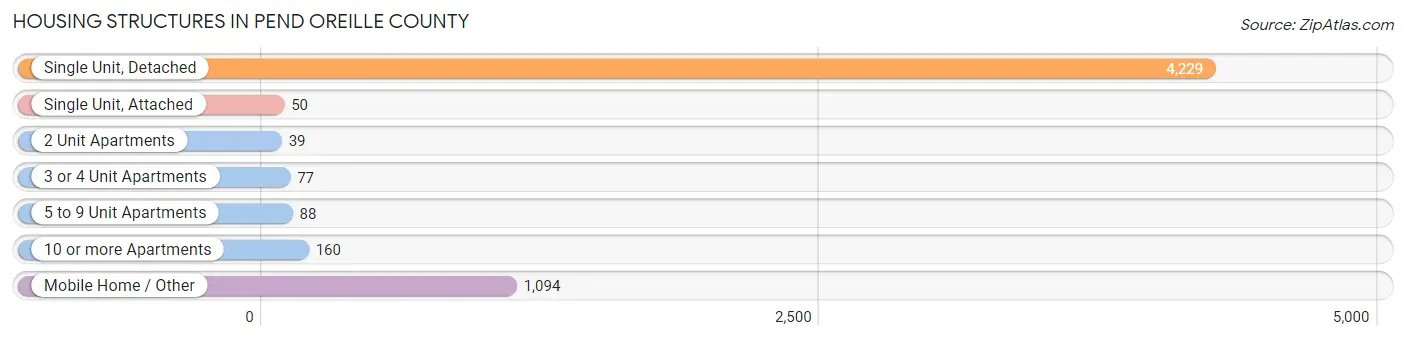
| Structure Type | # Housing Units | % Housing Units |
| Single Unit, Detached | 4,229 | 73.7% |
| Single Unit, Attached | 50 | 0.9% |
| 2 Unit Apartments | 39 | 0.7% |
| 3 or 4 Unit Apartments | 77 | 1.3% |
| 5 to 9 Unit Apartments | 88 | 1.5% |
| 10 or more Apartments | 160 | 2.8% |
| Mobile Home / Other | 1,094 | 19.1% |
| Total | 5,737 | 100.0% |
Housing Structures by Occupancy in Pend Oreille County
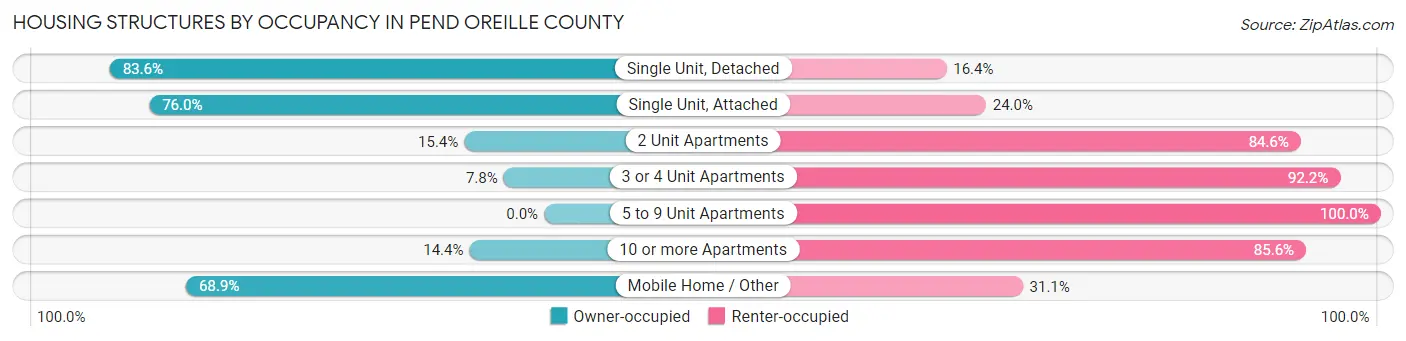
| Structure Type | Owner-occupied | Renter-occupied |
| Single Unit, Detached | 3,536 (83.6%) | 693 (16.4%) |
| Single Unit, Attached | 38 (76.0%) | 12 (24.0%) |
| 2 Unit Apartments | 6 (15.4%) | 33 (84.6%) |
| 3 or 4 Unit Apartments | 6 (7.8%) | 71 (92.2%) |
| 5 to 9 Unit Apartments | 0 (0.0%) | 88 (100.0%) |
| 10 or more Apartments | 23 (14.4%) | 137 (85.6%) |
| Mobile Home / Other | 754 (68.9%) | 340 (31.1%) |
| Total | 4,363 (76.0%) | 1,374 (23.9%) |
Housing Structures by Number of Rooms in Pend Oreille County
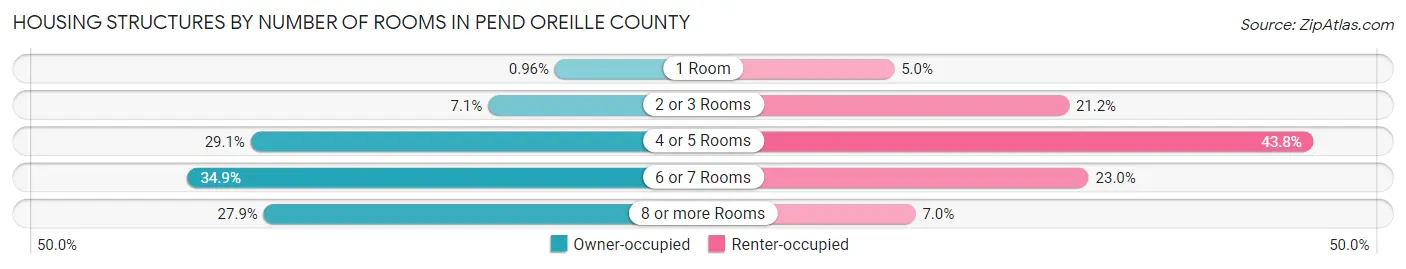
| Number of Rooms | Owner-occupied | Renter-occupied |
| 1 Room | 42 (1.0%) | 69 (5.0%) |
| 2 or 3 Rooms | 311 (7.1%) | 291 (21.2%) |
| 4 or 5 Rooms | 1,269 (29.1%) | 602 (43.8%) |
| 6 or 7 Rooms | 1,524 (34.9%) | 316 (23.0%) |
| 8 or more Rooms | 1,217 (27.9%) | 96 (7.0%) |
| Total | 4,363 (100.0%) | 1,374 (100.0%) |
Housing Structure by Heating Type in Pend Oreille County
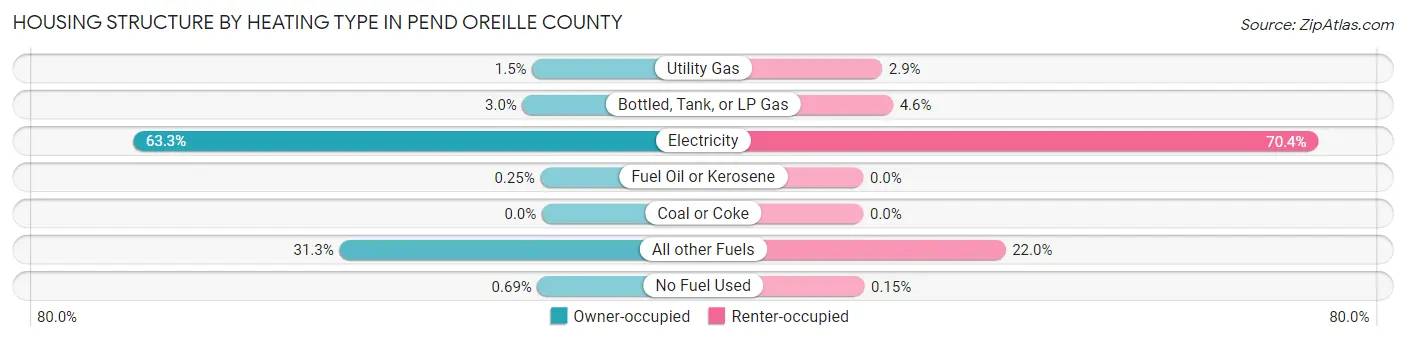
| Heating Type | Owner-occupied | Renter-occupied |
| Utility Gas | 65 (1.5%) | 40 (2.9%) |
| Bottled, Tank, or LP Gas | 131 (3.0%) | 63 (4.6%) |
| Electricity | 2,760 (63.3%) | 967 (70.4%) |
| Fuel Oil or Kerosene | 11 (0.3%) | 0 (0.0%) |
| Coal or Coke | 0 (0.0%) | 0 (0.0%) |
| All other Fuels | 1,366 (31.3%) | 302 (22.0%) |
| No Fuel Used | 30 (0.7%) | 2 (0.2%) |
| Total | 4,363 (100.0%) | 1,374 (100.0%) |
Household Vehicle Usage in Pend Oreille County
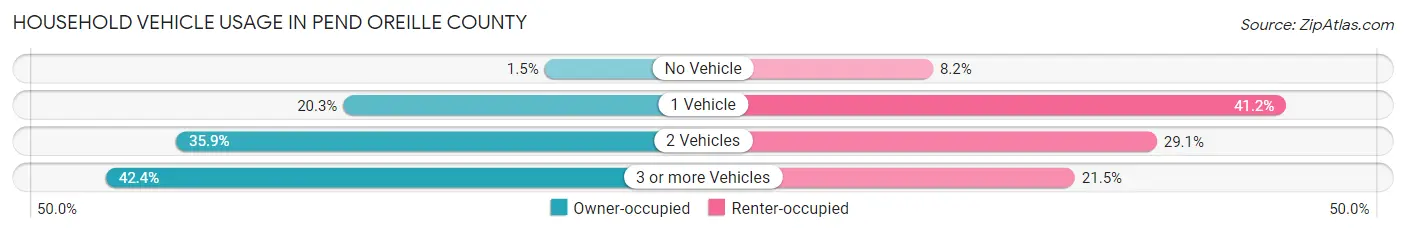
| Vehicles per Household | Owner-occupied | Renter-occupied |
| No Vehicle | 64 (1.5%) | 113 (8.2%) |
| 1 Vehicle | 884 (20.3%) | 566 (41.2%) |
| 2 Vehicles | 1,564 (35.8%) | 400 (29.1%) |
| 3 or more Vehicles | 1,851 (42.4%) | 295 (21.5%) |
| Total | 4,363 (100.0%) | 1,374 (100.0%) |
Real Estate & Mortgages in Pend Oreille County
Real Estate and Mortgage Overview in Pend Oreille County
| Characteristic | Without Mortgage | With Mortgage |
| Housing Units | 2,122 | 2,241 |
| Median Property Value | $263,200 | $303,200 |
| Median Household Income | $54,897 | $487 |
| Monthly Housing Costs | $448 | $113 |
| Real Estate Taxes | $1,996 | $36 |
Property Value by Mortgage Status in Pend Oreille County
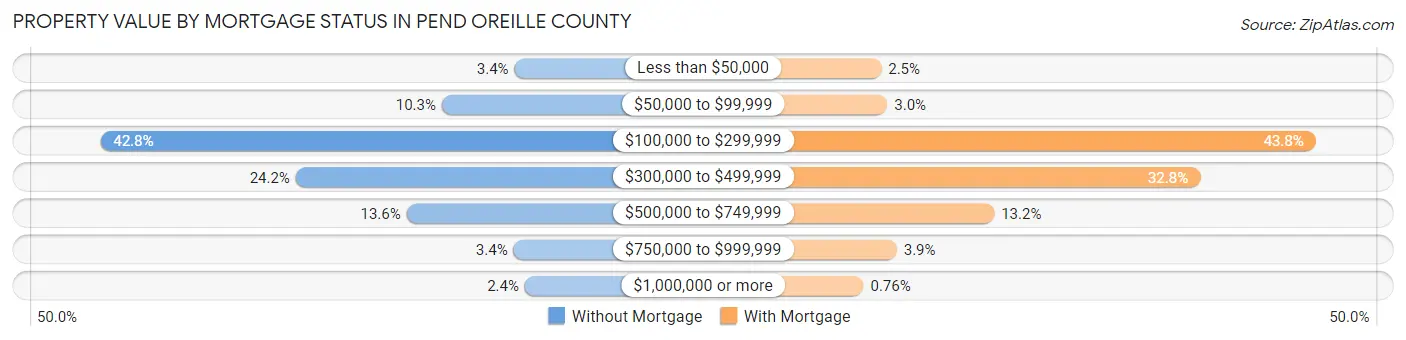
| Property Value | Without Mortgage | With Mortgage |
| Less than $50,000 | 71 (3.4%) | 55 (2.5%) |
| $50,000 to $99,999 | 218 (10.3%) | 68 (3.0%) |
| $100,000 to $299,999 | 908 (42.8%) | 982 (43.8%) |
| $300,000 to $499,999 | 513 (24.2%) | 735 (32.8%) |
| $500,000 to $749,999 | 289 (13.6%) | 296 (13.2%) |
| $750,000 to $999,999 | 73 (3.4%) | 88 (3.9%) |
| $1,000,000 or more | 50 (2.4%) | 17 (0.8%) |
| Total | 2,122 (100.0%) | 2,241 (100.0%) |
Household Income by Mortgage Status in Pend Oreille County
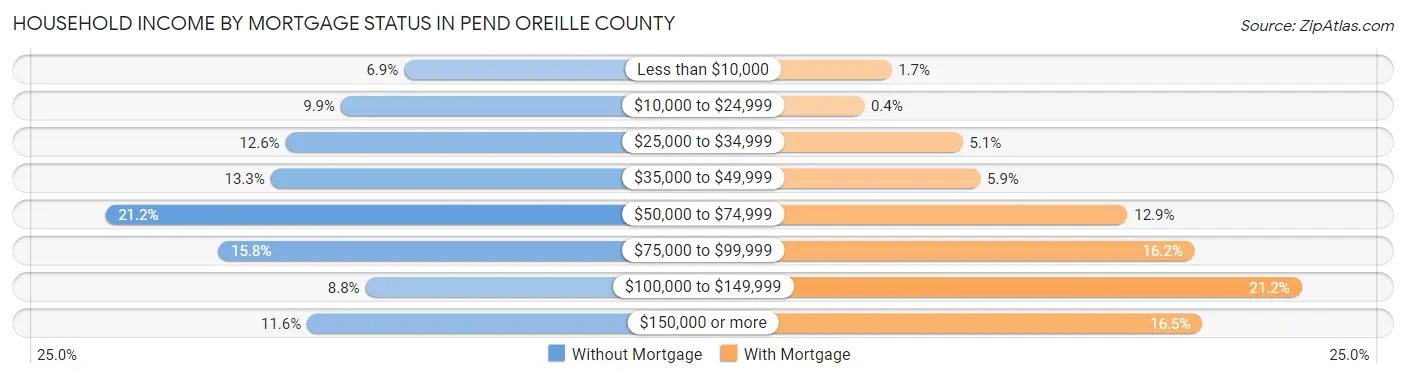
| Household Income | Without Mortgage | With Mortgage |
| Less than $10,000 | 147 (6.9%) | 38 (1.7%) |
| $10,000 to $24,999 | 211 (9.9%) | 9 (0.4%) |
| $25,000 to $34,999 | 267 (12.6%) | 114 (5.1%) |
| $35,000 to $49,999 | 282 (13.3%) | 133 (5.9%) |
| $50,000 to $74,999 | 449 (21.2%) | 290 (12.9%) |
| $75,000 to $99,999 | 335 (15.8%) | 362 (16.2%) |
| $100,000 to $149,999 | 186 (8.8%) | 476 (21.2%) |
| $150,000 or more | 245 (11.6%) | 370 (16.5%) |
| Total | 2,122 (100.0%) | 2,241 (100.0%) |
Property Value to Household Income Ratio in Pend Oreille County
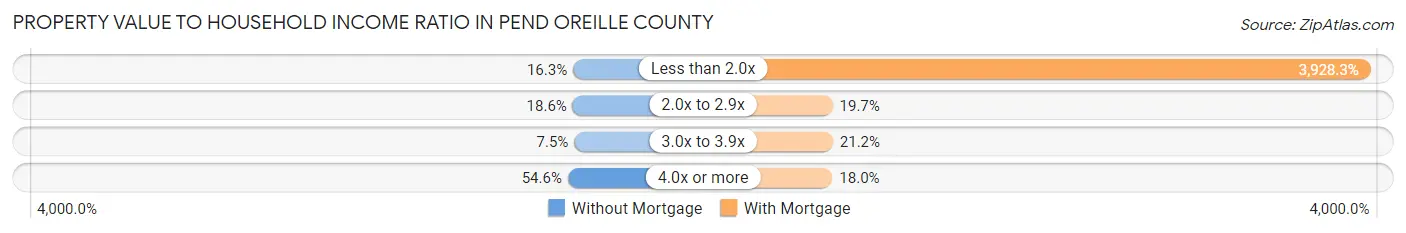
| Value-to-Income Ratio | Without Mortgage | With Mortgage |
| Less than 2.0x | 346 (16.3%) | 88,032 (3,928.2%) |
| 2.0x to 2.9x | 395 (18.6%) | 442 (19.7%) |
| 3.0x to 3.9x | 160 (7.5%) | 475 (21.2%) |
| 4.0x or more | 1,158 (54.6%) | 404 (18.0%) |
| Total | 2,122 (100.0%) | 2,241 (100.0%) |
Real Estate Taxes by Mortgage Status in Pend Oreille County
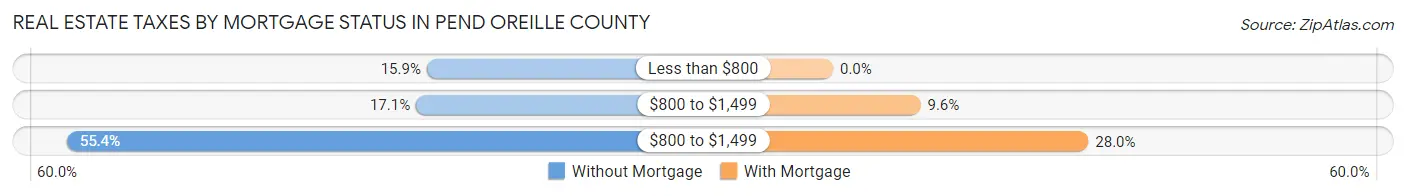
| Property Taxes | Without Mortgage | With Mortgage |
| Less than $800 | 338 (15.9%) | 0 (0.0%) |
| $800 to $1,499 | 363 (17.1%) | 215 (9.6%) |
| $800 to $1,499 | 1,175 (55.4%) | 627 (28.0%) |
| Total | 2,122 (100.0%) | 2,241 (100.0%) |
Health & Disability in Pend Oreille County
Health Insurance Coverage by Age in Pend Oreille County
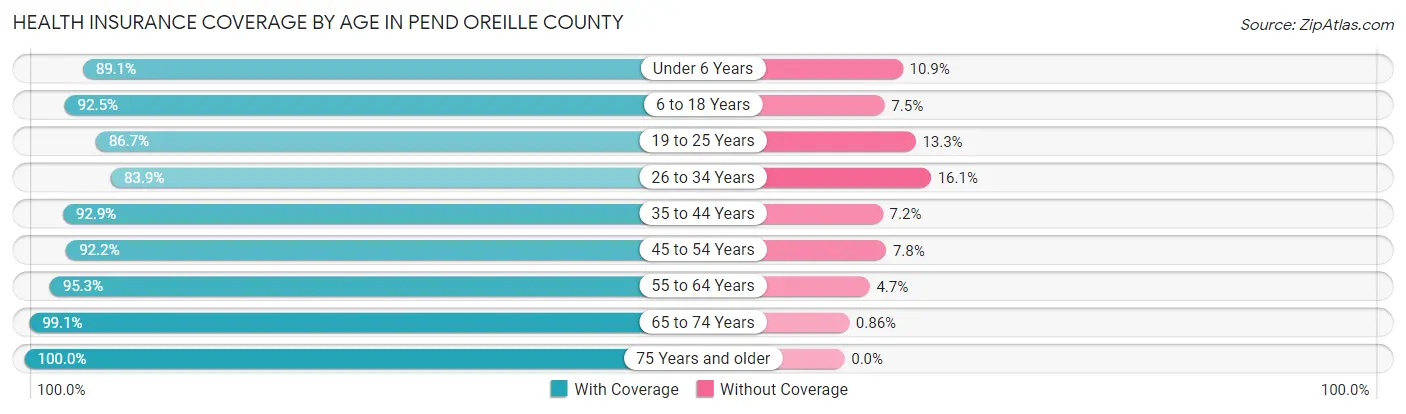
| Age Bracket | With Coverage | Without Coverage |
| Under 6 Years | 763 (89.1%) | 93 (10.9%) |
| 6 to 18 Years | 1,743 (92.5%) | 141 (7.5%) |
| 19 to 25 Years | 765 (86.7%) | 117 (13.3%) |
| 26 to 34 Years | 999 (83.9%) | 192 (16.1%) |
| 35 to 44 Years | 1,117 (92.8%) | 86 (7.1%) |
| 45 to 54 Years | 1,388 (92.2%) | 117 (7.8%) |
| 55 to 64 Years | 2,250 (95.3%) | 111 (4.7%) |
| 65 to 74 Years | 2,306 (99.1%) | 20 (0.9%) |
| 75 Years and older | 1,255 (100.0%) | 0 (0.0%) |
| Total | 12,586 (93.5%) | 877 (6.5%) |
Health Insurance Coverage by Citizenship Status in Pend Oreille County
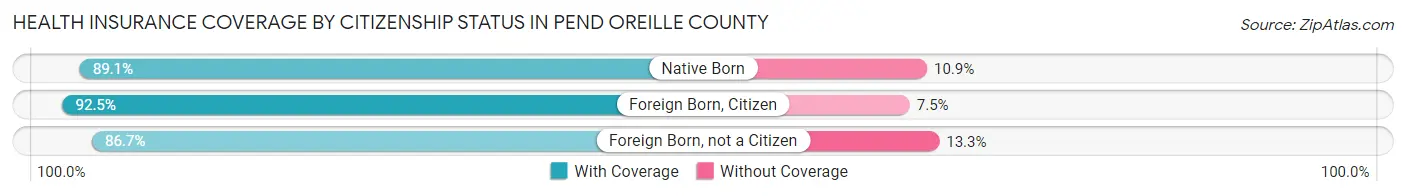
| Citizenship Status | With Coverage | Without Coverage |
| Native Born | 763 (89.1%) | 93 (10.9%) |
| Foreign Born, Citizen | 1,743 (92.5%) | 141 (7.5%) |
| Foreign Born, not a Citizen | 765 (86.7%) | 117 (13.3%) |
Health Insurance Coverage by Household Income in Pend Oreille County
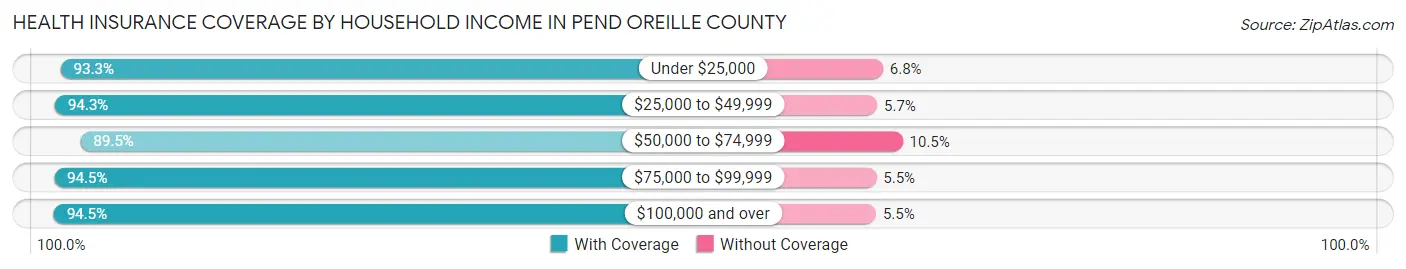
| Household Income | With Coverage | Without Coverage |
| Under $25,000 | 1,341 (93.2%) | 97 (6.8%) |
| $25,000 to $49,999 | 2,804 (94.3%) | 169 (5.7%) |
| $50,000 to $74,999 | 2,071 (89.5%) | 242 (10.5%) |
| $75,000 to $99,999 | 2,353 (94.5%) | 138 (5.5%) |
| $100,000 and over | 3,995 (94.5%) | 231 (5.5%) |
Public vs Private Health Insurance Coverage by Age in Pend Oreille County
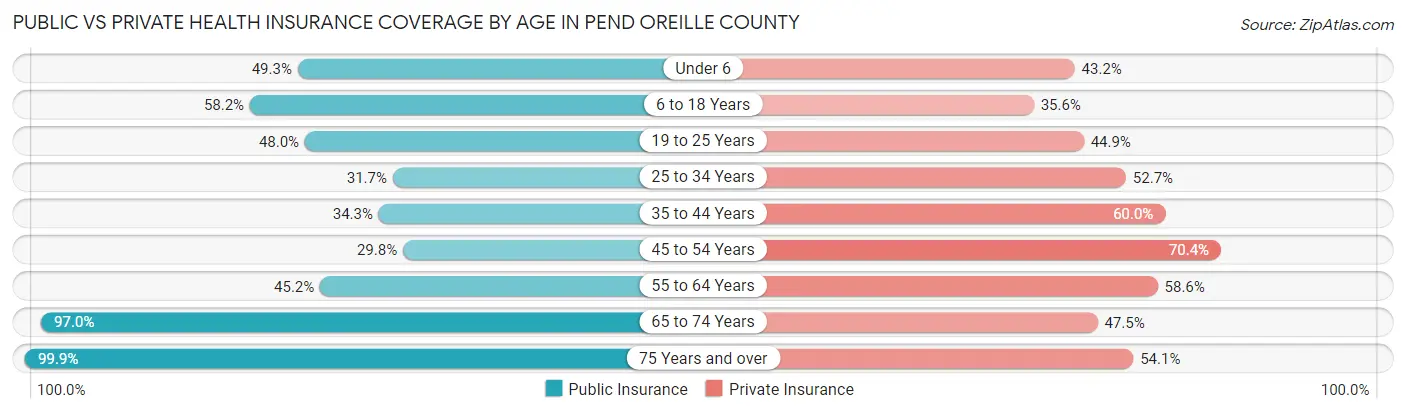
| Age Bracket | Public Insurance | Private Insurance |
| Under 6 | 422 (49.3%) | 370 (43.2%) |
| 6 to 18 Years | 1,096 (58.2%) | 671 (35.6%) |
| 19 to 25 Years | 423 (48.0%) | 396 (44.9%) |
| 25 to 34 Years | 377 (31.7%) | 628 (52.7%) |
| 35 to 44 Years | 412 (34.3%) | 722 (60.0%) |
| 45 to 54 Years | 448 (29.8%) | 1,059 (70.4%) |
| 55 to 64 Years | 1,066 (45.2%) | 1,384 (58.6%) |
| 65 to 74 Years | 2,255 (97.0%) | 1,104 (47.5%) |
| 75 Years and over | 1,254 (99.9%) | 679 (54.1%) |
| Total | 7,753 (57.6%) | 7,013 (52.1%) |
Disability Status by Sex by Age in Pend Oreille County
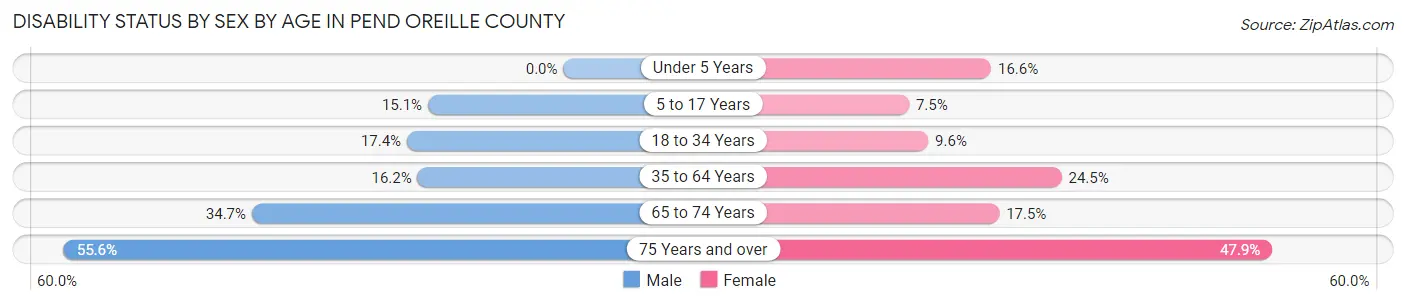
| Age Bracket | Male | Female |
| Under 5 Years | 0 (0.0%) | 54 (16.6%) |
| 5 to 17 Years | 171 (15.1%) | 65 (7.5%) |
| 18 to 34 Years | 203 (17.4%) | 101 (9.6%) |
| 35 to 64 Years | 419 (16.2%) | 609 (24.5%) |
| 65 to 74 Years | 427 (34.7%) | 192 (17.5%) |
| 75 Years and over | 336 (55.6%) | 312 (47.9%) |
Disability Class by Sex by Age in Pend Oreille County
Disability Class: Hearing Difficulty
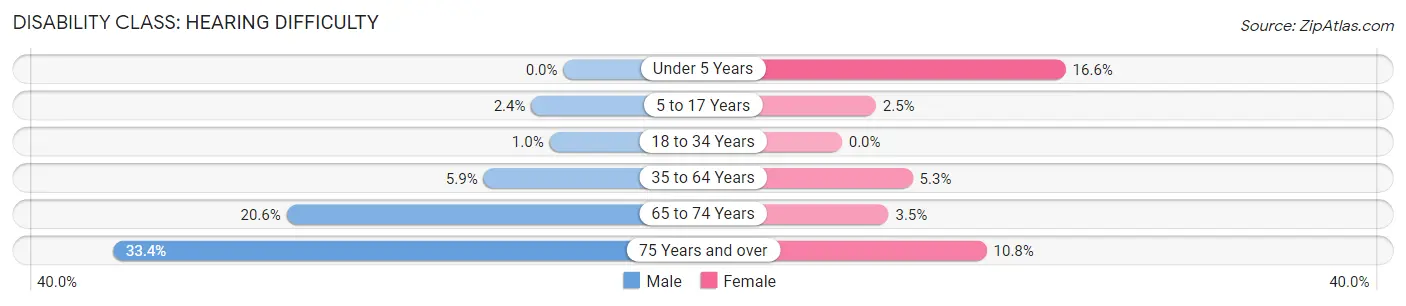
| Age Bracket | Male | Female |
| Under 5 Years | 0 (0.0%) | 54 (16.6%) |
| 5 to 17 Years | 27 (2.4%) | 22 (2.5%) |
| 18 to 34 Years | 12 (1.0%) | 0 (0.0%) |
| 35 to 64 Years | 153 (5.9%) | 131 (5.3%) |
| 65 to 74 Years | 253 (20.5%) | 38 (3.5%) |
| 75 Years and over | 202 (33.4%) | 70 (10.7%) |
Disability Class: Vision Difficulty
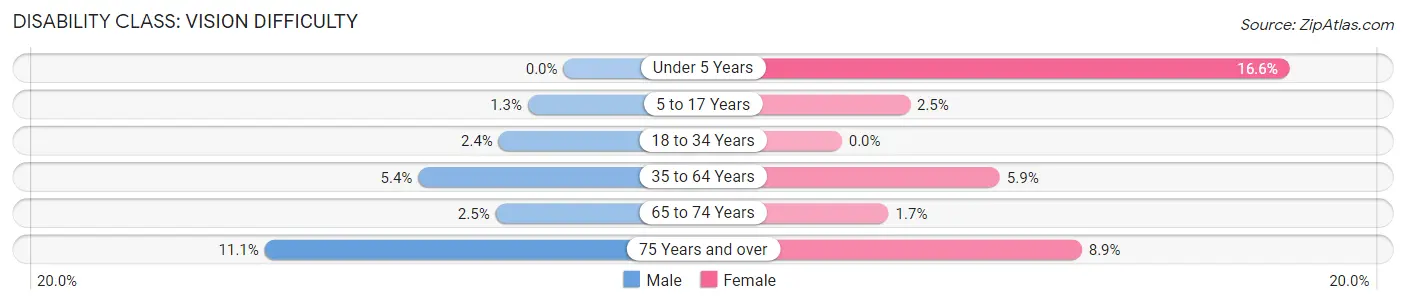
| Age Bracket | Male | Female |
| Under 5 Years | 0 (0.0%) | 54 (16.6%) |
| 5 to 17 Years | 15 (1.3%) | 22 (2.5%) |
| 18 to 34 Years | 28 (2.4%) | 0 (0.0%) |
| 35 to 64 Years | 139 (5.4%) | 146 (5.9%) |
| 65 to 74 Years | 31 (2.5%) | 19 (1.7%) |
| 75 Years and over | 67 (11.1%) | 58 (8.9%) |
Disability Class: Cognitive Difficulty
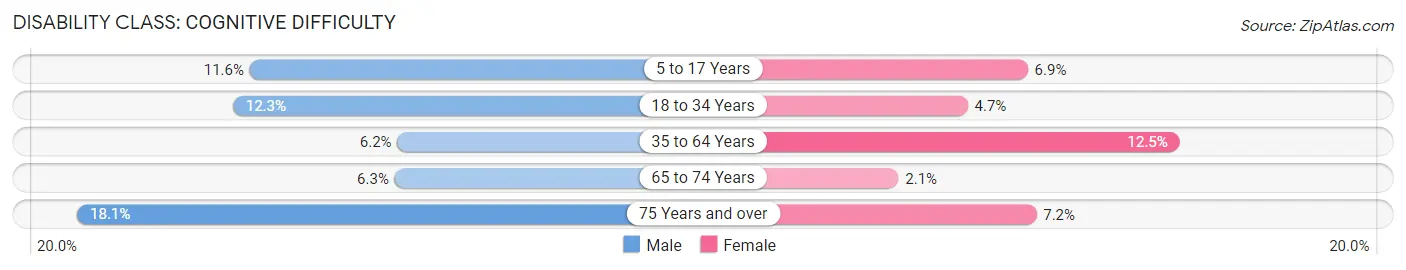
| Age Bracket | Male | Female |
| 5 to 17 Years | 132 (11.6%) | 60 (6.9%) |
| 18 to 34 Years | 143 (12.3%) | 49 (4.7%) |
| 35 to 64 Years | 159 (6.2%) | 312 (12.5%) |
| 65 to 74 Years | 77 (6.3%) | 23 (2.1%) |
| 75 Years and over | 109 (18.0%) | 47 (7.2%) |
Disability Class: Ambulatory Difficulty
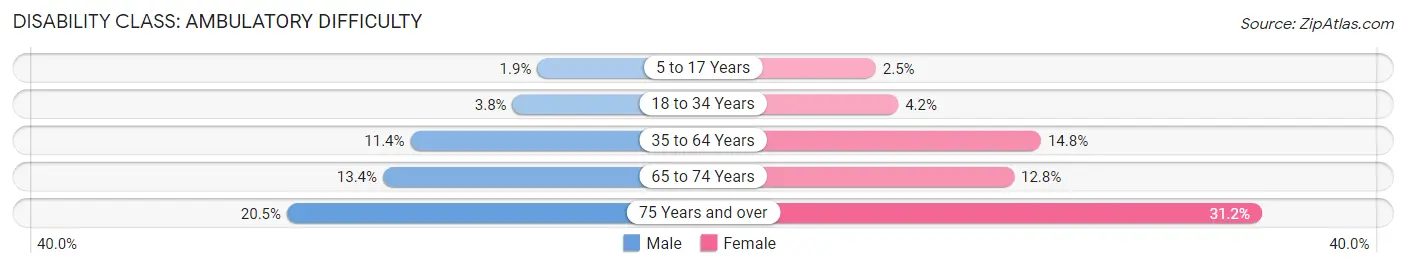
| Age Bracket | Male | Female |
| 5 to 17 Years | 22 (1.9%) | 22 (2.5%) |
| 18 to 34 Years | 44 (3.8%) | 44 (4.2%) |
| 35 to 64 Years | 293 (11.4%) | 368 (14.8%) |
| 65 to 74 Years | 165 (13.4%) | 140 (12.8%) |
| 75 Years and over | 124 (20.5%) | 203 (31.2%) |
Disability Class: Self-Care Difficulty
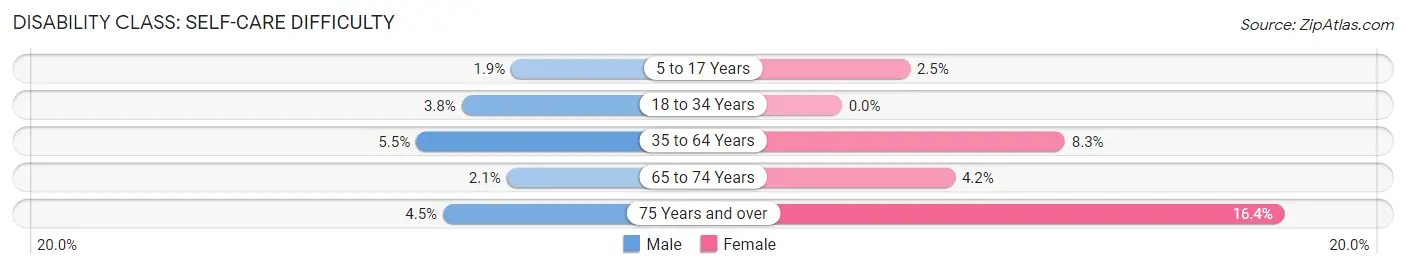
| Age Bracket | Male | Female |
| 5 to 17 Years | 22 (1.9%) | 22 (2.5%) |
| 18 to 34 Years | 44 (3.8%) | 0 (0.0%) |
| 35 to 64 Years | 141 (5.5%) | 206 (8.3%) |
| 65 to 74 Years | 26 (2.1%) | 46 (4.2%) |
| 75 Years and over | 27 (4.5%) | 107 (16.4%) |
Technology Access in Pend Oreille County
Computing Device Access in Pend Oreille County
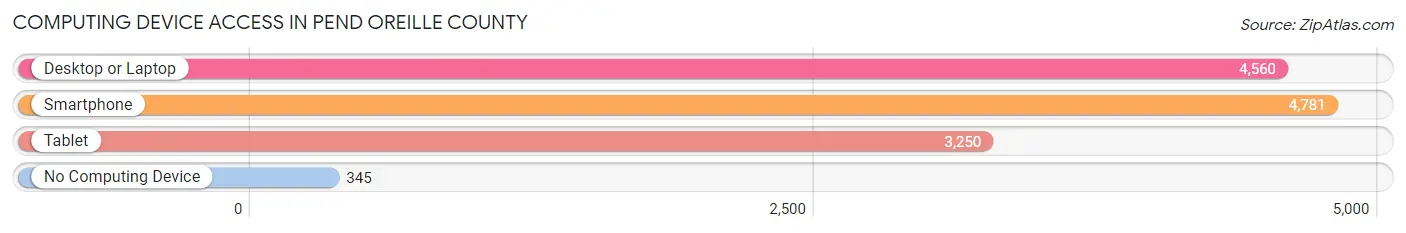
| Device Type | # Households | % Households |
| Desktop or Laptop | 4,560 | 79.5% |
| Smartphone | 4,781 | 83.3% |
| Tablet | 3,250 | 56.7% |
| No Computing Device | 345 | 6.0% |
| Total | 5,737 | 100.0% |
Internet Access in Pend Oreille County
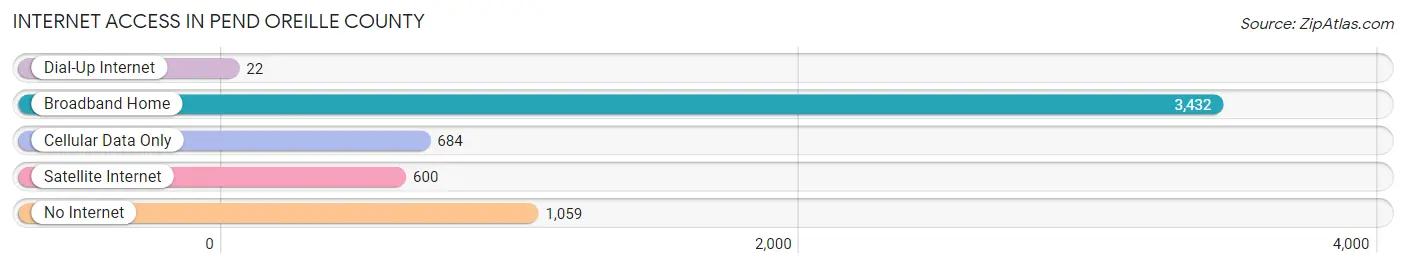
| Internet Type | # Households | % Households |
| Dial-Up Internet | 22 | 0.4% |
| Broadband Home | 3,432 | 59.8% |
| Cellular Data Only | 684 | 11.9% |
| Satellite Internet | 600 | 10.5% |
| No Internet | 1,059 | 18.5% |
| Total | 5,737 | 100.0% |
Pend Oreille County Summary
Pend Oreille County is located in the northeastern corner of Washington State, and is bordered by the Canadian province of British Columbia to the north, Stevens County to the east, Spokane County to the south, and Ferry County to the west. The county seat is Newport, and the largest city is Cusick. The county was created in 1911 and named after the Pend Oreille River, which flows through the county.
Geography
Pend Oreille County covers an area of 1,722 square miles, making it the second largest county in Washington State. The county is located in the Selkirk Mountains, and is home to several mountain ranges, including the Selkirk, Cabinet, and Bitterroot Mountains. The highest point in the county is Mount Bonaparte, which has an elevation of 6,817 feet. The county is also home to several rivers, including the Pend Oreille River, Priest River, and Little Spokane River. The county is mostly forested, with the majority of the land being managed by the United States Forest Service.
Climate
Pend Oreille County has a humid continental climate, with cold winters and warm summers. The average annual temperature is 44°F, and the average annual precipitation is 28 inches.
Demographics
As of the 2010 census, there were 13,001 people, 5,541 households, and 3,717 families living in the county. The population density was 8 people per square mile. The racial makeup of the county was 94.3% White, 0.5% African American, 1.2% Native American, 0.4% Asian, 0.1% Pacific Islander, 1.2% from other races, and 2.3% from two or more races. Hispanic or Latino of any race were 3.3% of the population.
The median income for a household in the county was $35,945, and the median income for a family was $44,945. The per capita income for the county was $19,945. About 14.3% of families and 18.2% of the population were below the poverty line, including 25.2% of those under age 18 and 10.2% of those age 65 or over.
Economy
The economy of Pend Oreille County is largely based on agriculture, forestry, and tourism. The county is home to several large timber companies, and the timber industry is the largest employer in the county. Other major industries include mining, manufacturing, and retail. The county is also home to several recreational areas, including the Pend Oreille River, Priest Lake, and the Pend Oreille National Wildlife Refuge.
Conclusion
Pend Oreille County is a rural county located in the northeastern corner of Washington State. The county is home to several mountain ranges, rivers, and forests, and has a humid continental climate. The population of the county is largely white, and the median income for a household is $35,945. The economy of the county is largely based on agriculture, forestry, and tourism. The county is home to several recreational areas, and is a popular destination for outdoor enthusiasts.
Common Questions
What is Per Capita Income in Pend Oreille County?
Per Capita income in Pend Oreille County is $33,981.
What is the Median Family Income in Pend Oreille County?
Median Family Income in Pend Oreille County is $75,593.
What is the Median Household income in Pend Oreille County?
Median Household Income in Pend Oreille County is $59,353.
What is Income or Wage Gap in Pend Oreille County?
Income or Wage Gap in Pend Oreille County is 31.8%.
Women in Pend Oreille County earn 68.2 cents for every dollar earned by a man.
What is Family Income Deficit in Pend Oreille County?
Family Income Deficit in Pend Oreille County is $10,334.
Families that are below poverty line in Pend Oreille County earn $10,334 less on average than the poverty threshold level.
What is Inequality or Gini Index in Pend Oreille County?
Inequality or Gini Index in Pend Oreille County is 0.43.
What is the Total Population of Pend Oreille County?
Total Population of Pend Oreille County is 13,570.
What is the Total Male Population of Pend Oreille County?
Total Male Population of Pend Oreille County is 7,057.
What is the Total Female Population of Pend Oreille County?
Total Female Population of Pend Oreille County is 6,513.
What is the Ratio of Males per 100 Females in Pend Oreille County?
There are 108.35 Males per 100 Females in Pend Oreille County.
What is the Ratio of Females per 100 Males in Pend Oreille County?
There are 92.29 Females per 100 Males in Pend Oreille County.
What is the Median Population Age in Pend Oreille County?
Median Population Age in Pend Oreille County is 50.4 Years.
What is the Average Family Size in Pend Oreille County
Average Family Size in Pend Oreille County is 2.7 People.
What is the Average Household Size in Pend Oreille County
Average Household Size in Pend Oreille County is 2.3 People.
How Large is the Labor Force in Pend Oreille County?
There are 5,256 People in the Labor Forcein in Pend Oreille County.
What is the Percentage of People in the Labor Force in Pend Oreille County?
46.7% of People are in the Labor Force in Pend Oreille County.
What is the Unemployment Rate in Pend Oreille County?
Unemployment Rate in Pend Oreille County is 6.1%.