Lincoln County, WA Map & Demographics
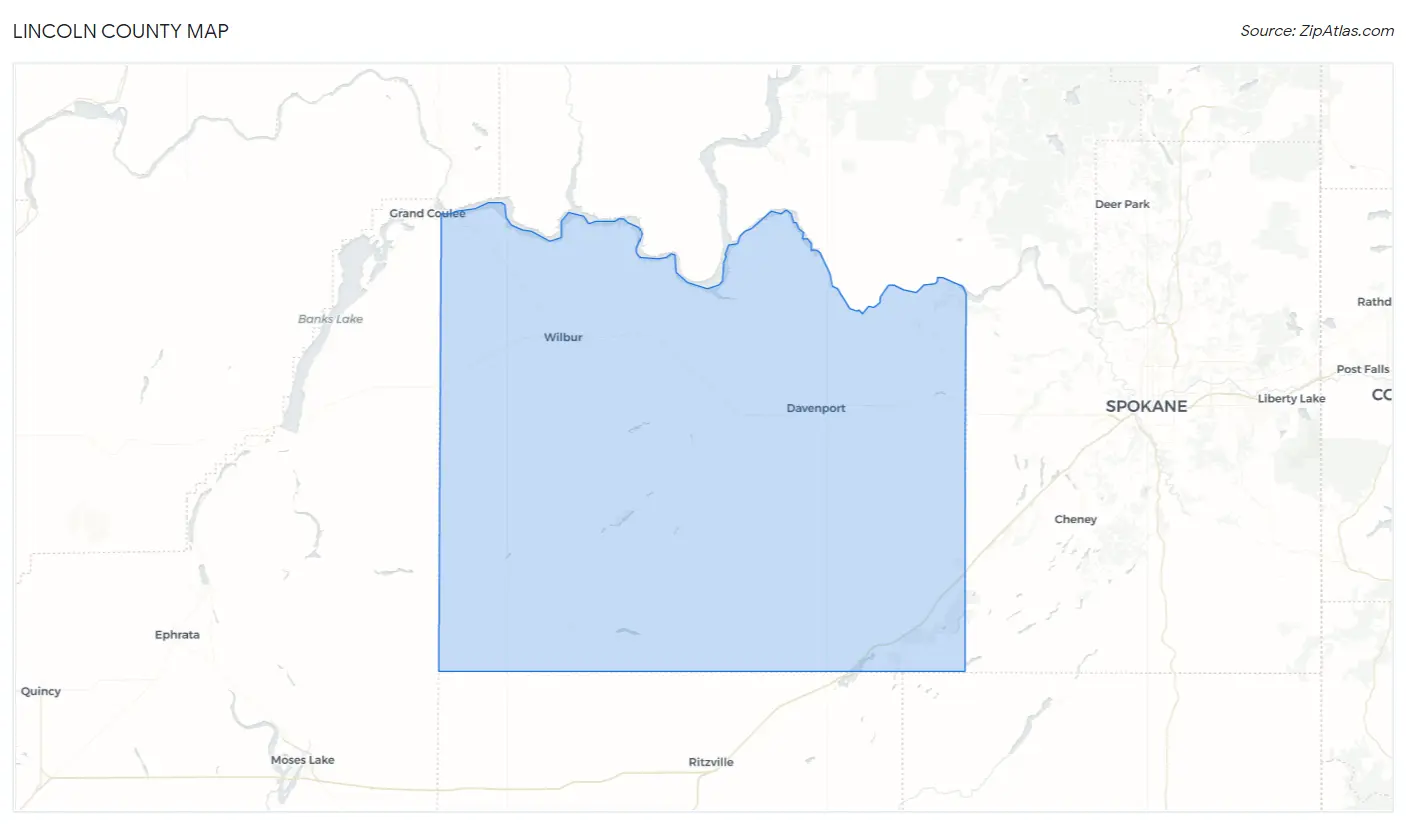
Lincoln County Map
Lincoln County Overview
$36,741
PER CAPITA INCOME
$78,894
AVG FAMILY INCOME
$68,172
AVG HOUSEHOLD INCOME
25.8%
WAGE / INCOME GAP [ % ]
74.2¢/ $1
WAGE / INCOME GAP [ $ ]
$11,811
FAMILY INCOME DEFICIT
0.44
INEQUALITY / GINI INDEX
11,036
TOTAL POPULATION
5,587
MALE POPULATION
5,449
FEMALE POPULATION
102.53
MALES / 100 FEMALES
97.53
FEMALES / 100 MALES
46.7
MEDIAN AGE
3.0
AVG FAMILY SIZE
2.4
AVG HOUSEHOLD SIZE
4,825
LABOR FORCE [ PEOPLE ]
53.8%
PERCENT IN LABOR FORCE
5.3%
UNEMPLOYMENT RATE
Lincoln County Area Codes
Income in Lincoln County
Income Overview in Lincoln County
Per Capita Income in Lincoln County is $36,741, while median incomes of families and households are $78,894 and $68,172 respectively.
| Characteristic | Number | Measure |
| Per Capita Income | 11,036 | $36,741 |
| Median Family Income | 3,034 | $78,894 |
| Mean Family Income | 3,034 | $102,012 |
| Median Household Income | 4,532 | $68,172 |
| Mean Household Income | 4,532 | $87,756 |
| Income Deficit | 3,034 | $11,811 |
| Wage / Income Gap (%) | 11,036 | 25.78% |
| Wage / Income Gap ($) | 11,036 | 74.22¢ per $1 |
| Gini / Inequality Index | 11,036 | 0.44 |
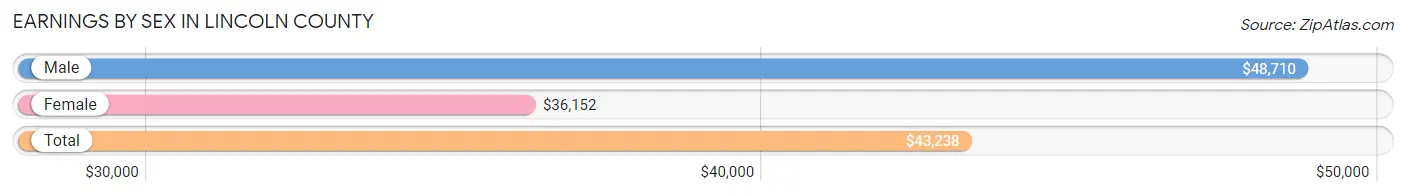
Earnings by Sex in Lincoln County
Average Earnings in Lincoln County are $43,238, $48,710 for men and $36,152 for women, a difference of 25.8%.
| Sex | Number | Average Earnings |
| Male | 2,797 (55.0%) | $48,710 |
| Female | 2,288 (45.0%) | $36,152 |
| Total | 5,085 (100.0%) | $43,238 |
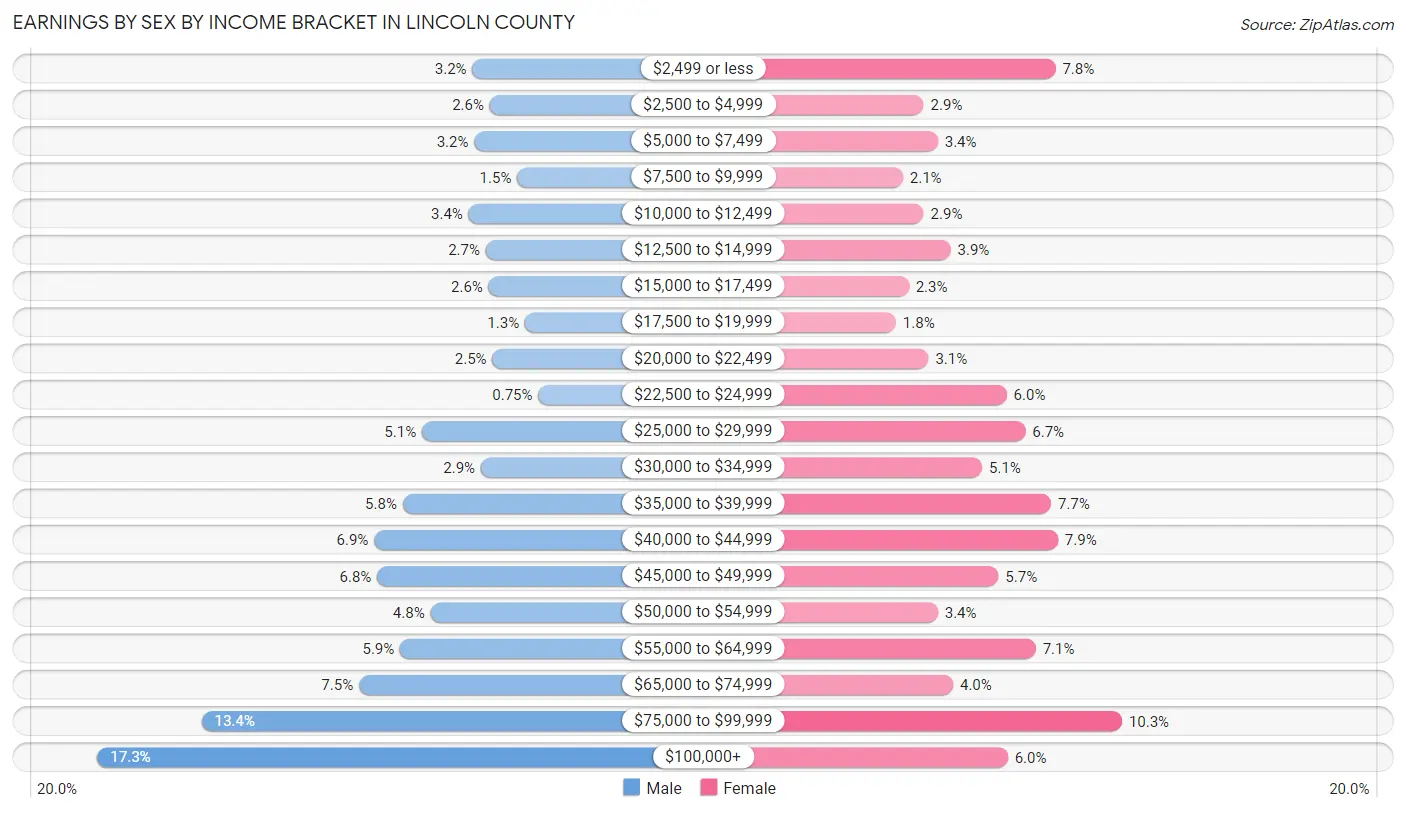
Earnings by Sex by Income Bracket in Lincoln County
The most common earnings brackets in Lincoln County are $100,000+ for men (483 | 17.3%) and $75,000 to $99,999 for women (236 | 10.3%).
| Income | Male | Female |
| $2,499 or less | 90 (3.2%) | 179 (7.8%) |
| $2,500 to $4,999 | 72 (2.6%) | 66 (2.9%) |
| $5,000 to $7,499 | 88 (3.2%) | 78 (3.4%) |
| $7,500 to $9,999 | 43 (1.5%) | 48 (2.1%) |
| $10,000 to $12,499 | 94 (3.4%) | 66 (2.9%) |
| $12,500 to $14,999 | 76 (2.7%) | 89 (3.9%) |
| $15,000 to $17,499 | 73 (2.6%) | 53 (2.3%) |
| $17,500 to $19,999 | 35 (1.3%) | 42 (1.8%) |
| $20,000 to $22,499 | 69 (2.5%) | 70 (3.1%) |
| $22,500 to $24,999 | 21 (0.7%) | 137 (6.0%) |
| $25,000 to $29,999 | 143 (5.1%) | 153 (6.7%) |
| $30,000 to $34,999 | 81 (2.9%) | 116 (5.1%) |
| $35,000 to $39,999 | 163 (5.8%) | 175 (7.6%) |
| $40,000 to $44,999 | 193 (6.9%) | 181 (7.9%) |
| $45,000 to $49,999 | 190 (6.8%) | 130 (5.7%) |
| $50,000 to $54,999 | 134 (4.8%) | 78 (3.4%) |
| $55,000 to $64,999 | 166 (5.9%) | 162 (7.1%) |
| $65,000 to $74,999 | 209 (7.5%) | 91 (4.0%) |
| $75,000 to $99,999 | 374 (13.4%) | 236 (10.3%) |
| $100,000+ | 483 (17.3%) | 138 (6.0%) |
| Total | 2,797 (100.0%) | 2,288 (100.0%) |
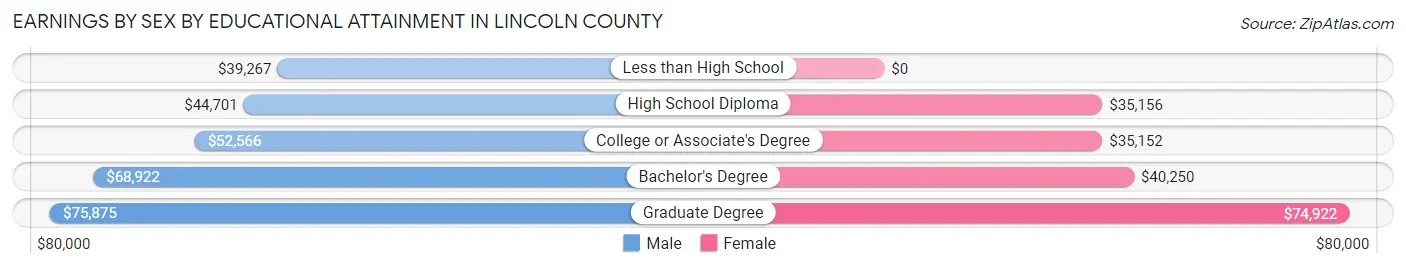
Earnings by Sex by Educational Attainment in Lincoln County
Average earnings in Lincoln County are $51,795 for men and $38,219 for women, a difference of 26.2%. Men with an educational attainment of graduate degree enjoy the highest average annual earnings of $75,875, while those with less than high school education earn the least with $39,267. Women with an educational attainment of graduate degree earn the most with the average annual earnings of $74,922, while those with college or associate's degree education have the smallest earnings of $35,152.
| Educational Attainment | Male Income | Female Income |
| Less than High School | $39,267 | $0 |
| High School Diploma | $44,701 | $35,156 |
| College or Associate's Degree | $52,566 | $35,152 |
| Bachelor's Degree | $68,922 | $40,250 |
| Graduate Degree | $75,875 | $74,922 |
| Total | $51,795 | $38,219 |
Family Income in Lincoln County
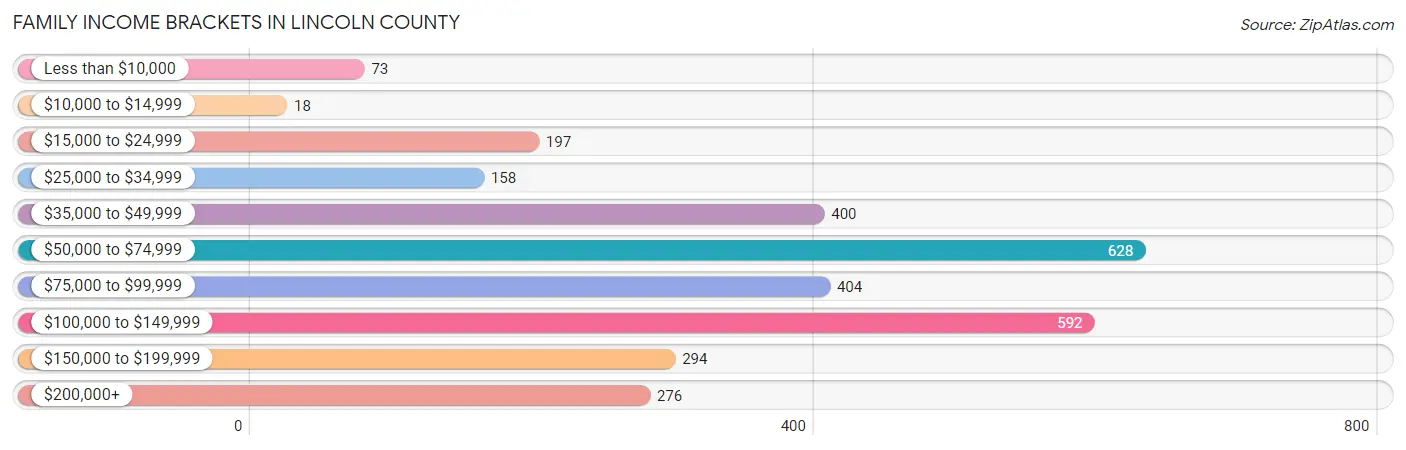
Family Income Brackets in Lincoln County
According to the Lincoln County family income data, there are 628 families falling into the $50,000 to $74,999 income range, which is the most common income bracket and makes up 20.7% of all families. Conversely, the $10,000 to $14,999 income bracket is the least frequent group with only 18 families (0.6%) belonging to this category.
| Income Bracket | # Families | % Families |
| Less than $10,000 | 73 | 2.4% |
| $10,000 to $14,999 | 18 | 0.6% |
| $15,000 to $24,999 | 197 | 6.5% |
| $25,000 to $34,999 | 158 | 5.2% |
| $35,000 to $49,999 | 400 | 13.2% |
| $50,000 to $74,999 | 628 | 20.7% |
| $75,000 to $99,999 | 404 | 13.3% |
| $100,000 to $149,999 | 592 | 19.5% |
| $150,000 to $199,999 | 294 | 9.7% |
| $200,000+ | 276 | 9.1% |
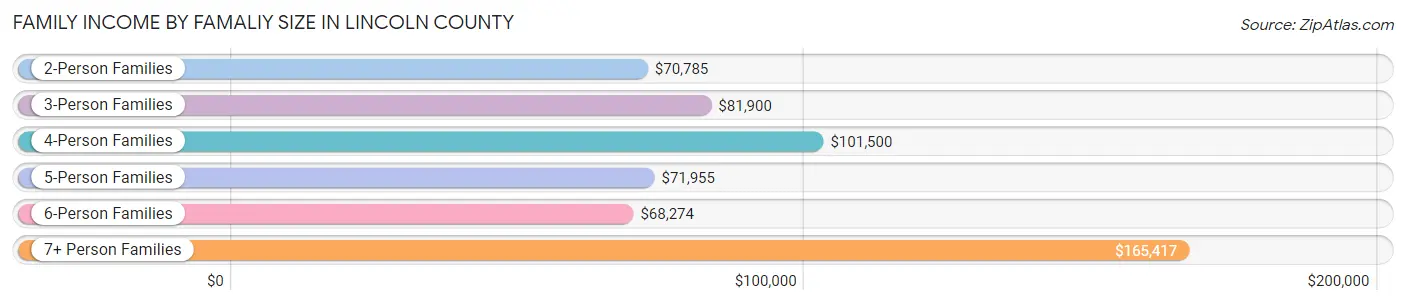
Family Income by Famaliy Size in Lincoln County
7+ person families (69 | 2.3%) account for the highest median family income in Lincoln County with $165,417 per family, while 2-person families (1,873 | 61.7%) have the highest median income of $35,392 per family member.
| Income Bracket | # Families | Median Income |
| 2-Person Families | 1,873 (61.7%) | $70,785 |
| 3-Person Families | 484 (16.0%) | $81,900 |
| 4-Person Families | 348 (11.5%) | $101,500 |
| 5-Person Families | 175 (5.8%) | $71,955 |
| 6-Person Families | 85 (2.8%) | $68,274 |
| 7+ Person Families | 69 (2.3%) | $165,417 |
| Total | 3,034 (100.0%) | $78,894 |
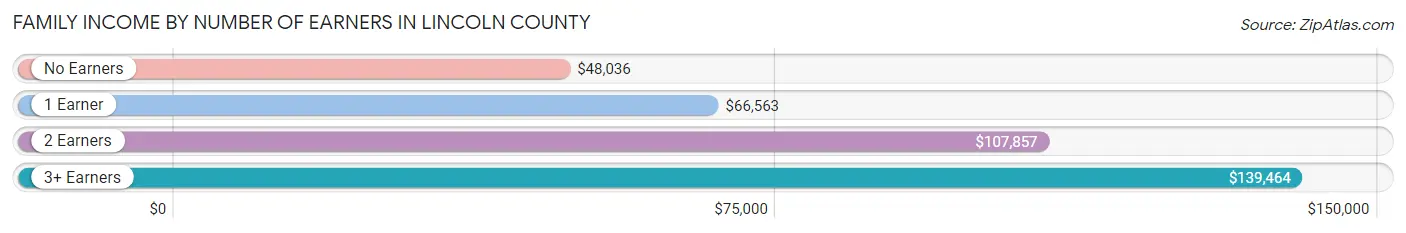
Family Income by Number of Earners in Lincoln County
The median family income in Lincoln County is $78,894, with families comprising 3+ earners (203) having the highest median family income of $139,464, while families with no earners (762) have the lowest median family income of $48,036, accounting for 6.7% and 25.1% of families, respectively.
| Number of Earners | # Families | Median Income |
| No Earners | 762 (25.1%) | $48,036 |
| 1 Earner | 871 (28.7%) | $66,563 |
| 2 Earners | 1,198 (39.5%) | $107,857 |
| 3+ Earners | 203 (6.7%) | $139,464 |
| Total | 3,034 (100.0%) | $78,894 |
Household Income in Lincoln County
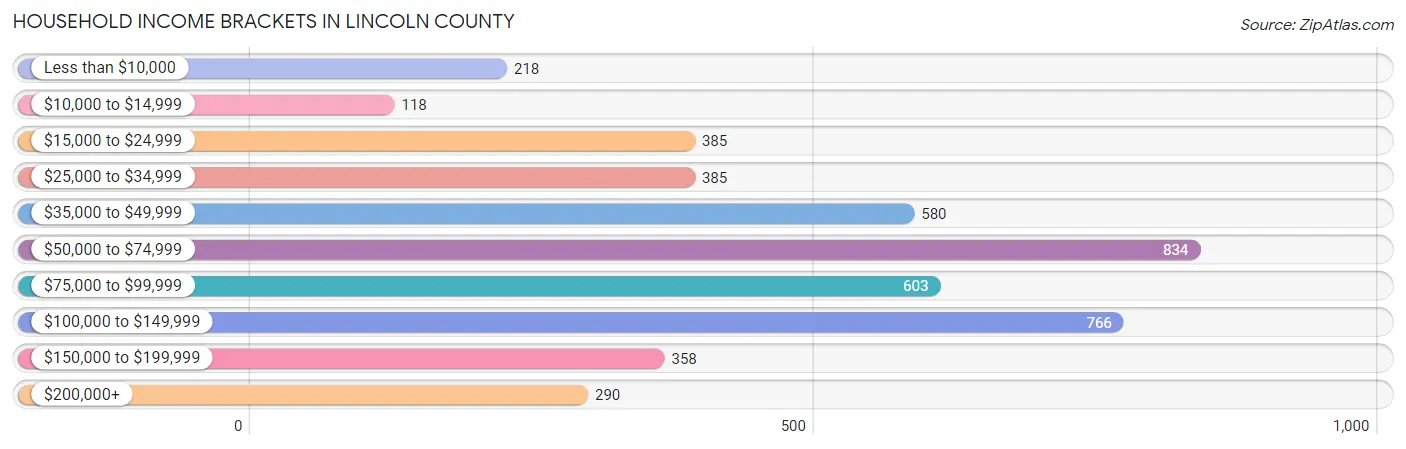
Household Income Brackets in Lincoln County
With 834 households falling in the category, the $50,000 to $74,999 income range is the most frequent in Lincoln County, accounting for 18.4% of all households. In contrast, only 118 households (2.6%) fall into the $10,000 to $14,999 income bracket, making it the least populous group.
| Income Bracket | # Households | % Households |
| Less than $10,000 | 218 | 4.8% |
| $10,000 to $14,999 | 118 | 2.6% |
| $15,000 to $24,999 | 385 | 8.5% |
| $25,000 to $34,999 | 385 | 8.5% |
| $35,000 to $49,999 | 580 | 12.8% |
| $50,000 to $74,999 | 834 | 18.4% |
| $75,000 to $99,999 | 603 | 13.3% |
| $100,000 to $149,999 | 766 | 16.9% |
| $150,000 to $199,999 | 358 | 7.9% |
| $200,000+ | 290 | 6.4% |
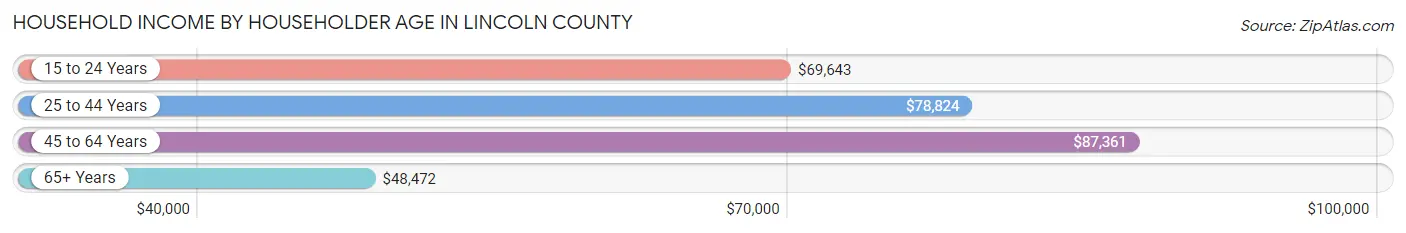
Household Income by Householder Age in Lincoln County
The median household income in Lincoln County is $68,172, with the highest median household income of $87,361 found in the 45 to 64 years age bracket for the primary householder. A total of 1,642 households (36.2%) fall into this category. Meanwhile, the 65+ years age bracket for the primary householder has the lowest median household income of $48,472, with 1,722 households (38.0%) in this group.
| Income Bracket | # Households | Median Income |
| 15 to 24 Years | 166 (3.7%) | $69,643 |
| 25 to 44 Years | 1,002 (22.1%) | $78,824 |
| 45 to 64 Years | 1,642 (36.2%) | $87,361 |
| 65+ Years | 1,722 (38.0%) | $48,472 |
| Total | 4,532 (100.0%) | $68,172 |
Poverty in Lincoln County
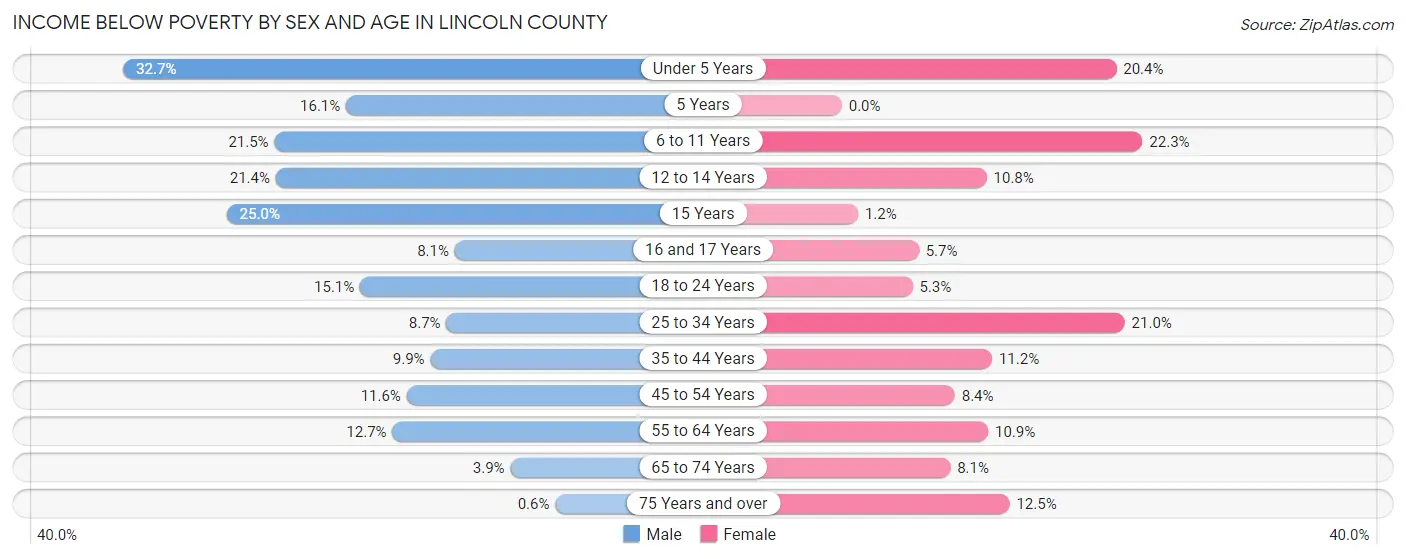
Income Below Poverty by Sex and Age in Lincoln County
With 11.6% poverty level for males and 11.7% for females among the residents of Lincoln County, under 5 year old males and 6 to 11 year old females are the most vulnerable to poverty, with 84 males (32.7%) and 79 females (22.3%) in their respective age groups living below the poverty level.
| Age Bracket | Male | Female |
| Under 5 Years | 84 (32.7%) | 65 (20.4%) |
| 5 Years | 10 (16.1%) | 0 (0.0%) |
| 6 to 11 Years | 83 (21.4%) | 79 (22.3%) |
| 12 to 14 Years | 60 (21.3%) | 23 (10.7%) |
| 15 Years | 12 (25.0%) | 1 (1.2%) |
| 16 and 17 Years | 17 (8.1%) | 8 (5.7%) |
| 18 to 24 Years | 56 (15.1%) | 19 (5.2%) |
| 25 to 34 Years | 42 (8.7%) | 92 (21.0%) |
| 35 to 44 Years | 60 (9.9%) | 65 (11.2%) |
| 45 to 54 Years | 70 (11.6%) | 52 (8.4%) |
| 55 to 64 Years | 107 (12.7%) | 96 (10.9%) |
| 65 to 74 Years | 34 (3.9%) | 64 (8.1%) |
| 75 Years and over | 3 (0.6%) | 67 (12.4%) |
| Total | 638 (11.6%) | 631 (11.7%) |
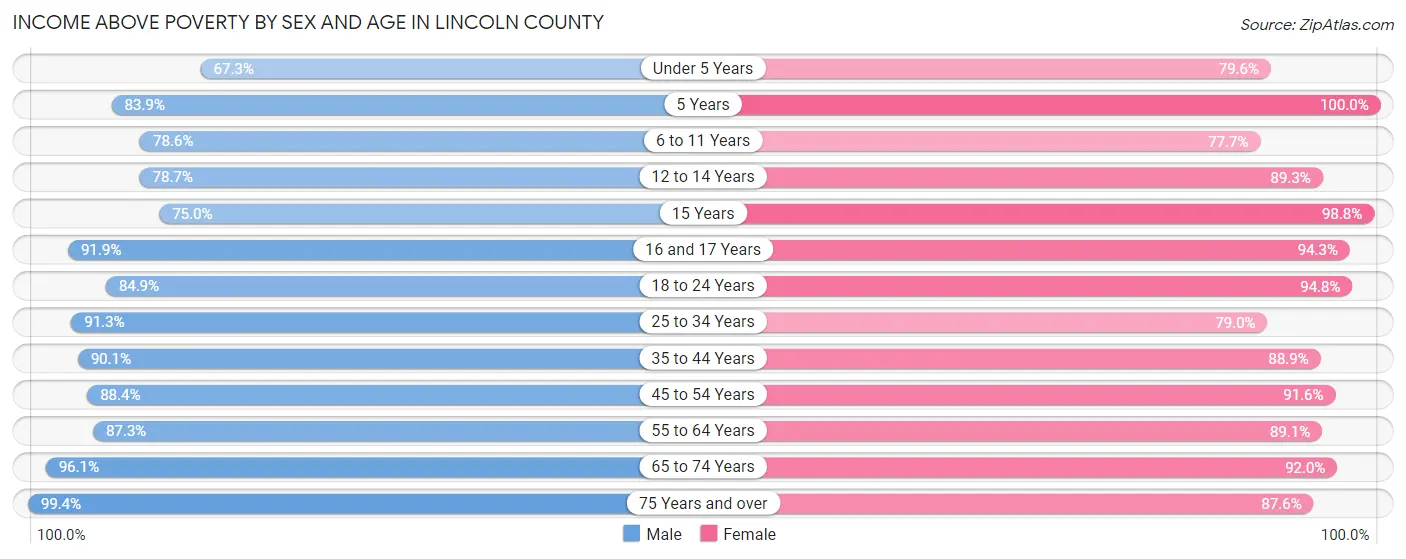
Income Above Poverty by Sex and Age in Lincoln County
According to the poverty statistics in Lincoln County, males aged 75 years and over and females aged 5 years are the age groups that are most secure financially, with 99.4% of males and 100.0% of females in these age groups living above the poverty line.
| Age Bracket | Male | Female |
| Under 5 Years | 173 (67.3%) | 254 (79.6%) |
| 5 Years | 52 (83.9%) | 53 (100.0%) |
| 6 to 11 Years | 304 (78.5%) | 275 (77.7%) |
| 12 to 14 Years | 221 (78.6%) | 191 (89.2%) |
| 15 Years | 36 (75.0%) | 82 (98.8%) |
| 16 and 17 Years | 194 (91.9%) | 132 (94.3%) |
| 18 to 24 Years | 315 (84.9%) | 343 (94.8%) |
| 25 to 34 Years | 442 (91.3%) | 346 (79.0%) |
| 35 to 44 Years | 548 (90.1%) | 518 (88.8%) |
| 45 to 54 Years | 532 (88.4%) | 568 (91.6%) |
| 55 to 64 Years | 736 (87.3%) | 788 (89.1%) |
| 65 to 74 Years | 832 (96.1%) | 731 (91.9%) |
| 75 Years and over | 499 (99.4%) | 471 (87.5%) |
| Total | 4,884 (88.4%) | 4,752 (88.3%) |
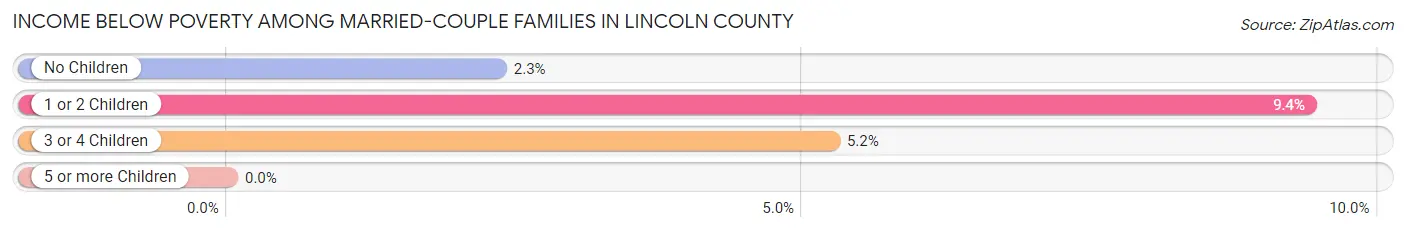
Income Below Poverty Among Married-Couple Families in Lincoln County
The poverty statistics for married-couple families in Lincoln County show that 3.9% or 104 of the total 2,670 families live below the poverty line. Families with 1 or 2 children have the highest poverty rate of 9.4%, comprising of 49 families. On the other hand, families with 5 or more children have the lowest poverty rate of 0.0%, which includes 0 families.
| Children | Above Poverty | Below Poverty |
| No Children | 1,880 (97.7%) | 45 (2.3%) |
| 1 or 2 Children | 473 (90.6%) | 49 (9.4%) |
| 3 or 4 Children | 181 (94.8%) | 10 (5.2%) |
| 5 or more Children | 32 (100.0%) | 0 (0.0%) |
| Total | 2,566 (96.1%) | 104 (3.9%) |
Income Below Poverty Among Single-Parent Households in Lincoln County
According to the poverty data in Lincoln County, 26.8% or 26 single-father households and 26.2% or 70 single-mother households are living below the poverty line. Among single-father households, those with 5 or more children have the highest poverty rate, with 16 households (100.0%) experiencing poverty. Likewise, among single-mother households, those with 3 or 4 children have the highest poverty rate, with 13 households (59.1%) falling below the poverty line.
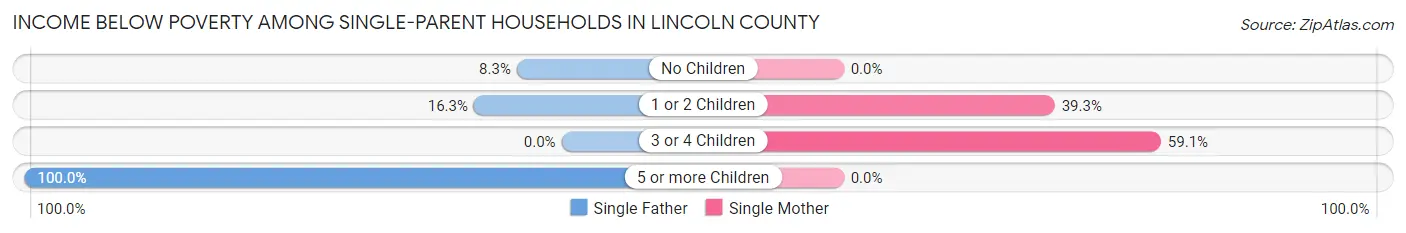
| Children | Single Father | Single Mother |
| No Children | 2 (8.3%) | 0 (0.0%) |
| 1 or 2 Children | 8 (16.3%) | 57 (39.3%) |
| 3 or 4 Children | 0 (0.0%) | 13 (59.1%) |
| 5 or more Children | 16 (100.0%) | 0 (0.0%) |
| Total | 26 (26.8%) | 70 (26.2%) |
Income Below Poverty Among Married-Couple vs Single-Parent Households in Lincoln County
The poverty data for Lincoln County shows that 104 of the married-couple family households (3.9%) and 96 of the single-parent households (26.4%) are living below the poverty level. Within the married-couple family households, those with 1 or 2 children have the highest poverty rate, with 49 households (9.4%) falling below the poverty line. Among the single-parent households, those with 5 or more children have the highest poverty rate, with 16 household (100.0%) living below poverty.
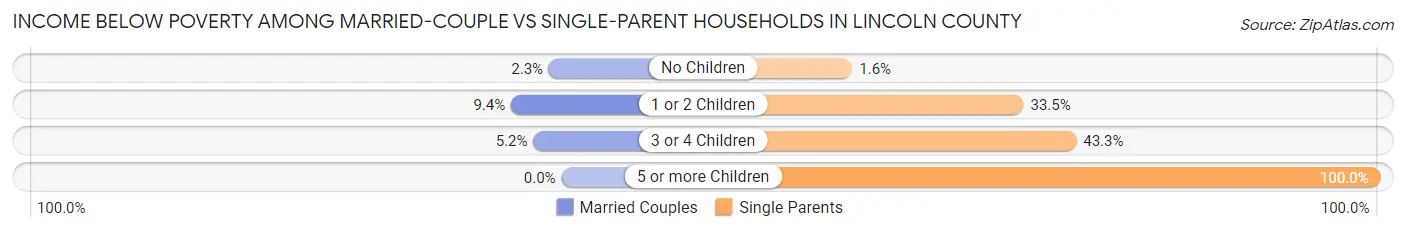
| Children | Married-Couple Families | Single-Parent Households |
| No Children | 45 (2.3%) | 2 (1.6%) |
| 1 or 2 Children | 49 (9.4%) | 65 (33.5%) |
| 3 or 4 Children | 10 (5.2%) | 13 (43.3%) |
| 5 or more Children | 0 (0.0%) | 16 (100.0%) |
| Total | 104 (3.9%) | 96 (26.4%) |
Race in Lincoln County
The most populous races in Lincoln County are White / Caucasian (10,104 | 91.5%), Hispanic or Latino (428 | 3.9%), and Two or more Races (425 | 3.8%).
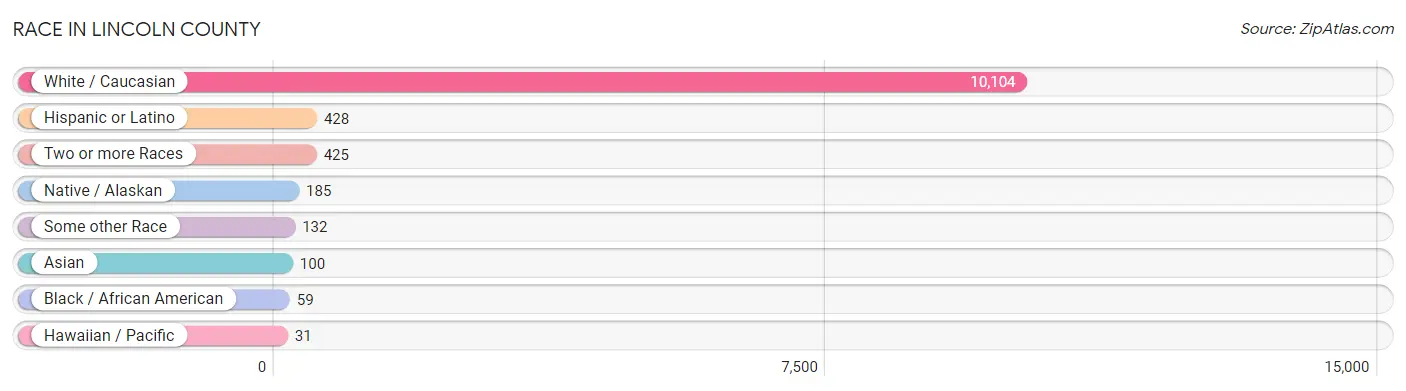
| Race | # Population | % Population |
| Asian | 100 | 0.9% |
| Black / African American | 59 | 0.5% |
| Hawaiian / Pacific | 31 | 0.3% |
| Hispanic or Latino | 428 | 3.9% |
| Native / Alaskan | 185 | 1.7% |
| White / Caucasian | 10,104 | 91.5% |
| Two or more Races | 425 | 3.8% |
| Some other Race | 132 | 1.2% |
| Total | 11,036 | 100.0% |
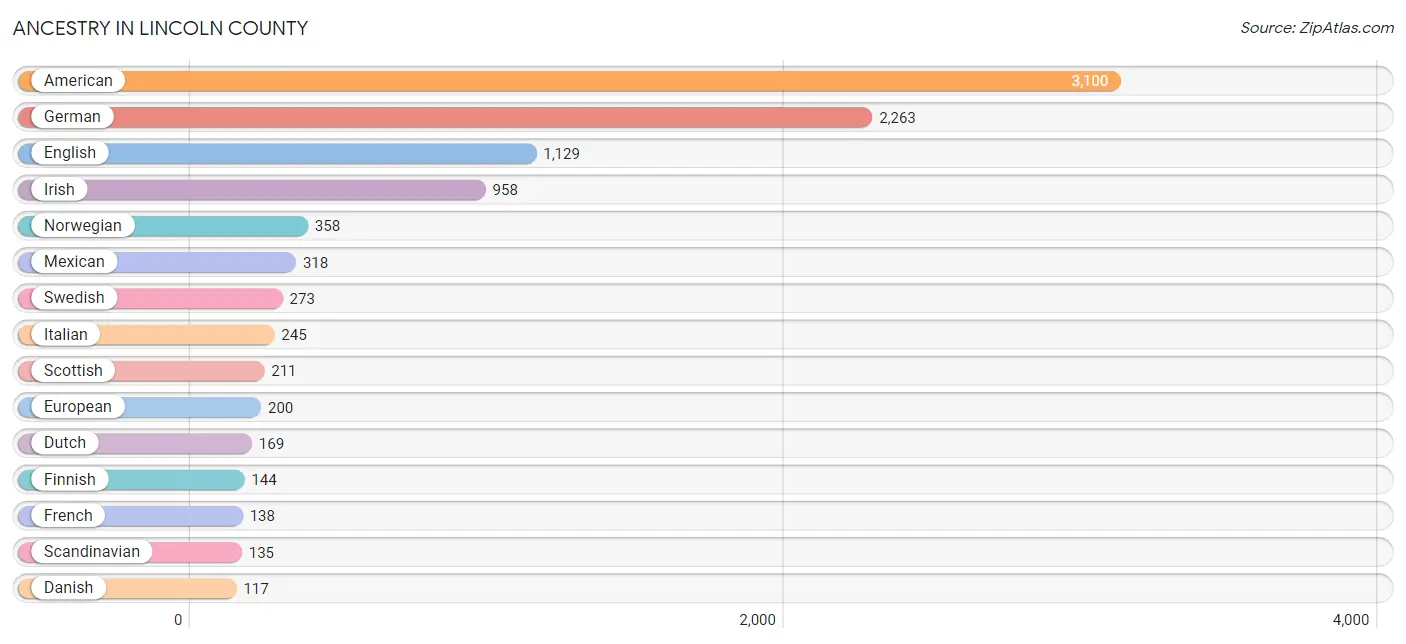
Ancestry in Lincoln County
The most populous ancestries reported in Lincoln County are American (3,100 | 28.1%), German (2,263 | 20.5%), English (1,129 | 10.2%), Irish (958 | 8.7%), and Norwegian (358 | 3.2%), together accounting for 70.8% of all Lincoln County residents.
| Ancestry | # Population | % Population |
| Aleut | 8 | 0.1% |
| American | 3,100 | 28.1% |
| Arab | 9 | 0.1% |
| Australian | 8 | 0.1% |
| Austrian | 25 | 0.2% |
| Belgian | 15 | 0.1% |
| Bhutanese | 23 | 0.2% |
| Blackfeet | 3 | 0.0% |
| Brazilian | 4 | 0.0% |
| British | 88 | 0.8% |
| Cambodian | 4 | 0.0% |
| Canadian | 16 | 0.1% |
| Central American Indian | 24 | 0.2% |
| Cherokee | 13 | 0.1% |
| Chinese | 2 | 0.0% |
| Chippewa | 6 | 0.1% |
| Colville | 69 | 0.6% |
| Croatian | 5 | 0.1% |
| Czech | 37 | 0.3% |
| Czechoslovakian | 8 | 0.1% |
| Danish | 117 | 1.1% |
| Dominican | 23 | 0.2% |
| Dutch | 169 | 1.5% |
| Eastern European | 8 | 0.1% |
| English | 1,129 | 10.2% |
| European | 200 | 1.8% |
| Finnish | 144 | 1.3% |
| French | 138 | 1.3% |
| French Canadian | 35 | 0.3% |
| German | 2,263 | 20.5% |
| German Russian | 2 | 0.0% |
| Greek | 21 | 0.2% |
| Guamanian / Chamorro | 2 | 0.0% |
| Haitian | 8 | 0.1% |
| Hungarian | 5 | 0.1% |
| Indian (Asian) | 44 | 0.4% |
| Iraqi | 7 | 0.1% |
| Irish | 958 | 8.7% |
| Iroquois | 90 | 0.8% |
| Israeli | 12 | 0.1% |
| Italian | 245 | 2.2% |
| Jamaican | 32 | 0.3% |
| Korean | 49 | 0.4% |
| Lithuanian | 5 | 0.1% |
| Luxembourger | 5 | 0.1% |
| Mexican | 318 | 2.9% |
| Mexican American Indian | 2 | 0.0% |
| Native Hawaiian | 52 | 0.5% |
| Navajo | 5 | 0.1% |
| Northern European | 9 | 0.1% |
| Norwegian | 358 | 3.2% |
| Osage | 4 | 0.0% |
| Pennsylvania German | 6 | 0.1% |
| Polish | 99 | 0.9% |
| Puerto Rican | 6 | 0.1% |
| Romanian | 5 | 0.1% |
| Russian | 75 | 0.7% |
| Samoan | 15 | 0.1% |
| Scandinavian | 135 | 1.2% |
| Scotch-Irish | 68 | 0.6% |
| Scottish | 211 | 1.9% |
| Sioux | 2 | 0.0% |
| Slovene | 24 | 0.2% |
| South American | 47 | 0.4% |
| Spanish | 27 | 0.2% |
| Sri Lankan | 9 | 0.1% |
| Swedish | 273 | 2.5% |
| Swiss | 20 | 0.2% |
| Syrian | 2 | 0.0% |
| Thai | 1 | 0.0% |
| Tlingit-Haida | 2 | 0.0% |
| Uruguayan | 47 | 0.4% |
| Ute | 12 | 0.1% |
| Welsh | 83 | 0.7% |
| Yugoslavian | 1 | 0.0% | View All 75 Rows |
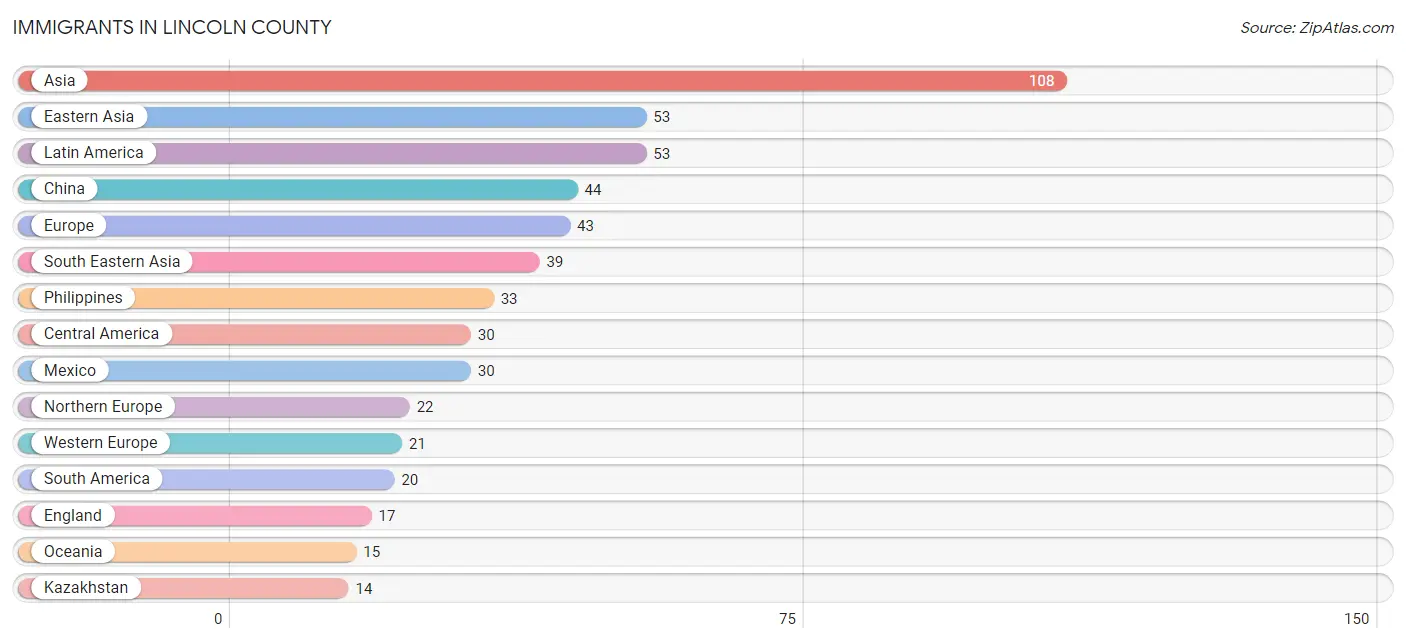
Immigrants in Lincoln County
The most numerous immigrant groups reported in Lincoln County came from Asia (108 | 1.0%), Eastern Asia (53 | 0.5%), Latin America (53 | 0.5%), China (44 | 0.4%), and Europe (43 | 0.4%), together accounting for 2.7% of all Lincoln County residents.
| Immigration Origin | # Population | % Population |
| Asia | 108 | 1.0% |
| Brazil | 11 | 0.1% |
| Canada | 7 | 0.1% |
| Caribbean | 3 | 0.0% |
| Central America | 30 | 0.3% |
| China | 44 | 0.4% |
| Eastern Asia | 53 | 0.5% |
| England | 17 | 0.2% |
| Europe | 43 | 0.4% |
| France | 5 | 0.1% |
| Germany | 7 | 0.1% |
| Haiti | 3 | 0.0% |
| Iraq | 2 | 0.0% |
| Japan | 9 | 0.1% |
| Kazakhstan | 14 | 0.1% |
| Latin America | 53 | 0.5% |
| Mexico | 30 | 0.3% |
| Netherlands | 9 | 0.1% |
| Northern Europe | 22 | 0.2% |
| Oceania | 15 | 0.1% |
| Philippines | 33 | 0.3% |
| Scotland | 4 | 0.0% |
| South America | 20 | 0.2% |
| South Central Asia | 14 | 0.1% |
| South Eastern Asia | 39 | 0.4% |
| Vietnam | 6 | 0.1% |
| Western Asia | 2 | 0.0% |
| Western Europe | 21 | 0.2% | View All 28 Rows |
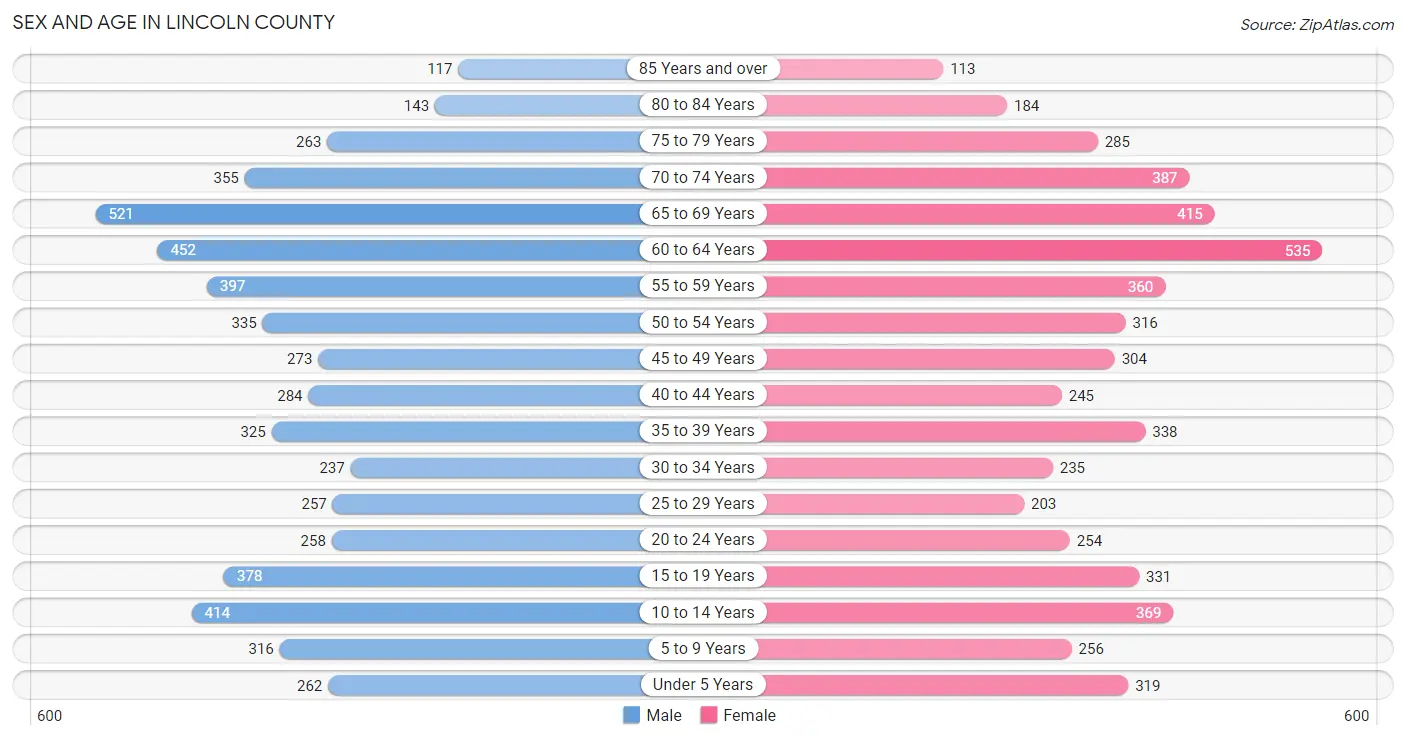
Sex and Age in Lincoln County
Sex and Age in Lincoln County
The most populous age groups in Lincoln County are 65 to 69 Years (521 | 9.3%) for men and 60 to 64 Years (535 | 9.8%) for women.
| Age Bracket | Male | Female |
| Under 5 Years | 262 (4.7%) | 319 (5.9%) |
| 5 to 9 Years | 316 (5.7%) | 256 (4.7%) |
| 10 to 14 Years | 414 (7.4%) | 369 (6.8%) |
| 15 to 19 Years | 378 (6.8%) | 331 (6.1%) |
| 20 to 24 Years | 258 (4.6%) | 254 (4.7%) |
| 25 to 29 Years | 257 (4.6%) | 203 (3.7%) |
| 30 to 34 Years | 237 (4.2%) | 235 (4.3%) |
| 35 to 39 Years | 325 (5.8%) | 338 (6.2%) |
| 40 to 44 Years | 284 (5.1%) | 245 (4.5%) |
| 45 to 49 Years | 273 (4.9%) | 304 (5.6%) |
| 50 to 54 Years | 335 (6.0%) | 316 (5.8%) |
| 55 to 59 Years | 397 (7.1%) | 360 (6.6%) |
| 60 to 64 Years | 452 (8.1%) | 535 (9.8%) |
| 65 to 69 Years | 521 (9.3%) | 415 (7.6%) |
| 70 to 74 Years | 355 (6.4%) | 387 (7.1%) |
| 75 to 79 Years | 263 (4.7%) | 285 (5.2%) |
| 80 to 84 Years | 143 (2.6%) | 184 (3.4%) |
| 85 Years and over | 117 (2.1%) | 113 (2.1%) |
| Total | 5,587 (100.0%) | 5,449 (100.0%) |
Families and Households in Lincoln County
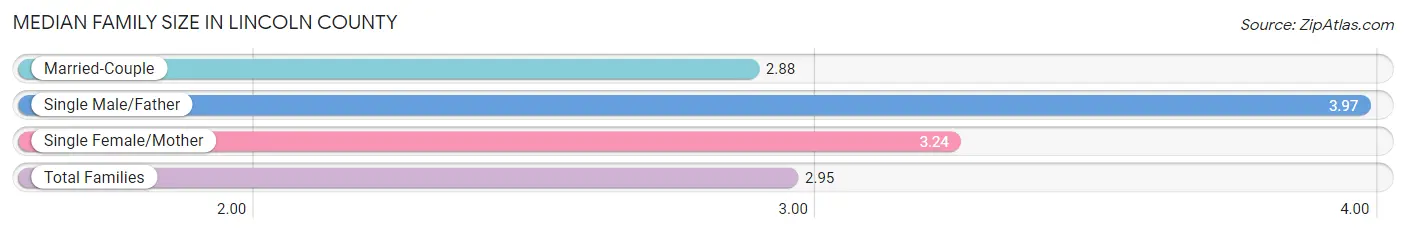
Median Family Size in Lincoln County
The median family size in Lincoln County is 2.95 persons per family, with single male/father families (97 | 3.2%) accounting for the largest median family size of 3.97 persons per family. On the other hand, married-couple families (2,670 | 88.0%) represent the smallest median family size with 2.88 persons per family.
| Family Type | # Families | Family Size |
| Married-Couple | 2,670 (88.0%) | 2.88 |
| Single Male/Father | 97 (3.2%) | 3.97 |
| Single Female/Mother | 267 (8.8%) | 3.24 |
| Total Families | 3,034 (100.0%) | 2.95 |
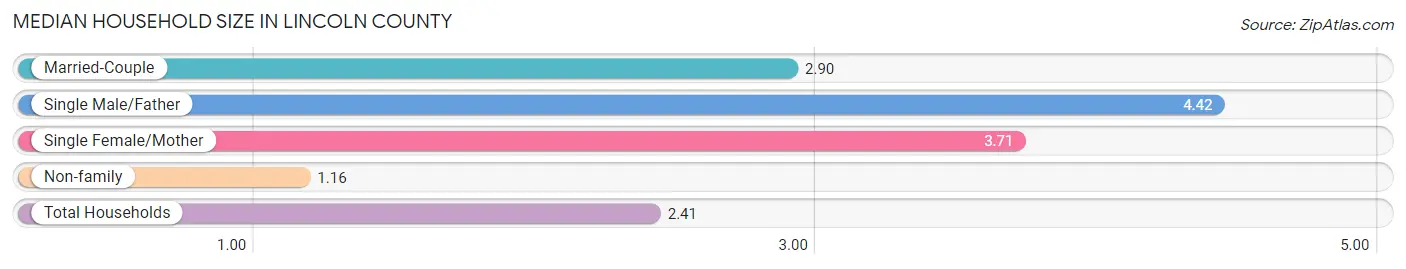
Median Household Size in Lincoln County
The median household size in Lincoln County is 2.41 persons per household, with single male/father households (97 | 2.1%) accounting for the largest median household size of 4.42 persons per household. non-family households (1,498 | 33.1%) represent the smallest median household size with 1.16 persons per household.
| Household Type | # Households | Household Size |
| Married-Couple | 2,670 (58.9%) | 2.90 |
| Single Male/Father | 97 (2.1%) | 4.42 |
| Single Female/Mother | 267 (5.9%) | 3.71 |
| Non-family | 1,498 (33.1%) | 1.16 |
| Total Households | 4,532 (100.0%) | 2.41 |
Household Size by Marriage Status in Lincoln County
Out of a total of 4,532 households in Lincoln County, 3,034 (66.9%) are family households, while 1,498 (33.1%) are nonfamily households. The most numerous type of family households are 2-person households, comprising 1,815, and the most common type of nonfamily households are 1-person households, comprising 1,261.
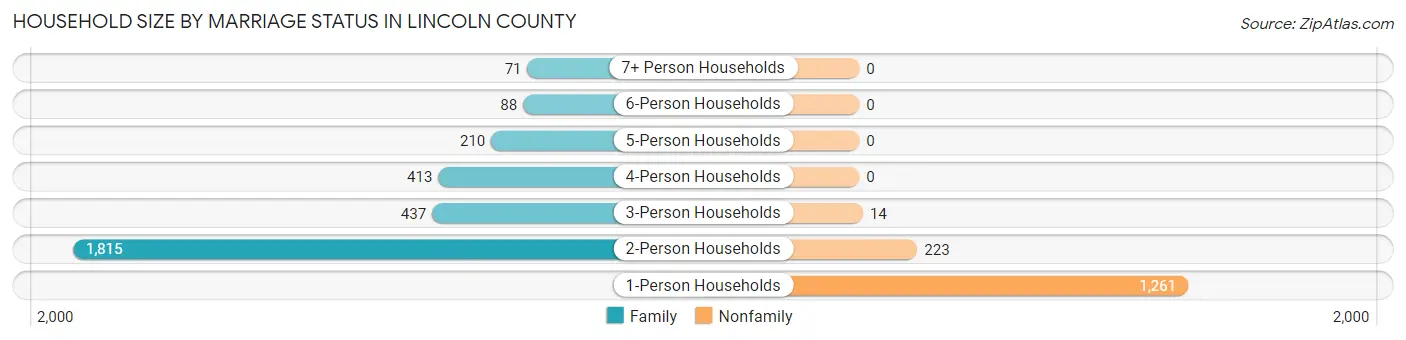
| Household Size | Family Households | Nonfamily Households |
| 1-Person Households | - | 1,261 (27.8%) |
| 2-Person Households | 1,815 (40.1%) | 223 (4.9%) |
| 3-Person Households | 437 (9.6%) | 14 (0.3%) |
| 4-Person Households | 413 (9.1%) | 0 (0.0%) |
| 5-Person Households | 210 (4.6%) | 0 (0.0%) |
| 6-Person Households | 88 (1.9%) | 0 (0.0%) |
| 7+ Person Households | 71 (1.6%) | 0 (0.0%) |
| Total | 3,034 (66.9%) | 1,498 (33.1%) |
Female Fertility in Lincoln County
Fertility by Age in Lincoln County
Average fertility rate in Lincoln County is 64.0 births per 1,000 women. Women in the age bracket of 20 to 34 years have the highest fertility rate with 134.0 births per 1,000 women. Women in the age bracket of 20 to 34 years acount for 73.8% of all women with births.
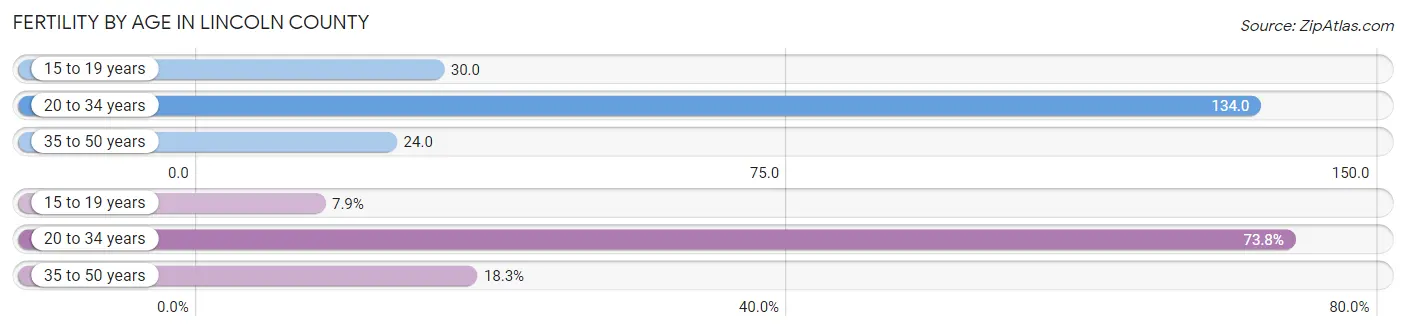
| Age Bracket | Women with Births | Births / 1,000 Women |
| 15 to 19 years | 10 (7.9%) | 30.0 |
| 20 to 34 years | 93 (73.8%) | 134.0 |
| 35 to 50 years | 23 (18.2%) | 24.0 |
| Total | 126 (100.0%) | 64.0 |
Fertility by Age by Marriage Status in Lincoln County
56.3% of women with births (126) in Lincoln County are married. The highest percentage of unmarried women with births falls into 15 to 19 years age bracket with 100.0% of them unmarried at the time of birth, while the lowest percentage of unmarried women with births belong to 35 to 50 years age bracket with 0.0% of them unmarried.
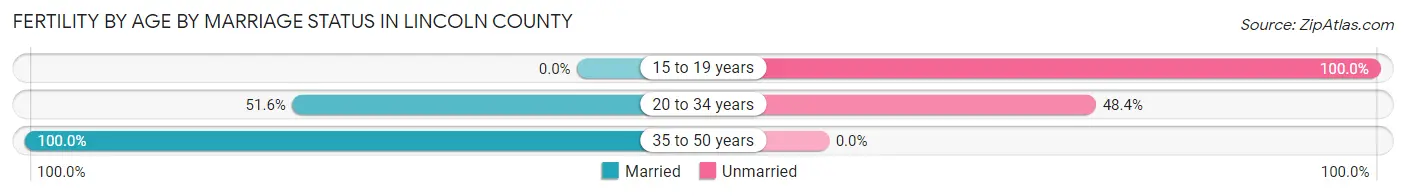
| Age Bracket | Married | Unmarried |
| 15 to 19 years | 0 (0.0%) | 10 (100.0%) |
| 20 to 34 years | 48 (51.6%) | 45 (48.4%) |
| 35 to 50 years | 23 (100.0%) | 0 (0.0%) |
| Total | 71 (56.4%) | 55 (43.6%) |
Fertility by Education in Lincoln County
Average fertility rate in Lincoln County is 64.0 births per 1,000 women. Women with the education attainment of high school diploma have the highest fertility rate of 75.0 births per 1,000 women, while women with the education attainment of graduate degree have the lowest fertility at 29.0 births per 1,000 women. Women with the education attainment of college or associate's degree represent 42.9% of all women with births.
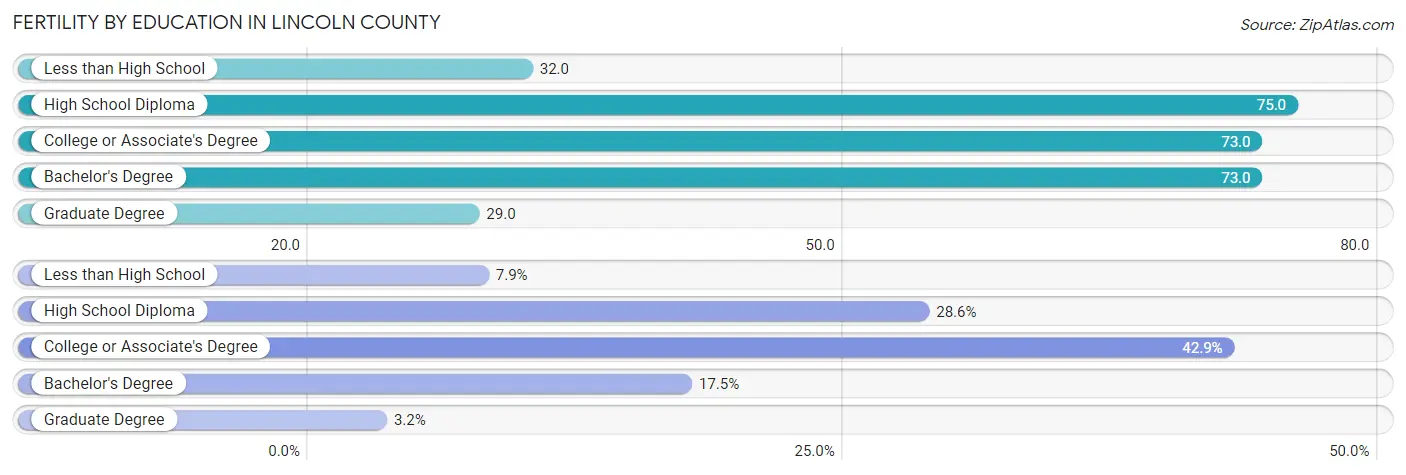
| Educational Attainment | Women with Births | Births / 1,000 Women |
| Less than High School | 10 (7.9%) | 32.0 |
| High School Diploma | 36 (28.6%) | 75.0 |
| College or Associate's Degree | 54 (42.9%) | 73.0 |
| Bachelor's Degree | 22 (17.5%) | 73.0 |
| Graduate Degree | 4 (3.2%) | 29.0 |
| Total | 126 (100.0%) | 64.0 |
Fertility by Education by Marriage Status in Lincoln County
43.6% of women with births in Lincoln County are unmarried. Women with the educational attainment of bachelor's degree are most likely to be married with 100.0% of them married at childbirth, while women with the educational attainment of less than high school are least likely to be married with 100.0% of them unmarried at childbirth.
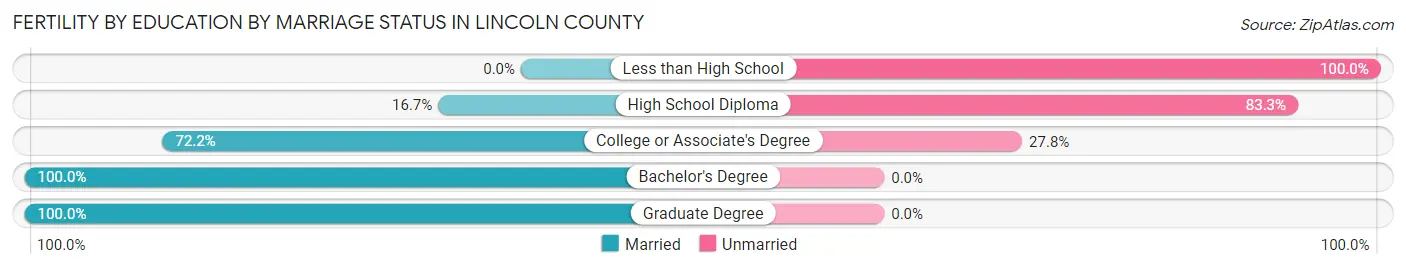
| Educational Attainment | Married | Unmarried |
| Less than High School | 0 (0.0%) | 10 (100.0%) |
| High School Diploma | 6 (16.7%) | 30 (83.3%) |
| College or Associate's Degree | 39 (72.2%) | 15 (27.8%) |
| Bachelor's Degree | 22 (100.0%) | 0 (0.0%) |
| Graduate Degree | 4 (100.0%) | 0 (0.0%) |
| Total | 71 (56.4%) | 55 (43.6%) |
Employment Characteristics in Lincoln County
Employment by Class of Employer in Lincoln County
Among the 4,418 employed individuals in Lincoln County, private company employees (2,253 | 51.0%), local government employees (505 | 11.4%), and state government employees (488 | 11.1%) make up the most common classes of employment.
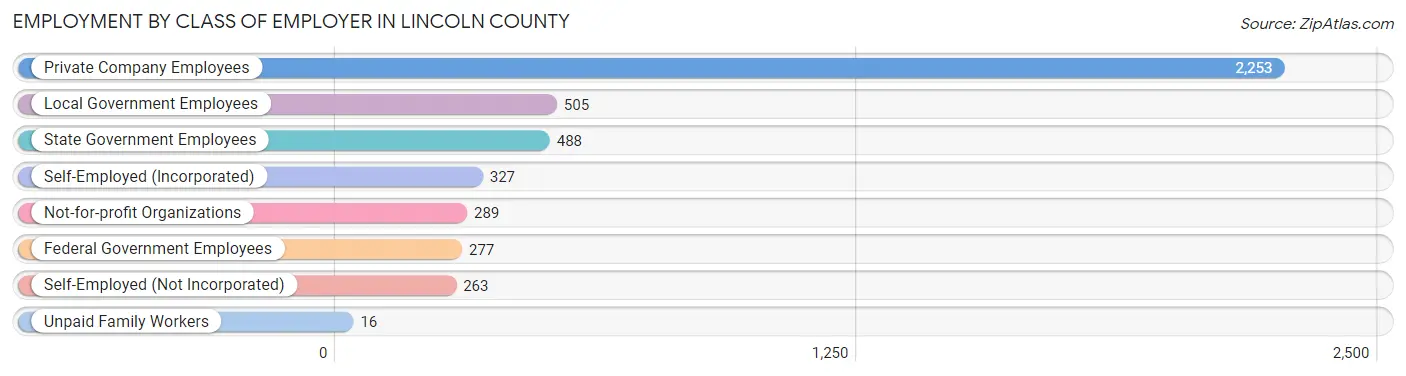
| Employer Class | # Employees | % Employees |
| Private Company Employees | 2,253 | 51.0% |
| Self-Employed (Incorporated) | 327 | 7.4% |
| Self-Employed (Not Incorporated) | 263 | 5.9% |
| Not-for-profit Organizations | 289 | 6.5% |
| Local Government Employees | 505 | 11.4% |
| State Government Employees | 488 | 11.1% |
| Federal Government Employees | 277 | 6.3% |
| Unpaid Family Workers | 16 | 0.4% |
| Total | 4,418 | 100.0% |
Employment Status by Age in Lincoln County
According to the labor force statistics for Lincoln County, out of the total population over 16 years of age (8,969), 53.8% or 4,825 individuals are in the labor force, with 5.3% or 256 of them unemployed. The age group with the highest labor force participation rate is 45 to 54 years, with 84.4% or 1,036 individuals in the labor force. Within the labor force, the 16 to 19 years age range has the highest percentage of unemployed individuals, with 17.3% or 27 of them being unemployed.
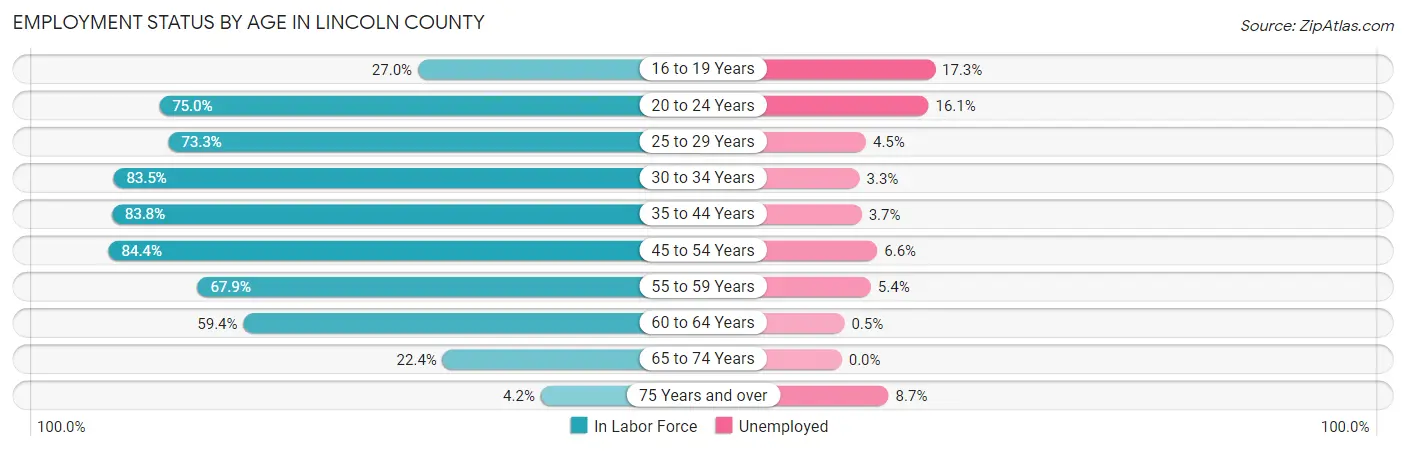
| Age Bracket | In Labor Force | Unemployed |
| 16 to 19 Years | 156 (27.0%) | 27 (17.3%) |
| 20 to 24 Years | 384 (75.0%) | 62 (16.1%) |
| 25 to 29 Years | 337 (73.3%) | 15 (4.5%) |
| 30 to 34 Years | 394 (83.5%) | 13 (3.3%) |
| 35 to 44 Years | 999 (83.8%) | 37 (3.7%) |
| 45 to 54 Years | 1,036 (84.4%) | 68 (6.6%) |
| 55 to 59 Years | 514 (67.9%) | 28 (5.4%) |
| 60 to 64 Years | 586 (59.4%) | 3 (0.5%) |
| 65 to 74 Years | 376 (22.4%) | 0 (0.0%) |
| 75 Years and over | 46 (4.2%) | 4 (8.7%) |
| Total | 4,825 (53.8%) | 256 (5.3%) |
Employment Status by Educational Attainment in Lincoln County
According to labor force statistics for Lincoln County, 75.9% of individuals (3,868) out of the total population between 25 and 64 years of age (5,096) are in the labor force, with 4.2% or 162 of them being unemployed. The group with the highest labor force participation rate are those with the educational attainment of bachelor's degree or higher, with 85.8% or 1,048 individuals in the labor force. Within the labor force, individuals with less than high school education have the highest percentage of unemployment, with 14.7% or 24 of them being unemployed.
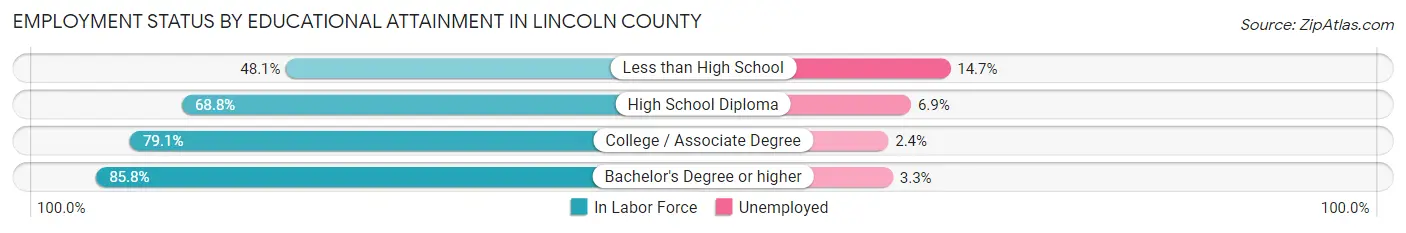
| Educational Attainment | In Labor Force | Unemployed |
| Less than High School | 163 (48.1%) | 50 (14.7%) |
| High School Diploma | 936 (68.8%) | 94 (6.9%) |
| College / Associate Degree | 1,720 (79.1%) | 52 (2.4%) |
| Bachelor's Degree or higher | 1,048 (85.8%) | 40 (3.3%) |
| Total | 3,868 (75.9%) | 214 (4.2%) |
Employment Occupations by Sex in Lincoln County
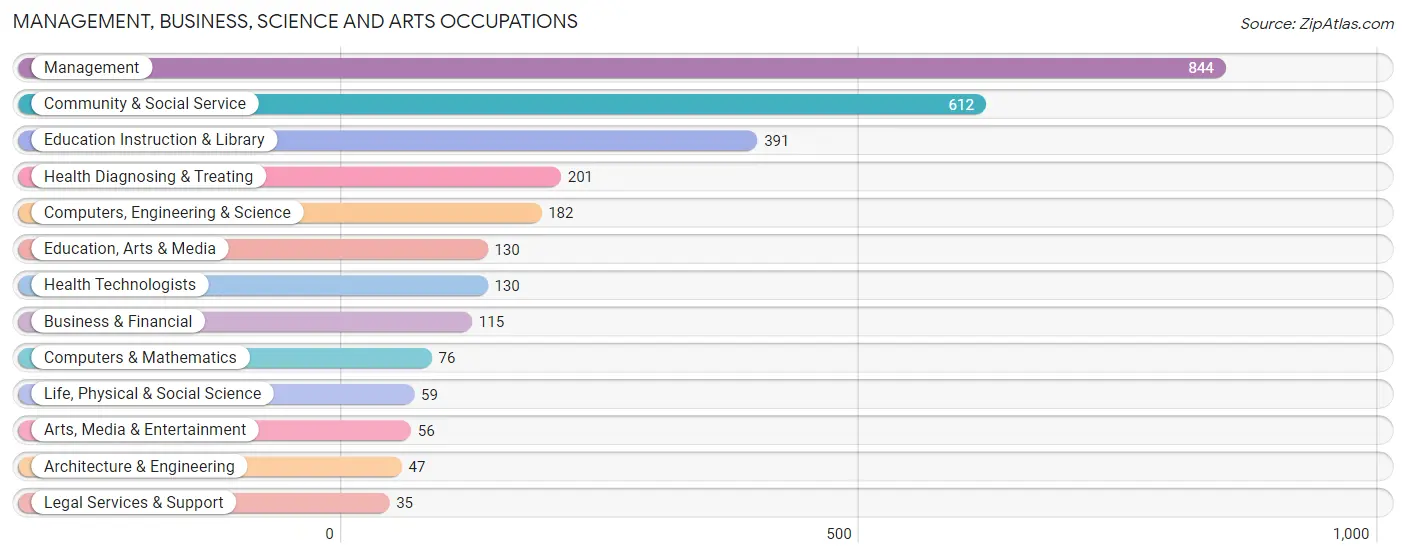
Management, Business, Science and Arts Occupations
The most common Management, Business, Science and Arts occupations in Lincoln County are Management (844 | 18.5%), Community & Social Service (612 | 13.4%), Education Instruction & Library (391 | 8.6%), Health Diagnosing & Treating (201 | 4.4%), and Computers, Engineering & Science (182 | 4.0%).
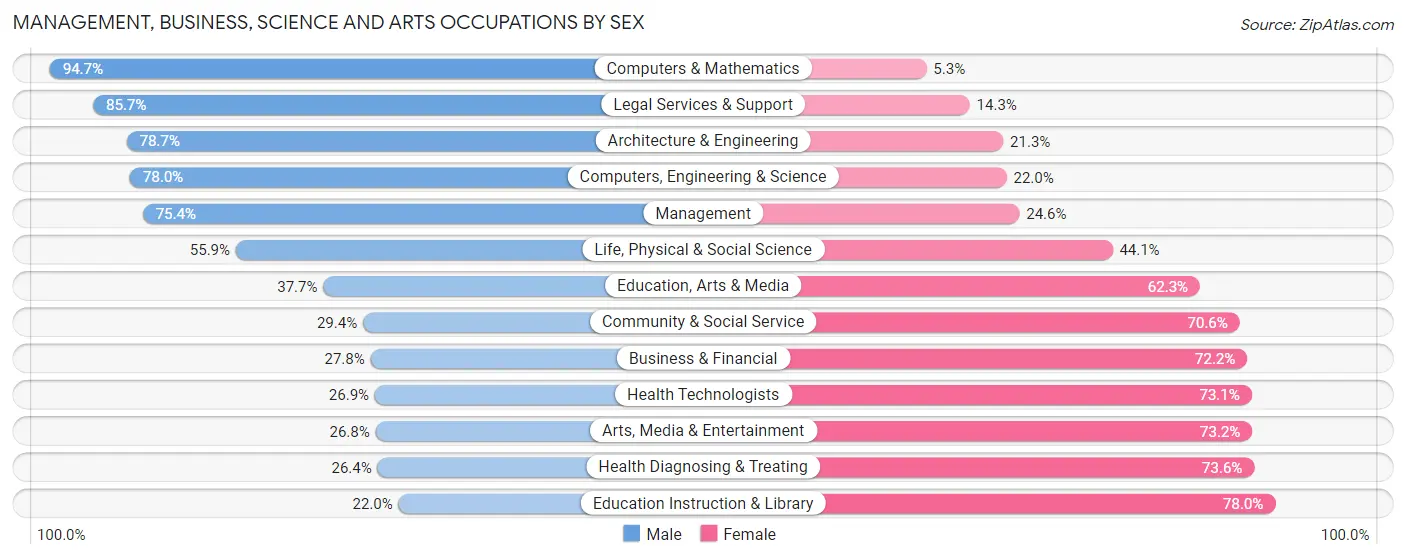
Management, Business, Science and Arts Occupations by Sex
Within the Management, Business, Science and Arts occupations in Lincoln County, the most male-oriented occupations are Computers & Mathematics (94.7%), Legal Services & Support (85.7%), and Architecture & Engineering (78.7%), while the most female-oriented occupations are Education Instruction & Library (78.0%), Health Diagnosing & Treating (73.6%), and Arts, Media & Entertainment (73.2%).
| Occupation | Male | Female |
| Management | 636 (75.4%) | 208 (24.6%) |
| Business & Financial | 32 (27.8%) | 83 (72.2%) |
| Computers, Engineering & Science | 142 (78.0%) | 40 (22.0%) |
| Computers & Mathematics | 72 (94.7%) | 4 (5.3%) |
| Architecture & Engineering | 37 (78.7%) | 10 (21.3%) |
| Life, Physical & Social Science | 33 (55.9%) | 26 (44.1%) |
| Community & Social Service | 180 (29.4%) | 432 (70.6%) |
| Education, Arts & Media | 49 (37.7%) | 81 (62.3%) |
| Legal Services & Support | 30 (85.7%) | 5 (14.3%) |
| Education Instruction & Library | 86 (22.0%) | 305 (78.0%) |
| Arts, Media & Entertainment | 15 (26.8%) | 41 (73.2%) |
| Health Diagnosing & Treating | 53 (26.4%) | 148 (73.6%) |
| Health Technologists | 35 (26.9%) | 95 (73.1%) |
| Total (Category) | 1,043 (53.4%) | 911 (46.6%) |
| Total (Overall) | 2,517 (55.1%) | 2,048 (44.9%) |
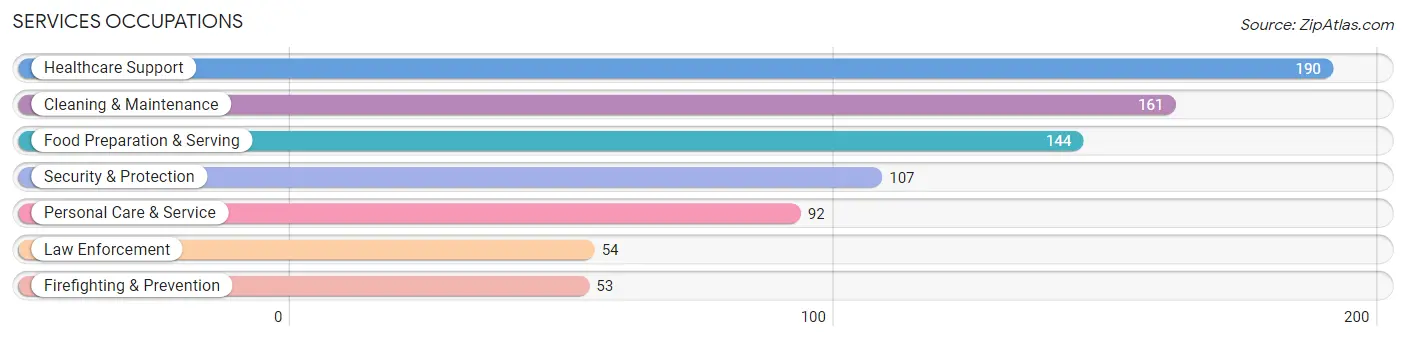
Services Occupations
The most common Services occupations in Lincoln County are Healthcare Support (190 | 4.2%), Cleaning & Maintenance (161 | 3.5%), Food Preparation & Serving (144 | 3.2%), Security & Protection (107 | 2.3%), and Personal Care & Service (92 | 2.0%).
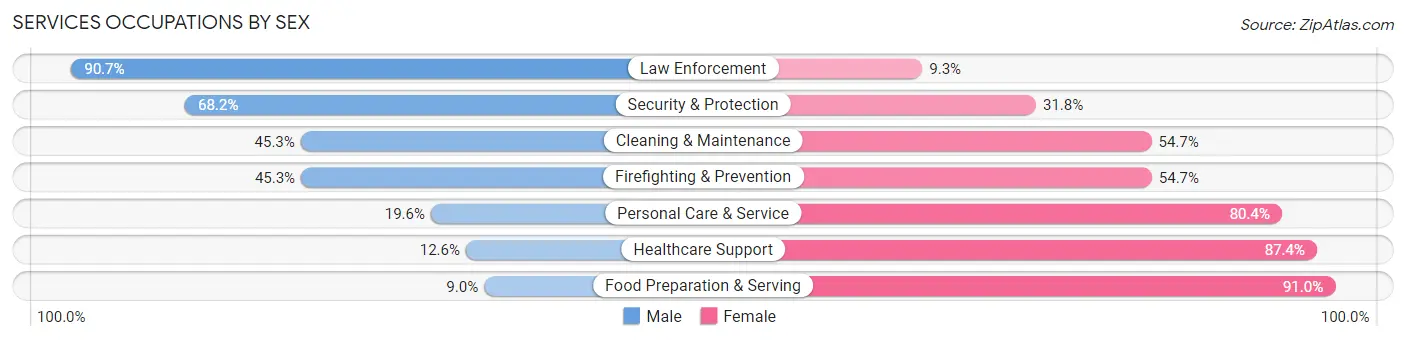
Services Occupations by Sex
Within the Services occupations in Lincoln County, the most male-oriented occupations are Law Enforcement (90.7%), Security & Protection (68.2%), and Cleaning & Maintenance (45.3%), while the most female-oriented occupations are Food Preparation & Serving (91.0%), Healthcare Support (87.4%), and Personal Care & Service (80.4%).
| Occupation | Male | Female |
| Healthcare Support | 24 (12.6%) | 166 (87.4%) |
| Security & Protection | 73 (68.2%) | 34 (31.8%) |
| Firefighting & Prevention | 24 (45.3%) | 29 (54.7%) |
| Law Enforcement | 49 (90.7%) | 5 (9.3%) |
| Food Preparation & Serving | 13 (9.0%) | 131 (91.0%) |
| Cleaning & Maintenance | 73 (45.3%) | 88 (54.7%) |
| Personal Care & Service | 18 (19.6%) | 74 (80.4%) |
| Total (Category) | 201 (29.0%) | 493 (71.0%) |
| Total (Overall) | 2,517 (55.1%) | 2,048 (44.9%) |
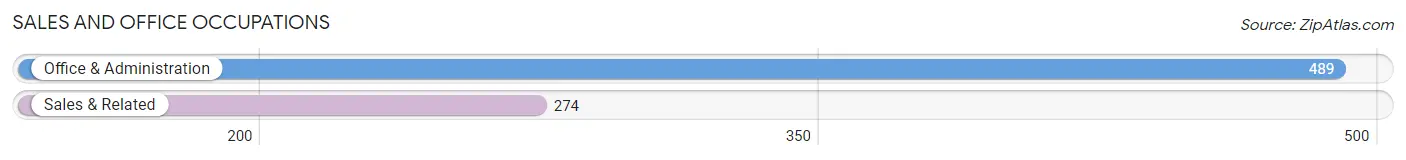
Sales and Office Occupations
The most common Sales and Office occupations in Lincoln County are Office & Administration (489 | 10.7%), and Sales & Related (274 | 6.0%).
Sales and Office Occupations by Sex
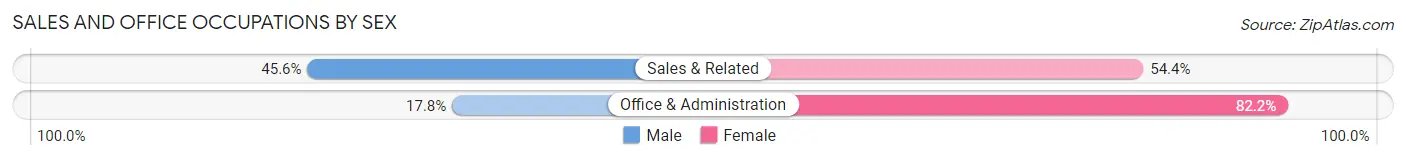
| Occupation | Male | Female |
| Sales & Related | 125 (45.6%) | 149 (54.4%) |
| Office & Administration | 87 (17.8%) | 402 (82.2%) |
| Total (Category) | 212 (27.8%) | 551 (72.2%) |
| Total (Overall) | 2,517 (55.1%) | 2,048 (44.9%) |
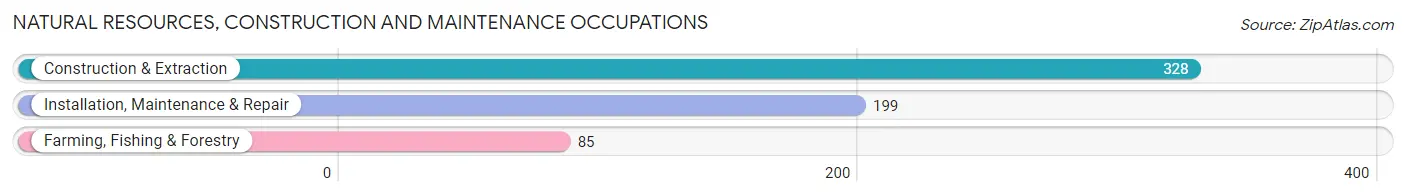
Natural Resources, Construction and Maintenance Occupations
The most common Natural Resources, Construction and Maintenance occupations in Lincoln County are Construction & Extraction (328 | 7.2%), Installation, Maintenance & Repair (199 | 4.4%), and Farming, Fishing & Forestry (85 | 1.9%).
Natural Resources, Construction and Maintenance Occupations by Sex
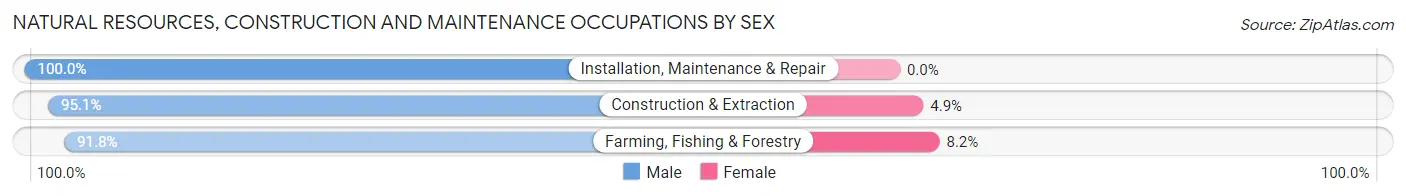
| Occupation | Male | Female |
| Farming, Fishing & Forestry | 78 (91.8%) | 7 (8.2%) |
| Construction & Extraction | 312 (95.1%) | 16 (4.9%) |
| Installation, Maintenance & Repair | 199 (100.0%) | 0 (0.0%) |
| Total (Category) | 589 (96.2%) | 23 (3.8%) |
| Total (Overall) | 2,517 (55.1%) | 2,048 (44.9%) |
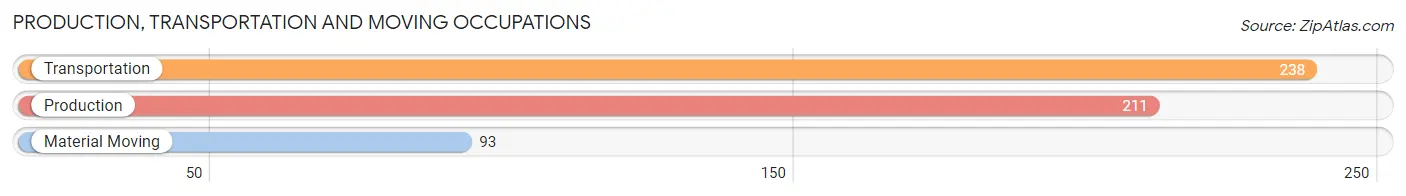
Production, Transportation and Moving Occupations
The most common Production, Transportation and Moving occupations in Lincoln County are Transportation (238 | 5.2%), Production (211 | 4.6%), and Material Moving (93 | 2.0%).
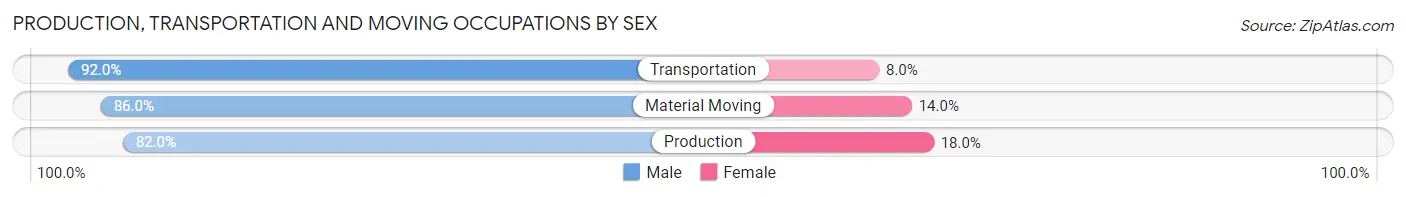
Production, Transportation and Moving Occupations by Sex
| Occupation | Male | Female |
| Production | 173 (82.0%) | 38 (18.0%) |
| Transportation | 219 (92.0%) | 19 (8.0%) |
| Material Moving | 80 (86.0%) | 13 (14.0%) |
| Total (Category) | 472 (87.1%) | 70 (12.9%) |
| Total (Overall) | 2,517 (55.1%) | 2,048 (44.9%) |
Employment Industries by Sex in Lincoln County
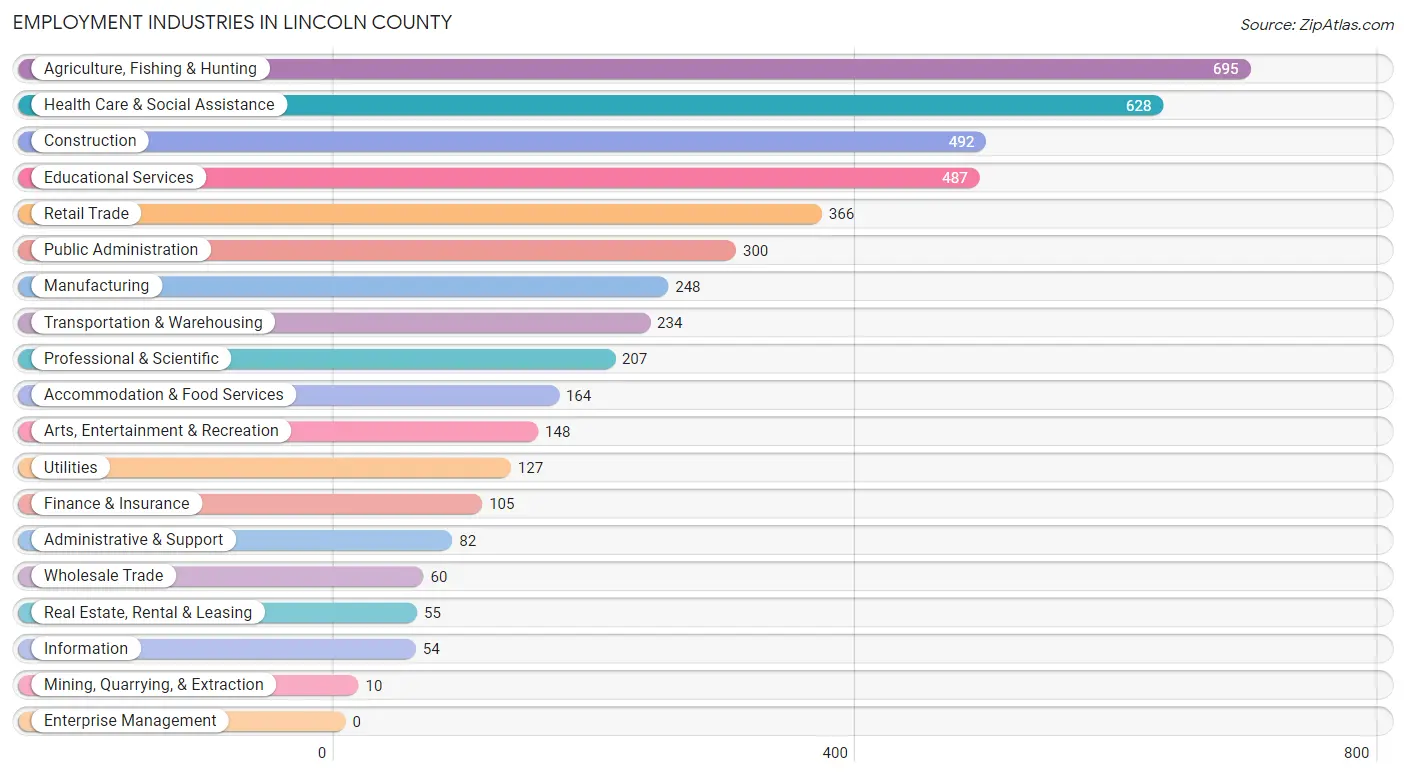
Employment Industries in Lincoln County
The major employment industries in Lincoln County include Agriculture, Fishing & Hunting (695 | 15.2%), Health Care & Social Assistance (628 | 13.8%), Construction (492 | 10.8%), Educational Services (487 | 10.7%), and Retail Trade (366 | 8.0%).
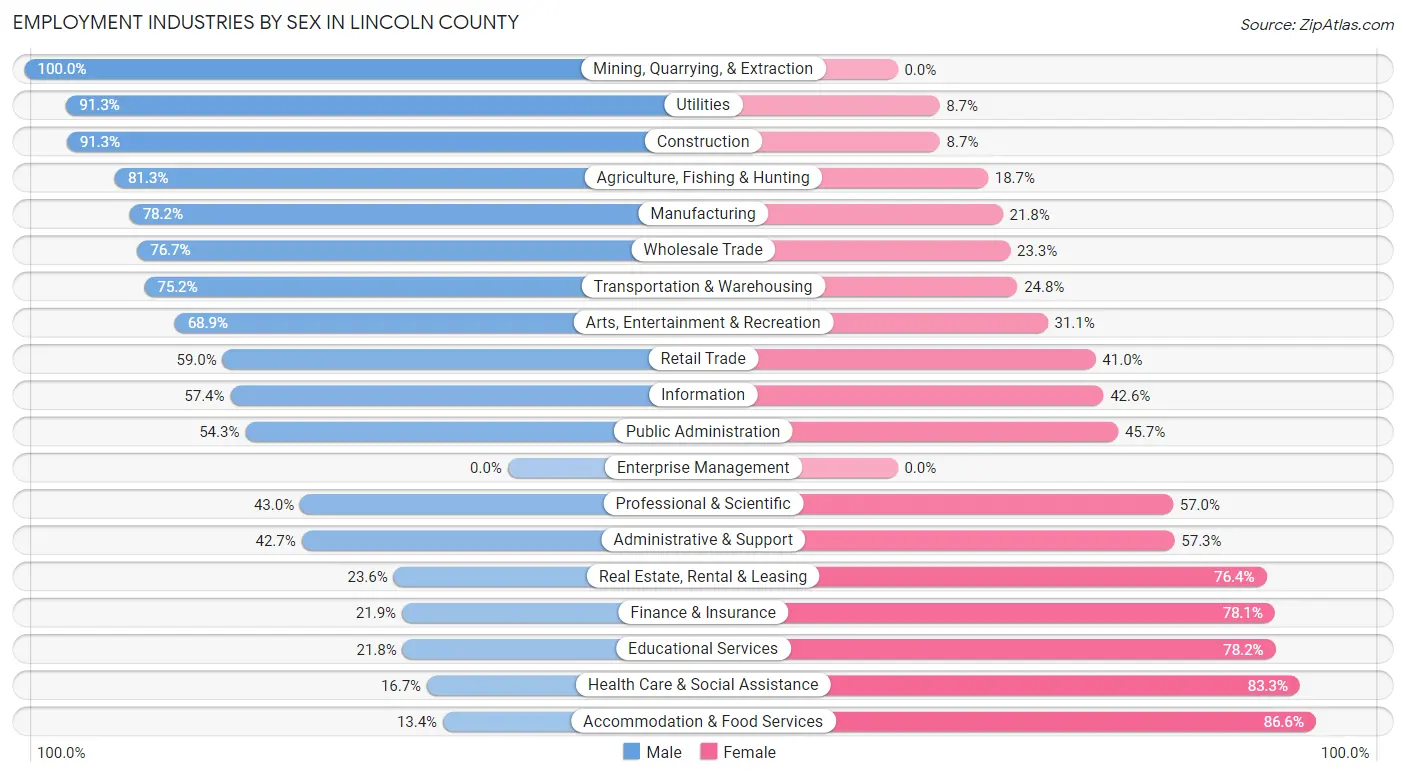
Employment Industries by Sex in Lincoln County
The Lincoln County industries that see more men than women are Mining, Quarrying, & Extraction (100.0%), Utilities (91.3%), and Construction (91.3%), whereas the industries that tend to have a higher number of women are Accommodation & Food Services (86.6%), Health Care & Social Assistance (83.3%), and Educational Services (78.2%).
| Industry | Male | Female |
| Agriculture, Fishing & Hunting | 565 (81.3%) | 130 (18.7%) |
| Mining, Quarrying, & Extraction | 10 (100.0%) | 0 (0.0%) |
| Construction | 449 (91.3%) | 43 (8.7%) |
| Manufacturing | 194 (78.2%) | 54 (21.8%) |
| Wholesale Trade | 46 (76.7%) | 14 (23.3%) |
| Retail Trade | 216 (59.0%) | 150 (41.0%) |
| Transportation & Warehousing | 176 (75.2%) | 58 (24.8%) |
| Utilities | 116 (91.3%) | 11 (8.7%) |
| Information | 31 (57.4%) | 23 (42.6%) |
| Finance & Insurance | 23 (21.9%) | 82 (78.1%) |
| Real Estate, Rental & Leasing | 13 (23.6%) | 42 (76.4%) |
| Professional & Scientific | 89 (43.0%) | 118 (57.0%) |
| Enterprise Management | 0 (0.0%) | 0 (0.0%) |
| Administrative & Support | 35 (42.7%) | 47 (57.3%) |
| Educational Services | 106 (21.8%) | 381 (78.2%) |
| Health Care & Social Assistance | 105 (16.7%) | 523 (83.3%) |
| Arts, Entertainment & Recreation | 102 (68.9%) | 46 (31.1%) |
| Accommodation & Food Services | 22 (13.4%) | 142 (86.6%) |
| Public Administration | 163 (54.3%) | 137 (45.7%) |
| Total | 2,517 (55.1%) | 2,048 (44.9%) |
Education in Lincoln County
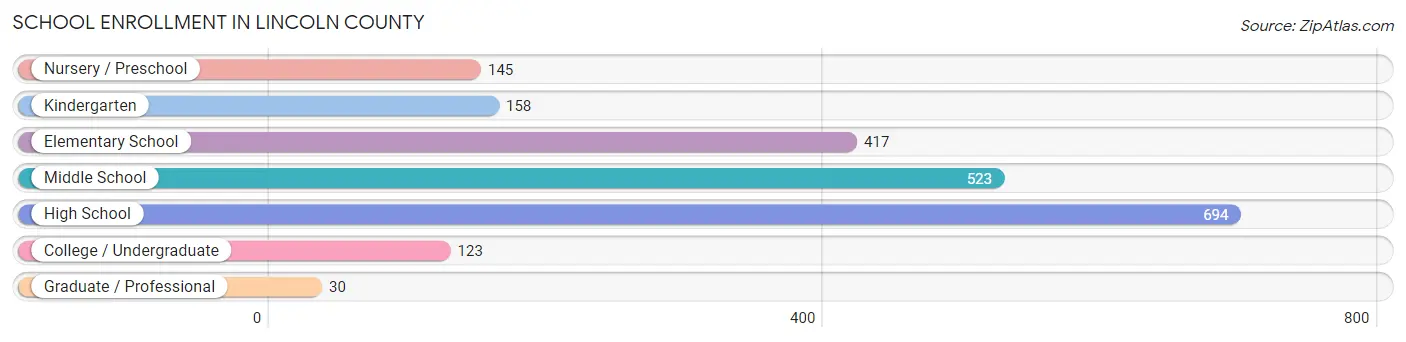
School Enrollment in Lincoln County
The most common levels of schooling among the 2,090 students in Lincoln County are high school (694 | 33.2%), middle school (523 | 25.0%), and elementary school (417 | 20.0%).
| School Level | # Students | % Students |
| Nursery / Preschool | 145 | 6.9% |
| Kindergarten | 158 | 7.6% |
| Elementary School | 417 | 20.0% |
| Middle School | 523 | 25.0% |
| High School | 694 | 33.2% |
| College / Undergraduate | 123 | 5.9% |
| Graduate / Professional | 30 | 1.4% |
| Total | 2,090 | 100.0% |
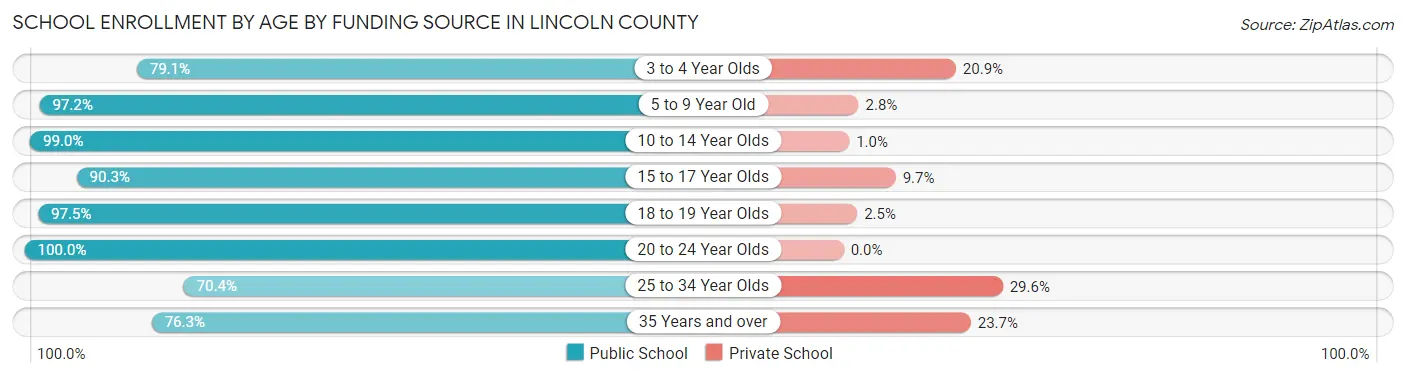
School Enrollment by Age by Funding Source in Lincoln County
Out of a total of 2,090 students who are enrolled in schools in Lincoln County, 111 (5.3%) attend a private institution, while the remaining 1,979 (94.7%) are enrolled in public schools. The age group of 25 to 34 year olds has the highest likelihood of being enrolled in private schools, with 8 (29.6% in the age bracket) enrolled. Conversely, the age group of 20 to 24 year olds has the lowest likelihood of being enrolled in a private school, with 41 (100.0% in the age bracket) attending a public institution.
| Age Bracket | Public School | Private School |
| 3 to 4 Year Olds | 87 (79.1%) | 23 (20.9%) |
| 5 to 9 Year Old | 490 (97.2%) | 14 (2.8%) |
| 10 to 14 Year Olds | 769 (99.0%) | 8 (1.0%) |
| 15 to 17 Year Olds | 428 (90.3%) | 46 (9.7%) |
| 18 to 19 Year Olds | 116 (97.5%) | 3 (2.5%) |
| 20 to 24 Year Olds | 41 (100.0%) | 0 (0.0%) |
| 25 to 34 Year Olds | 19 (70.4%) | 8 (29.6%) |
| 35 Years and over | 29 (76.3%) | 9 (23.7%) |
| Total | 1,979 (94.7%) | 111 (5.3%) |
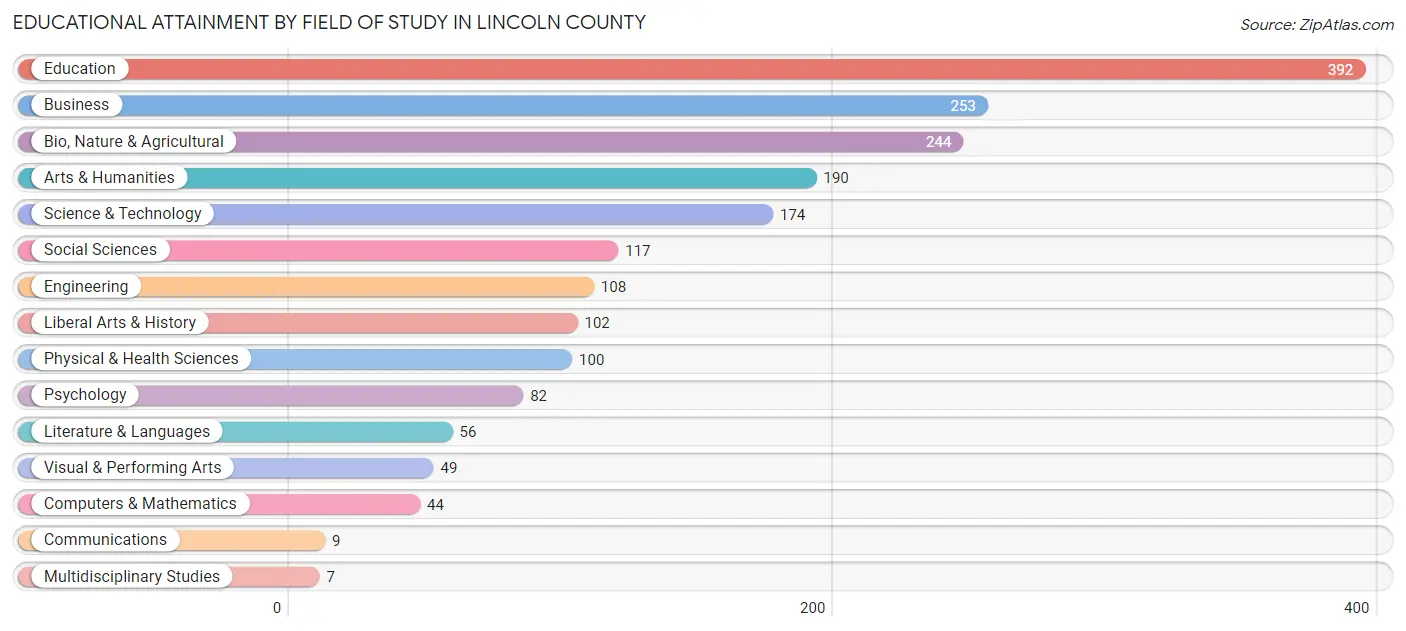
Educational Attainment by Field of Study in Lincoln County
Education (392 | 20.3%), business (253 | 13.1%), bio, nature & agricultural (244 | 12.7%), arts & humanities (190 | 9.9%), and science & technology (174 | 9.0%) are the most common fields of study among 1,927 individuals in Lincoln County who have obtained a bachelor's degree or higher.
| Field of Study | # Graduates | % Graduates |
| Computers & Mathematics | 44 | 2.3% |
| Bio, Nature & Agricultural | 244 | 12.7% |
| Physical & Health Sciences | 100 | 5.2% |
| Psychology | 82 | 4.3% |
| Social Sciences | 117 | 6.1% |
| Engineering | 108 | 5.6% |
| Multidisciplinary Studies | 7 | 0.4% |
| Science & Technology | 174 | 9.0% |
| Business | 253 | 13.1% |
| Education | 392 | 20.3% |
| Literature & Languages | 56 | 2.9% |
| Liberal Arts & History | 102 | 5.3% |
| Visual & Performing Arts | 49 | 2.5% |
| Communications | 9 | 0.5% |
| Arts & Humanities | 190 | 9.9% |
| Total | 1,927 | 100.0% |
Transportation & Commute in Lincoln County
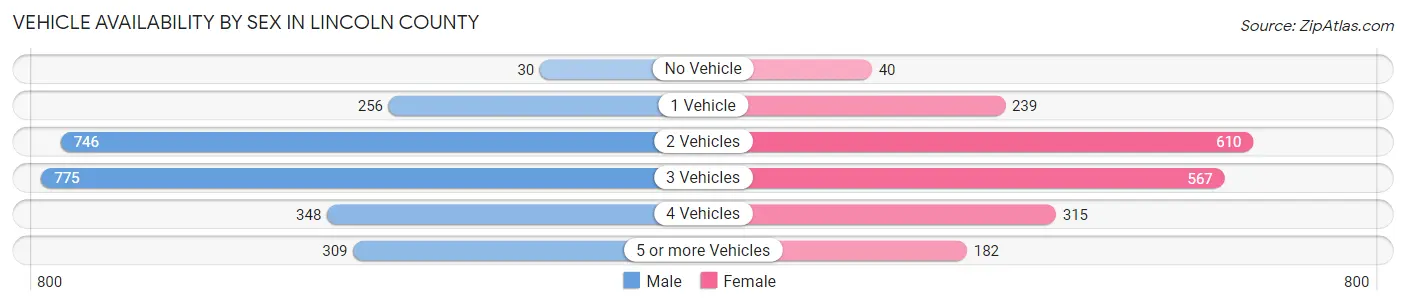
Vehicle Availability by Sex in Lincoln County
The most prevalent vehicle ownership categories in Lincoln County are males with 3 vehicles (775, accounting for 31.5%) and females with 3 vehicles (567, making up 39.7%).
| Vehicles Available | Male | Female |
| No Vehicle | 30 (1.2%) | 40 (2.1%) |
| 1 Vehicle | 256 (10.4%) | 239 (12.2%) |
| 2 Vehicles | 746 (30.3%) | 610 (31.2%) |
| 3 Vehicles | 775 (31.5%) | 567 (29.0%) |
| 4 Vehicles | 348 (14.1%) | 315 (16.1%) |
| 5 or more Vehicles | 309 (12.5%) | 182 (9.3%) |
| Total | 2,464 (100.0%) | 1,953 (100.0%) |
Commute Time in Lincoln County
The most frequently occuring commute durations in Lincoln County are 5 to 9 minutes (558 commuters, 14.7%), less than 5 minutes (476 commuters, 12.6%), and 15 to 19 minutes (436 commuters, 11.5%).
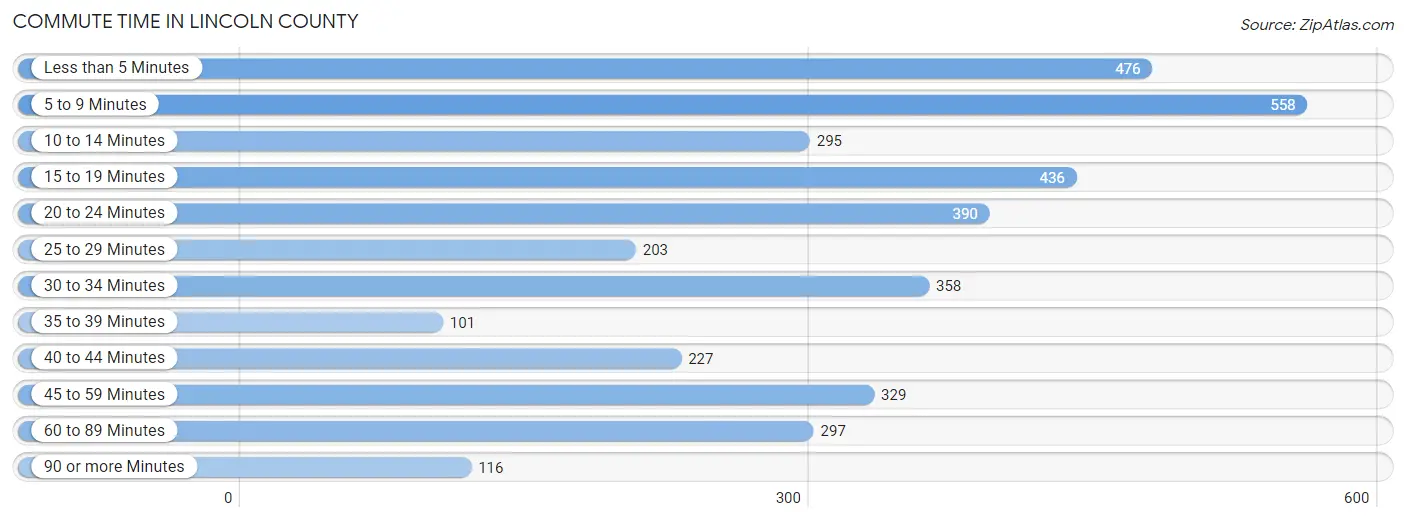
| Commute Time | # Commuters | % Commuters |
| Less than 5 Minutes | 476 | 12.6% |
| 5 to 9 Minutes | 558 | 14.7% |
| 10 to 14 Minutes | 295 | 7.8% |
| 15 to 19 Minutes | 436 | 11.5% |
| 20 to 24 Minutes | 390 | 10.3% |
| 25 to 29 Minutes | 203 | 5.4% |
| 30 to 34 Minutes | 358 | 9.5% |
| 35 to 39 Minutes | 101 | 2.7% |
| 40 to 44 Minutes | 227 | 6.0% |
| 45 to 59 Minutes | 329 | 8.7% |
| 60 to 89 Minutes | 297 | 7.8% |
| 90 or more Minutes | 116 | 3.1% |
Commute Time by Sex in Lincoln County
The most common commute times in Lincoln County are 5 to 9 minutes (275 commuters, 13.4%) for males and 5 to 9 minutes (283 commuters, 16.4%) for females.
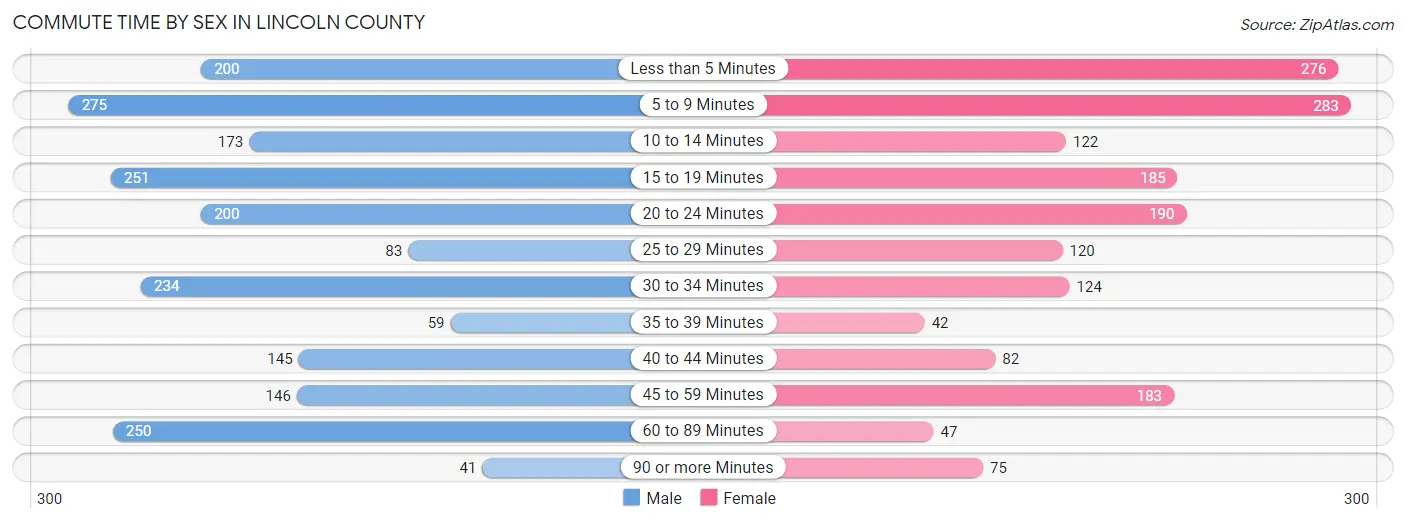
| Commute Time | Male | Female |
| Less than 5 Minutes | 200 (9.7%) | 276 (16.0%) |
| 5 to 9 Minutes | 275 (13.4%) | 283 (16.4%) |
| 10 to 14 Minutes | 173 (8.4%) | 122 (7.1%) |
| 15 to 19 Minutes | 251 (12.2%) | 185 (10.7%) |
| 20 to 24 Minutes | 200 (9.7%) | 190 (11.0%) |
| 25 to 29 Minutes | 83 (4.0%) | 120 (6.9%) |
| 30 to 34 Minutes | 234 (11.4%) | 124 (7.2%) |
| 35 to 39 Minutes | 59 (2.9%) | 42 (2.4%) |
| 40 to 44 Minutes | 145 (7.0%) | 82 (4.7%) |
| 45 to 59 Minutes | 146 (7.1%) | 183 (10.6%) |
| 60 to 89 Minutes | 250 (12.1%) | 47 (2.7%) |
| 90 or more Minutes | 41 (2.0%) | 75 (4.3%) |
Time of Departure to Work by Sex in Lincoln County
The most frequent times of departure to work in Lincoln County are 7:00 AM to 7:29 AM (386, 18.8%) for males and 7:30 AM to 7:59 AM (426, 24.6%) for females.
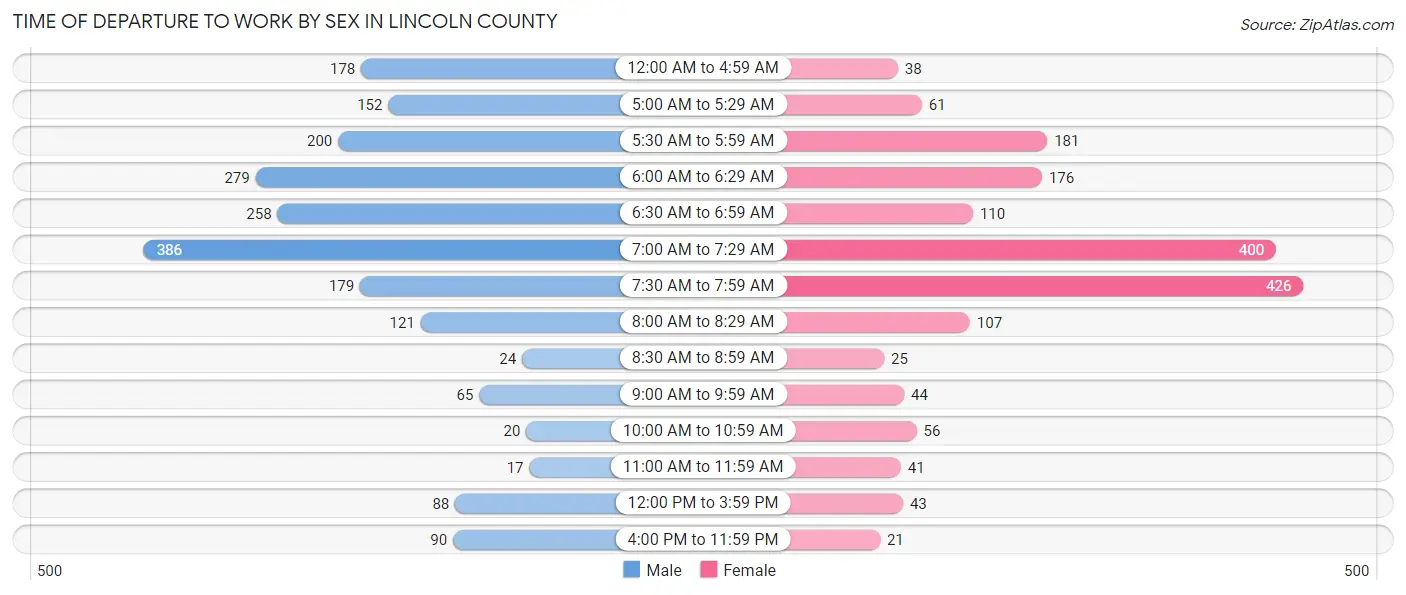
| Time of Departure | Male | Female |
| 12:00 AM to 4:59 AM | 178 (8.6%) | 38 (2.2%) |
| 5:00 AM to 5:29 AM | 152 (7.4%) | 61 (3.5%) |
| 5:30 AM to 5:59 AM | 200 (9.7%) | 181 (10.5%) |
| 6:00 AM to 6:29 AM | 279 (13.6%) | 176 (10.2%) |
| 6:30 AM to 6:59 AM | 258 (12.5%) | 110 (6.4%) |
| 7:00 AM to 7:29 AM | 386 (18.8%) | 400 (23.1%) |
| 7:30 AM to 7:59 AM | 179 (8.7%) | 426 (24.6%) |
| 8:00 AM to 8:29 AM | 121 (5.9%) | 107 (6.2%) |
| 8:30 AM to 8:59 AM | 24 (1.2%) | 25 (1.5%) |
| 9:00 AM to 9:59 AM | 65 (3.2%) | 44 (2.5%) |
| 10:00 AM to 10:59 AM | 20 (1.0%) | 56 (3.2%) |
| 11:00 AM to 11:59 AM | 17 (0.8%) | 41 (2.4%) |
| 12:00 PM to 3:59 PM | 88 (4.3%) | 43 (2.5%) |
| 4:00 PM to 11:59 PM | 90 (4.4%) | 21 (1.2%) |
| Total | 2,057 (100.0%) | 1,729 (100.0%) |
Housing Occupancy in Lincoln County
Occupancy by Ownership in Lincoln County
Of the total 4,532 dwellings in Lincoln County, owner-occupied units account for 3,528 (77.8%), while renter-occupied units make up 1,004 (22.2%).
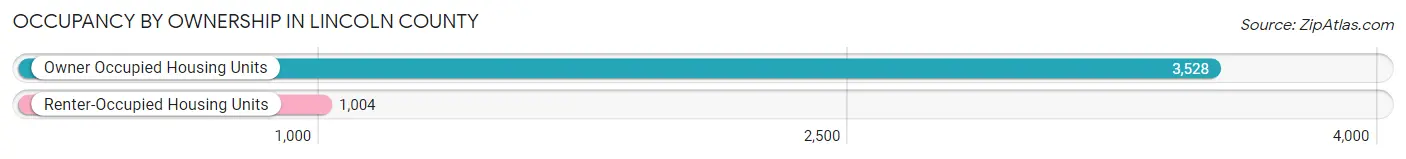
| Occupancy | # Housing Units | % Housing Units |
| Owner Occupied Housing Units | 3,528 | 77.8% |
| Renter-Occupied Housing Units | 1,004 | 22.2% |
| Total Occupied Housing Units | 4,532 | 100.0% |
Occupancy by Household Size in Lincoln County
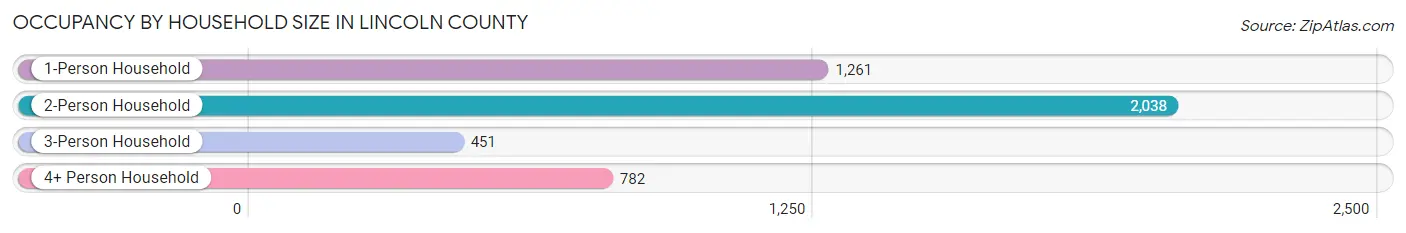
| Household Size | # Housing Units | % Housing Units |
| 1-Person Household | 1,261 | 27.8% |
| 2-Person Household | 2,038 | 45.0% |
| 3-Person Household | 451 | 10.0% |
| 4+ Person Household | 782 | 17.3% |
| Total Housing Units | 4,532 | 100.0% |
Occupancy by Ownership by Household Size in Lincoln County
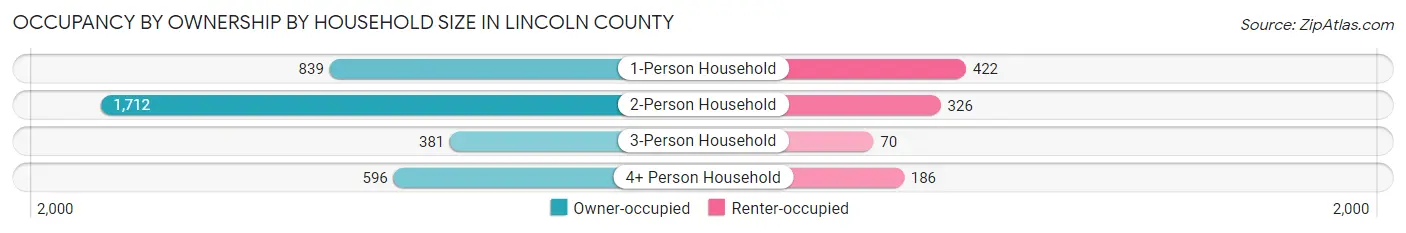
| Household Size | Owner-occupied | Renter-occupied |
| 1-Person Household | 839 (66.5%) | 422 (33.5%) |
| 2-Person Household | 1,712 (84.0%) | 326 (16.0%) |
| 3-Person Household | 381 (84.5%) | 70 (15.5%) |
| 4+ Person Household | 596 (76.2%) | 186 (23.8%) |
| Total Housing Units | 3,528 (77.8%) | 1,004 (22.2%) |
Occupancy by Educational Attainment in Lincoln County
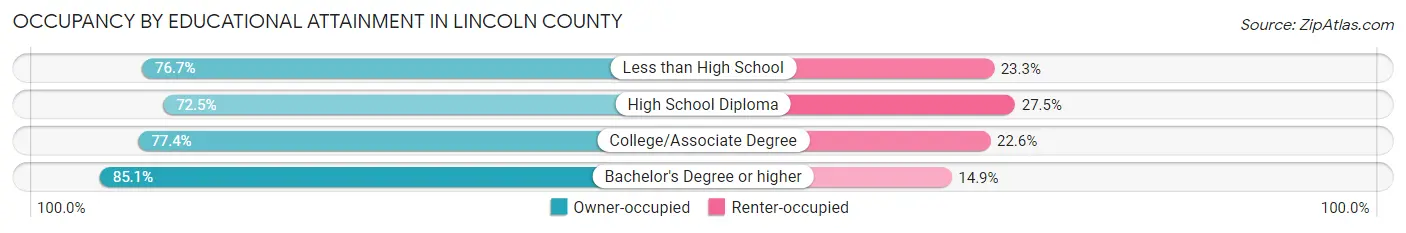
| Household Size | Owner-occupied | Renter-occupied |
| Less than High School | 273 (76.7%) | 83 (23.3%) |
| High School Diploma | 881 (72.5%) | 334 (27.5%) |
| College/Associate Degree | 1,472 (77.4%) | 429 (22.6%) |
| Bachelor's Degree or higher | 902 (85.1%) | 158 (14.9%) |
Occupancy by Age of Householder in Lincoln County
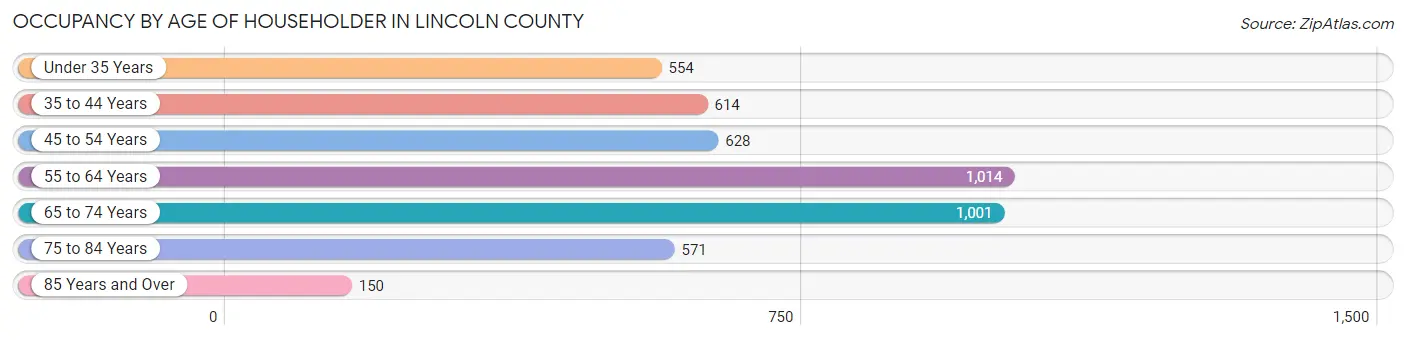
| Age Bracket | # Households | % Households |
| Under 35 Years | 554 | 12.2% |
| 35 to 44 Years | 614 | 13.6% |
| 45 to 54 Years | 628 | 13.9% |
| 55 to 64 Years | 1,014 | 22.4% |
| 65 to 74 Years | 1,001 | 22.1% |
| 75 to 84 Years | 571 | 12.6% |
| 85 Years and Over | 150 | 3.3% |
| Total | 4,532 | 100.0% |
Housing Finances in Lincoln County
Median Income by Occupancy in Lincoln County
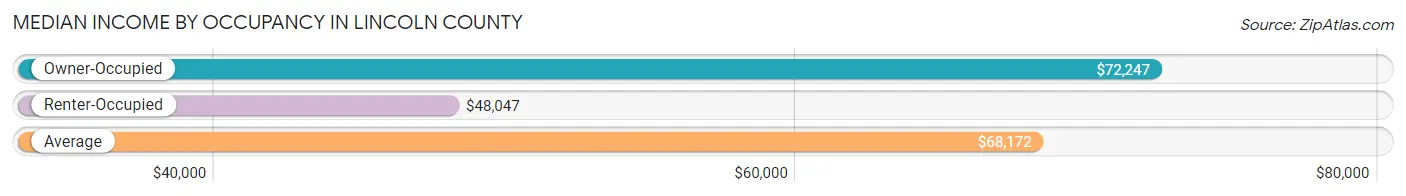
| Occupancy Type | # Households | Median Income |
| Owner-Occupied | 3,528 (77.8%) | $72,247 |
| Renter-Occupied | 1,004 (22.2%) | $48,047 |
| Average | 4,532 (100.0%) | $68,172 |
Occupancy by Householder Income Bracket in Lincoln County
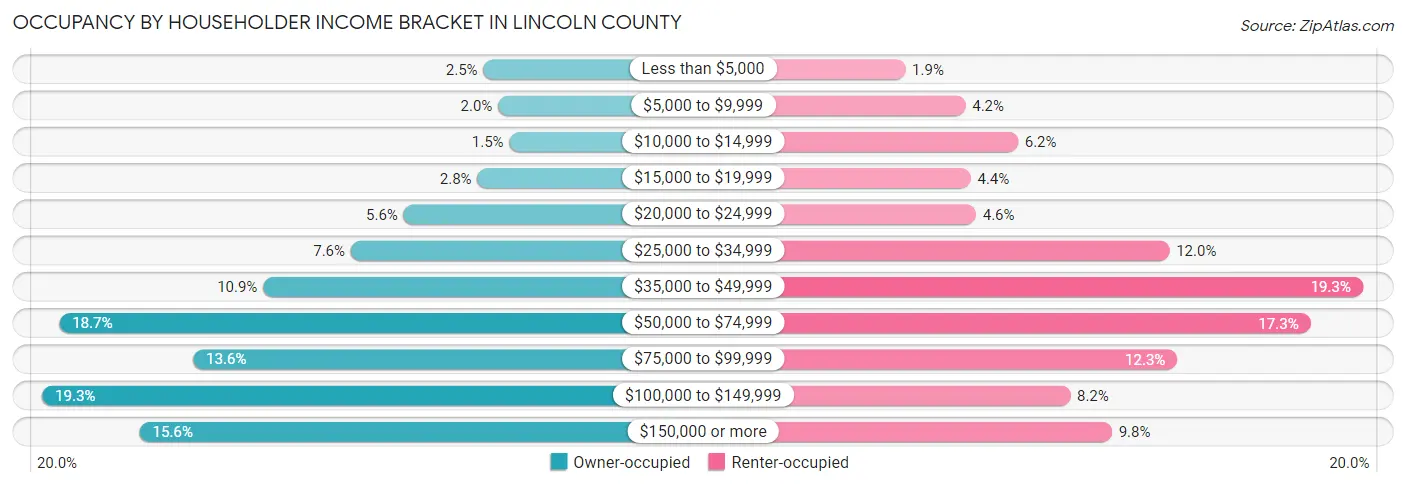
| Income Bracket | Owner-occupied | Renter-occupied |
| Less than $5,000 | 89 (2.5%) | 19 (1.9%) |
| $5,000 to $9,999 | 69 (2.0%) | 42 (4.2%) |
| $10,000 to $14,999 | 54 (1.5%) | 62 (6.2%) |
| $15,000 to $19,999 | 97 (2.8%) | 44 (4.4%) |
| $20,000 to $24,999 | 196 (5.6%) | 46 (4.6%) |
| $25,000 to $34,999 | 267 (7.6%) | 120 (11.9%) |
| $35,000 to $49,999 | 385 (10.9%) | 194 (19.3%) |
| $50,000 to $74,999 | 659 (18.7%) | 174 (17.3%) |
| $75,000 to $99,999 | 479 (13.6%) | 123 (12.2%) |
| $100,000 to $149,999 | 682 (19.3%) | 82 (8.2%) |
| $150,000 or more | 551 (15.6%) | 98 (9.8%) |
| Total | 3,528 (100.0%) | 1,004 (100.0%) |
Monthly Housing Cost Tiers in Lincoln County
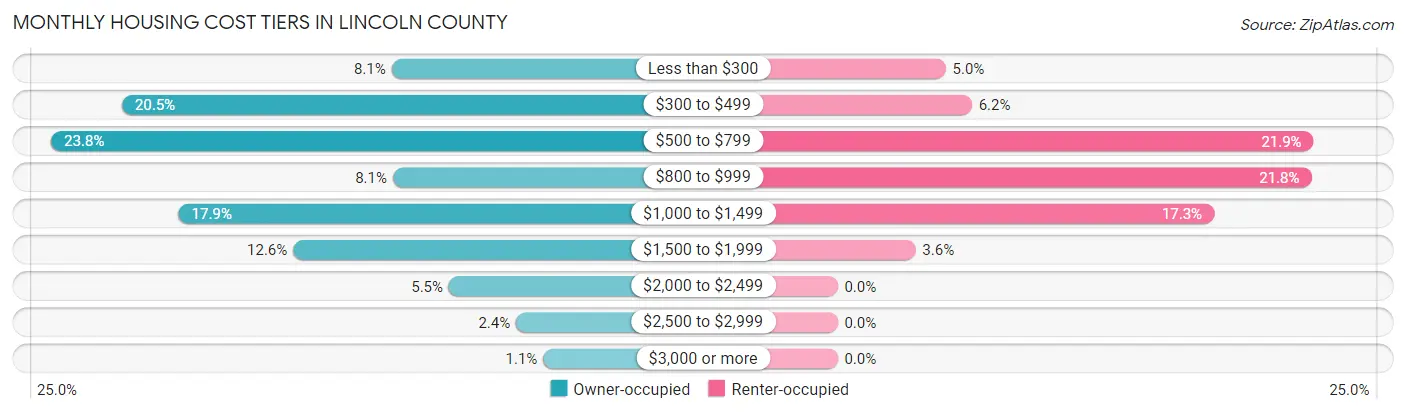
| Monthly Cost | Owner-occupied | Renter-occupied |
| Less than $300 | 286 (8.1%) | 50 (5.0%) |
| $300 to $499 | 724 (20.5%) | 62 (6.2%) |
| $500 to $799 | 839 (23.8%) | 220 (21.9%) |
| $800 to $999 | 284 (8.1%) | 219 (21.8%) |
| $1,000 to $1,499 | 632 (17.9%) | 174 (17.3%) |
| $1,500 to $1,999 | 446 (12.6%) | 36 (3.6%) |
| $2,000 to $2,499 | 193 (5.5%) | 0 (0.0%) |
| $2,500 to $2,999 | 84 (2.4%) | 0 (0.0%) |
| $3,000 or more | 40 (1.1%) | 0 (0.0%) |
| Total | 3,528 (100.0%) | 1,004 (100.0%) |
Physical Housing Characteristics in Lincoln County
Housing Structures in Lincoln County
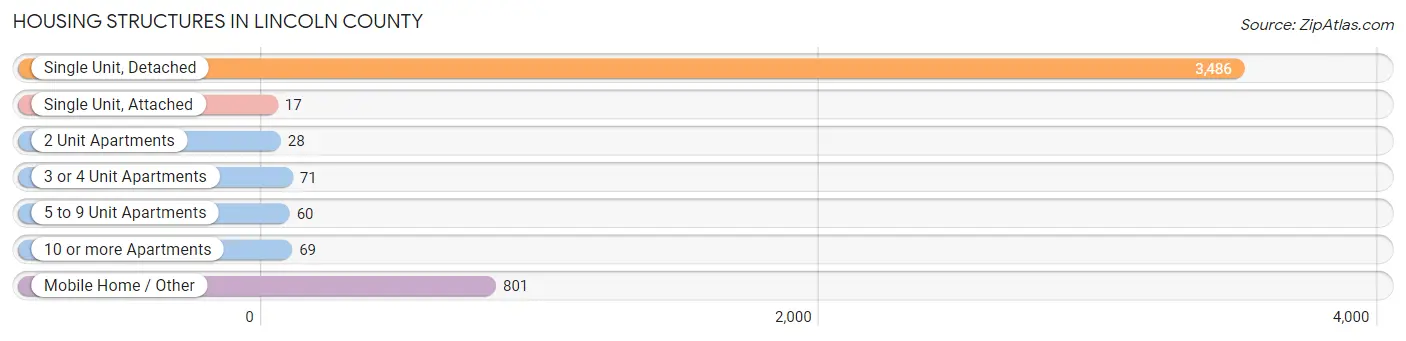
| Structure Type | # Housing Units | % Housing Units |
| Single Unit, Detached | 3,486 | 76.9% |
| Single Unit, Attached | 17 | 0.4% |
| 2 Unit Apartments | 28 | 0.6% |
| 3 or 4 Unit Apartments | 71 | 1.6% |
| 5 to 9 Unit Apartments | 60 | 1.3% |
| 10 or more Apartments | 69 | 1.5% |
| Mobile Home / Other | 801 | 17.7% |
| Total | 4,532 | 100.0% |
Housing Structures by Occupancy in Lincoln County
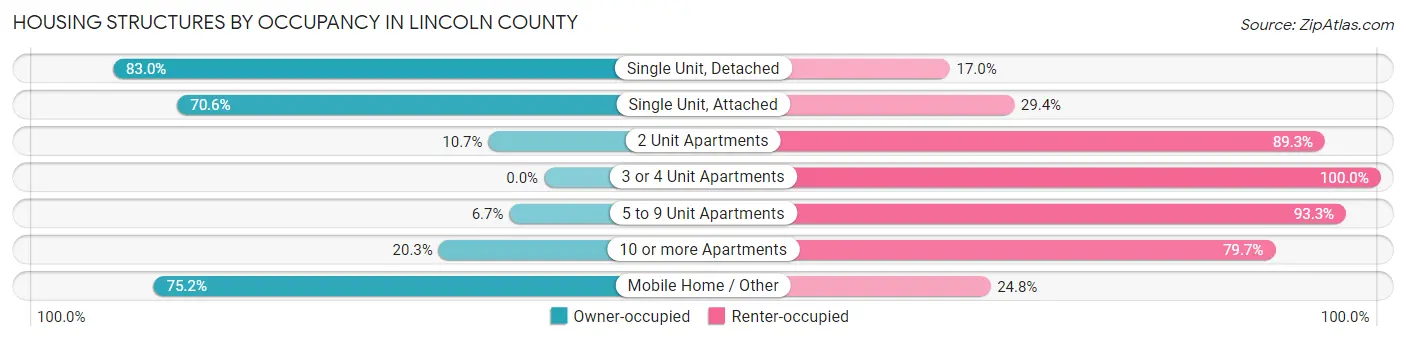
| Structure Type | Owner-occupied | Renter-occupied |
| Single Unit, Detached | 2,893 (83.0%) | 593 (17.0%) |
| Single Unit, Attached | 12 (70.6%) | 5 (29.4%) |
| 2 Unit Apartments | 3 (10.7%) | 25 (89.3%) |
| 3 or 4 Unit Apartments | 0 (0.0%) | 71 (100.0%) |
| 5 to 9 Unit Apartments | 4 (6.7%) | 56 (93.3%) |
| 10 or more Apartments | 14 (20.3%) | 55 (79.7%) |
| Mobile Home / Other | 602 (75.2%) | 199 (24.8%) |
| Total | 3,528 (77.8%) | 1,004 (22.2%) |
Housing Structures by Number of Rooms in Lincoln County
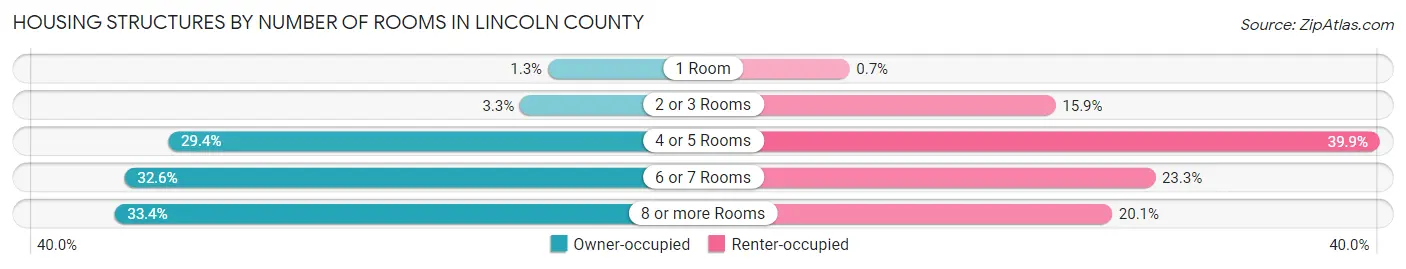
| Number of Rooms | Owner-occupied | Renter-occupied |
| 1 Room | 45 (1.3%) | 7 (0.7%) |
| 2 or 3 Rooms | 118 (3.3%) | 160 (15.9%) |
| 4 or 5 Rooms | 1,037 (29.4%) | 401 (39.9%) |
| 6 or 7 Rooms | 1,151 (32.6%) | 234 (23.3%) |
| 8 or more Rooms | 1,177 (33.4%) | 202 (20.1%) |
| Total | 3,528 (100.0%) | 1,004 (100.0%) |
Housing Structure by Heating Type in Lincoln County
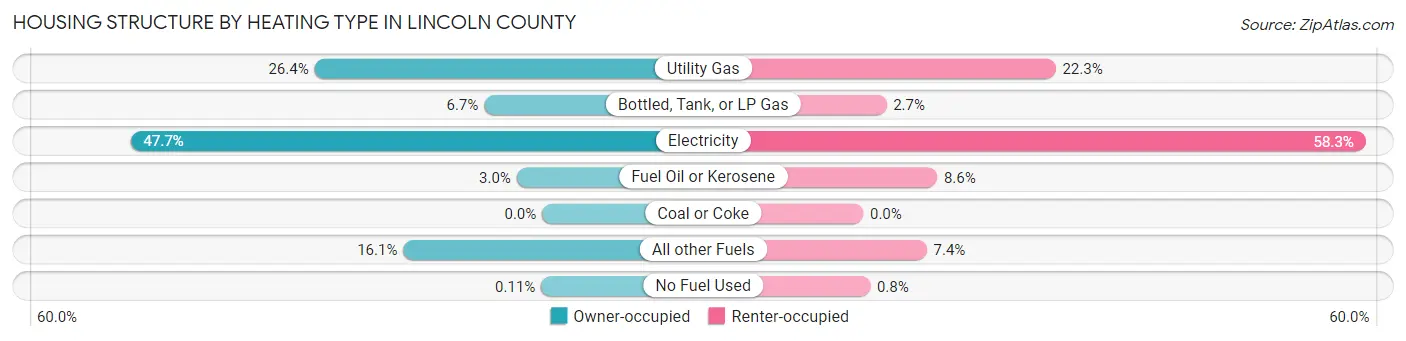
| Heating Type | Owner-occupied | Renter-occupied |
| Utility Gas | 931 (26.4%) | 224 (22.3%) |
| Bottled, Tank, or LP Gas | 237 (6.7%) | 27 (2.7%) |
| Electricity | 1,684 (47.7%) | 585 (58.3%) |
| Fuel Oil or Kerosene | 104 (2.9%) | 86 (8.6%) |
| Coal or Coke | 0 (0.0%) | 0 (0.0%) |
| All other Fuels | 568 (16.1%) | 74 (7.4%) |
| No Fuel Used | 4 (0.1%) | 8 (0.8%) |
| Total | 3,528 (100.0%) | 1,004 (100.0%) |
Household Vehicle Usage in Lincoln County
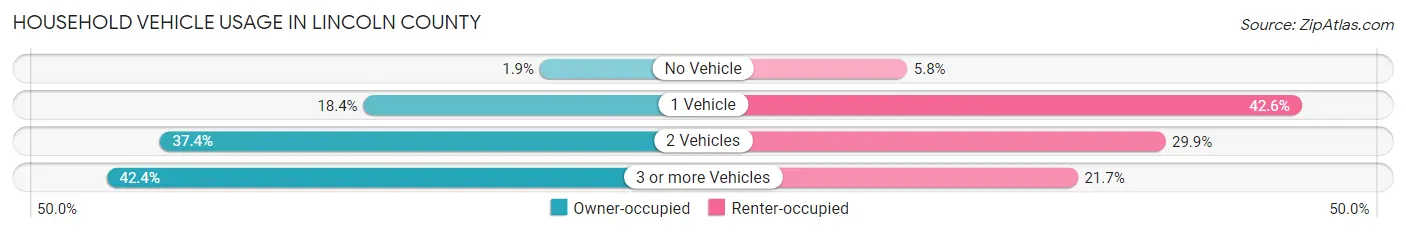
| Vehicles per Household | Owner-occupied | Renter-occupied |
| No Vehicle | 67 (1.9%) | 58 (5.8%) |
| 1 Vehicle | 648 (18.4%) | 428 (42.6%) |
| 2 Vehicles | 1,319 (37.4%) | 300 (29.9%) |
| 3 or more Vehicles | 1,494 (42.3%) | 218 (21.7%) |
| Total | 3,528 (100.0%) | 1,004 (100.0%) |
Real Estate & Mortgages in Lincoln County
Real Estate and Mortgage Overview in Lincoln County
| Characteristic | Without Mortgage | With Mortgage |
| Housing Units | 1,826 | 1,702 |
| Median Property Value | $210,400 | $251,700 |
| Median Household Income | $62,389 | $353 |
| Monthly Housing Costs | $476 | $40 |
| Real Estate Taxes | $1,365 | $78 |
Property Value by Mortgage Status in Lincoln County
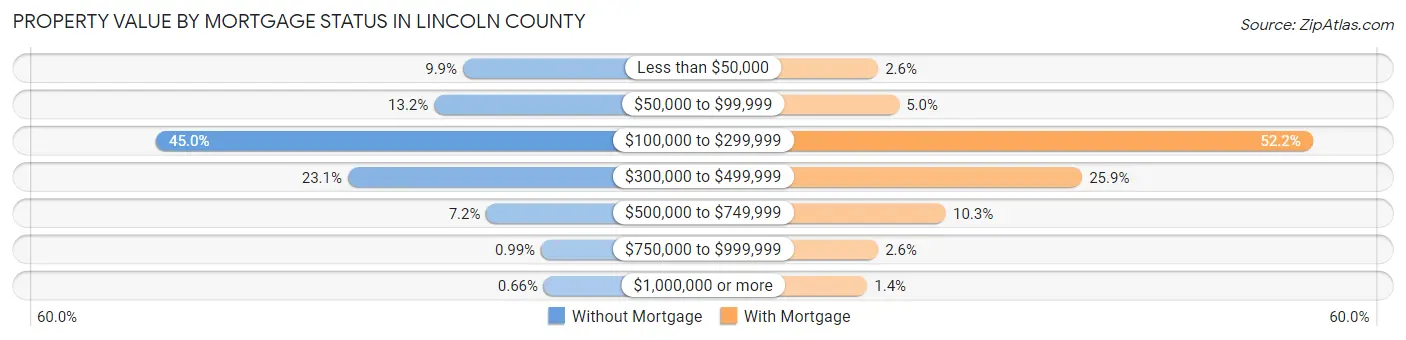
| Property Value | Without Mortgage | With Mortgage |
| Less than $50,000 | 181 (9.9%) | 44 (2.6%) |
| $50,000 to $99,999 | 241 (13.2%) | 85 (5.0%) |
| $100,000 to $299,999 | 821 (45.0%) | 889 (52.2%) |
| $300,000 to $499,999 | 421 (23.1%) | 441 (25.9%) |
| $500,000 to $749,999 | 132 (7.2%) | 176 (10.3%) |
| $750,000 to $999,999 | 18 (1.0%) | 44 (2.6%) |
| $1,000,000 or more | 12 (0.7%) | 23 (1.3%) |
| Total | 1,826 (100.0%) | 1,702 (100.0%) |
Household Income by Mortgage Status in Lincoln County
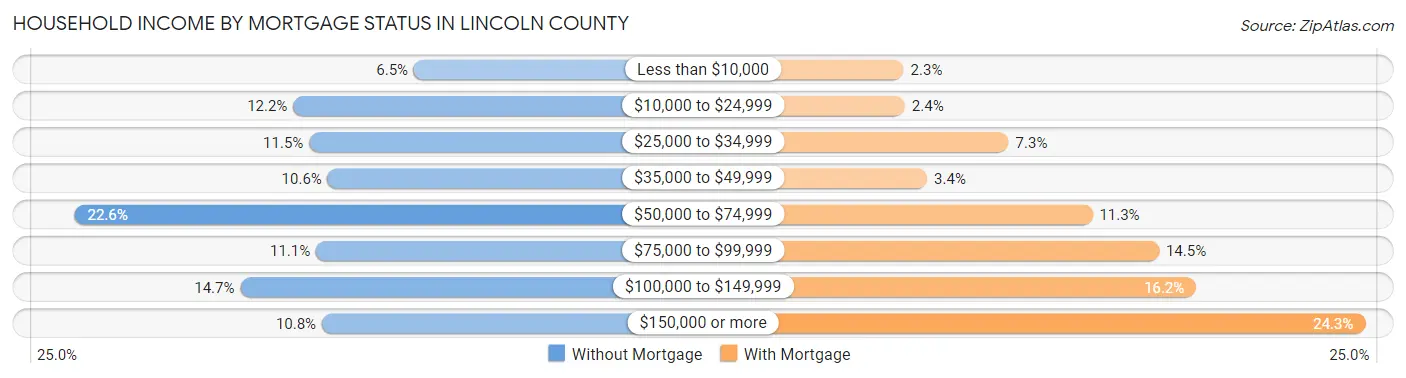
| Household Income | Without Mortgage | With Mortgage |
| Less than $10,000 | 118 (6.5%) | 39 (2.3%) |
| $10,000 to $24,999 | 223 (12.2%) | 40 (2.4%) |
| $25,000 to $34,999 | 209 (11.5%) | 124 (7.3%) |
| $35,000 to $49,999 | 193 (10.6%) | 58 (3.4%) |
| $50,000 to $74,999 | 413 (22.6%) | 192 (11.3%) |
| $75,000 to $99,999 | 203 (11.1%) | 246 (14.4%) |
| $100,000 to $149,999 | 269 (14.7%) | 276 (16.2%) |
| $150,000 or more | 198 (10.8%) | 413 (24.3%) |
| Total | 1,826 (100.0%) | 1,702 (100.0%) |
Property Value to Household Income Ratio in Lincoln County
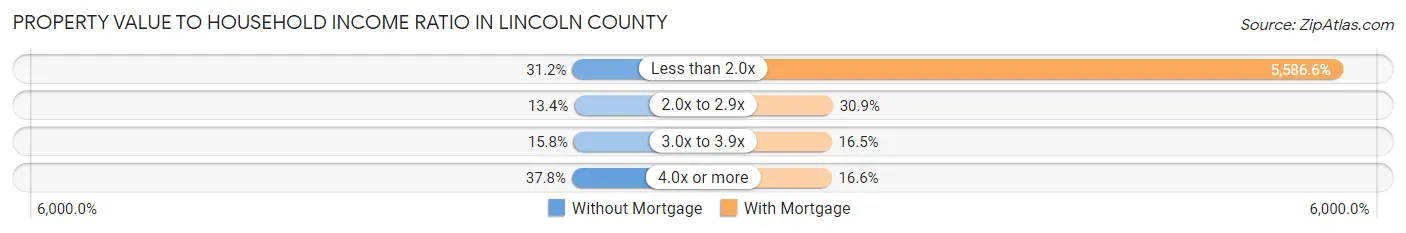
| Value-to-Income Ratio | Without Mortgage | With Mortgage |
| Less than 2.0x | 569 (31.2%) | 95,083 (5,586.5%) |
| 2.0x to 2.9x | 245 (13.4%) | 525 (30.8%) |
| 3.0x to 3.9x | 289 (15.8%) | 281 (16.5%) |
| 4.0x or more | 690 (37.8%) | 283 (16.6%) |
| Total | 1,826 (100.0%) | 1,702 (100.0%) |
Real Estate Taxes by Mortgage Status in Lincoln County
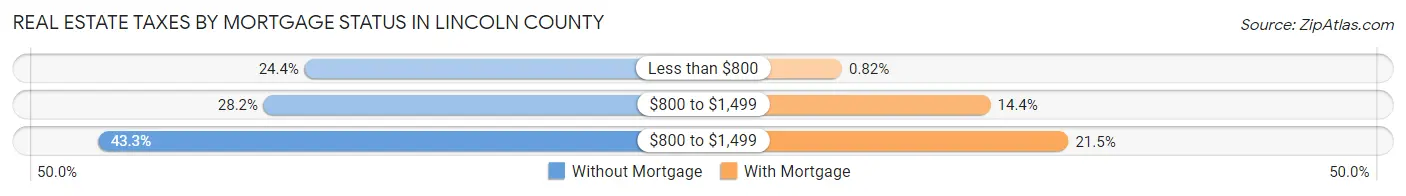
| Property Taxes | Without Mortgage | With Mortgage |
| Less than $800 | 446 (24.4%) | 14 (0.8%) |
| $800 to $1,499 | 514 (28.1%) | 245 (14.4%) |
| $800 to $1,499 | 791 (43.3%) | 366 (21.5%) |
| Total | 1,826 (100.0%) | 1,702 (100.0%) |
Health & Disability in Lincoln County
Health Insurance Coverage by Age in Lincoln County
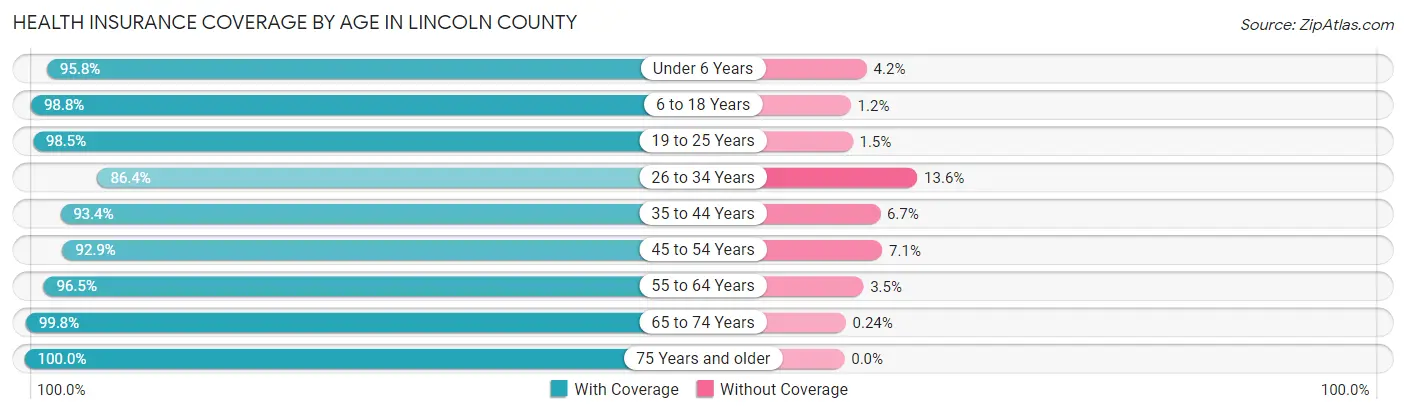
| Age Bracket | With Coverage | Without Coverage |
| Under 6 Years | 667 (95.8%) | 29 (4.2%) |
| 6 to 18 Years | 1,822 (98.8%) | 22 (1.2%) |
| 19 to 25 Years | 705 (98.5%) | 11 (1.5%) |
| 26 to 34 Years | 706 (86.4%) | 111 (13.6%) |
| 35 to 44 Years | 1,109 (93.3%) | 79 (6.7%) |
| 45 to 54 Years | 1,132 (92.9%) | 86 (7.1%) |
| 55 to 64 Years | 1,666 (96.5%) | 61 (3.5%) |
| 65 to 74 Years | 1,657 (99.8%) | 4 (0.2%) |
| 75 Years and older | 1,040 (100.0%) | 0 (0.0%) |
| Total | 10,504 (96.3%) | 403 (3.7%) |
Health Insurance Coverage by Citizenship Status in Lincoln County
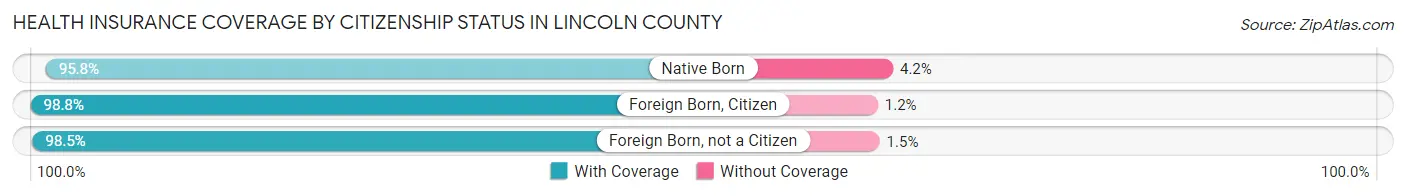
| Citizenship Status | With Coverage | Without Coverage |
| Native Born | 667 (95.8%) | 29 (4.2%) |
| Foreign Born, Citizen | 1,822 (98.8%) | 22 (1.2%) |
| Foreign Born, not a Citizen | 705 (98.5%) | 11 (1.5%) |
Health Insurance Coverage by Household Income in Lincoln County
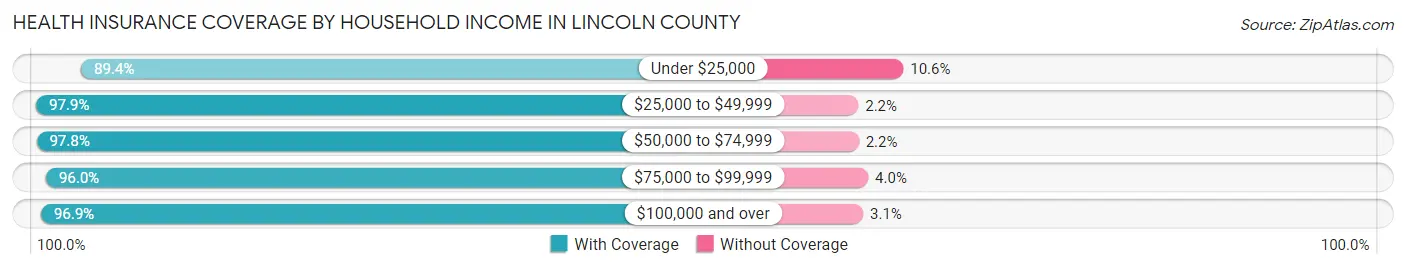
| Household Income | With Coverage | Without Coverage |
| Under $25,000 | 1,040 (89.4%) | 123 (10.6%) |
| $25,000 to $49,999 | 1,867 (97.9%) | 41 (2.1%) |
| $50,000 to $74,999 | 2,018 (97.8%) | 46 (2.2%) |
| $75,000 to $99,999 | 1,583 (96.0%) | 66 (4.0%) |
| $100,000 and over | 3,986 (96.9%) | 126 (3.1%) |
Public vs Private Health Insurance Coverage by Age in Lincoln County
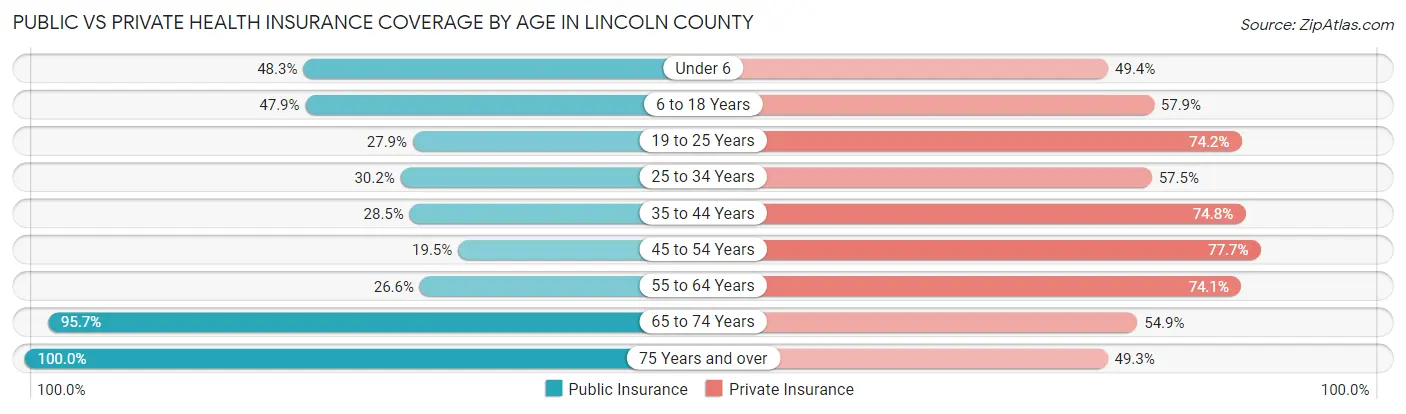
| Age Bracket | Public Insurance | Private Insurance |
| Under 6 | 336 (48.3%) | 344 (49.4%) |
| 6 to 18 Years | 883 (47.9%) | 1,068 (57.9%) |
| 19 to 25 Years | 200 (27.9%) | 531 (74.2%) |
| 25 to 34 Years | 247 (30.2%) | 470 (57.5%) |
| 35 to 44 Years | 339 (28.5%) | 889 (74.8%) |
| 45 to 54 Years | 238 (19.5%) | 946 (77.7%) |
| 55 to 64 Years | 460 (26.6%) | 1,279 (74.1%) |
| 65 to 74 Years | 1,589 (95.7%) | 911 (54.8%) |
| 75 Years and over | 1,040 (100.0%) | 513 (49.3%) |
| Total | 5,332 (48.9%) | 6,951 (63.7%) |
Disability Status by Sex by Age in Lincoln County
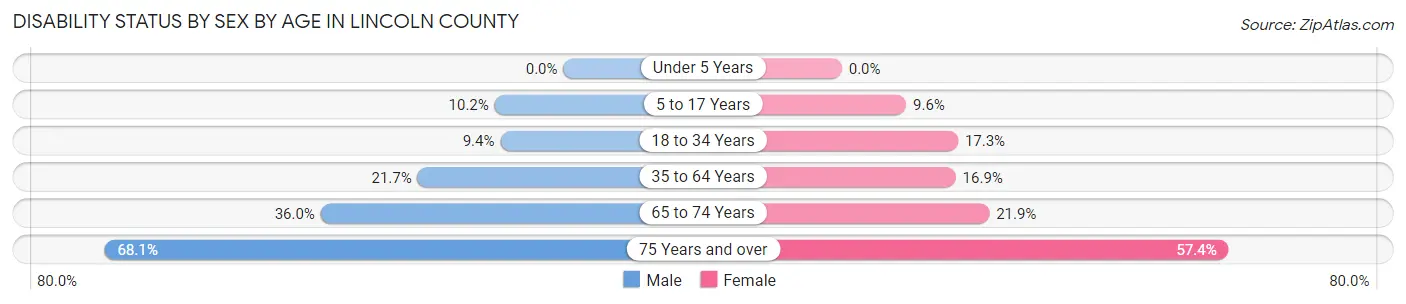
| Age Bracket | Male | Female |
| Under 5 Years | 0 (0.0%) | 0 (0.0%) |
| 5 to 17 Years | 101 (10.2%) | 81 (9.6%) |
| 18 to 34 Years | 80 (9.4%) | 138 (17.2%) |
| 35 to 64 Years | 443 (21.6%) | 353 (16.9%) |
| 65 to 74 Years | 312 (36.0%) | 174 (21.9%) |
| 75 Years and over | 342 (68.1%) | 309 (57.4%) |
Disability Class by Sex by Age in Lincoln County
Disability Class: Hearing Difficulty
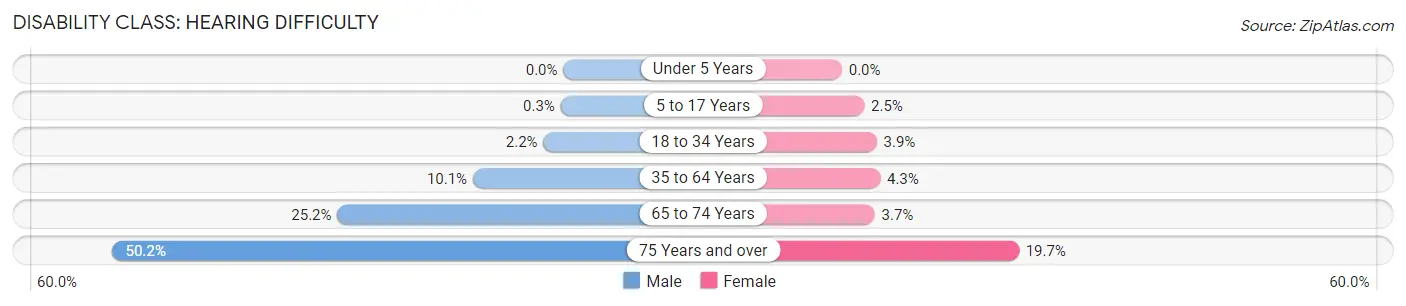
| Age Bracket | Male | Female |
| Under 5 Years | 0 (0.0%) | 0 (0.0%) |
| 5 to 17 Years | 3 (0.3%) | 21 (2.5%) |
| 18 to 34 Years | 19 (2.2%) | 31 (3.9%) |
| 35 to 64 Years | 206 (10.1%) | 89 (4.3%) |
| 65 to 74 Years | 218 (25.2%) | 29 (3.6%) |
| 75 Years and over | 252 (50.2%) | 106 (19.7%) |
Disability Class: Vision Difficulty
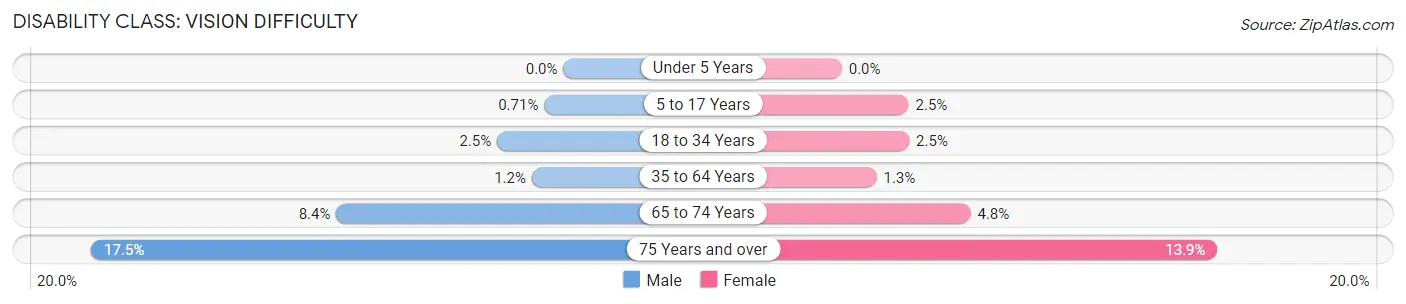
| Age Bracket | Male | Female |
| Under 5 Years | 0 (0.0%) | 0 (0.0%) |
| 5 to 17 Years | 7 (0.7%) | 21 (2.5%) |
| 18 to 34 Years | 21 (2.5%) | 20 (2.5%) |
| 35 to 64 Years | 24 (1.2%) | 27 (1.3%) |
| 65 to 74 Years | 73 (8.4%) | 38 (4.8%) |
| 75 Years and over | 88 (17.5%) | 75 (13.9%) |
Disability Class: Cognitive Difficulty
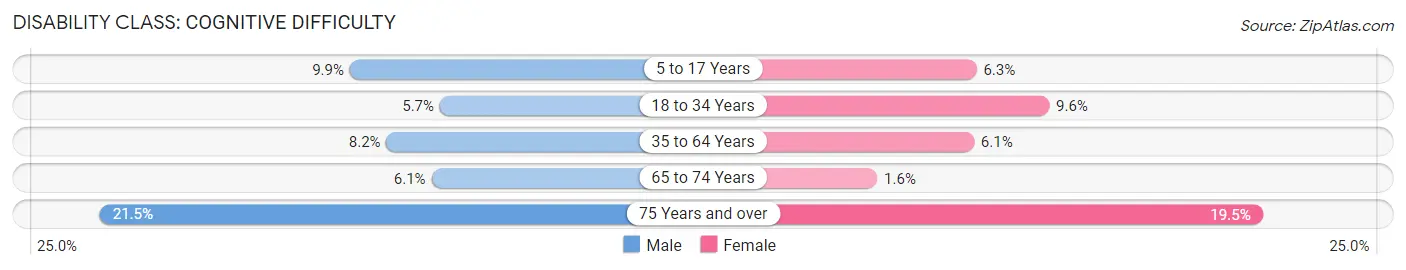
| Age Bracket | Male | Female |
| 5 to 17 Years | 98 (9.9%) | 53 (6.2%) |
| 18 to 34 Years | 49 (5.7%) | 77 (9.6%) |
| 35 to 64 Years | 168 (8.2%) | 128 (6.1%) |
| 65 to 74 Years | 53 (6.1%) | 13 (1.6%) |
| 75 Years and over | 108 (21.5%) | 105 (19.5%) |
Disability Class: Ambulatory Difficulty
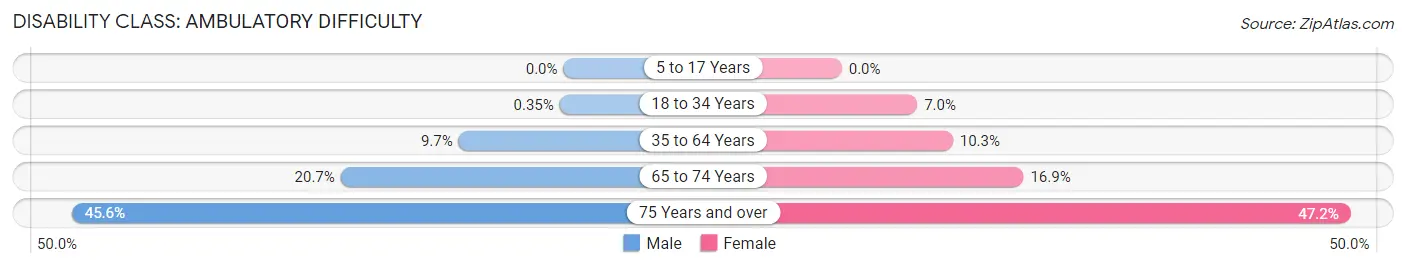
| Age Bracket | Male | Female |
| 5 to 17 Years | 0 (0.0%) | 0 (0.0%) |
| 18 to 34 Years | 3 (0.4%) | 56 (7.0%) |
| 35 to 64 Years | 199 (9.7%) | 215 (10.3%) |
| 65 to 74 Years | 179 (20.7%) | 134 (16.9%) |
| 75 Years and over | 229 (45.6%) | 254 (47.2%) |
Disability Class: Self-Care Difficulty
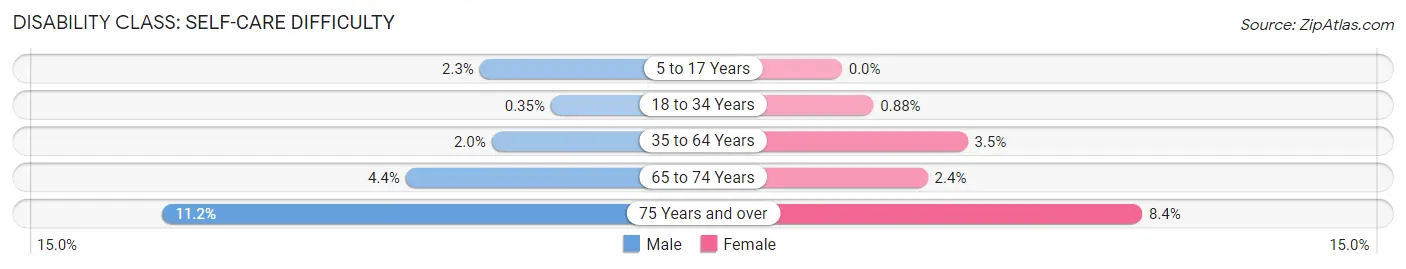
| Age Bracket | Male | Female |
| 5 to 17 Years | 23 (2.3%) | 0 (0.0%) |
| 18 to 34 Years | 3 (0.4%) | 7 (0.9%) |
| 35 to 64 Years | 41 (2.0%) | 73 (3.5%) |
| 65 to 74 Years | 38 (4.4%) | 19 (2.4%) |
| 75 Years and over | 56 (11.2%) | 45 (8.4%) |
Technology Access in Lincoln County
Computing Device Access in Lincoln County
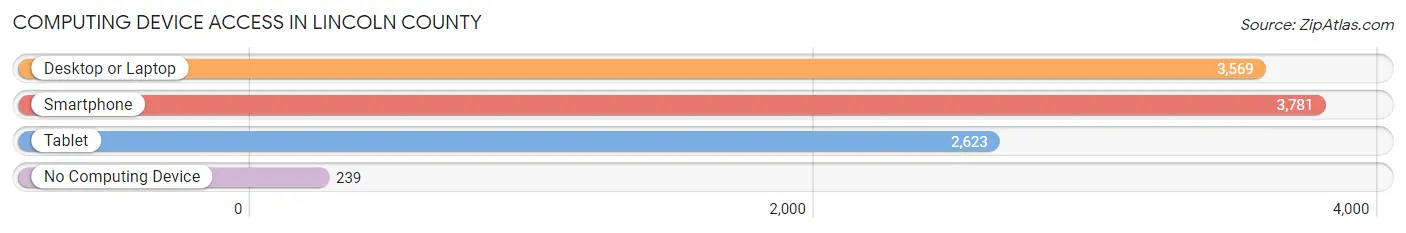
| Device Type | # Households | % Households |
| Desktop or Laptop | 3,569 | 78.7% |
| Smartphone | 3,781 | 83.4% |
| Tablet | 2,623 | 57.9% |
| No Computing Device | 239 | 5.3% |
| Total | 4,532 | 100.0% |
Internet Access in Lincoln County
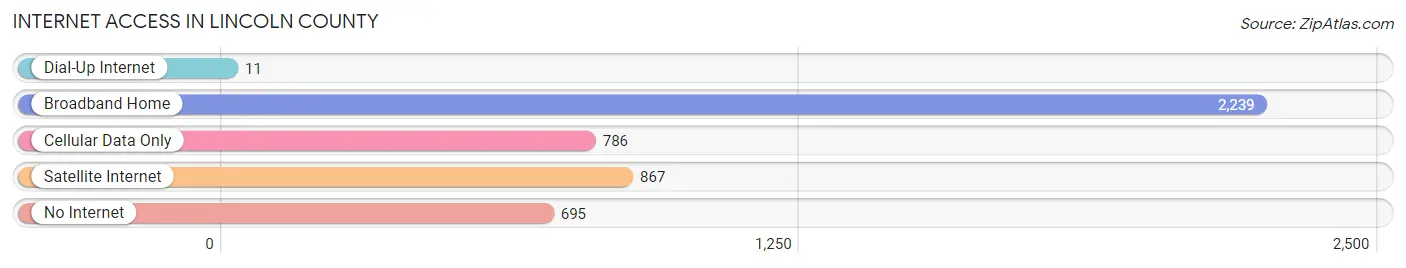
| Internet Type | # Households | % Households |
| Dial-Up Internet | 11 | 0.2% |
| Broadband Home | 2,239 | 49.4% |
| Cellular Data Only | 786 | 17.3% |
| Satellite Internet | 867 | 19.1% |
| No Internet | 695 | 15.3% |
| Total | 4,532 | 100.0% |
Lincoln County Summary
Lincoln County is located in the eastern part of Washington State, and is bordered by Spokane County to the north, Adams County to the east, Whitman County to the south, and Grant County to the west. The county seat is Davenport, and the largest city is Wilbur. The county was created in 1883 and named after President Abraham Lincoln.
Geography
Lincoln County covers an area of 1,743 square miles, making it the fifth largest county in Washington State. The terrain is mostly rolling hills and plains, with some areas of rugged terrain in the northern part of the county. The highest point in the county is Mount Spokane, which rises to an elevation of 5,883 feet. The county is drained by the Spokane River, which flows through the northern part of the county, and by the Little Spokane River, which flows through the southern part of the county.
The climate of Lincoln County is semi-arid, with hot summers and cold winters. The average annual precipitation is around 15 inches, with most of it falling in the winter months.
Economy
The economy of Lincoln County is largely based on agriculture, with wheat, barley, and other grains being the main crops. Livestock production is also important, with cattle, sheep, and horses being raised in the county.
The county is also home to several manufacturing companies, including a paper mill, a furniture factory, and a metal fabrication plant. Tourism is also an important part of the economy, with several recreational areas, including Lake Roosevelt National Recreation Area, providing visitors with opportunities for camping, fishing, and boating.
Demographics
As of the 2010 census, Lincoln County had a population of 10,845. The population was spread out, with 24.3% under the age of 18, 8.2% from 18 to 24, 25.2% from 25 to 44, 28.2% from 45 to 64, and 14.1% who were 65 years of age or older. The median age was 40.3 years.
The racial makeup of the county was 94.2% White, 0.7% Native American, 0.3% Asian, 0.1% Pacific Islander, 0.2% from other races, and 4.5% from two or more races. Hispanic or Latino of any race were 2.2% of the population.
The median income for a household in the county was $37,945, and the median income for a family was $45,938. The per capita income for the county was $19,945. About 11.2% of families and 15.2% of the population were below the poverty line, including 20.2% of those under age 18 and 8.2% of those age 65 or over.
Conclusion
Lincoln County is a rural county located in the eastern part of Washington State. The county is largely agricultural, with wheat, barley, and other grains being the main crops. The county is also home to several manufacturing companies, and tourism is an important part of the economy. The population of the county is largely white, with a small percentage of Native Americans, Asians, and Pacific Islanders. The median income for a household in the county is slightly below the state average, and the poverty rate is slightly higher than the state average.
Common Questions
What is Per Capita Income in Lincoln County?
Per Capita income in Lincoln County is $36,741.
What is the Median Family Income in Lincoln County?
Median Family Income in Lincoln County is $78,894.
What is the Median Household income in Lincoln County?
Median Household Income in Lincoln County is $68,172.
What is Income or Wage Gap in Lincoln County?
Income or Wage Gap in Lincoln County is 25.8%.
Women in Lincoln County earn 74.2 cents for every dollar earned by a man.
What is Family Income Deficit in Lincoln County?
Family Income Deficit in Lincoln County is $11,811.
Families that are below poverty line in Lincoln County earn $11,811 less on average than the poverty threshold level.
What is Inequality or Gini Index in Lincoln County?
Inequality or Gini Index in Lincoln County is 0.44.
What is the Total Population of Lincoln County?
Total Population of Lincoln County is 11,036.
What is the Total Male Population of Lincoln County?
Total Male Population of Lincoln County is 5,587.
What is the Total Female Population of Lincoln County?
Total Female Population of Lincoln County is 5,449.
What is the Ratio of Males per 100 Females in Lincoln County?
There are 102.53 Males per 100 Females in Lincoln County.
What is the Ratio of Females per 100 Males in Lincoln County?
There are 97.53 Females per 100 Males in Lincoln County.
What is the Median Population Age in Lincoln County?
Median Population Age in Lincoln County is 46.7 Years.
What is the Average Family Size in Lincoln County
Average Family Size in Lincoln County is 3.0 People.
What is the Average Household Size in Lincoln County
Average Household Size in Lincoln County is 2.4 People.
How Large is the Labor Force in Lincoln County?
There are 4,825 People in the Labor Forcein in Lincoln County.
What is the Percentage of People in the Labor Force in Lincoln County?
53.8% of People are in the Labor Force in Lincoln County.
What is the Unemployment Rate in Lincoln County?
Unemployment Rate in Lincoln County is 5.3%.