King County, WA Map & Demographics
King County Map
King County Overview
$66,811
PER CAPITA INCOME
$146,231
AVG FAMILY INCOME
$116,340
AVG HOUSEHOLD INCOME
32.1%
WAGE / INCOME GAP [ % ]
67.9¢/ $1
WAGE / INCOME GAP [ $ ]
$11,159
FAMILY INCOME DEFICIT
0.48
INEQUALITY / GINI INDEX
2,254,371
TOTAL POPULATION
1,143,593
MALE POPULATION
1,110,778
FEMALE POPULATION
102.95
MALES / 100 FEMALES
97.13
FEMALES / 100 MALES
37.2
MEDIAN AGE
3.1
AVG FAMILY SIZE
2.4
AVG HOUSEHOLD SIZE
1,299,748
LABOR FORCE [ PEOPLE ]
70.0%
PERCENT IN LABOR FORCE
4.5%
UNEMPLOYMENT RATE
Income in King County
Income Overview in King County
Per Capita Income in King County is $66,811, while median incomes of families and households are $146,231 and $116,340 respectively.
| Characteristic | Number | Measure |
| Per Capita Income | 2,254,371 | $66,811 |
| Median Family Income | 537,292 | $146,231 |
| Mean Family Income | 537,292 | $195,164 |
| Median Household Income | 916,270 | $116,340 |
| Mean Household Income | 916,270 | $161,206 |
| Income Deficit | 537,292 | $11,159 |
| Wage / Income Gap (%) | 2,254,371 | 32.08% |
| Wage / Income Gap ($) | 2,254,371 | 67.92¢ per $1 |
| Gini / Inequality Index | 2,254,371 | 0.48 |
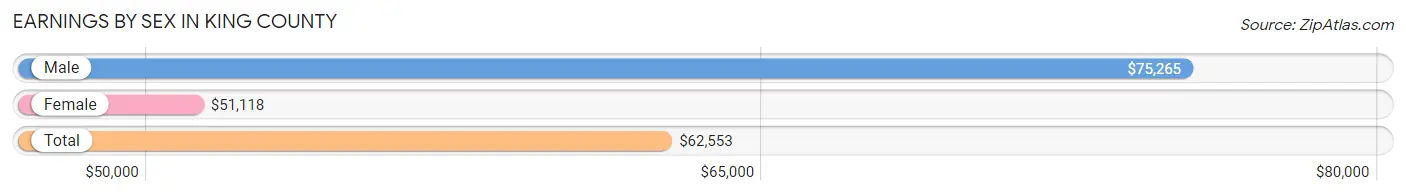
Earnings by Sex in King County
Average Earnings in King County are $62,553, $75,265 for men and $51,118 for women, a difference of 32.1%.
| Sex | Number | Average Earnings |
| Male | 740,391 (54.5%) | $75,265 |
| Female | 618,451 (45.5%) | $51,118 |
| Total | 1,358,842 (100.0%) | $62,553 |
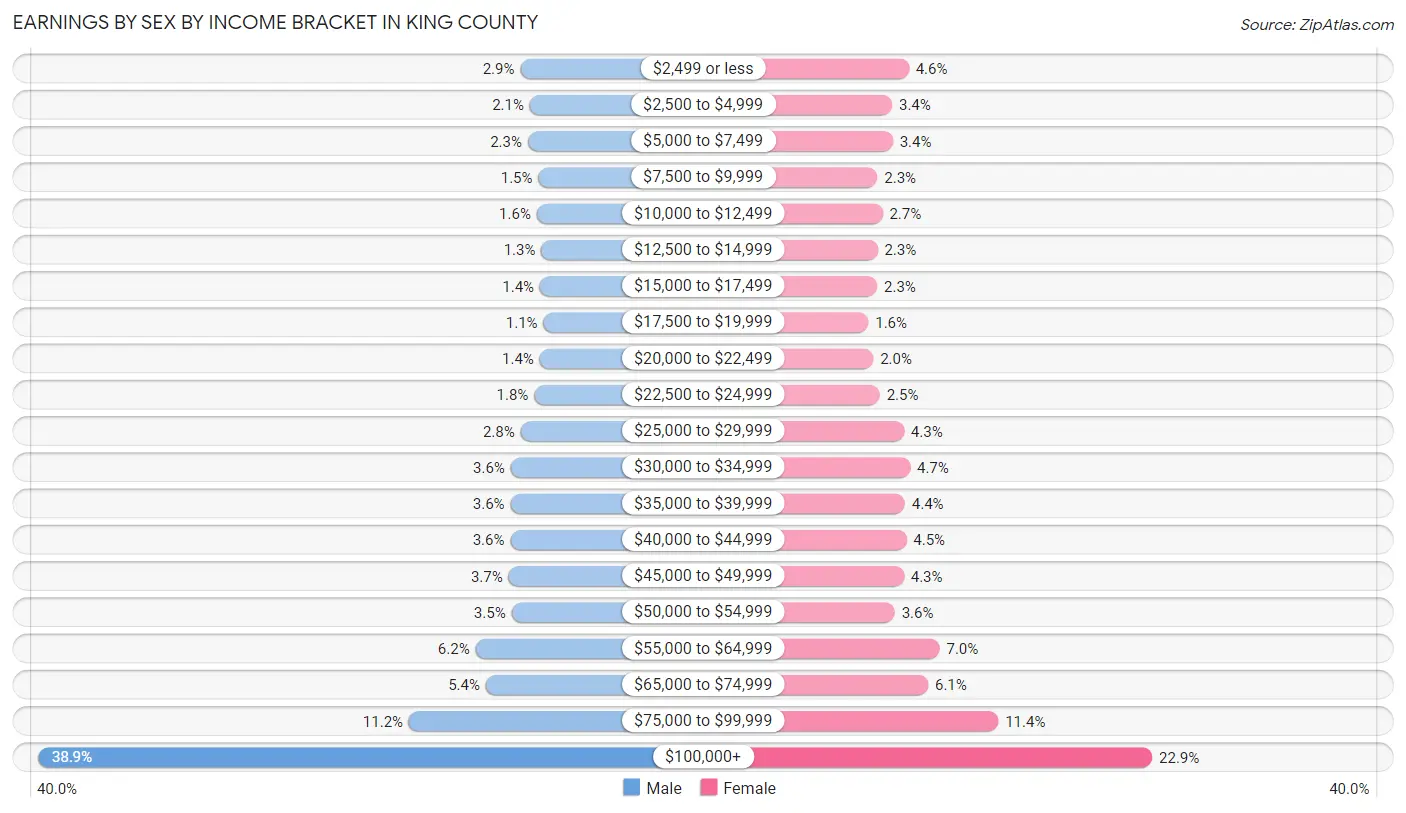
Earnings by Sex by Income Bracket in King County
The most common earnings brackets in King County are $100,000+ for men (288,205 | 38.9%) and $100,000+ for women (141,517 | 22.9%).
| Income | Male | Female |
| $2,499 or less | 21,092 (2.9%) | 28,691 (4.6%) |
| $2,500 to $4,999 | 15,821 (2.1%) | 20,949 (3.4%) |
| $5,000 to $7,499 | 16,946 (2.3%) | 21,276 (3.4%) |
| $7,500 to $9,999 | 11,108 (1.5%) | 14,146 (2.3%) |
| $10,000 to $12,499 | 11,983 (1.6%) | 16,501 (2.7%) |
| $12,500 to $14,999 | 9,512 (1.3%) | 14,197 (2.3%) |
| $15,000 to $17,499 | 10,252 (1.4%) | 14,021 (2.3%) |
| $17,500 to $19,999 | 8,301 (1.1%) | 9,978 (1.6%) |
| $20,000 to $22,499 | 10,386 (1.4%) | 12,221 (2.0%) |
| $22,500 to $24,999 | 13,392 (1.8%) | 15,273 (2.5%) |
| $25,000 to $29,999 | 20,959 (2.8%) | 26,490 (4.3%) |
| $30,000 to $34,999 | 26,437 (3.6%) | 29,288 (4.7%) |
| $35,000 to $39,999 | 26,568 (3.6%) | 26,888 (4.3%) |
| $40,000 to $44,999 | 26,629 (3.6%) | 27,609 (4.5%) |
| $45,000 to $49,999 | 27,646 (3.7%) | 26,382 (4.3%) |
| $50,000 to $54,999 | 25,991 (3.5%) | 22,184 (3.6%) |
| $55,000 to $64,999 | 45,984 (6.2%) | 42,975 (7.0%) |
| $65,000 to $74,999 | 40,264 (5.4%) | 37,647 (6.1%) |
| $75,000 to $99,999 | 82,915 (11.2%) | 70,218 (11.4%) |
| $100,000+ | 288,205 (38.9%) | 141,517 (22.9%) |
| Total | 740,391 (100.0%) | 618,451 (100.0%) |
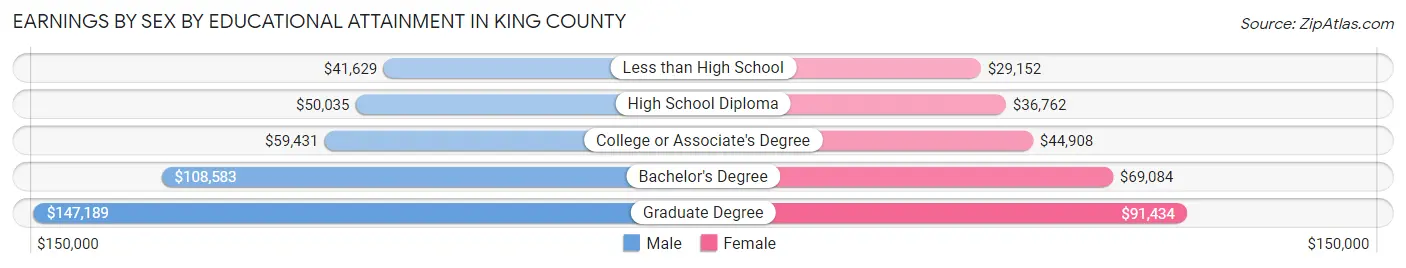
Earnings by Sex by Educational Attainment in King County
Average earnings in King County are $84,592 for men and $58,452 for women, a difference of 30.9%. Men with an educational attainment of graduate degree enjoy the highest average annual earnings of $147,189, while those with less than high school education earn the least with $41,629. Women with an educational attainment of graduate degree earn the most with the average annual earnings of $91,434, while those with less than high school education have the smallest earnings of $29,152.
| Educational Attainment | Male Income | Female Income |
| Less than High School | $41,629 | $29,152 |
| High School Diploma | $50,035 | $36,762 |
| College or Associate's Degree | $59,431 | $44,908 |
| Bachelor's Degree | $108,583 | $69,084 |
| Graduate Degree | $147,189 | $91,434 |
| Total | $84,592 | $58,452 |
Family Income in King County
Family Income Brackets in King County
According to the King County family income data, there are 182,679 families falling into the $200,000+ income range, which is the most common income bracket and makes up 34.0% of all families. Conversely, the $10,000 to $14,999 income bracket is the least frequent group with only 5,373 families (1.0%) belonging to this category.
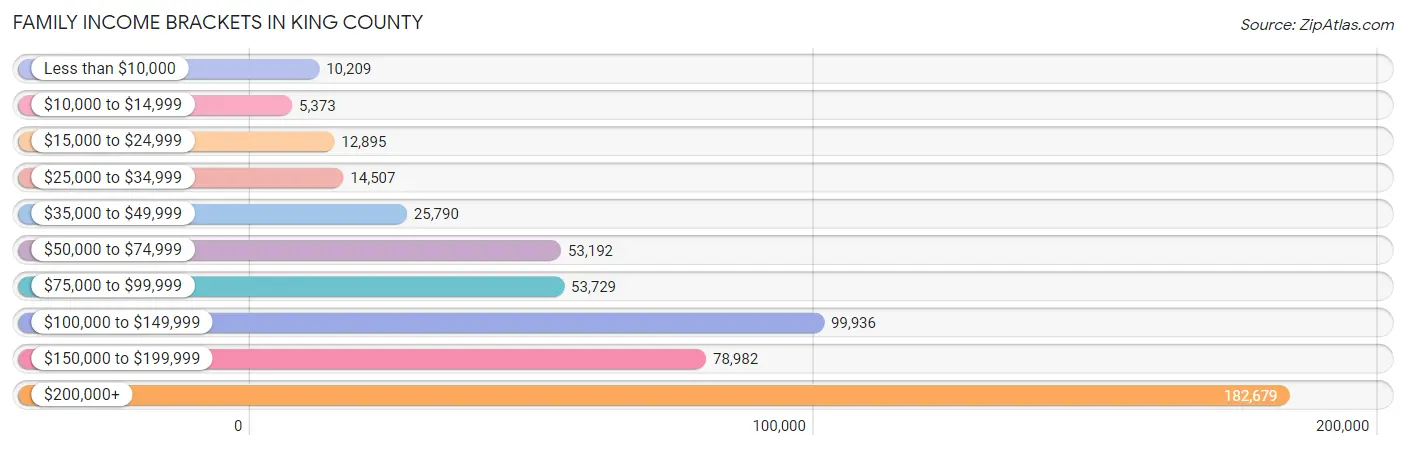
| Income Bracket | # Families | % Families |
| Less than $10,000 | 10,209 | 1.9% |
| $10,000 to $14,999 | 5,373 | 1.0% |
| $15,000 to $24,999 | 12,895 | 2.4% |
| $25,000 to $34,999 | 14,507 | 2.7% |
| $35,000 to $49,999 | 25,790 | 4.8% |
| $50,000 to $74,999 | 53,192 | 9.9% |
| $75,000 to $99,999 | 53,729 | 10.0% |
| $100,000 to $149,999 | 99,936 | 18.6% |
| $150,000 to $199,999 | 78,982 | 14.7% |
| $200,000+ | 182,679 | 34.0% |
Family Income by Famaliy Size in King County
4-person families (110,784 | 20.6%) account for the highest median family income in King County with $182,935 per family, while 2-person families (247,619 | 46.1%) have the highest median income of $63,296 per family member.
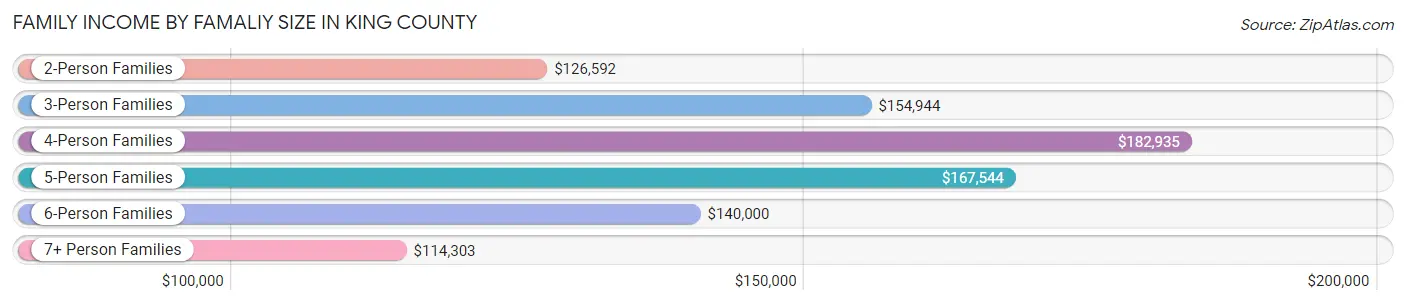
| Income Bracket | # Families | Median Income |
| 2-Person Families | 247,619 (46.1%) | $126,592 |
| 3-Person Families | 122,708 (22.8%) | $154,944 |
| 4-Person Families | 110,784 (20.6%) | $182,935 |
| 5-Person Families | 36,024 (6.7%) | $167,544 |
| 6-Person Families | 11,944 (2.2%) | $140,000 |
| 7+ Person Families | 8,213 (1.5%) | $114,303 |
| Total | 537,292 (100.0%) | $146,231 |
Family Income by Number of Earners in King County
The median family income in King County is $146,231, with families comprising 3+ earners (58,665) having the highest median family income of $181,628, while families with no earners (54,728) have the lowest median family income of $69,608, accounting for 10.9% and 10.2% of families, respectively.
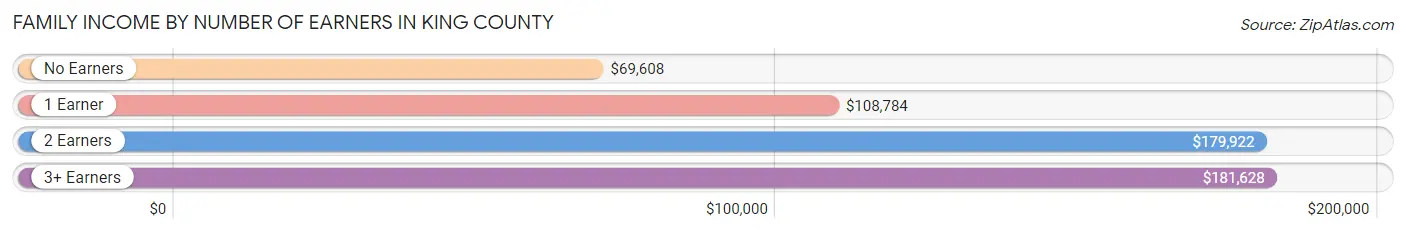
| Number of Earners | # Families | Median Income |
| No Earners | 54,728 (10.2%) | $69,608 |
| 1 Earner | 160,551 (29.9%) | $108,784 |
| 2 Earners | 263,348 (49.0%) | $179,922 |
| 3+ Earners | 58,665 (10.9%) | $181,628 |
| Total | 537,292 (100.0%) | $146,231 |
Household Income in King County
Household Income Brackets in King County
With 236,398 households falling in the category, the $200,000+ income range is the most frequent in King County, accounting for 25.8% of all households. In contrast, only 21,990 households (2.4%) fall into the $10,000 to $14,999 income bracket, making it the least populous group.
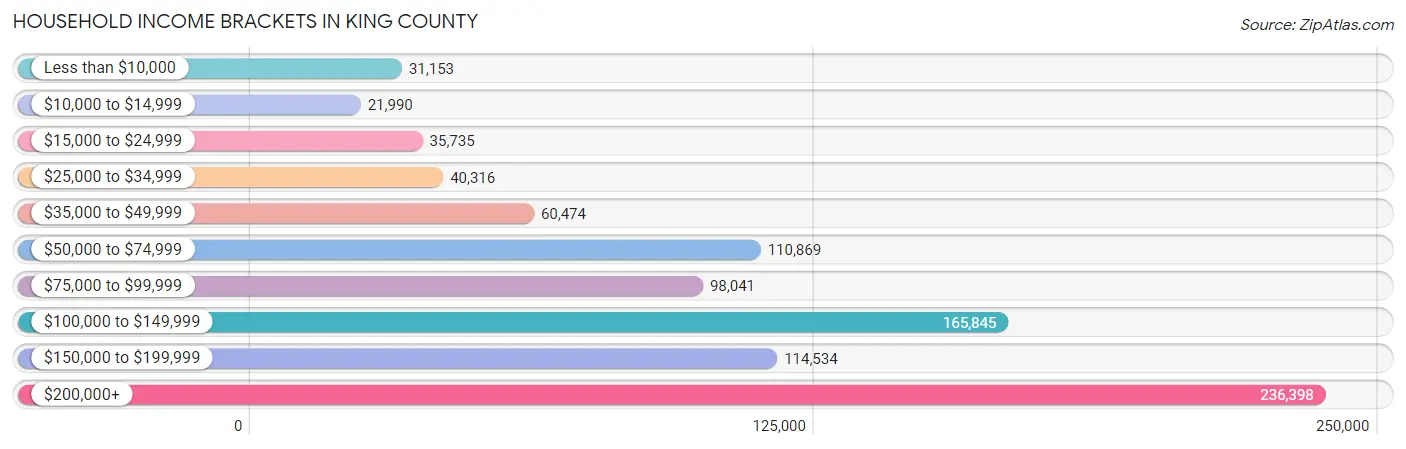
| Income Bracket | # Households | % Households |
| Less than $10,000 | 31,153 | 3.4% |
| $10,000 to $14,999 | 21,990 | 2.4% |
| $15,000 to $24,999 | 35,735 | 3.9% |
| $25,000 to $34,999 | 40,316 | 4.4% |
| $35,000 to $49,999 | 60,474 | 6.6% |
| $50,000 to $74,999 | 110,869 | 12.1% |
| $75,000 to $99,999 | 98,041 | 10.7% |
| $100,000 to $149,999 | 165,845 | 18.1% |
| $150,000 to $199,999 | 114,534 | 12.5% |
| $200,000+ | 236,398 | 25.8% |
Household Income by Householder Age in King County
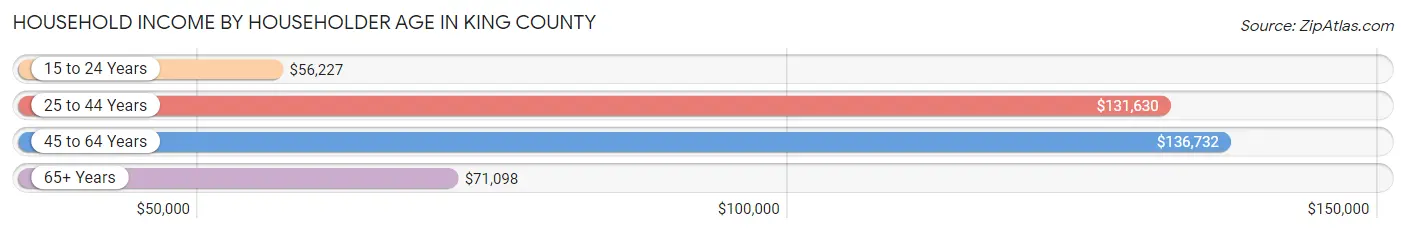
The median household income in King County is $116,340, with the highest median household income of $136,732 found in the 45 to 64 years age bracket for the primary householder. A total of 311,627 households (34.0%) fall into this category. Meanwhile, the 15 to 24 years age bracket for the primary householder has the lowest median household income of $56,227, with 37,409 households (4.1%) in this group.
| Income Bracket | # Households | Median Income |
| 15 to 24 Years | 37,409 (4.1%) | $56,227 |
| 25 to 44 Years | 384,911 (42.0%) | $131,630 |
| 45 to 64 Years | 311,627 (34.0%) | $136,732 |
| 65+ Years | 182,323 (19.9%) | $71,098 |
| Total | 916,270 (100.0%) | $116,340 |
Poverty in King County
Income Below Poverty by Sex and Age in King County
With 7.6% poverty level for males and 9.3% for females among the residents of King County, 18 to 24 year old males and 18 to 24 year old females are the most vulnerable to poverty, with 13,580 males (15.4%) and 16,947 females (20.2%) in their respective age groups living below the poverty level.
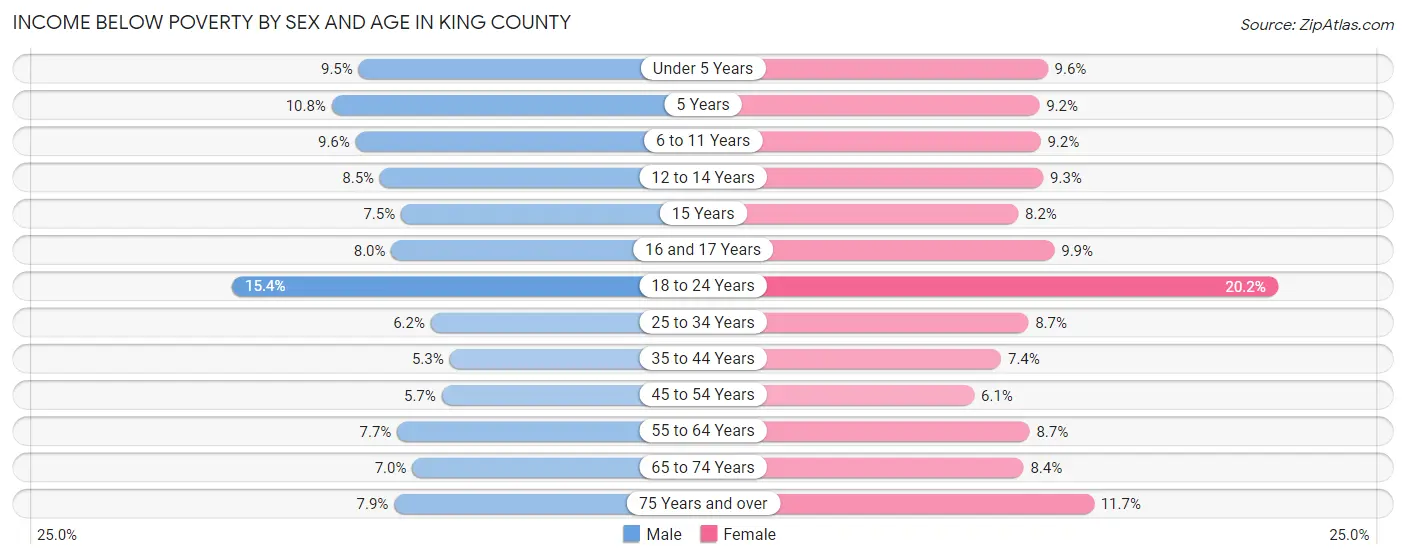
| Age Bracket | Male | Female |
| Under 5 Years | 5,848 (9.5%) | 5,573 (9.6%) |
| 5 Years | 1,291 (10.7%) | 1,112 (9.2%) |
| 6 to 11 Years | 7,416 (9.6%) | 6,546 (9.2%) |
| 12 to 14 Years | 3,183 (8.5%) | 3,524 (9.3%) |
| 15 Years | 996 (7.5%) | 977 (8.2%) |
| 16 and 17 Years | 1,900 (8.0%) | 2,324 (9.9%) |
| 18 to 24 Years | 13,580 (15.4%) | 16,947 (20.2%) |
| 25 to 34 Years | 13,176 (6.1%) | 16,731 (8.6%) |
| 35 to 44 Years | 9,663 (5.3%) | 12,389 (7.4%) |
| 45 to 54 Years | 8,566 (5.7%) | 8,724 (6.1%) |
| 55 to 64 Years | 10,162 (7.7%) | 11,219 (8.7%) |
| 65 to 74 Years | 6,045 (7.0%) | 8,068 (8.4%) |
| 75 Years and over | 3,808 (7.9%) | 8,026 (11.7%) |
| Total | 85,634 (7.6%) | 102,160 (9.3%) |
Income Above Poverty by Sex and Age in King County
According to the poverty statistics in King County, males aged 35 to 44 years and females aged 45 to 54 years are the age groups that are most secure financially, with 94.7% of males and 93.9% of females in these age groups living above the poverty line.
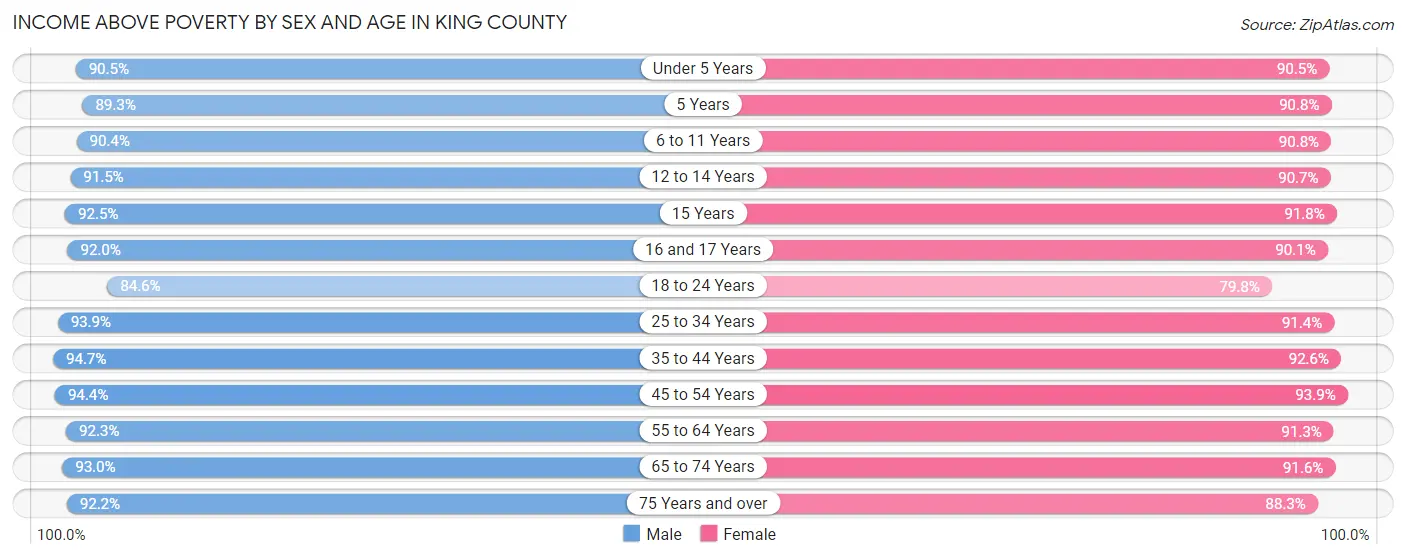
| Age Bracket | Male | Female |
| Under 5 Years | 55,726 (90.5%) | 52,795 (90.4%) |
| 5 Years | 10,721 (89.2%) | 11,027 (90.8%) |
| 6 to 11 Years | 69,553 (90.4%) | 64,458 (90.8%) |
| 12 to 14 Years | 34,209 (91.5%) | 34,213 (90.7%) |
| 15 Years | 12,236 (92.5%) | 10,972 (91.8%) |
| 16 and 17 Years | 21,915 (92.0%) | 21,254 (90.1%) |
| 18 to 24 Years | 74,768 (84.6%) | 66,876 (79.8%) |
| 25 to 34 Years | 201,113 (93.9%) | 176,738 (91.3%) |
| 35 to 44 Years | 173,207 (94.7%) | 155,240 (92.6%) |
| 45 to 54 Years | 143,021 (94.4%) | 133,342 (93.9%) |
| 55 to 64 Years | 121,603 (92.3%) | 117,560 (91.3%) |
| 65 to 74 Years | 80,220 (93.0%) | 87,666 (91.6%) |
| 75 Years and over | 44,725 (92.1%) | 60,651 (88.3%) |
| Total | 1,043,017 (92.4%) | 992,792 (90.7%) |
Income Below Poverty Among Married-Couple Families in King County
The poverty statistics for married-couple families in King County show that 2.8% or 11,834 of the total 429,956 families live below the poverty line. Families with 5 or more children have the highest poverty rate of 24.5%, comprising of 656 families. On the other hand, families with no children have the lowest poverty rate of 2.3%, which includes 5,396 families.
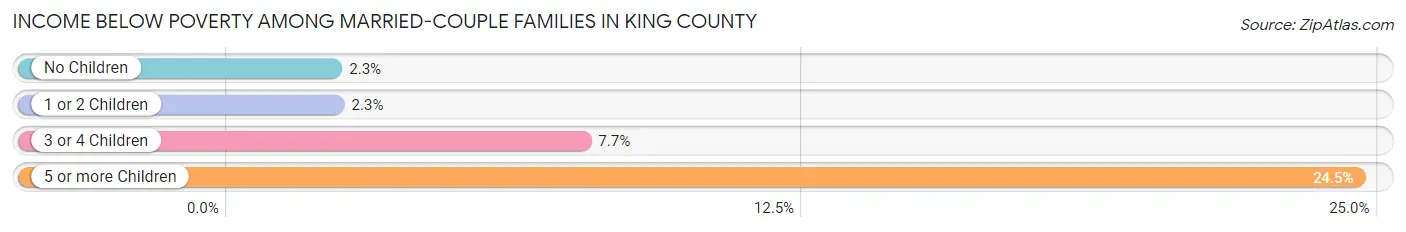
| Children | Above Poverty | Below Poverty |
| No Children | 232,258 (97.7%) | 5,396 (2.3%) |
| 1 or 2 Children | 160,067 (97.7%) | 3,802 (2.3%) |
| 3 or 4 Children | 23,779 (92.3%) | 1,980 (7.7%) |
| 5 or more Children | 2,018 (75.5%) | 656 (24.5%) |
| Total | 418,122 (97.3%) | 11,834 (2.8%) |
Income Below Poverty Among Single-Parent Households in King County
According to the poverty data in King County, 8.0% or 2,861 single-father households and 18.1% or 12,938 single-mother households are living below the poverty line. Among single-father households, those with 5 or more children have the highest poverty rate, with 85 households (50.6%) experiencing poverty. Likewise, among single-mother households, those with 5 or more children have the highest poverty rate, with 383 households (68.5%) falling below the poverty line.
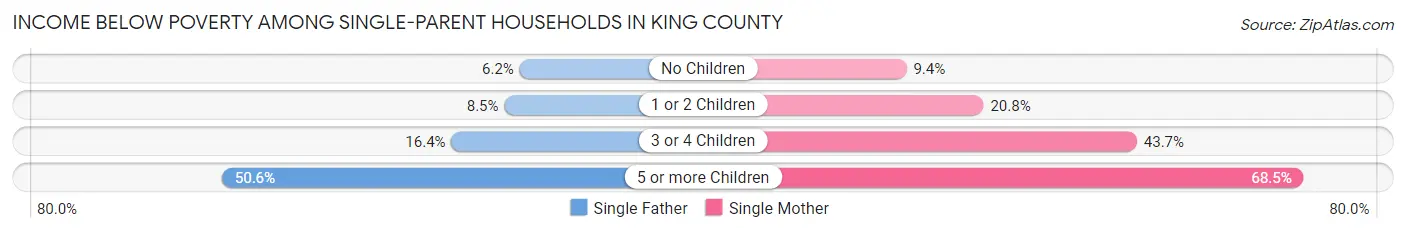
| Children | Single Father | Single Mother |
| No Children | 1,112 (6.2%) | 2,773 (9.4%) |
| 1 or 2 Children | 1,344 (8.5%) | 7,564 (20.8%) |
| 3 or 4 Children | 320 (16.4%) | 2,218 (43.7%) |
| 5 or more Children | 85 (50.6%) | 383 (68.5%) |
| Total | 2,861 (8.0%) | 12,938 (18.1%) |
Income Below Poverty Among Married-Couple vs Single-Parent Households in King County
The poverty data for King County shows that 11,834 of the married-couple family households (2.8%) and 15,799 of the single-parent households (14.7%) are living below the poverty level. Within the married-couple family households, those with 5 or more children have the highest poverty rate, with 656 households (24.5%) falling below the poverty line. Among the single-parent households, those with 5 or more children have the highest poverty rate, with 468 household (64.4%) living below poverty.
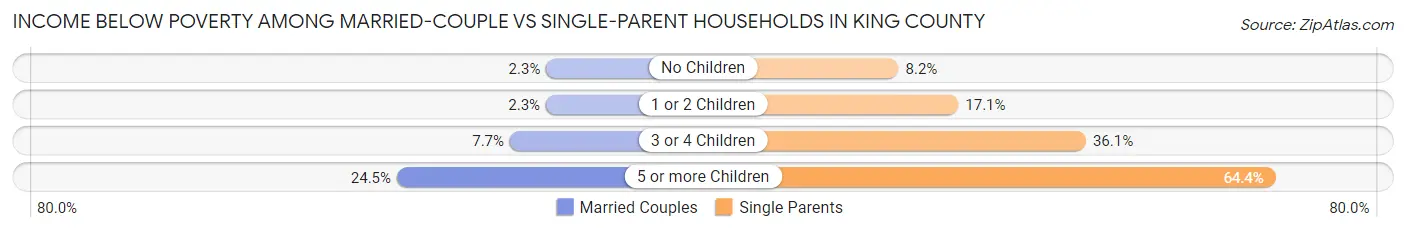
| Children | Married-Couple Families | Single-Parent Households |
| No Children | 5,396 (2.3%) | 3,885 (8.2%) |
| 1 or 2 Children | 3,802 (2.3%) | 8,908 (17.1%) |
| 3 or 4 Children | 1,980 (7.7%) | 2,538 (36.1%) |
| 5 or more Children | 656 (24.5%) | 468 (64.4%) |
| Total | 11,834 (2.8%) | 15,799 (14.7%) |
Race in King County
The most populous races in King County are White / Caucasian (1,325,673 | 58.8%), Asian (437,540 | 19.4%), and Hispanic or Latino (228,873 | 10.2%).
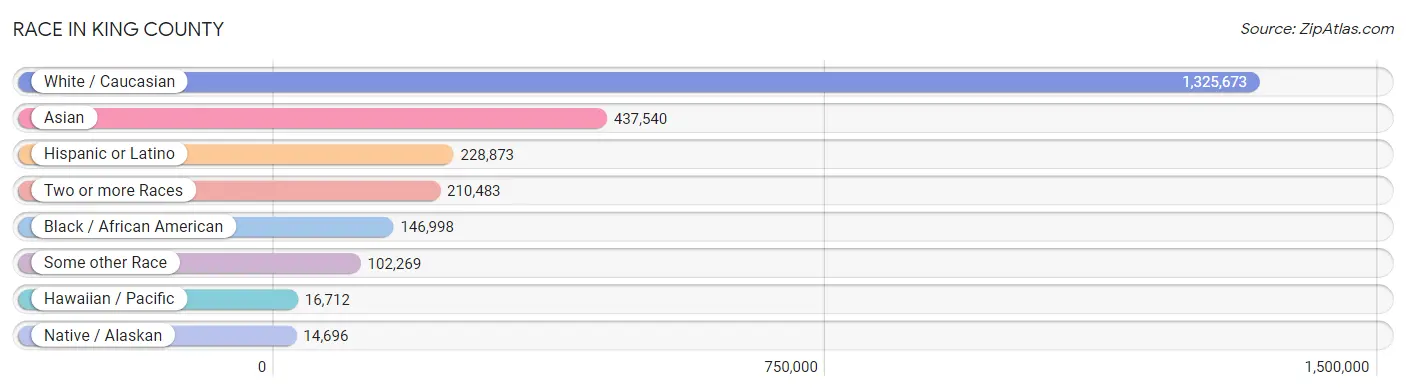
| Race | # Population | % Population |
| Asian | 437,540 | 19.4% |
| Black / African American | 146,998 | 6.5% |
| Hawaiian / Pacific | 16,712 | 0.7% |
| Hispanic or Latino | 228,873 | 10.2% |
| Native / Alaskan | 14,696 | 0.6% |
| White / Caucasian | 1,325,673 | 58.8% |
| Two or more Races | 210,483 | 9.3% |
| Some other Race | 102,269 | 4.5% |
| Total | 2,254,371 | 100.0% |
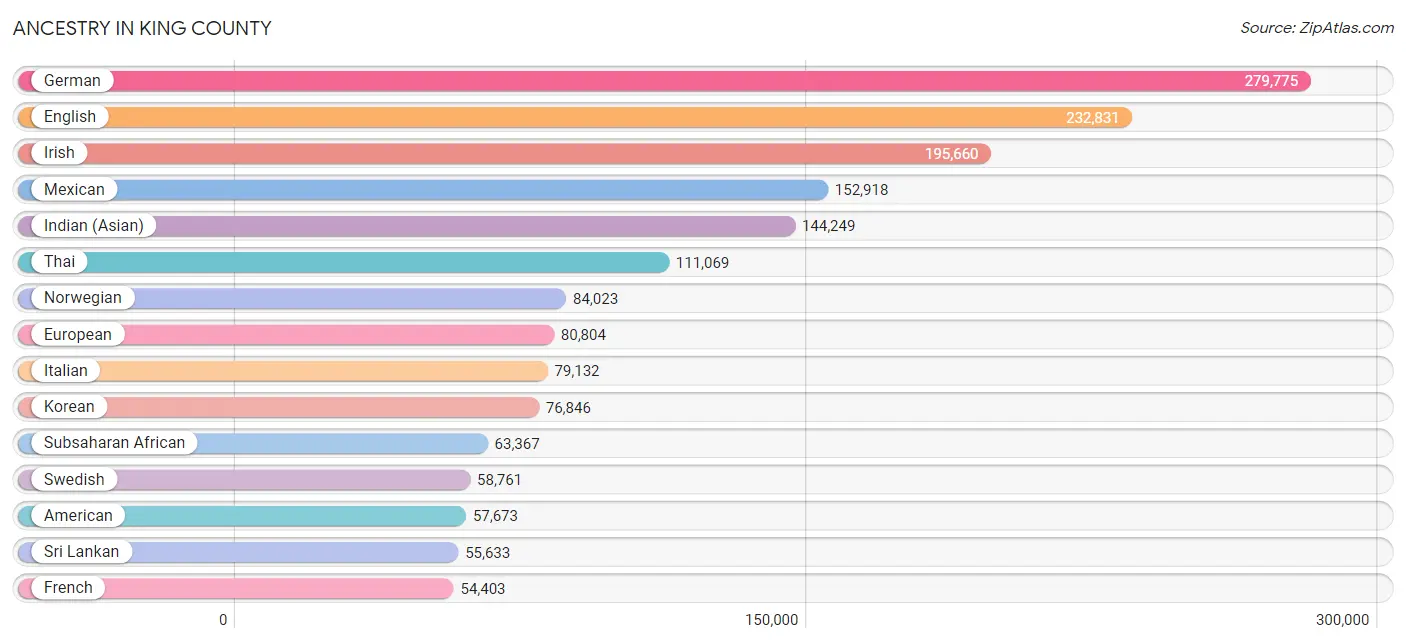
Ancestry in King County
The most populous ancestries reported in King County are German (279,775 | 12.4%), English (232,831 | 10.3%), Irish (195,660 | 8.7%), Mexican (152,918 | 6.8%), and Indian (Asian) (144,249 | 6.4%), together accounting for 44.6% of all King County residents.
| Ancestry | # Population | % Population |
| Afghan | 4,793 | 0.2% |
| African | 14,671 | 0.6% |
| Alaska Native | 502 | 0.0% |
| Alaskan Athabascan | 336 | 0.0% |
| Albanian | 589 | 0.0% |
| Aleut | 538 | 0.0% |
| Alsatian | 139 | 0.0% |
| American | 57,673 | 2.6% |
| Apache | 720 | 0.0% |
| Arab | 18,589 | 0.8% |
| Arapaho | 89 | 0.0% |
| Argentinean | 1,916 | 0.1% |
| Armenian | 3,357 | 0.2% |
| Assyrian / Chaldean / Syriac | 314 | 0.0% |
| Australian | 1,866 | 0.1% |
| Austrian | 6,212 | 0.3% |
| Bahamian | 99 | 0.0% |
| Bangladeshi | 2,263 | 0.1% |
| Barbadian | 190 | 0.0% |
| Basque | 884 | 0.0% |
| Belgian | 2,389 | 0.1% |
| Belizean | 211 | 0.0% |
| Bermudan | 37 | 0.0% |
| Bhutanese | 43,405 | 1.9% |
| Blackfeet | 2,890 | 0.1% |
| Bolivian | 710 | 0.0% |
| Brazilian | 5,380 | 0.2% |
| British | 23,182 | 1.0% |
| British West Indian | 180 | 0.0% |
| Bulgarian | 2,439 | 0.1% |
| Burmese | 45,666 | 2.0% |
| Cajun | 437 | 0.0% |
| Cambodian | 1,309 | 0.1% |
| Canadian | 9,236 | 0.4% |
| Cape Verdean | 47 | 0.0% |
| Carpatho Rusyn | 42 | 0.0% |
| Celtic | 585 | 0.0% |
| Central American | 26,024 | 1.1% |
| Central American Indian | 2,136 | 0.1% |
| Cherokee | 6,826 | 0.3% |
| Cheyenne | 57 | 0.0% |
| Chickasaw | 340 | 0.0% |
| Chilean | 1,970 | 0.1% |
| Chinese | 304 | 0.0% |
| Chippewa | 1,724 | 0.1% |
| Choctaw | 1,736 | 0.1% |
| Colombian | 4,458 | 0.2% |
| Colville | 563 | 0.0% |
| Comanche | 224 | 0.0% |
| Costa Rican | 1,008 | 0.0% |
| Cree | 381 | 0.0% |
| Creek | 533 | 0.0% |
| Croatian | 5,179 | 0.2% |
| Crow | 120 | 0.0% |
| Cuban | 3,552 | 0.2% |
| Cypriot | 40 | 0.0% |
| Czech | 9,592 | 0.4% |
| Czechoslovakian | 1,958 | 0.1% |
| Danish | 17,567 | 0.8% |
| Delaware | 183 | 0.0% |
| Dominican | 1,041 | 0.1% |
| Dutch | 26,708 | 1.2% |
| Dutch West Indian | 16 | 0.0% |
| Eastern European | 9,830 | 0.4% |
| Ecuadorian | 1,372 | 0.1% |
| Egyptian | 2,526 | 0.1% |
| English | 232,831 | 10.3% |
| Estonian | 546 | 0.0% |
| Ethiopian | 18,063 | 0.8% |
| European | 80,804 | 3.6% |
| Fijian | 1,824 | 0.1% |
| Filipino | 11,321 | 0.5% |
| Finnish | 10,325 | 0.5% |
| French | 54,403 | 2.4% |
| French American Indian | 703 | 0.0% |
| French Canadian | 10,658 | 0.5% |
| German | 279,775 | 12.4% |
| German Russian | 285 | 0.0% |
| Ghanaian | 876 | 0.0% |
| Greek | 9,496 | 0.4% |
| Guamanian / Chamorro | 3,769 | 0.2% |
| Guatemalan | 7,187 | 0.3% |
| Guyanese | 307 | 0.0% |
| Haitian | 1,314 | 0.1% |
| Honduran | 5,232 | 0.2% |
| Hopi | 99 | 0.0% |
| Hungarian | 7,526 | 0.3% |
| Icelander | 2,145 | 0.1% |
| Indian (Asian) | 144,249 | 6.4% |
| Indonesian | 2,810 | 0.1% |
| Inupiat | 420 | 0.0% |
| Iranian | 10,050 | 0.4% |
| Iraqi | 2,805 | 0.1% |
| Irish | 195,660 | 8.7% |
| Iroquois | 466 | 0.0% |
| Israeli | 1,678 | 0.1% |
| Italian | 79,132 | 3.5% |
| Jamaican | 2,414 | 0.1% |
| Japanese | 11,558 | 0.5% |
| Jordanian | 1,240 | 0.1% |
| Kenyan | 4,270 | 0.2% |
| Kiowa | 47 | 0.0% |
| Korean | 76,846 | 3.4% |
| Laotian | 2,164 | 0.1% |
| Latvian | 1,809 | 0.1% |
| Lebanese | 4,395 | 0.2% |
| Liberian | 718 | 0.0% |
| Lithuanian | 5,127 | 0.2% |
| Lumbee | 22 | 0.0% |
| Luxembourger | 292 | 0.0% |
| Macedonian | 350 | 0.0% |
| Malaysian | 6,142 | 0.3% |
| Maltese | 160 | 0.0% |
| Marshallese | 236 | 0.0% |
| Menominee | 24 | 0.0% |
| Mexican | 152,918 | 6.8% |
| Mexican American Indian | 3,786 | 0.2% |
| Mongolian | 773 | 0.0% |
| Moroccan | 1,678 | 0.1% |
| Native Hawaiian | 7,551 | 0.3% |
| Navajo | 837 | 0.0% |
| Nepalese | 613 | 0.0% |
| New Zealander | 618 | 0.0% |
| Nicaraguan | 1,287 | 0.1% |
| Nigerian | 2,639 | 0.1% |
| Northern European | 13,302 | 0.6% |
| Norwegian | 84,023 | 3.7% |
| Okinawan | 441 | 0.0% |
| Osage | 146 | 0.0% |
| Ottawa | 15 | 0.0% |
| Paiute | 40 | 0.0% |
| Pakistani | 6,226 | 0.3% |
| Palestinian | 987 | 0.0% |
| Panamanian | 1,311 | 0.1% |
| Paraguayan | 162 | 0.0% |
| Pennsylvania German | 641 | 0.0% |
| Peruvian | 4,125 | 0.2% |
| Pima | 19 | 0.0% |
| Polish | 43,938 | 1.9% |
| Portuguese | 8,175 | 0.4% |
| Potawatomi | 224 | 0.0% |
| Pueblo | 311 | 0.0% |
| Puerto Rican | 10,054 | 0.4% |
| Puget Sound Salish | 3,559 | 0.2% |
| Romanian | 8,576 | 0.4% |
| Russian | 31,646 | 1.4% |
| Salvadoran | 9,769 | 0.4% |
| Samoan | 10,175 | 0.4% |
| Scandinavian | 17,190 | 0.8% |
| Scotch-Irish | 21,435 | 0.9% |
| Scottish | 52,691 | 2.3% |
| Seminole | 214 | 0.0% |
| Senegalese | 295 | 0.0% |
| Serbian | 1,714 | 0.1% |
| Shoshone | 207 | 0.0% |
| Sierra Leonean | 82 | 0.0% |
| Sioux | 1,937 | 0.1% |
| Slavic | 1,328 | 0.1% |
| Slovak | 2,708 | 0.1% |
| Slovene | 1,419 | 0.1% |
| Somali | 15,292 | 0.7% |
| South African | 1,072 | 0.1% |
| South American | 16,947 | 0.7% |
| South American Indian | 436 | 0.0% |
| Spaniard | 7,135 | 0.3% |
| Spanish | 5,252 | 0.2% |
| Spanish American | 157 | 0.0% |
| Spanish American Indian | 14 | 0.0% |
| Sri Lankan | 55,633 | 2.5% |
| Subsaharan African | 63,367 | 2.8% |
| Sudanese | 944 | 0.0% |
| Swedish | 58,761 | 2.6% |
| Swiss | 9,430 | 0.4% |
| Syrian | 1,036 | 0.1% |
| Taiwanese | 44 | 0.0% |
| Thai | 111,069 | 4.9% |
| Tlingit-Haida | 2,077 | 0.1% |
| Tohono O'Odham | 9 | 0.0% |
| Tongan | 863 | 0.0% |
| Trinidadian and Tobagonian | 633 | 0.0% |
| Tsimshian | 336 | 0.0% |
| Turkish | 5,761 | 0.3% |
| U.S. Virgin Islander | 39 | 0.0% |
| Ugandan | 308 | 0.0% |
| Ukrainian | 22,882 | 1.0% |
| Uruguayan | 244 | 0.0% |
| Ute | 63 | 0.0% |
| Venezuelan | 1,952 | 0.1% |
| Vietnamese | 930 | 0.0% |
| Welsh | 18,491 | 0.8% |
| West Indian | 1,029 | 0.1% |
| Yakama | 844 | 0.0% |
| Yaqui | 248 | 0.0% |
| Yugoslavian | 3,133 | 0.1% |
| Yup'ik | 186 | 0.0% |
| Zimbabwean | 17 | 0.0% | View All 196 Rows |
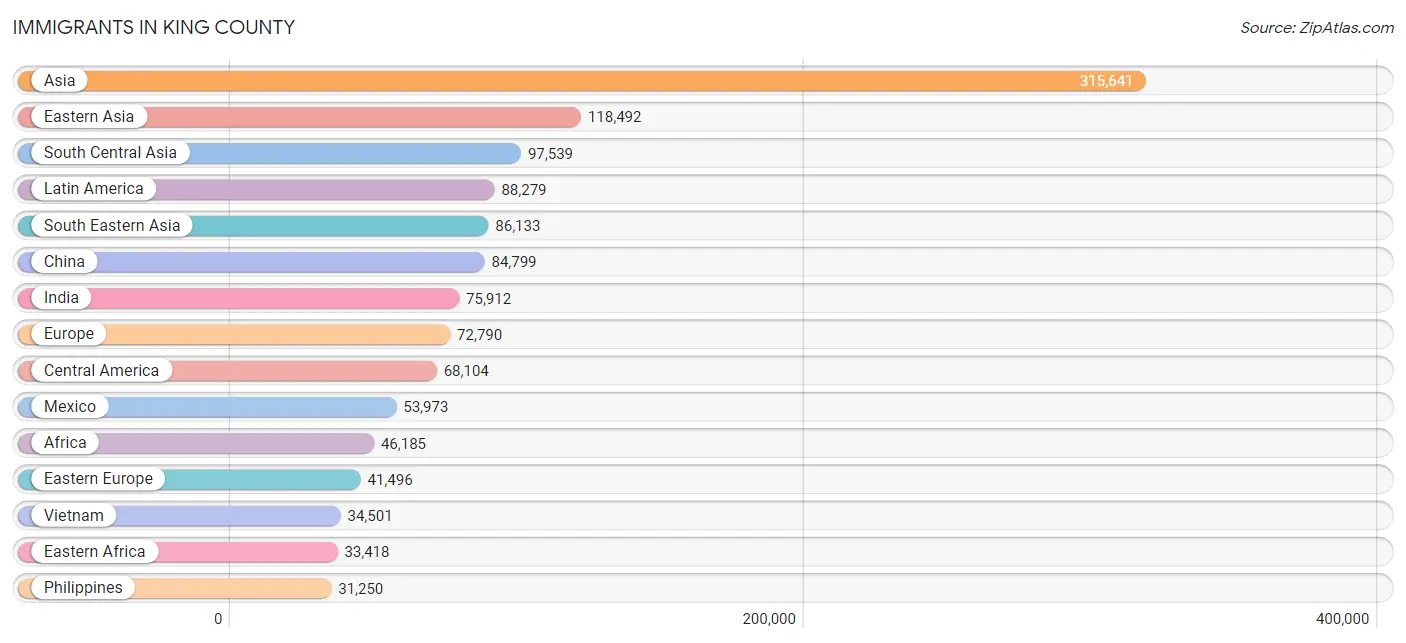
Immigrants in King County
The most numerous immigrant groups reported in King County came from Asia (315,641 | 14.0%), Eastern Asia (118,492 | 5.3%), South Central Asia (97,539 | 4.3%), Latin America (88,279 | 3.9%), and South Eastern Asia (86,133 | 3.8%), together accounting for 31.3% of all King County residents.
| Immigration Origin | # Population | % Population |
| Afghanistan | 4,865 | 0.2% |
| Africa | 46,185 | 2.1% |
| Albania | 137 | 0.0% |
| Argentina | 1,186 | 0.1% |
| Armenia | 541 | 0.0% |
| Asia | 315,641 | 14.0% |
| Australia | 2,680 | 0.1% |
| Austria | 276 | 0.0% |
| Azores | 22 | 0.0% |
| Bahamas | 47 | 0.0% |
| Bangladesh | 908 | 0.0% |
| Barbados | 11 | 0.0% |
| Belarus | 1,518 | 0.1% |
| Belgium | 499 | 0.0% |
| Belize | 143 | 0.0% |
| Bolivia | 338 | 0.0% |
| Bosnia and Herzegovina | 1,928 | 0.1% |
| Brazil | 6,302 | 0.3% |
| Bulgaria | 1,357 | 0.1% |
| Cambodia | 5,063 | 0.2% |
| Cameroon | 116 | 0.0% |
| Canada | 20,092 | 0.9% |
| Caribbean | 4,040 | 0.2% |
| Central America | 68,104 | 3.0% |
| Chile | 1,250 | 0.1% |
| China | 84,799 | 3.8% |
| Colombia | 2,155 | 0.1% |
| Congo | 256 | 0.0% |
| Costa Rica | 483 | 0.0% |
| Croatia | 248 | 0.0% |
| Cuba | 836 | 0.0% |
| Czechoslovakia | 1,068 | 0.1% |
| Denmark | 740 | 0.0% |
| Dominican Republic | 260 | 0.0% |
| Eastern Africa | 33,418 | 1.5% |
| Eastern Asia | 118,492 | 5.3% |
| Eastern Europe | 41,496 | 1.8% |
| Ecuador | 782 | 0.0% |
| Egypt | 1,573 | 0.1% |
| El Salvador | 5,034 | 0.2% |
| England | 3,915 | 0.2% |
| Eritrea | 3,501 | 0.2% |
| Ethiopia | 12,455 | 0.5% |
| Europe | 72,790 | 3.2% |
| Fiji | 861 | 0.0% |
| France | 3,199 | 0.1% |
| Germany | 5,652 | 0.3% |
| Ghana | 812 | 0.0% |
| Greece | 590 | 0.0% |
| Grenada | 25 | 0.0% |
| Guatemala | 4,305 | 0.2% |
| Guyana | 213 | 0.0% |
| Haiti | 1,041 | 0.1% |
| Honduras | 3,277 | 0.2% |
| Hong Kong | 6,951 | 0.3% |
| Hungary | 1,119 | 0.1% |
| India | 75,912 | 3.4% |
| Indonesia | 1,818 | 0.1% |
| Iran | 6,612 | 0.3% |
| Iraq | 3,234 | 0.1% |
| Ireland | 1,647 | 0.1% |
| Israel | 1,987 | 0.1% |
| Italy | 1,514 | 0.1% |
| Jamaica | 937 | 0.0% |
| Japan | 9,992 | 0.4% |
| Jordan | 1,069 | 0.1% |
| Kazakhstan | 819 | 0.0% |
| Kenya | 7,464 | 0.3% |
| Korea | 22,786 | 1.0% |
| Kuwait | 191 | 0.0% |
| Laos | 3,199 | 0.1% |
| Latin America | 88,279 | 3.9% |
| Latvia | 429 | 0.0% |
| Lebanon | 889 | 0.0% |
| Liberia | 644 | 0.0% |
| Lithuania | 366 | 0.0% |
| Malaysia | 2,024 | 0.1% |
| Mexico | 53,973 | 2.4% |
| Micronesia | 1,180 | 0.1% |
| Middle Africa | 1,194 | 0.1% |
| Moldova | 1,744 | 0.1% |
| Morocco | 1,234 | 0.1% |
| Nepal | 1,537 | 0.1% |
| Netherlands | 1,468 | 0.1% |
| Nicaragua | 464 | 0.0% |
| Nigeria | 1,186 | 0.1% |
| North Macedonia | 131 | 0.0% |
| Northern Africa | 3,909 | 0.2% |
| Northern Europe | 15,859 | 0.7% |
| Norway | 567 | 0.0% |
| Oceania | 10,271 | 0.5% |
| Pakistan | 3,625 | 0.2% |
| Panama | 353 | 0.0% |
| Peru | 2,141 | 0.1% |
| Philippines | 31,250 | 1.4% |
| Poland | 2,658 | 0.1% |
| Portugal | 425 | 0.0% |
| Romania | 4,197 | 0.2% |
| Russia | 9,616 | 0.4% |
| Saudi Arabia | 852 | 0.0% |
| Scotland | 719 | 0.0% |
| Senegal | 281 | 0.0% |
| Serbia | 208 | 0.0% |
| Sierra Leone | 123 | 0.0% |
| Singapore | 1,442 | 0.1% |
| Somalia | 7,945 | 0.4% |
| South Africa | 1,982 | 0.1% |
| South America | 16,135 | 0.7% |
| South Central Asia | 97,539 | 4.3% |
| South Eastern Asia | 86,133 | 3.8% |
| Southern Europe | 3,492 | 0.2% |
| Spain | 963 | 0.0% |
| Sri Lanka | 284 | 0.0% |
| Sudan | 557 | 0.0% |
| Sweden | 1,403 | 0.1% |
| Switzerland | 683 | 0.0% |
| Syria | 483 | 0.0% |
| Taiwan | 12,415 | 0.5% |
| Thailand | 4,940 | 0.2% |
| Trinidad and Tobago | 602 | 0.0% |
| Turkey | 2,120 | 0.1% |
| Uganda | 518 | 0.0% |
| Ukraine | 13,157 | 0.6% |
| Uruguay | 127 | 0.0% |
| Uzbekistan | 1,944 | 0.1% |
| Venezuela | 1,386 | 0.1% |
| Vietnam | 34,501 | 1.5% |
| West Indies | 27 | 0.0% |
| Western Africa | 4,891 | 0.2% |
| Western Asia | 12,917 | 0.6% |
| Western Europe | 11,873 | 0.5% |
| Yemen | 206 | 0.0% |
| Zaire | 791 | 0.0% |
| Zimbabwe | 195 | 0.0% | View All 134 Rows |
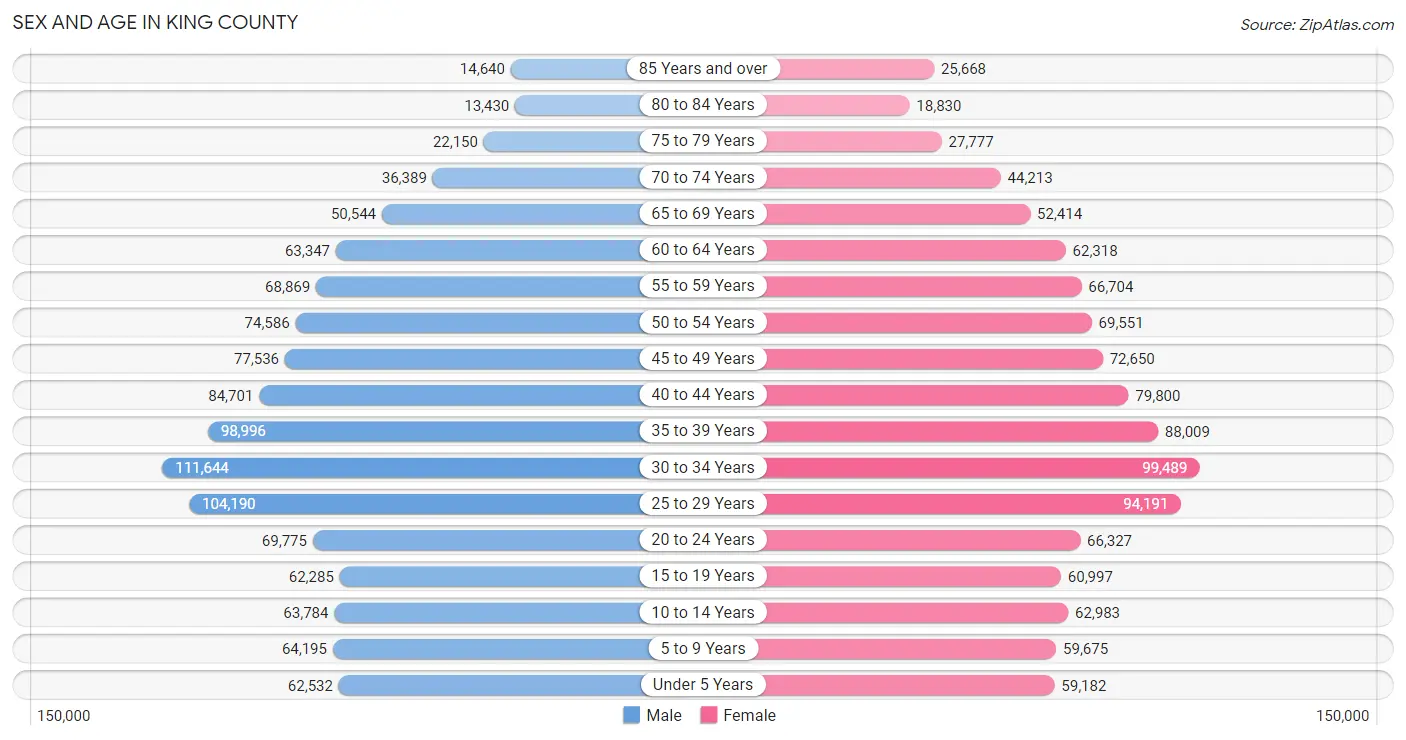
Sex and Age in King County
Sex and Age in King County
The most populous age groups in King County are 30 to 34 Years (111,644 | 9.8%) for men and 30 to 34 Years (99,489 | 9.0%) for women.
| Age Bracket | Male | Female |
| Under 5 Years | 62,532 (5.5%) | 59,182 (5.3%) |
| 5 to 9 Years | 64,195 (5.6%) | 59,675 (5.4%) |
| 10 to 14 Years | 63,784 (5.6%) | 62,983 (5.7%) |
| 15 to 19 Years | 62,285 (5.4%) | 60,997 (5.5%) |
| 20 to 24 Years | 69,775 (6.1%) | 66,327 (6.0%) |
| 25 to 29 Years | 104,190 (9.1%) | 94,191 (8.5%) |
| 30 to 34 Years | 111,644 (9.8%) | 99,489 (9.0%) |
| 35 to 39 Years | 98,996 (8.7%) | 88,009 (7.9%) |
| 40 to 44 Years | 84,701 (7.4%) | 79,800 (7.2%) |
| 45 to 49 Years | 77,536 (6.8%) | 72,650 (6.5%) |
| 50 to 54 Years | 74,586 (6.5%) | 69,551 (6.3%) |
| 55 to 59 Years | 68,869 (6.0%) | 66,704 (6.0%) |
| 60 to 64 Years | 63,347 (5.5%) | 62,318 (5.6%) |
| 65 to 69 Years | 50,544 (4.4%) | 52,414 (4.7%) |
| 70 to 74 Years | 36,389 (3.2%) | 44,213 (4.0%) |
| 75 to 79 Years | 22,150 (1.9%) | 27,777 (2.5%) |
| 80 to 84 Years | 13,430 (1.2%) | 18,830 (1.7%) |
| 85 Years and over | 14,640 (1.3%) | 25,668 (2.3%) |
| Total | 1,143,593 (100.0%) | 1,110,778 (100.0%) |
Families and Households in King County
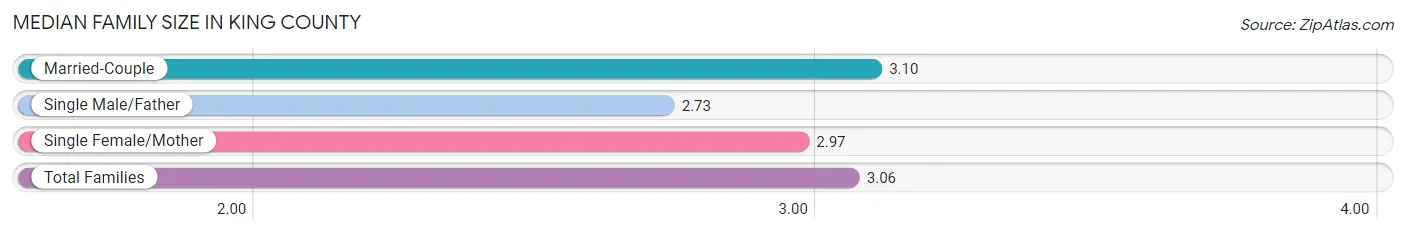
Median Family Size in King County
The median family size in King County is 3.06 persons per family, with married-couple families (429,956 | 80.0%) accounting for the largest median family size of 3.1 persons per family. On the other hand, single male/father families (35,761 | 6.7%) represent the smallest median family size with 2.73 persons per family.
| Family Type | # Families | Family Size |
| Married-Couple | 429,956 (80.0%) | 3.10 |
| Single Male/Father | 35,761 (6.7%) | 2.73 |
| Single Female/Mother | 71,575 (13.3%) | 2.97 |
| Total Families | 537,292 (100.0%) | 3.06 |
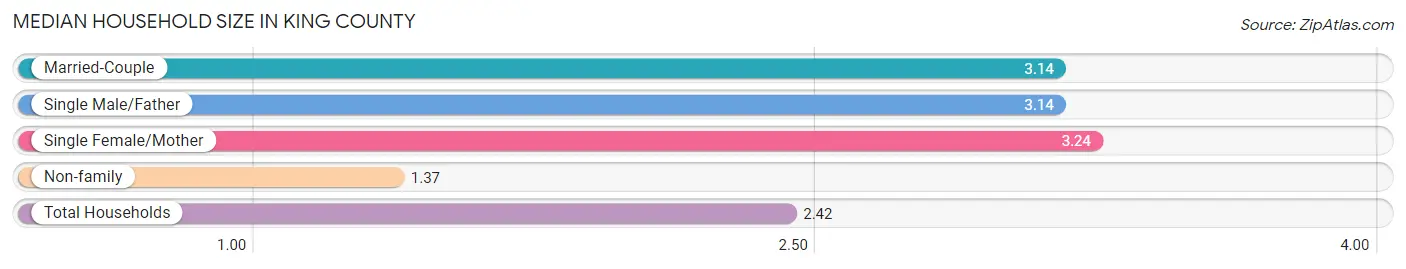
Median Household Size in King County
The median household size in King County is 2.42 persons per household, with single female/mother households (71,575 | 7.8%) accounting for the largest median household size of 3.24 persons per household. non-family households (378,978 | 41.4%) represent the smallest median household size with 1.37 persons per household.
| Household Type | # Households | Household Size |
| Married-Couple | 429,956 (46.9%) | 3.14 |
| Single Male/Father | 35,761 (3.9%) | 3.14 |
| Single Female/Mother | 71,575 (7.8%) | 3.24 |
| Non-family | 378,978 (41.4%) | 1.37 |
| Total Households | 916,270 (100.0%) | 2.42 |
Household Size by Marriage Status in King County
Out of a total of 916,270 households in King County, 537,292 (58.6%) are family households, while 378,978 (41.4%) are nonfamily households. The most numerous type of family households are 2-person households, comprising 229,799, and the most common type of nonfamily households are 1-person households, comprising 279,263.
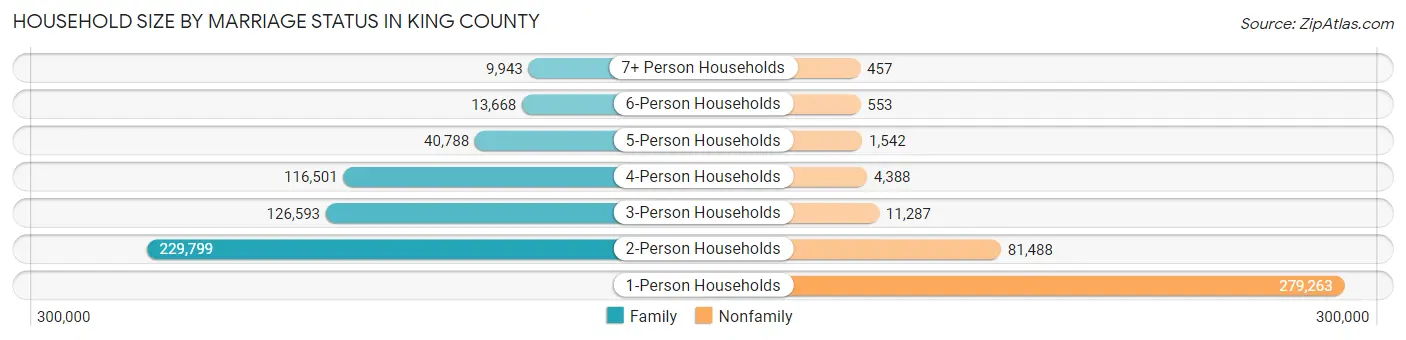
| Household Size | Family Households | Nonfamily Households |
| 1-Person Households | - | 279,263 (30.5%) |
| 2-Person Households | 229,799 (25.1%) | 81,488 (8.9%) |
| 3-Person Households | 126,593 (13.8%) | 11,287 (1.2%) |
| 4-Person Households | 116,501 (12.7%) | 4,388 (0.5%) |
| 5-Person Households | 40,788 (4.4%) | 1,542 (0.2%) |
| 6-Person Households | 13,668 (1.5%) | 553 (0.1%) |
| 7+ Person Households | 9,943 (1.1%) | 457 (0.1%) |
| Total | 537,292 (58.6%) | 378,978 (41.4%) |
Female Fertility in King County
Fertility by Age in King County
Average fertility rate in King County is 45.0 births per 1,000 women. Women in the age bracket of 20 to 34 years have the highest fertility rate with 61.0 births per 1,000 women. Women in the age bracket of 20 to 34 years acount for 60.6% of all women with births.
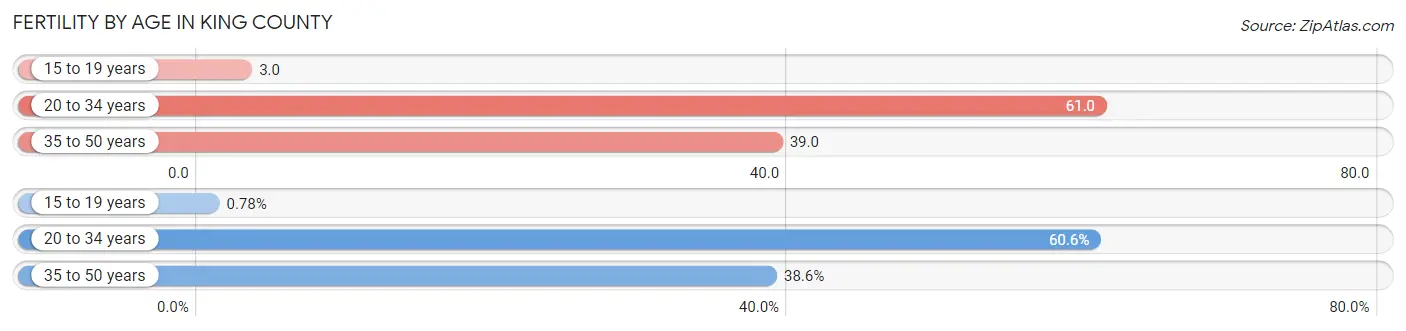
| Age Bracket | Women with Births | Births / 1,000 Women |
| 15 to 19 years | 202 (0.8%) | 3.0 |
| 20 to 34 years | 15,734 (60.6%) | 61.0 |
| 35 to 50 years | 10,028 (38.6%) | 39.0 |
| Total | 25,964 (100.0%) | 45.0 |
Fertility by Age by Marriage Status in King County
82.3% of women with births (25,964) in King County are married. The highest percentage of unmarried women with births falls into 15 to 19 years age bracket with 62.4% of them unmarried at the time of birth, while the lowest percentage of unmarried women with births belong to 35 to 50 years age bracket with 12.5% of them unmarried.
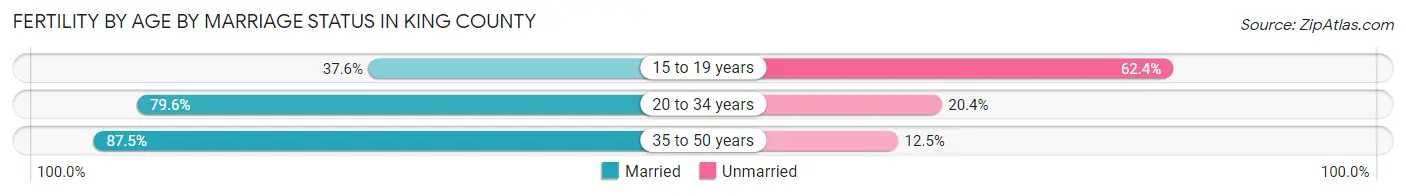
| Age Bracket | Married | Unmarried |
| 15 to 19 years | 76 (37.6%) | 126 (62.4%) |
| 20 to 34 years | 12,524 (79.6%) | 3,210 (20.4%) |
| 35 to 50 years | 8,774 (87.5%) | 1,254 (12.5%) |
| Total | 21,368 (82.3%) | 4,596 (17.7%) |
Fertility by Education in King County
Average fertility rate in King County is 45.0 births per 1,000 women. Women with the education attainment of high school diploma have the highest fertility rate of 57.0 births per 1,000 women, while women with the education attainment of less than high school have the lowest fertility at 30.0 births per 1,000 women. Women with the education attainment of bachelor's degree represent 31.4% of all women with births.
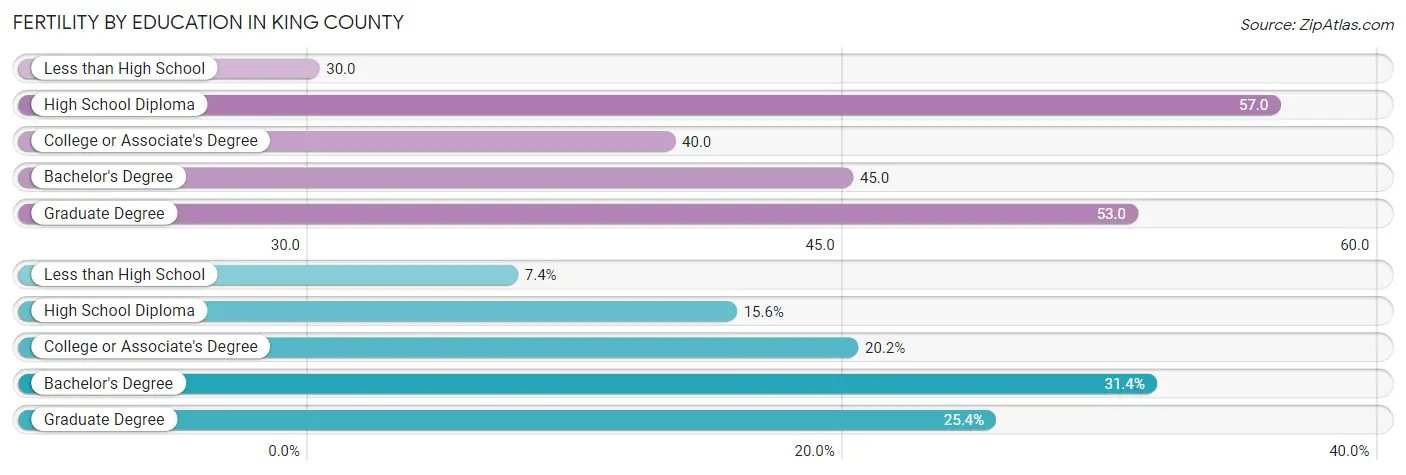
| Educational Attainment | Women with Births | Births / 1,000 Women |
| Less than High School | 1,933 (7.4%) | 30.0 |
| High School Diploma | 4,062 (15.6%) | 57.0 |
| College or Associate's Degree | 5,242 (20.2%) | 40.0 |
| Bachelor's Degree | 8,146 (31.4%) | 45.0 |
| Graduate Degree | 6,581 (25.4%) | 53.0 |
| Total | 25,964 (100.0%) | 45.0 |
Fertility by Education by Marriage Status in King County
17.7% of women with births in King County are unmarried. Women with the educational attainment of graduate degree are most likely to be married with 94.5% of them married at childbirth, while women with the educational attainment of high school diploma are least likely to be married with 40.6% of them unmarried at childbirth.
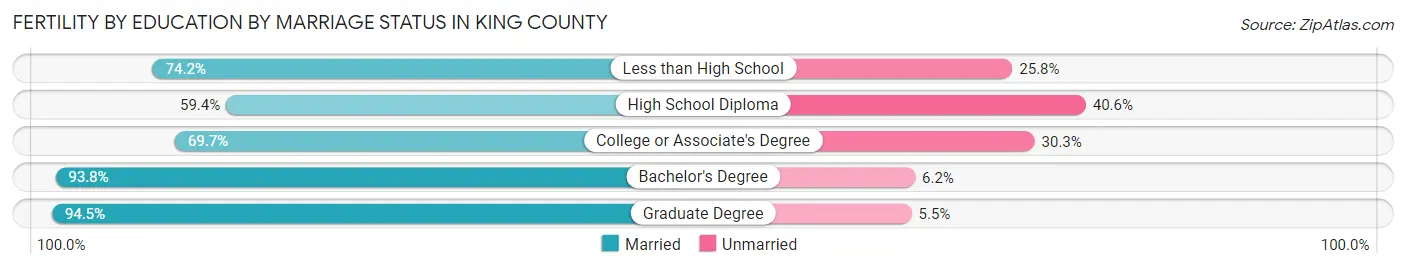
| Educational Attainment | Married | Unmarried |
| Less than High School | 1,434 (74.2%) | 499 (25.8%) |
| High School Diploma | 2,413 (59.4%) | 1,649 (40.6%) |
| College or Associate's Degree | 3,654 (69.7%) | 1,588 (30.3%) |
| Bachelor's Degree | 7,641 (93.8%) | 505 (6.2%) |
| Graduate Degree | 6,219 (94.5%) | 362 (5.5%) |
| Total | 21,368 (82.3%) | 4,596 (17.7%) |
Employment Characteristics in King County
Employment by Class of Employer in King County
Among the 1,212,908 employed individuals in King County, private company employees (849,172 | 70.0%), not-for-profit organizations (108,284 | 8.9%), and local government employees (67,634 | 5.6%) make up the most common classes of employment.
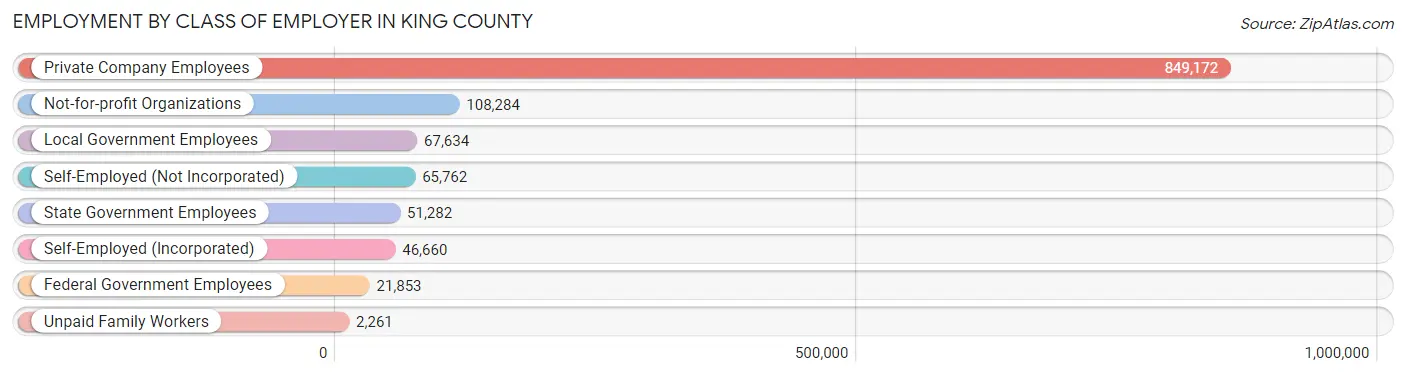
| Employer Class | # Employees | % Employees |
| Private Company Employees | 849,172 | 70.0% |
| Self-Employed (Incorporated) | 46,660 | 3.8% |
| Self-Employed (Not Incorporated) | 65,762 | 5.4% |
| Not-for-profit Organizations | 108,284 | 8.9% |
| Local Government Employees | 67,634 | 5.6% |
| State Government Employees | 51,282 | 4.2% |
| Federal Government Employees | 21,853 | 1.8% |
| Unpaid Family Workers | 2,261 | 0.2% |
| Total | 1,212,908 | 100.0% |
Employment Status by Age in King County
According to the labor force statistics for King County, out of the total population over 16 years of age (1,856,783), 70.0% or 1,299,748 individuals are in the labor force, with 4.5% or 58,489 of them unemployed. The age group with the highest labor force participation rate is 25 to 29 years, with 88.1% or 174,774 individuals in the labor force. Within the labor force, the 16 to 19 years age range has the highest percentage of unemployed individuals, with 15.3% or 5,670 of them being unemployed.
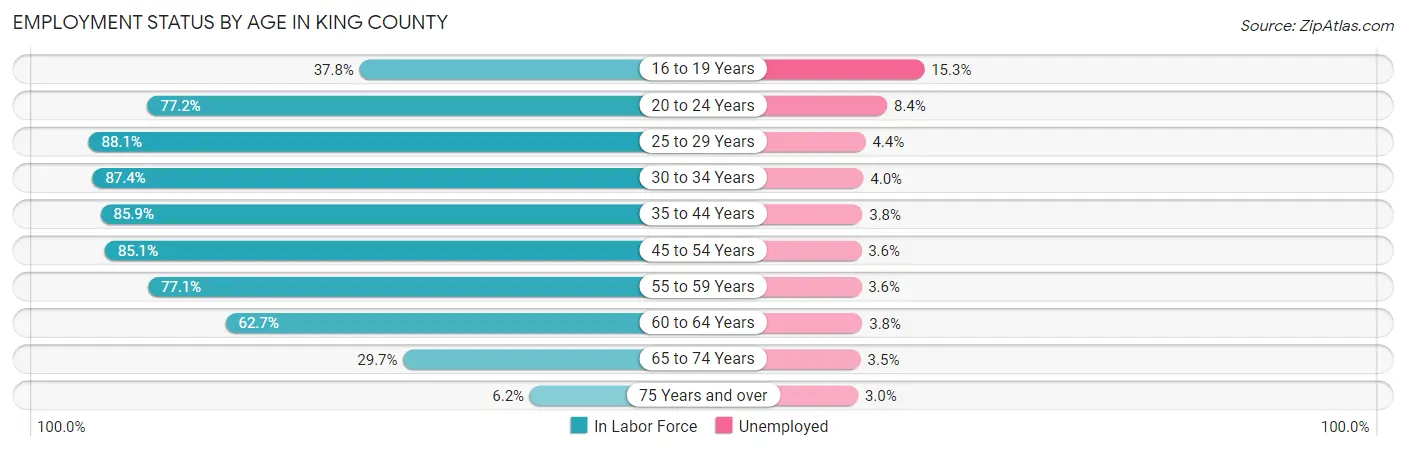
| Age Bracket | In Labor Force | Unemployed |
| 16 to 19 Years | 37,061 (37.8%) | 5,670 (15.3%) |
| 20 to 24 Years | 105,071 (77.2%) | 8,826 (8.4%) |
| 25 to 29 Years | 174,774 (88.1%) | 7,690 (4.4%) |
| 30 to 34 Years | 184,530 (87.4%) | 7,381 (4.0%) |
| 35 to 44 Years | 301,944 (85.9%) | 11,474 (3.8%) |
| 45 to 54 Years | 250,469 (85.1%) | 9,017 (3.6%) |
| 55 to 59 Years | 104,527 (77.1%) | 3,763 (3.6%) |
| 60 to 64 Years | 78,792 (62.7%) | 2,994 (3.8%) |
| 65 to 74 Years | 54,517 (29.7%) | 1,908 (3.5%) |
| 75 Years and over | 7,595 (6.2%) | 228 (3.0%) |
| Total | 1,299,748 (70.0%) | 58,489 (4.5%) |
Employment Status by Educational Attainment in King County
According to labor force statistics for King County, 83.2% of individuals (1,095,395) out of the total population between 25 and 64 years of age (1,316,581) are in the labor force, with 3.8% or 41,625 of them being unemployed. The group with the highest labor force participation rate are those with the educational attainment of bachelor's degree or higher, with 87.7% or 657,992 individuals in the labor force. Within the labor force, individuals with less than high school education have the highest percentage of unemployment, with 6.1% or 3,177 of them being unemployed.
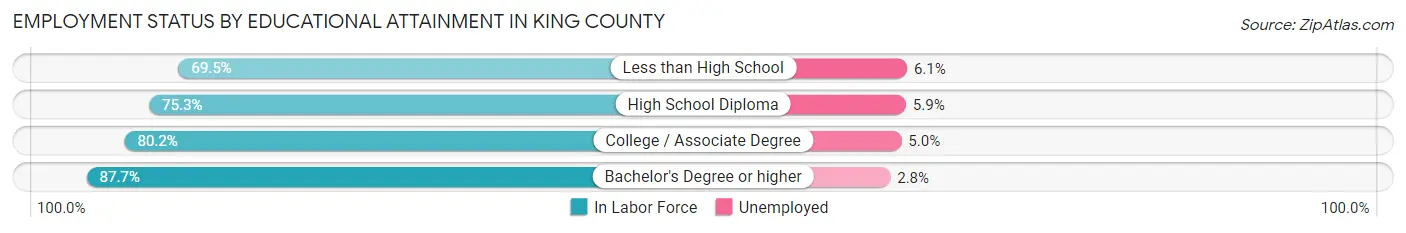
| Educational Attainment | In Labor Force | Unemployed |
| Less than High School | 52,087 (69.5%) | 4,572 (6.1%) |
| High School Diploma | 137,474 (75.3%) | 10,772 (5.9%) |
| College / Associate Degree | 247,650 (80.2%) | 15,440 (5.0%) |
| Bachelor's Degree or higher | 657,992 (87.7%) | 21,008 (2.8%) |
| Total | 1,095,395 (83.2%) | 50,030 (3.8%) |
Employment Occupations by Sex in King County
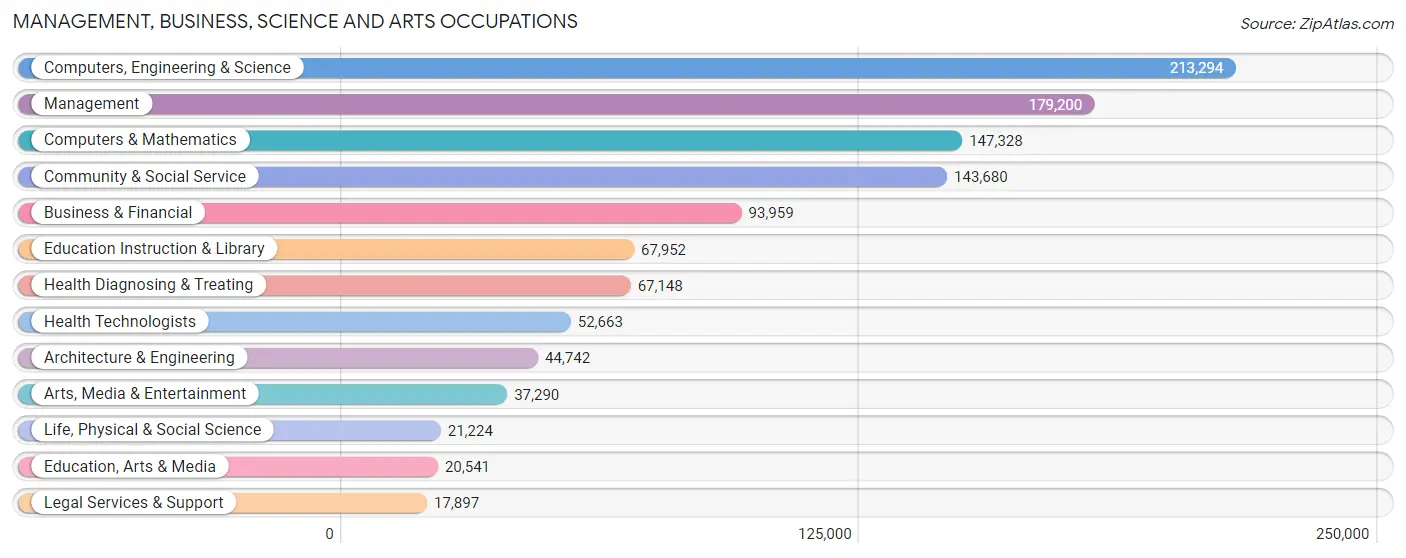
Management, Business, Science and Arts Occupations
The most common Management, Business, Science and Arts occupations in King County are Computers, Engineering & Science (213,294 | 17.2%), Management (179,200 | 14.5%), Computers & Mathematics (147,328 | 11.9%), Community & Social Service (143,680 | 11.6%), and Business & Financial (93,959 | 7.6%).
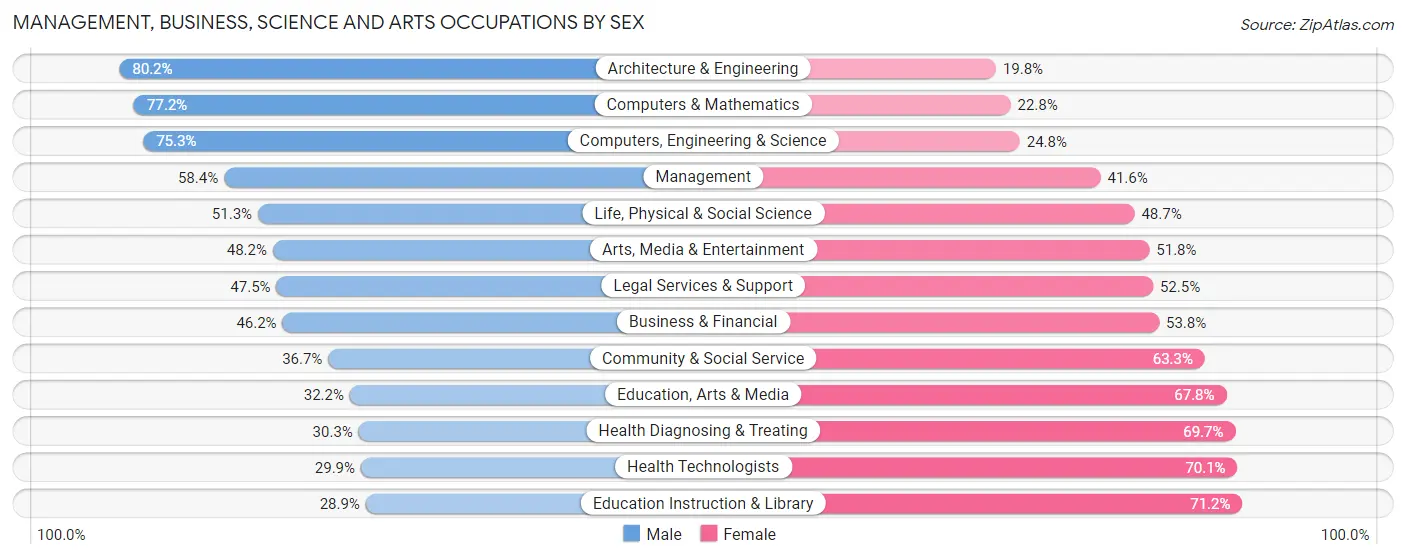
Management, Business, Science and Arts Occupations by Sex
Within the Management, Business, Science and Arts occupations in King County, the most male-oriented occupations are Architecture & Engineering (80.2%), Computers & Mathematics (77.2%), and Computers, Engineering & Science (75.2%), while the most female-oriented occupations are Education Instruction & Library (71.2%), Health Technologists (70.1%), and Health Diagnosing & Treating (69.7%).
| Occupation | Male | Female |
| Management | 104,673 (58.4%) | 74,527 (41.6%) |
| Business & Financial | 43,414 (46.2%) | 50,545 (53.8%) |
| Computers, Engineering & Science | 160,512 (75.2%) | 52,782 (24.7%) |
| Computers & Mathematics | 113,721 (77.2%) | 33,607 (22.8%) |
| Architecture & Engineering | 35,896 (80.2%) | 8,846 (19.8%) |
| Life, Physical & Social Science | 10,895 (51.3%) | 10,329 (48.7%) |
| Community & Social Service | 52,687 (36.7%) | 90,993 (63.3%) |
| Education, Arts & Media | 6,608 (32.2%) | 13,933 (67.8%) |
| Legal Services & Support | 8,496 (47.5%) | 9,401 (52.5%) |
| Education Instruction & Library | 19,602 (28.8%) | 48,350 (71.2%) |
| Arts, Media & Entertainment | 17,981 (48.2%) | 19,309 (51.8%) |
| Health Diagnosing & Treating | 20,350 (30.3%) | 46,798 (69.7%) |
| Health Technologists | 15,725 (29.9%) | 36,938 (70.1%) |
| Total (Category) | 381,636 (54.7%) | 315,645 (45.3%) |
| Total (Overall) | 679,357 (54.8%) | 559,372 (45.2%) |
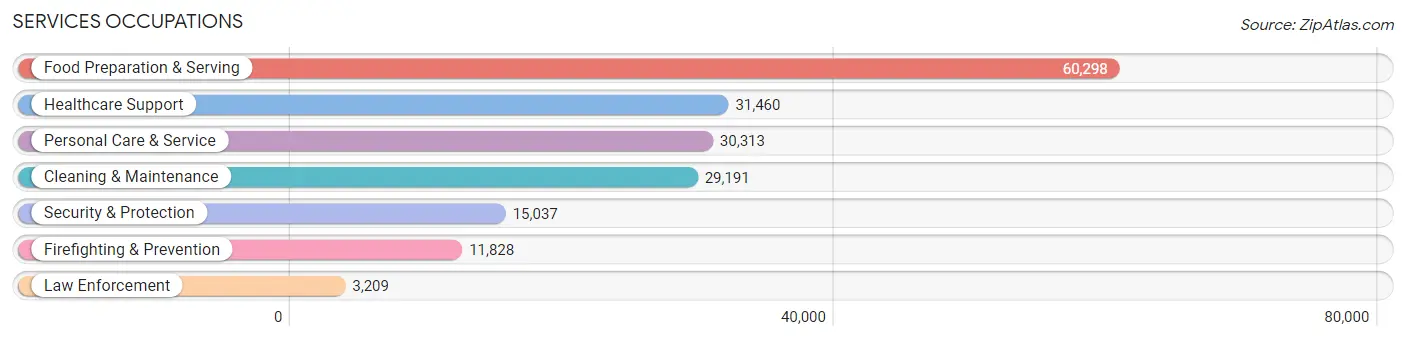
Services Occupations
The most common Services occupations in King County are Food Preparation & Serving (60,298 | 4.9%), Healthcare Support (31,460 | 2.5%), Personal Care & Service (30,313 | 2.5%), Cleaning & Maintenance (29,191 | 2.4%), and Security & Protection (15,037 | 1.2%).
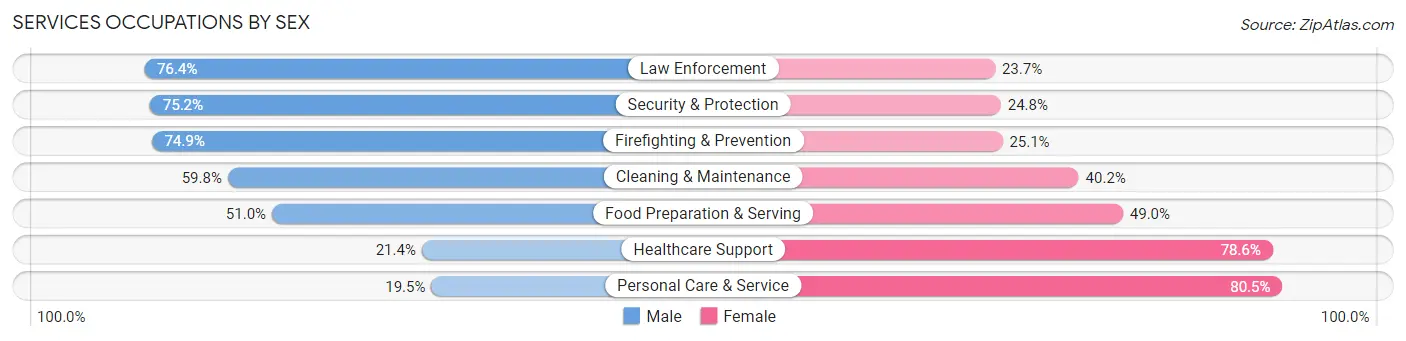
Services Occupations by Sex
Within the Services occupations in King County, the most male-oriented occupations are Law Enforcement (76.3%), Security & Protection (75.2%), and Firefighting & Prevention (74.9%), while the most female-oriented occupations are Personal Care & Service (80.5%), Healthcare Support (78.6%), and Food Preparation & Serving (49.0%).
| Occupation | Male | Female |
| Healthcare Support | 6,720 (21.4%) | 24,740 (78.6%) |
| Security & Protection | 11,306 (75.2%) | 3,731 (24.8%) |
| Firefighting & Prevention | 8,856 (74.9%) | 2,972 (25.1%) |
| Law Enforcement | 2,450 (76.3%) | 759 (23.6%) |
| Food Preparation & Serving | 30,770 (51.0%) | 29,528 (49.0%) |
| Cleaning & Maintenance | 17,449 (59.8%) | 11,742 (40.2%) |
| Personal Care & Service | 5,899 (19.5%) | 24,414 (80.5%) |
| Total (Category) | 72,144 (43.4%) | 94,155 (56.6%) |
| Total (Overall) | 679,357 (54.8%) | 559,372 (45.2%) |
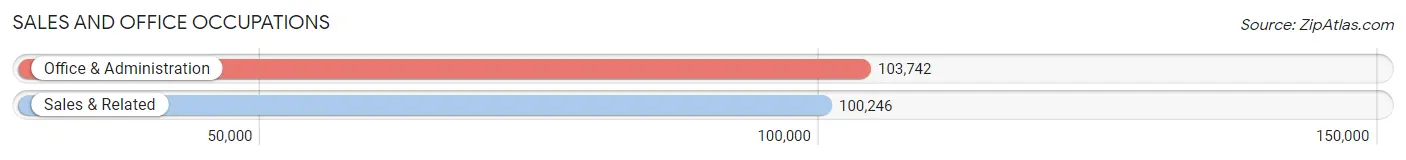
Sales and Office Occupations
The most common Sales and Office occupations in King County are Office & Administration (103,742 | 8.4%), and Sales & Related (100,246 | 8.1%).
Sales and Office Occupations by Sex
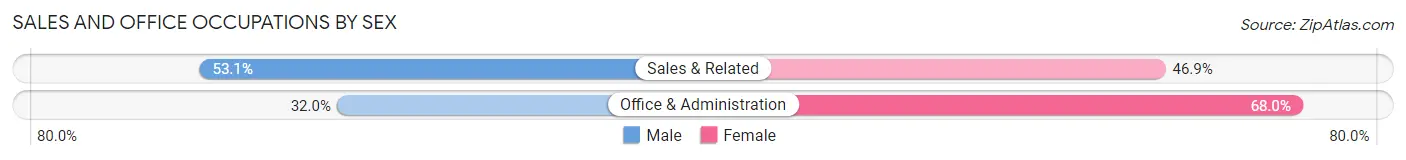
| Occupation | Male | Female |
| Sales & Related | 53,215 (53.1%) | 47,031 (46.9%) |
| Office & Administration | 33,180 (32.0%) | 70,562 (68.0%) |
| Total (Category) | 86,395 (42.3%) | 117,593 (57.7%) |
| Total (Overall) | 679,357 (54.8%) | 559,372 (45.2%) |
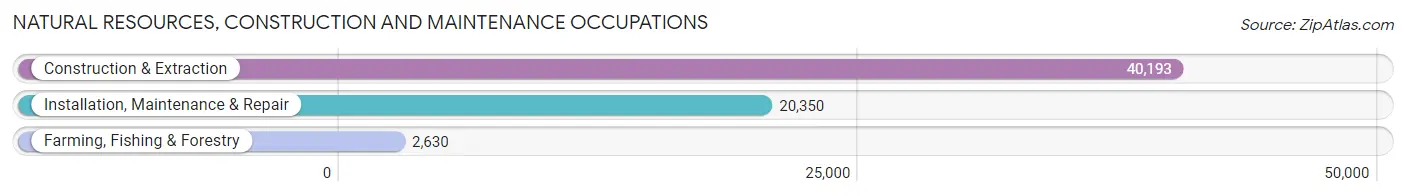
Natural Resources, Construction and Maintenance Occupations
The most common Natural Resources, Construction and Maintenance occupations in King County are Construction & Extraction (40,193 | 3.2%), Installation, Maintenance & Repair (20,350 | 1.6%), and Farming, Fishing & Forestry (2,630 | 0.2%).
Natural Resources, Construction and Maintenance Occupations by Sex
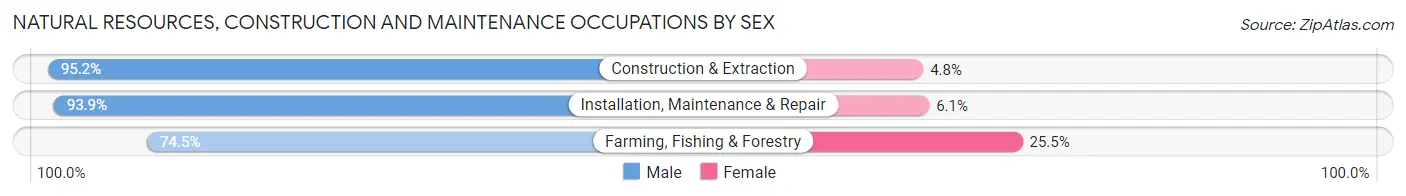
| Occupation | Male | Female |
| Farming, Fishing & Forestry | 1,959 (74.5%) | 671 (25.5%) |
| Construction & Extraction | 38,248 (95.2%) | 1,945 (4.8%) |
| Installation, Maintenance & Repair | 19,110 (93.9%) | 1,240 (6.1%) |
| Total (Category) | 59,317 (93.9%) | 3,856 (6.1%) |
| Total (Overall) | 679,357 (54.8%) | 559,372 (45.2%) |
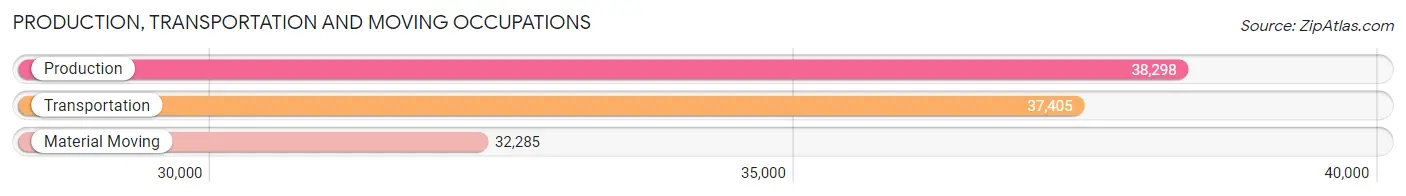
Production, Transportation and Moving Occupations
The most common Production, Transportation and Moving occupations in King County are Production (38,298 | 3.1%), Transportation (37,405 | 3.0%), and Material Moving (32,285 | 2.6%).
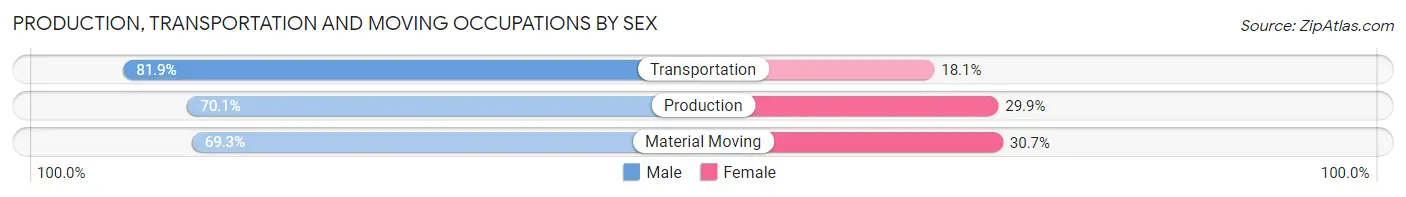
Production, Transportation and Moving Occupations by Sex
| Occupation | Male | Female |
| Production | 26,863 (70.1%) | 11,435 (29.9%) |
| Transportation | 30,628 (81.9%) | 6,777 (18.1%) |
| Material Moving | 22,374 (69.3%) | 9,911 (30.7%) |
| Total (Category) | 79,865 (74.0%) | 28,123 (26.0%) |
| Total (Overall) | 679,357 (54.8%) | 559,372 (45.2%) |
Employment Industries by Sex in King County
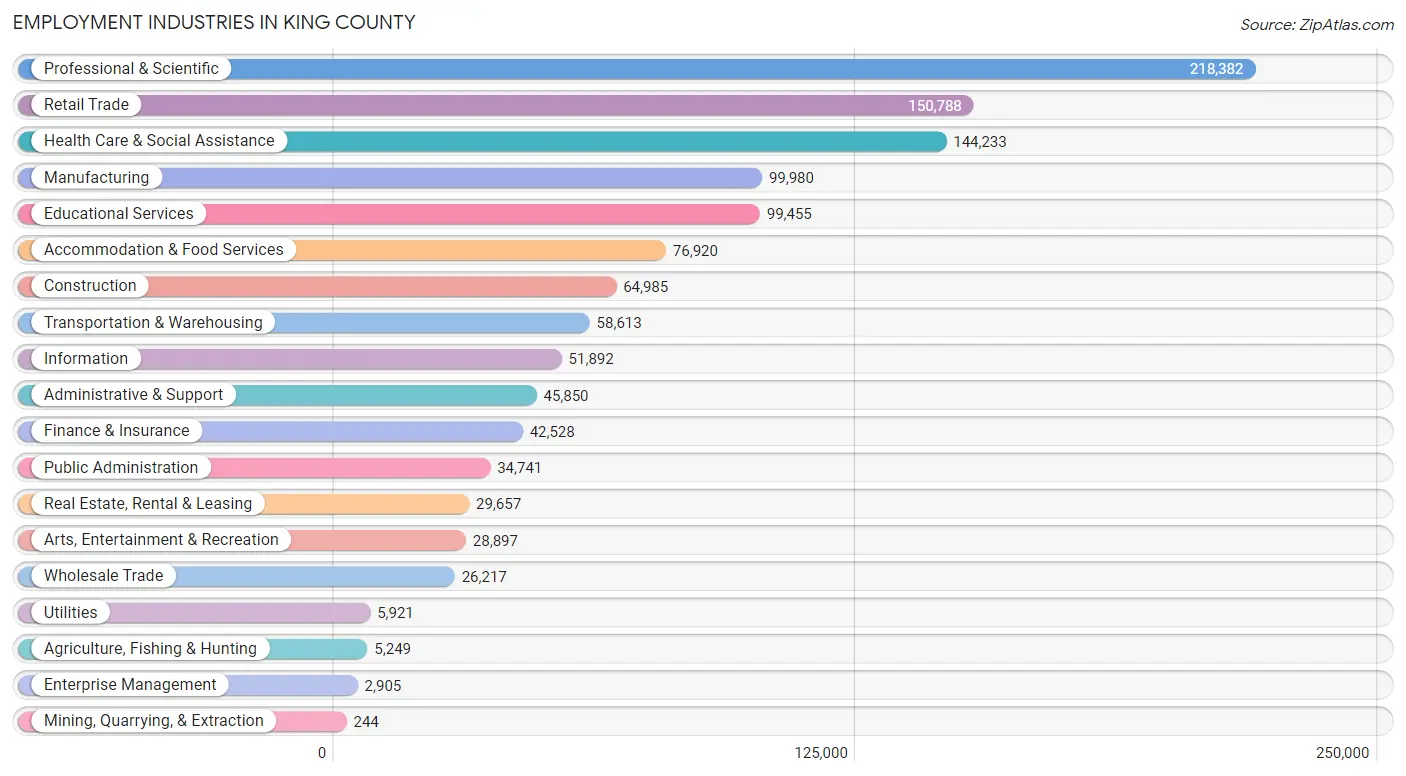
Employment Industries in King County
The major employment industries in King County include Professional & Scientific (218,382 | 17.6%), Retail Trade (150,788 | 12.2%), Health Care & Social Assistance (144,233 | 11.6%), Manufacturing (99,980 | 8.1%), and Educational Services (99,455 | 8.0%).
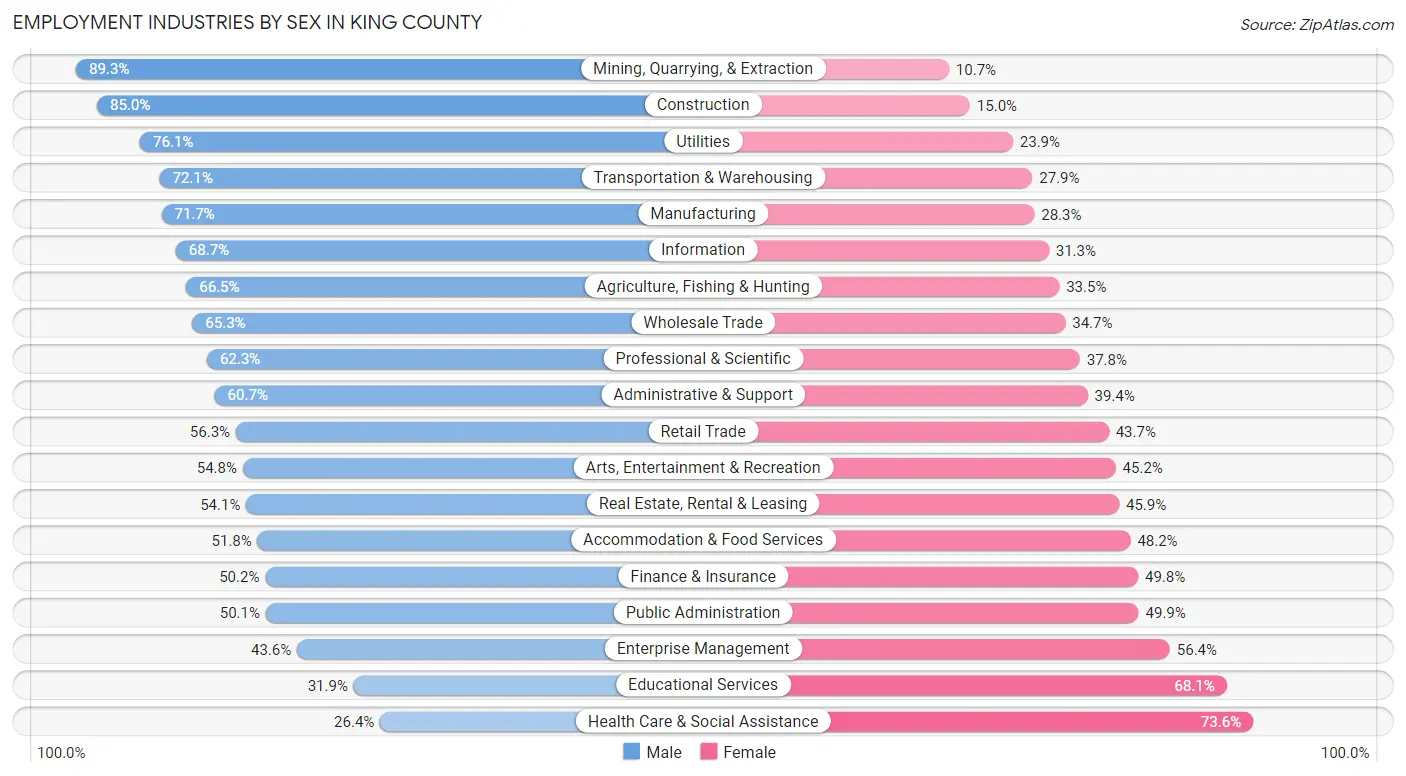
Employment Industries by Sex in King County
The King County industries that see more men than women are Mining, Quarrying, & Extraction (89.3%), Construction (85.0%), and Utilities (76.1%), whereas the industries that tend to have a higher number of women are Health Care & Social Assistance (73.6%), Educational Services (68.1%), and Enterprise Management (56.4%).
| Industry | Male | Female |
| Agriculture, Fishing & Hunting | 3,491 (66.5%) | 1,758 (33.5%) |
| Mining, Quarrying, & Extraction | 218 (89.3%) | 26 (10.7%) |
| Construction | 55,235 (85.0%) | 9,750 (15.0%) |
| Manufacturing | 71,657 (71.7%) | 28,323 (28.3%) |
| Wholesale Trade | 17,110 (65.3%) | 9,107 (34.7%) |
| Retail Trade | 84,828 (56.3%) | 65,960 (43.7%) |
| Transportation & Warehousing | 42,242 (72.1%) | 16,371 (27.9%) |
| Utilities | 4,506 (76.1%) | 1,415 (23.9%) |
| Information | 35,634 (68.7%) | 16,258 (31.3%) |
| Finance & Insurance | 21,343 (50.2%) | 21,185 (49.8%) |
| Real Estate, Rental & Leasing | 16,050 (54.1%) | 13,607 (45.9%) |
| Professional & Scientific | 135,943 (62.3%) | 82,439 (37.8%) |
| Enterprise Management | 1,267 (43.6%) | 1,638 (56.4%) |
| Administrative & Support | 27,810 (60.7%) | 18,040 (39.4%) |
| Educational Services | 31,700 (31.9%) | 67,755 (68.1%) |
| Health Care & Social Assistance | 38,090 (26.4%) | 106,143 (73.6%) |
| Arts, Entertainment & Recreation | 15,845 (54.8%) | 13,052 (45.2%) |
| Accommodation & Food Services | 39,820 (51.8%) | 37,100 (48.2%) |
| Public Administration | 17,399 (50.1%) | 17,342 (49.9%) |
| Total | 679,357 (54.8%) | 559,372 (45.2%) |
Education in King County
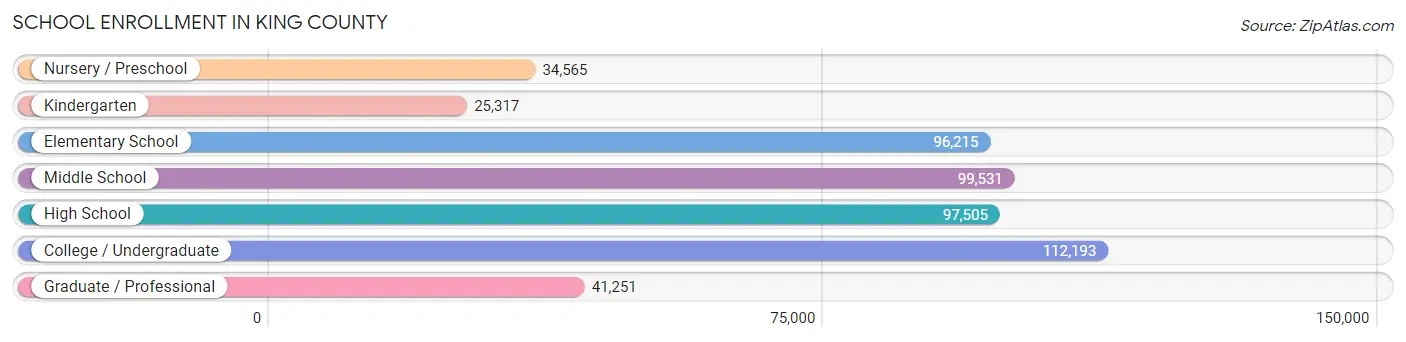
School Enrollment in King County
The most common levels of schooling among the 506,577 students in King County are college / undergraduate (112,193 | 22.2%), middle school (99,531 | 19.7%), and high school (97,505 | 19.3%).
| School Level | # Students | % Students |
| Nursery / Preschool | 34,565 | 6.8% |
| Kindergarten | 25,317 | 5.0% |
| Elementary School | 96,215 | 19.0% |
| Middle School | 99,531 | 19.7% |
| High School | 97,505 | 19.3% |
| College / Undergraduate | 112,193 | 22.2% |
| Graduate / Professional | 41,251 | 8.1% |
| Total | 506,577 | 100.0% |
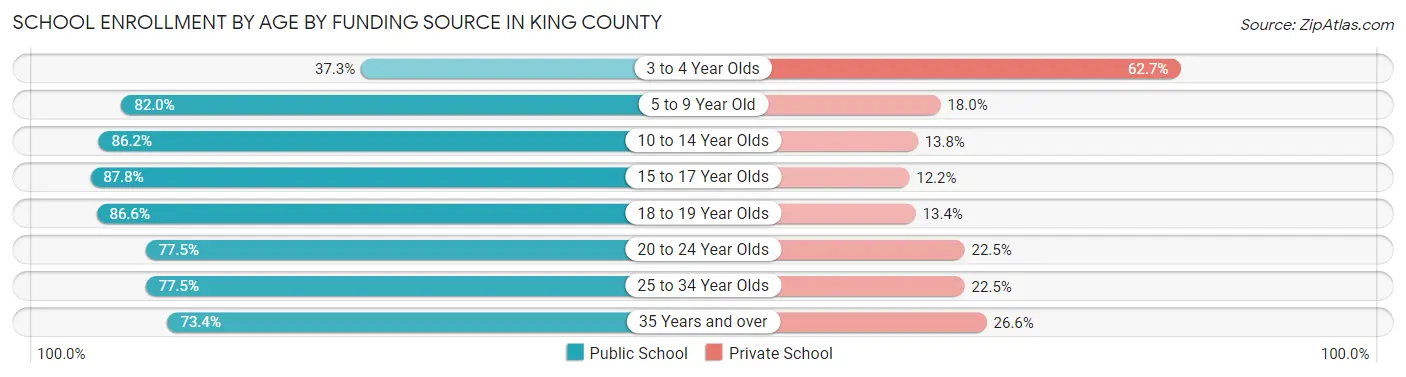
School Enrollment by Age by Funding Source in King County
Out of a total of 506,577 students who are enrolled in schools in King County, 98,783 (19.5%) attend a private institution, while the remaining 407,794 (80.5%) are enrolled in public schools. The age group of 3 to 4 year olds has the highest likelihood of being enrolled in private schools, with 16,533 (62.7% in the age bracket) enrolled. Conversely, the age group of 15 to 17 year olds has the lowest likelihood of being enrolled in a private school, with 62,276 (87.8% in the age bracket) attending a public institution.
| Age Bracket | Public School | Private School |
| 3 to 4 Year Olds | 9,848 (37.3%) | 16,533 (62.7%) |
| 5 to 9 Year Old | 95,183 (82.0%) | 20,943 (18.0%) |
| 10 to 14 Year Olds | 106,942 (86.2%) | 17,111 (13.8%) |
| 15 to 17 Year Olds | 62,276 (87.8%) | 8,680 (12.2%) |
| 18 to 19 Year Olds | 34,596 (86.6%) | 5,359 (13.4%) |
| 20 to 24 Year Olds | 42,844 (77.5%) | 12,455 (22.5%) |
| 25 to 34 Year Olds | 33,470 (77.5%) | 9,737 (22.5%) |
| 35 Years and over | 22,453 (73.4%) | 8,147 (26.6%) |
| Total | 407,794 (80.5%) | 98,783 (19.5%) |
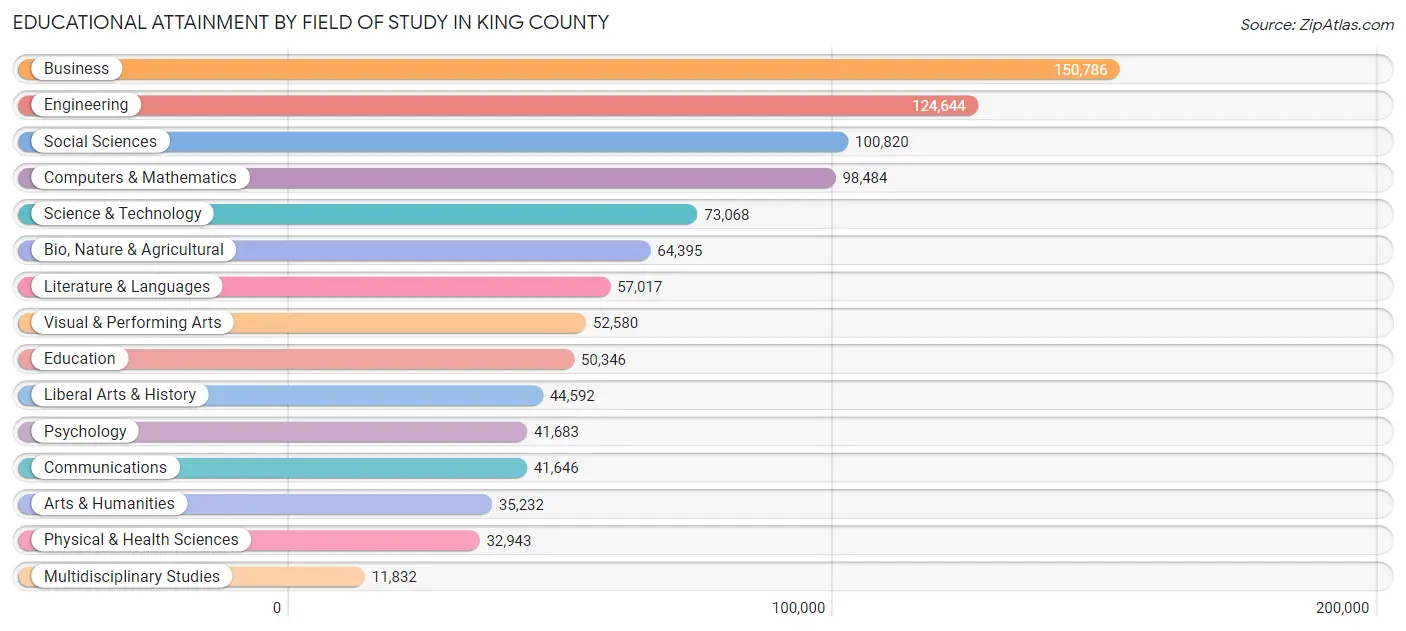
Educational Attainment by Field of Study in King County
Business (150,786 | 15.4%), engineering (124,644 | 12.7%), social sciences (100,820 | 10.3%), computers & mathematics (98,484 | 10.1%), and science & technology (73,068 | 7.5%) are the most common fields of study among 980,068 individuals in King County who have obtained a bachelor's degree or higher.
| Field of Study | # Graduates | % Graduates |
| Computers & Mathematics | 98,484 | 10.1% |
| Bio, Nature & Agricultural | 64,395 | 6.6% |
| Physical & Health Sciences | 32,943 | 3.4% |
| Psychology | 41,683 | 4.3% |
| Social Sciences | 100,820 | 10.3% |
| Engineering | 124,644 | 12.7% |
| Multidisciplinary Studies | 11,832 | 1.2% |
| Science & Technology | 73,068 | 7.5% |
| Business | 150,786 | 15.4% |
| Education | 50,346 | 5.1% |
| Literature & Languages | 57,017 | 5.8% |
| Liberal Arts & History | 44,592 | 4.5% |
| Visual & Performing Arts | 52,580 | 5.4% |
| Communications | 41,646 | 4.3% |
| Arts & Humanities | 35,232 | 3.6% |
| Total | 980,068 | 100.0% |
Transportation & Commute in King County
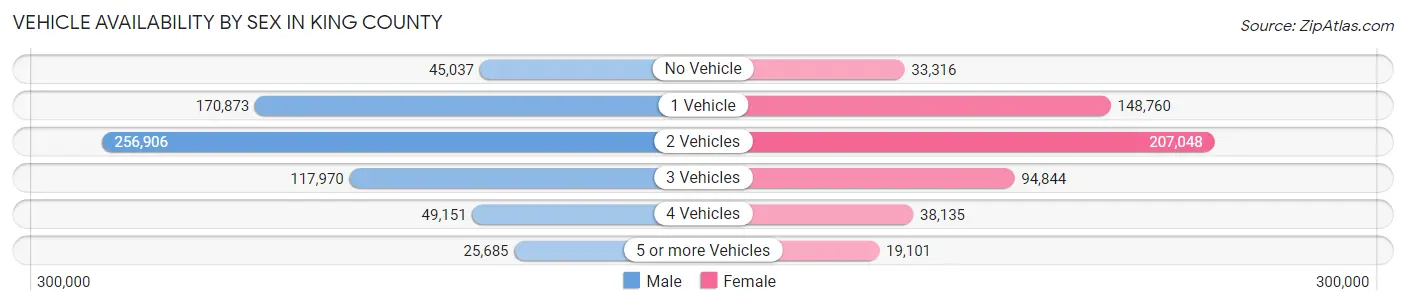
Vehicle Availability by Sex in King County
The most prevalent vehicle ownership categories in King County are males with 2 vehicles (256,906, accounting for 38.6%) and females with 2 vehicles (207,048, making up 47.5%).
| Vehicles Available | Male | Female |
| No Vehicle | 45,037 (6.8%) | 33,316 (6.2%) |
| 1 Vehicle | 170,873 (25.7%) | 148,760 (27.5%) |
| 2 Vehicles | 256,906 (38.6%) | 207,048 (38.3%) |
| 3 Vehicles | 117,970 (17.7%) | 94,844 (17.5%) |
| 4 Vehicles | 49,151 (7.4%) | 38,135 (7.0%) |
| 5 or more Vehicles | 25,685 (3.9%) | 19,101 (3.5%) |
| Total | 665,622 (100.0%) | 541,204 (100.0%) |
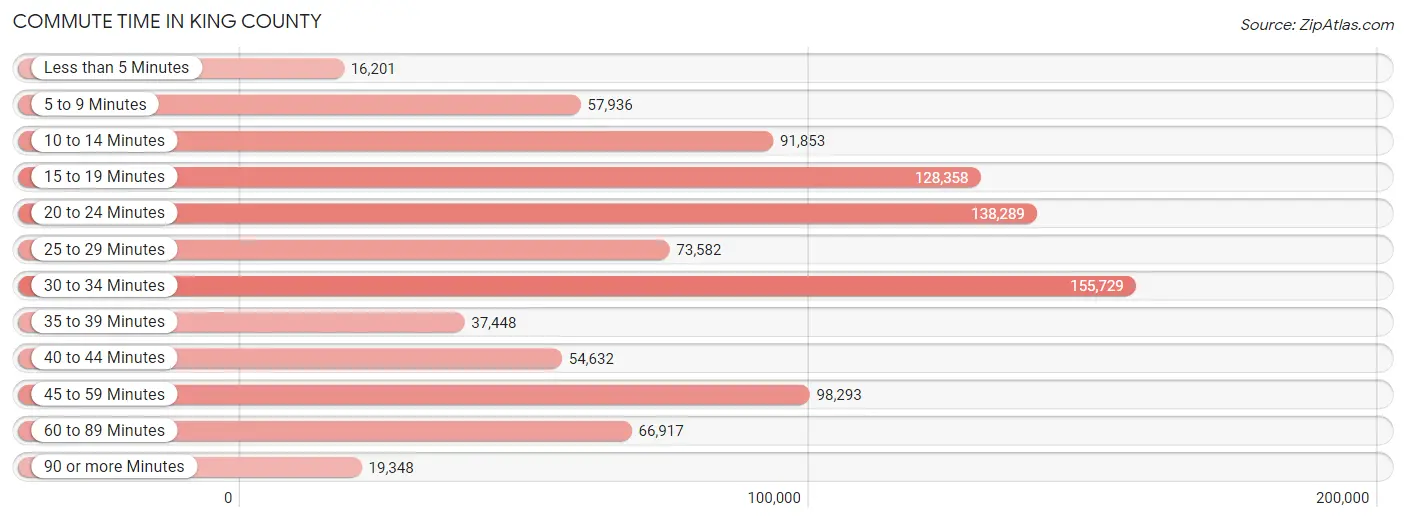
Commute Time in King County
The most frequently occuring commute durations in King County are 30 to 34 minutes (155,729 commuters, 16.6%), 20 to 24 minutes (138,289 commuters, 14.7%), and 15 to 19 minutes (128,358 commuters, 13.7%).
| Commute Time | # Commuters | % Commuters |
| Less than 5 Minutes | 16,201 | 1.7% |
| 5 to 9 Minutes | 57,936 | 6.2% |
| 10 to 14 Minutes | 91,853 | 9.8% |
| 15 to 19 Minutes | 128,358 | 13.7% |
| 20 to 24 Minutes | 138,289 | 14.7% |
| 25 to 29 Minutes | 73,582 | 7.8% |
| 30 to 34 Minutes | 155,729 | 16.6% |
| 35 to 39 Minutes | 37,448 | 4.0% |
| 40 to 44 Minutes | 54,632 | 5.8% |
| 45 to 59 Minutes | 98,293 | 10.5% |
| 60 to 89 Minutes | 66,917 | 7.1% |
| 90 or more Minutes | 19,348 | 2.1% |
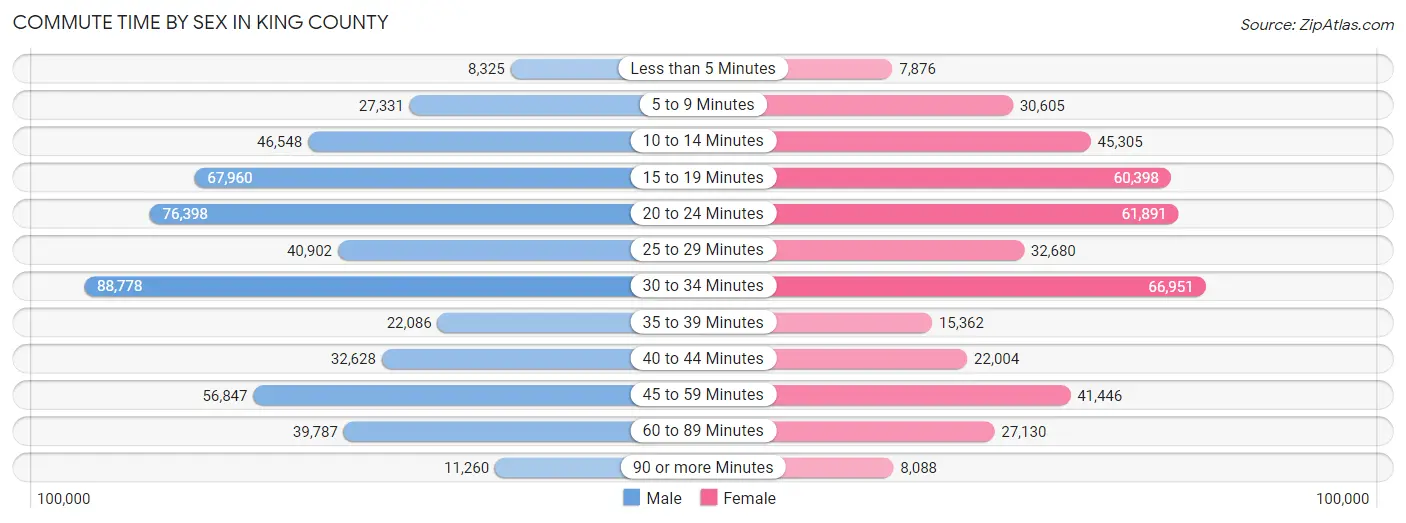
Commute Time by Sex in King County
The most common commute times in King County are 30 to 34 minutes (88,778 commuters, 17.1%) for males and 30 to 34 minutes (66,951 commuters, 16.0%) for females.
| Commute Time | Male | Female |
| Less than 5 Minutes | 8,325 (1.6%) | 7,876 (1.9%) |
| 5 to 9 Minutes | 27,331 (5.3%) | 30,605 (7.3%) |
| 10 to 14 Minutes | 46,548 (9.0%) | 45,305 (10.8%) |
| 15 to 19 Minutes | 67,960 (13.1%) | 60,398 (14.4%) |
| 20 to 24 Minutes | 76,398 (14.7%) | 61,891 (14.7%) |
| 25 to 29 Minutes | 40,902 (7.9%) | 32,680 (7.8%) |
| 30 to 34 Minutes | 88,778 (17.1%) | 66,951 (16.0%) |
| 35 to 39 Minutes | 22,086 (4.3%) | 15,362 (3.7%) |
| 40 to 44 Minutes | 32,628 (6.3%) | 22,004 (5.2%) |
| 45 to 59 Minutes | 56,847 (11.0%) | 41,446 (9.9%) |
| 60 to 89 Minutes | 39,787 (7.7%) | 27,130 (6.5%) |
| 90 or more Minutes | 11,260 (2.2%) | 8,088 (1.9%) |
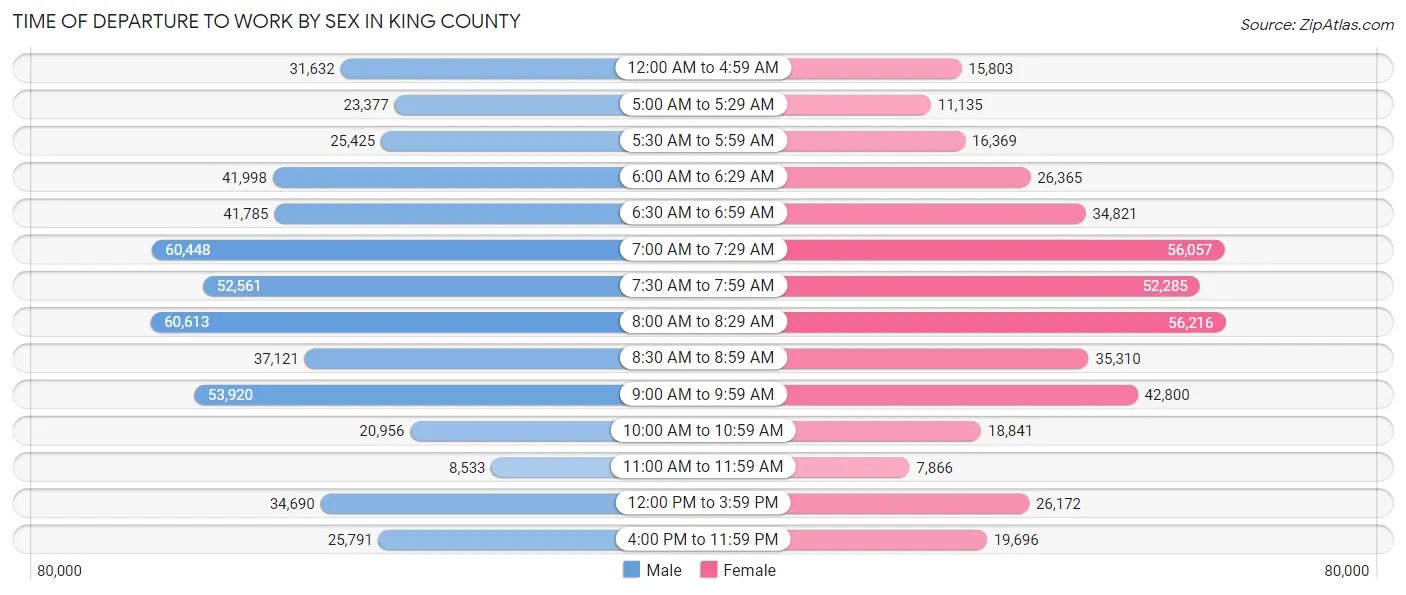
Time of Departure to Work by Sex in King County
The most frequent times of departure to work in King County are 8:00 AM to 8:29 AM (60,613, 11.7%) for males and 8:00 AM to 8:29 AM (56,216, 13.4%) for females.
| Time of Departure | Male | Female |
| 12:00 AM to 4:59 AM | 31,632 (6.1%) | 15,803 (3.8%) |
| 5:00 AM to 5:29 AM | 23,377 (4.5%) | 11,135 (2.6%) |
| 5:30 AM to 5:59 AM | 25,425 (4.9%) | 16,369 (3.9%) |
| 6:00 AM to 6:29 AM | 41,998 (8.1%) | 26,365 (6.3%) |
| 6:30 AM to 6:59 AM | 41,785 (8.1%) | 34,821 (8.3%) |
| 7:00 AM to 7:29 AM | 60,448 (11.7%) | 56,057 (13.4%) |
| 7:30 AM to 7:59 AM | 52,561 (10.1%) | 52,285 (12.5%) |
| 8:00 AM to 8:29 AM | 60,613 (11.7%) | 56,216 (13.4%) |
| 8:30 AM to 8:59 AM | 37,121 (7.1%) | 35,310 (8.4%) |
| 9:00 AM to 9:59 AM | 53,920 (10.4%) | 42,800 (10.2%) |
| 10:00 AM to 10:59 AM | 20,956 (4.0%) | 18,841 (4.5%) |
| 11:00 AM to 11:59 AM | 8,533 (1.6%) | 7,866 (1.9%) |
| 12:00 PM to 3:59 PM | 34,690 (6.7%) | 26,172 (6.2%) |
| 4:00 PM to 11:59 PM | 25,791 (5.0%) | 19,696 (4.7%) |
| Total | 518,850 (100.0%) | 419,736 (100.0%) |
Housing Occupancy in King County
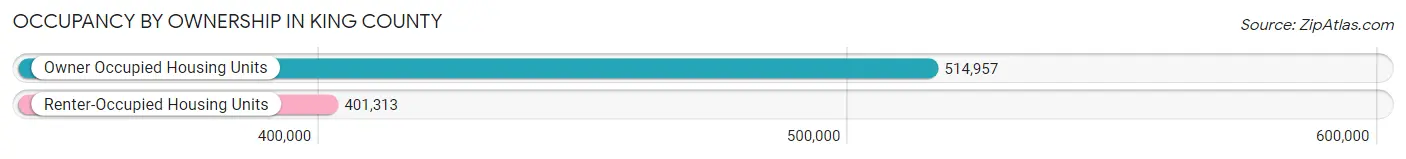
Occupancy by Ownership in King County
Of the total 916,270 dwellings in King County, owner-occupied units account for 514,957 (56.2%), while renter-occupied units make up 401,313 (43.8%).
| Occupancy | # Housing Units | % Housing Units |
| Owner Occupied Housing Units | 514,957 | 56.2% |
| Renter-Occupied Housing Units | 401,313 | 43.8% |
| Total Occupied Housing Units | 916,270 | 100.0% |
Occupancy by Household Size in King County
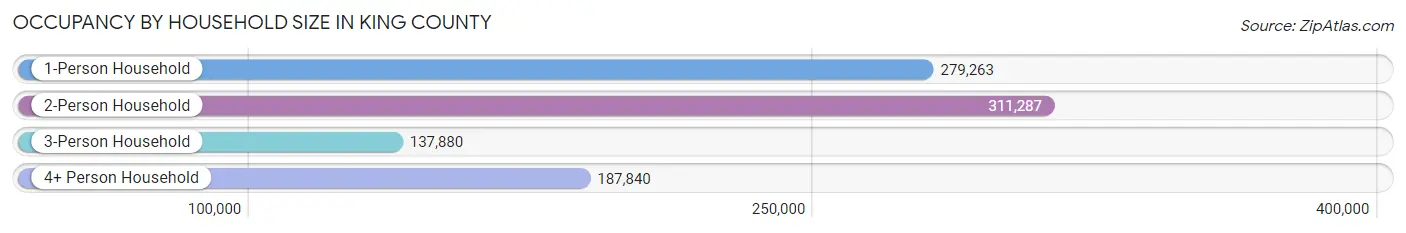
| Household Size | # Housing Units | % Housing Units |
| 1-Person Household | 279,263 | 30.5% |
| 2-Person Household | 311,287 | 34.0% |
| 3-Person Household | 137,880 | 15.0% |
| 4+ Person Household | 187,840 | 20.5% |
| Total Housing Units | 916,270 | 100.0% |
Occupancy by Ownership by Household Size in King County
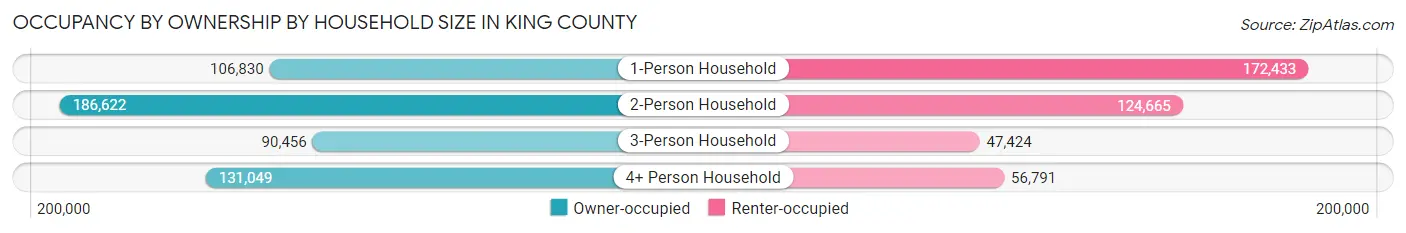
| Household Size | Owner-occupied | Renter-occupied |
| 1-Person Household | 106,830 (38.3%) | 172,433 (61.8%) |
| 2-Person Household | 186,622 (60.0%) | 124,665 (40.1%) |
| 3-Person Household | 90,456 (65.6%) | 47,424 (34.4%) |
| 4+ Person Household | 131,049 (69.8%) | 56,791 (30.2%) |
| Total Housing Units | 514,957 (56.2%) | 401,313 (43.8%) |
Occupancy by Educational Attainment in King County
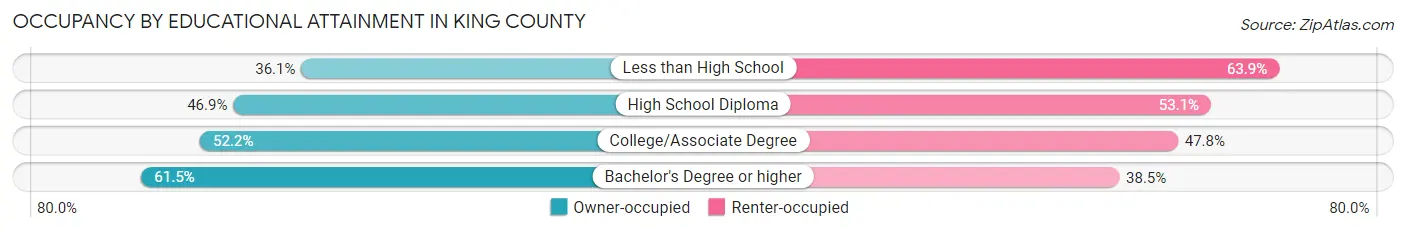
| Household Size | Owner-occupied | Renter-occupied |
| Less than High School | 15,512 (36.1%) | 27,448 (63.9%) |
| High School Diploma | 51,779 (46.9%) | 58,610 (53.1%) |
| College/Associate Degree | 119,513 (52.2%) | 109,604 (47.8%) |
| Bachelor's Degree or higher | 328,153 (61.5%) | 205,651 (38.5%) |
Occupancy by Age of Householder in King County
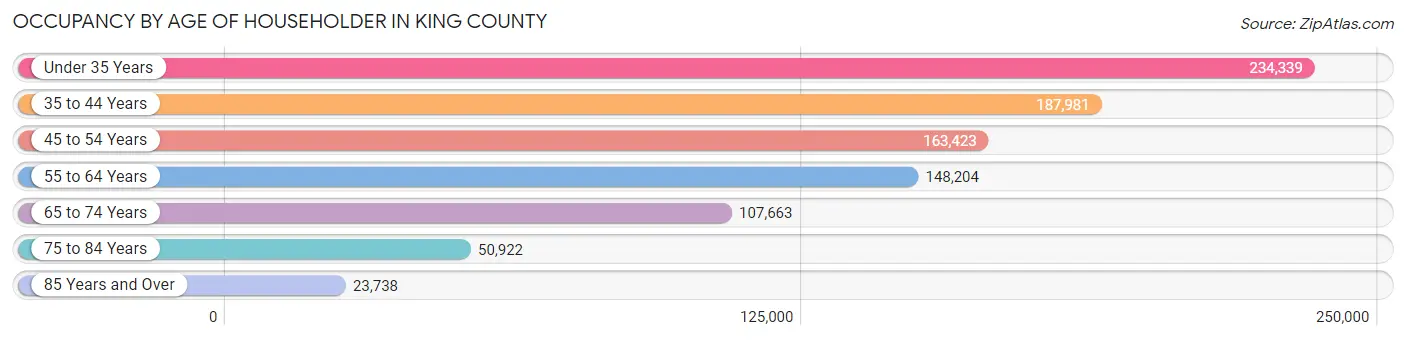
| Age Bracket | # Households | % Households |
| Under 35 Years | 234,339 | 25.6% |
| 35 to 44 Years | 187,981 | 20.5% |
| 45 to 54 Years | 163,423 | 17.8% |
| 55 to 64 Years | 148,204 | 16.2% |
| 65 to 74 Years | 107,663 | 11.7% |
| 75 to 84 Years | 50,922 | 5.6% |
| 85 Years and Over | 23,738 | 2.6% |
| Total | 916,270 | 100.0% |
Housing Finances in King County
Median Income by Occupancy in King County
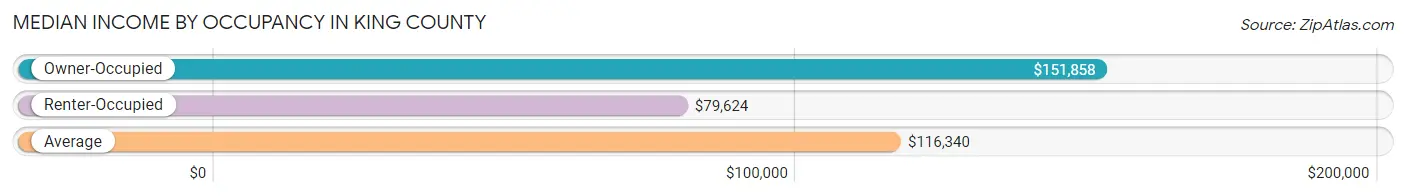
| Occupancy Type | # Households | Median Income |
| Owner-Occupied | 514,957 (56.2%) | $151,858 |
| Renter-Occupied | 401,313 (43.8%) | $79,624 |
| Average | 916,270 (100.0%) | $116,340 |
Occupancy by Householder Income Bracket in King County
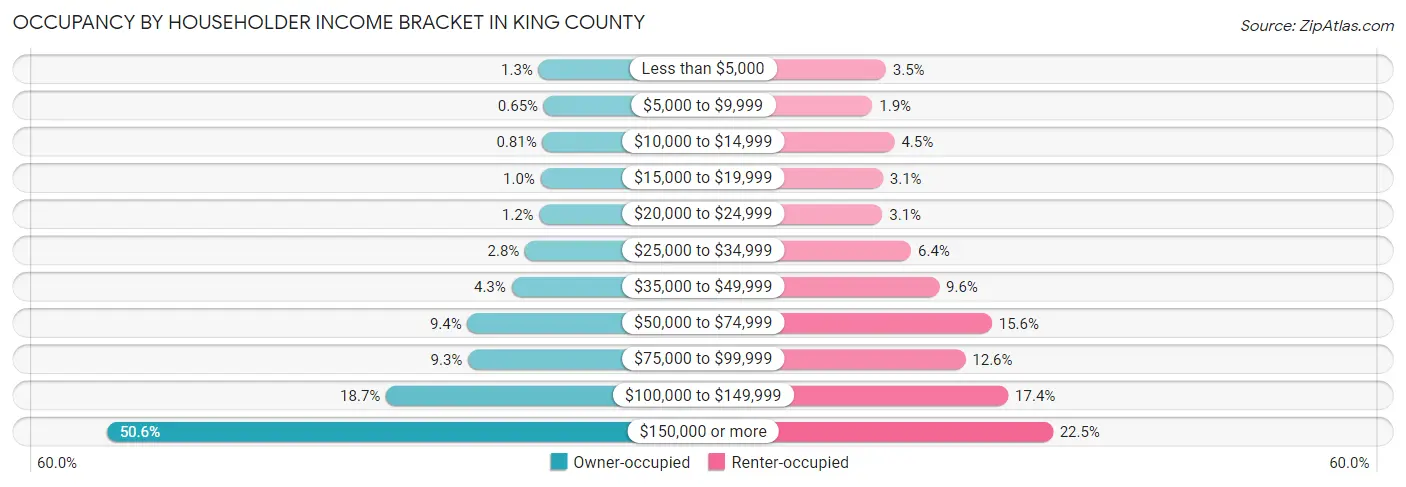
| Income Bracket | Owner-occupied | Renter-occupied |
| Less than $5,000 | 6,418 (1.3%) | 13,905 (3.5%) |
| $5,000 to $9,999 | 3,330 (0.6%) | 7,691 (1.9%) |
| $10,000 to $14,999 | 4,185 (0.8%) | 17,851 (4.4%) |
| $15,000 to $19,999 | 5,272 (1.0%) | 12,519 (3.1%) |
| $20,000 to $24,999 | 5,965 (1.2%) | 12,296 (3.1%) |
| $25,000 to $34,999 | 14,385 (2.8%) | 25,493 (6.4%) |
| $35,000 to $49,999 | 22,336 (4.3%) | 38,308 (9.6%) |
| $50,000 to $74,999 | 48,279 (9.4%) | 62,467 (15.6%) |
| $75,000 to $99,999 | 47,952 (9.3%) | 50,376 (12.6%) |
| $100,000 to $149,999 | 96,209 (18.7%) | 69,986 (17.4%) |
| $150,000 or more | 260,626 (50.6%) | 90,421 (22.5%) |
| Total | 514,957 (100.0%) | 401,313 (100.0%) |
Monthly Housing Cost Tiers in King County
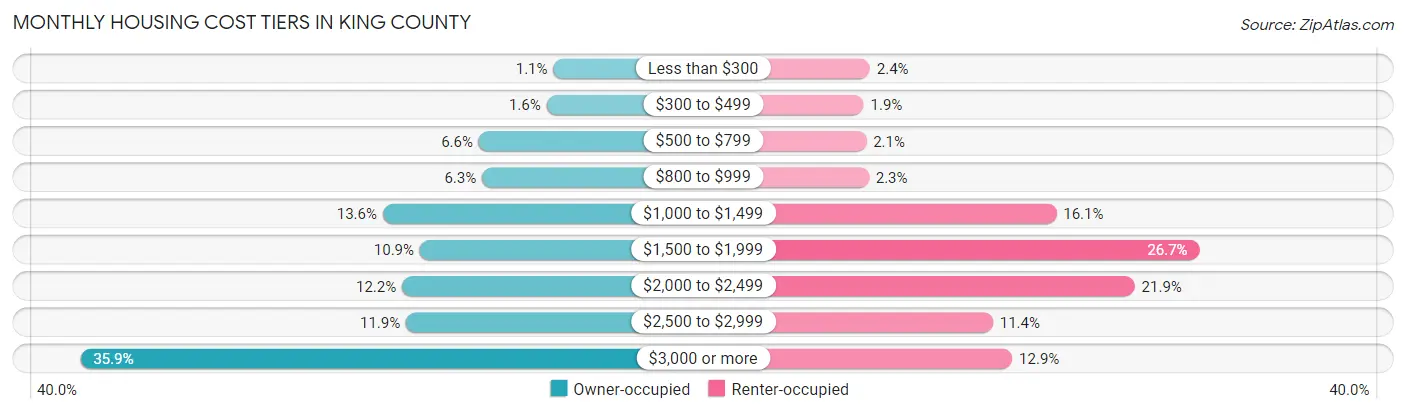
| Monthly Cost | Owner-occupied | Renter-occupied |
| Less than $300 | 5,463 (1.1%) | 9,609 (2.4%) |
| $300 to $499 | 8,034 (1.6%) | 7,734 (1.9%) |
| $500 to $799 | 33,744 (6.6%) | 8,495 (2.1%) |
| $800 to $999 | 32,511 (6.3%) | 9,267 (2.3%) |
| $1,000 to $1,499 | 70,134 (13.6%) | 64,706 (16.1%) |
| $1,500 to $1,999 | 56,091 (10.9%) | 106,997 (26.7%) |
| $2,000 to $2,499 | 62,815 (12.2%) | 87,846 (21.9%) |
| $2,500 to $2,999 | 61,309 (11.9%) | 45,903 (11.4%) |
| $3,000 or more | 184,856 (35.9%) | 51,629 (12.9%) |
| Total | 514,957 (100.0%) | 401,313 (100.0%) |
Physical Housing Characteristics in King County
Housing Structures in King County
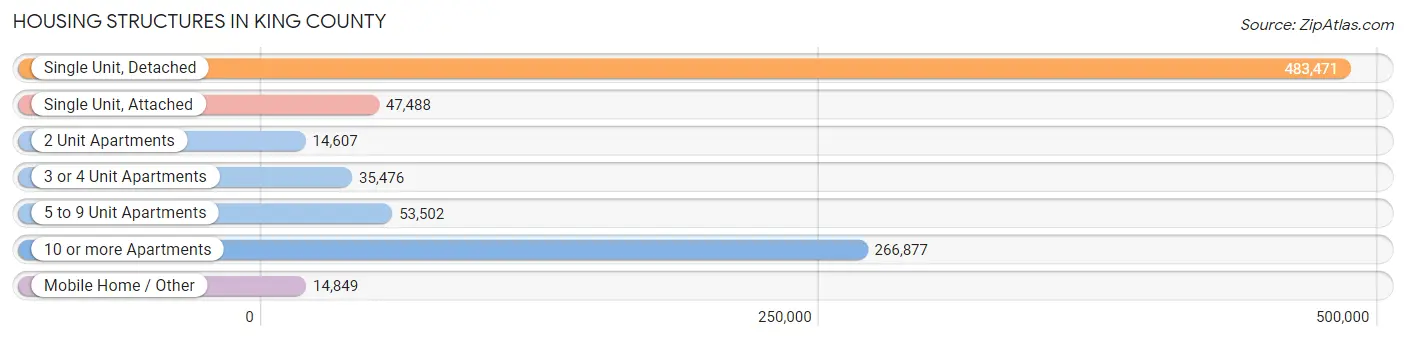
| Structure Type | # Housing Units | % Housing Units |
| Single Unit, Detached | 483,471 | 52.8% |
| Single Unit, Attached | 47,488 | 5.2% |
| 2 Unit Apartments | 14,607 | 1.6% |
| 3 or 4 Unit Apartments | 35,476 | 3.9% |
| 5 to 9 Unit Apartments | 53,502 | 5.8% |
| 10 or more Apartments | 266,877 | 29.1% |
| Mobile Home / Other | 14,849 | 1.6% |
| Total | 916,270 | 100.0% |
Housing Structures by Occupancy in King County
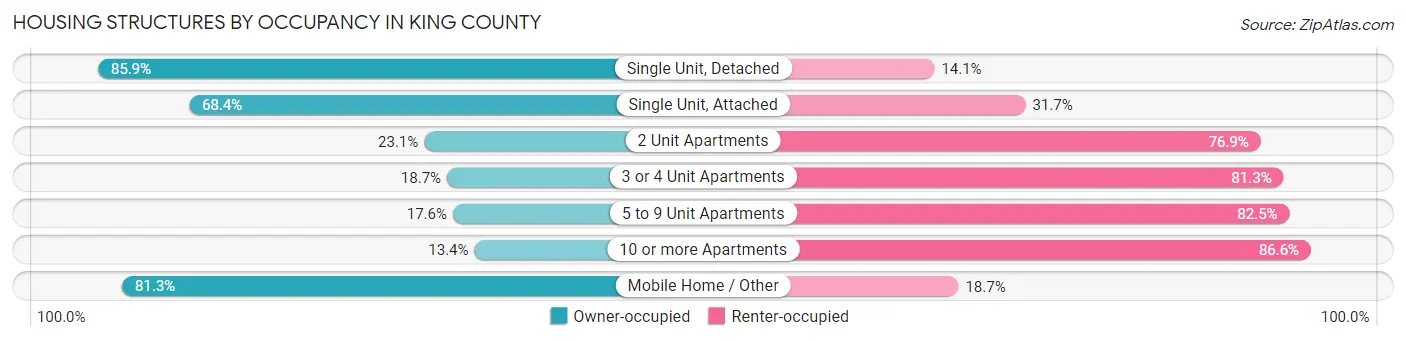
| Structure Type | Owner-occupied | Renter-occupied |
| Single Unit, Detached | 415,262 (85.9%) | 68,209 (14.1%) |
| Single Unit, Attached | 32,456 (68.3%) | 15,032 (31.7%) |
| 2 Unit Apartments | 3,372 (23.1%) | 11,235 (76.9%) |
| 3 or 4 Unit Apartments | 6,631 (18.7%) | 28,845 (81.3%) |
| 5 to 9 Unit Apartments | 9,390 (17.5%) | 44,112 (82.5%) |
| 10 or more Apartments | 35,779 (13.4%) | 231,098 (86.6%) |
| Mobile Home / Other | 12,067 (81.3%) | 2,782 (18.7%) |
| Total | 514,957 (56.2%) | 401,313 (43.8%) |
Housing Structures by Number of Rooms in King County
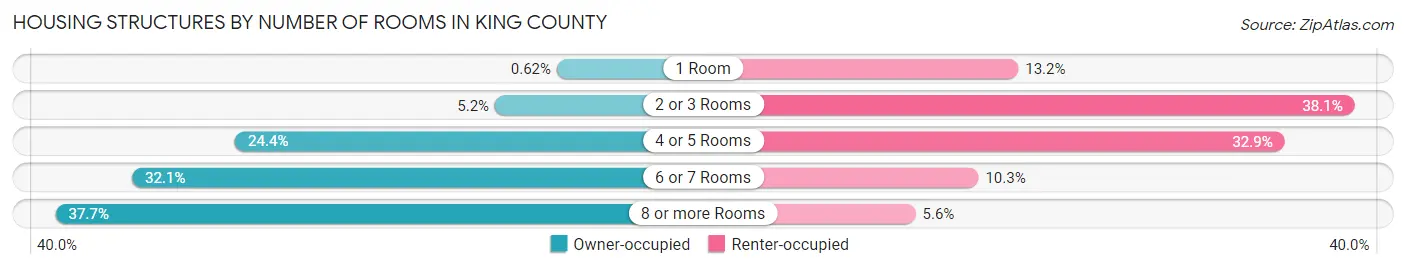
| Number of Rooms | Owner-occupied | Renter-occupied |
| 1 Room | 3,167 (0.6%) | 52,960 (13.2%) |
| 2 or 3 Rooms | 26,784 (5.2%) | 152,783 (38.1%) |
| 4 or 5 Rooms | 125,748 (24.4%) | 131,988 (32.9%) |
| 6 or 7 Rooms | 165,046 (32.1%) | 41,123 (10.2%) |
| 8 or more Rooms | 194,212 (37.7%) | 22,459 (5.6%) |
| Total | 514,957 (100.0%) | 401,313 (100.0%) |
Housing Structure by Heating Type in King County
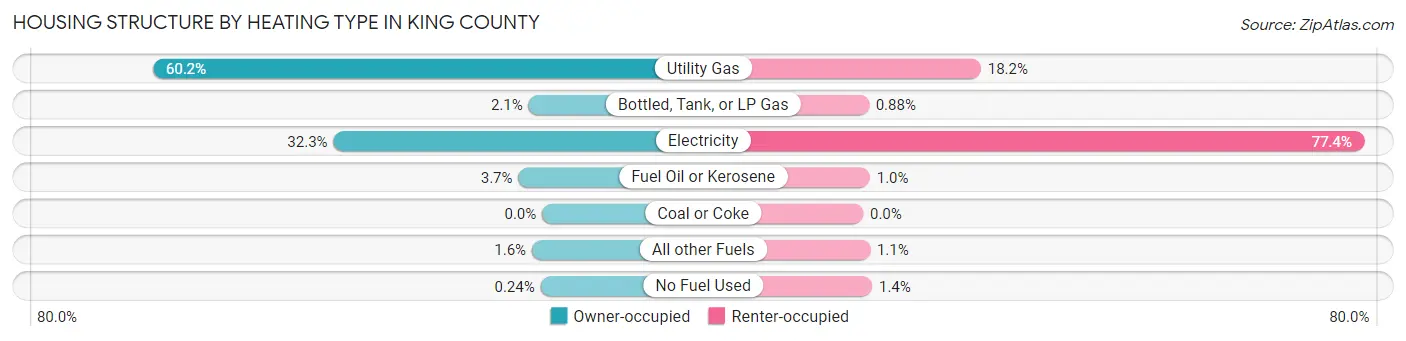
| Heating Type | Owner-occupied | Renter-occupied |
| Utility Gas | 309,834 (60.2%) | 73,029 (18.2%) |
| Bottled, Tank, or LP Gas | 10,830 (2.1%) | 3,547 (0.9%) |
| Electricity | 166,106 (32.3%) | 310,666 (77.4%) |
| Fuel Oil or Kerosene | 18,883 (3.7%) | 4,173 (1.0%) |
| Coal or Coke | 17 (0.0%) | 0 (0.0%) |
| All other Fuels | 8,069 (1.6%) | 4,304 (1.1%) |
| No Fuel Used | 1,218 (0.2%) | 5,594 (1.4%) |
| Total | 514,957 (100.0%) | 401,313 (100.0%) |
Household Vehicle Usage in King County
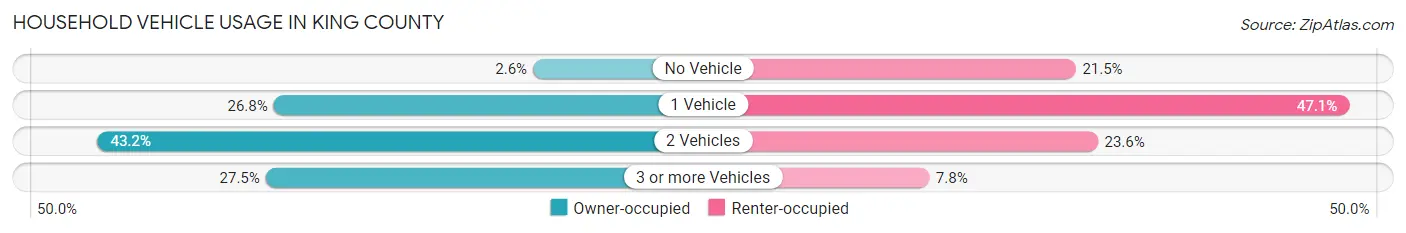
| Vehicles per Household | Owner-occupied | Renter-occupied |
| No Vehicle | 13,147 (2.5%) | 86,368 (21.5%) |
| 1 Vehicle | 137,799 (26.8%) | 188,841 (47.1%) |
| 2 Vehicles | 222,400 (43.2%) | 94,623 (23.6%) |
| 3 or more Vehicles | 141,611 (27.5%) | 31,481 (7.8%) |
| Total | 514,957 (100.0%) | 401,313 (100.0%) |
Real Estate & Mortgages in King County
Real Estate and Mortgage Overview in King County
| Characteristic | Without Mortgage | With Mortgage |
| Housing Units | 151,565 | 363,392 |
| Median Property Value | $731,200 | $773,900 |
| Median Household Income | $103,750 | $209,732 |
| Monthly Housing Costs | $1,010 | $181,593 |
| Real Estate Taxes | $6,572 | $5,691 |
Property Value by Mortgage Status in King County
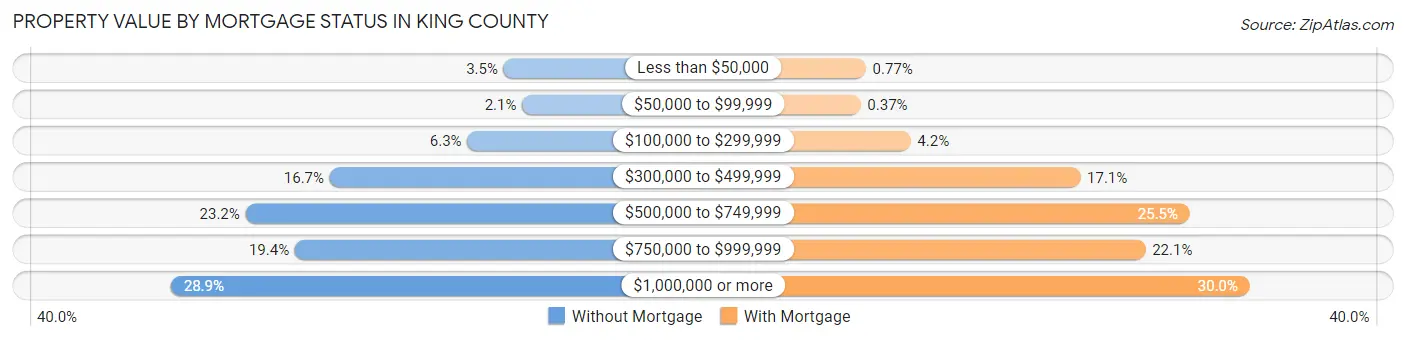
| Property Value | Without Mortgage | With Mortgage |
| Less than $50,000 | 5,294 (3.5%) | 2,802 (0.8%) |
| $50,000 to $99,999 | 3,146 (2.1%) | 1,333 (0.4%) |
| $100,000 to $299,999 | 9,490 (6.3%) | 15,199 (4.2%) |
| $300,000 to $499,999 | 25,378 (16.7%) | 62,160 (17.1%) |
| $500,000 to $749,999 | 35,110 (23.2%) | 92,543 (25.5%) |
| $750,000 to $999,999 | 29,400 (19.4%) | 80,189 (22.1%) |
| $1,000,000 or more | 43,747 (28.9%) | 109,166 (30.0%) |
| Total | 151,565 (100.0%) | 363,392 (100.0%) |
Household Income by Mortgage Status in King County
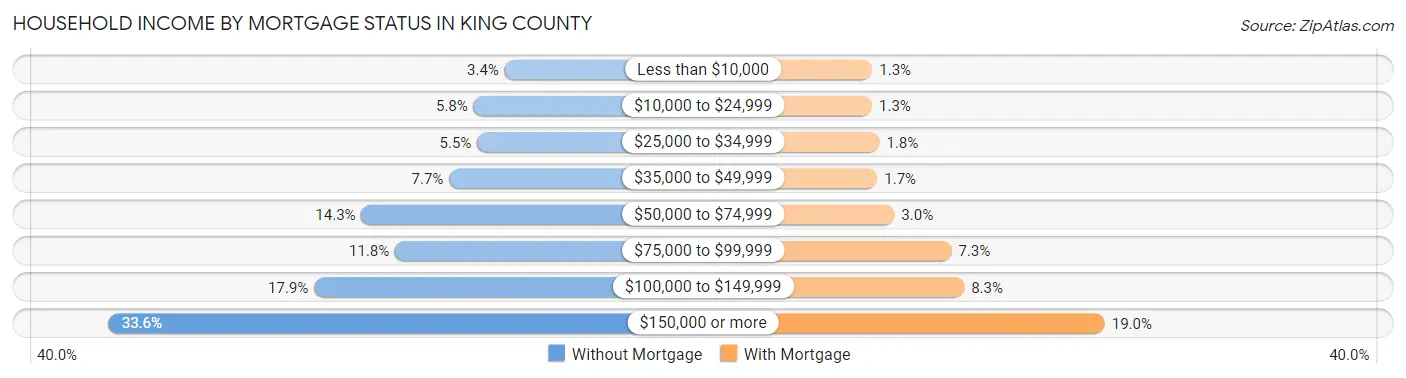
| Household Income | Without Mortgage | With Mortgage |
| Less than $10,000 | 5,182 (3.4%) | 4,657 (1.3%) |
| $10,000 to $24,999 | 8,776 (5.8%) | 4,566 (1.3%) |
| $25,000 to $34,999 | 8,364 (5.5%) | 6,646 (1.8%) |
| $35,000 to $49,999 | 11,589 (7.6%) | 6,021 (1.7%) |
| $50,000 to $74,999 | 21,729 (14.3%) | 10,747 (3.0%) |
| $75,000 to $99,999 | 17,846 (11.8%) | 26,550 (7.3%) |
| $100,000 to $149,999 | 27,185 (17.9%) | 30,106 (8.3%) |
| $150,000 or more | 50,894 (33.6%) | 69,024 (19.0%) |
| Total | 151,565 (100.0%) | 363,392 (100.0%) |
Property Value to Household Income Ratio in King County
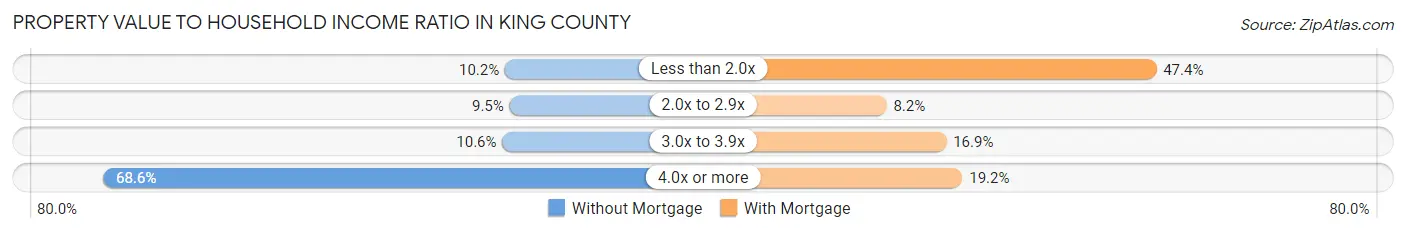
| Value-to-Income Ratio | Without Mortgage | With Mortgage |
| Less than 2.0x | 15,467 (10.2%) | 172,276 (47.4%) |
| 2.0x to 2.9x | 14,438 (9.5%) | 29,860 (8.2%) |
| 3.0x to 3.9x | 16,049 (10.6%) | 61,403 (16.9%) |
| 4.0x or more | 103,971 (68.6%) | 69,876 (19.2%) |
| Total | 151,565 (100.0%) | 363,392 (100.0%) |
Real Estate Taxes by Mortgage Status in King County
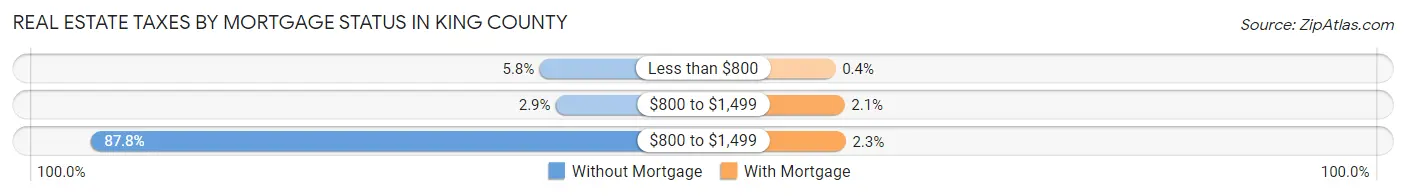
| Property Taxes | Without Mortgage | With Mortgage |
| Less than $800 | 8,851 (5.8%) | 1,453 (0.4%) |
| $800 to $1,499 | 4,354 (2.9%) | 7,514 (2.1%) |
| $800 to $1,499 | 133,093 (87.8%) | 8,258 (2.3%) |
| Total | 151,565 (100.0%) | 363,392 (100.0%) |
Health & Disability in King County
Health Insurance Coverage by Age in King County
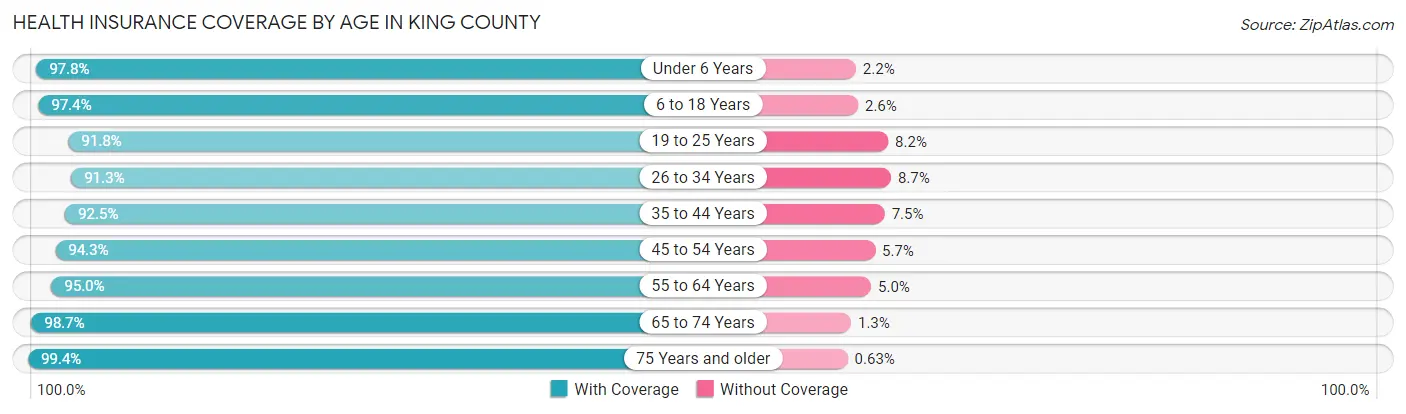
| Age Bracket | With Coverage | Without Coverage |
| Under 6 Years | 142,974 (97.8%) | 3,164 (2.2%) |
| 6 to 18 Years | 317,157 (97.4%) | 8,319 (2.6%) |
| 19 to 25 Years | 179,412 (91.8%) | 15,982 (8.2%) |
| 26 to 34 Years | 338,342 (91.3%) | 32,252 (8.7%) |
| 35 to 44 Years | 323,641 (92.5%) | 26,398 (7.5%) |
| 45 to 54 Years | 276,634 (94.3%) | 16,823 (5.7%) |
| 55 to 64 Years | 247,479 (95.0%) | 13,022 (5.0%) |
| 65 to 74 Years | 179,707 (98.7%) | 2,292 (1.3%) |
| 75 Years and older | 116,476 (99.4%) | 734 (0.6%) |
| Total | 2,121,822 (94.7%) | 118,986 (5.3%) |
Health Insurance Coverage by Citizenship Status in King County
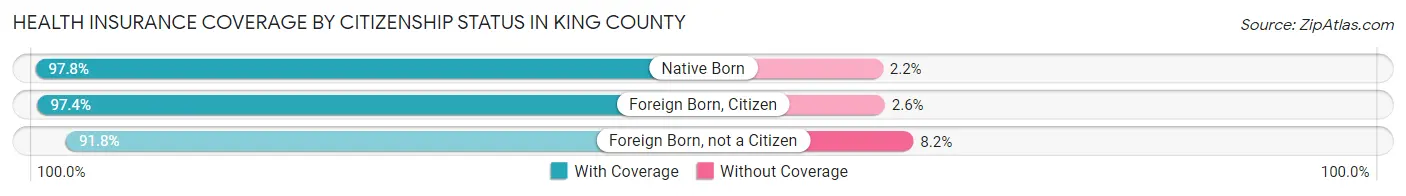
| Citizenship Status | With Coverage | Without Coverage |
| Native Born | 142,974 (97.8%) | 3,164 (2.2%) |
| Foreign Born, Citizen | 317,157 (97.4%) | 8,319 (2.6%) |
| Foreign Born, not a Citizen | 179,412 (91.8%) | 15,982 (8.2%) |
Health Insurance Coverage by Household Income in King County
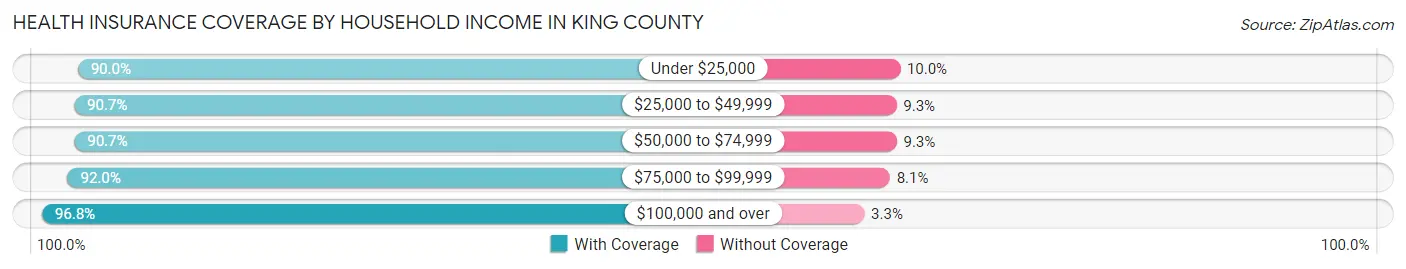
| Household Income | With Coverage | Without Coverage |
| Under $25,000 | 129,018 (90.0%) | 14,277 (10.0%) |
| $25,000 to $49,999 | 170,947 (90.7%) | 17,492 (9.3%) |
| $50,000 to $74,999 | 206,889 (90.7%) | 21,266 (9.3%) |
| $75,000 to $99,999 | 204,316 (91.9%) | 17,895 (8.1%) |
| $100,000 and over | 1,382,442 (96.8%) | 46,503 (3.3%) |
Public vs Private Health Insurance Coverage by Age in King County
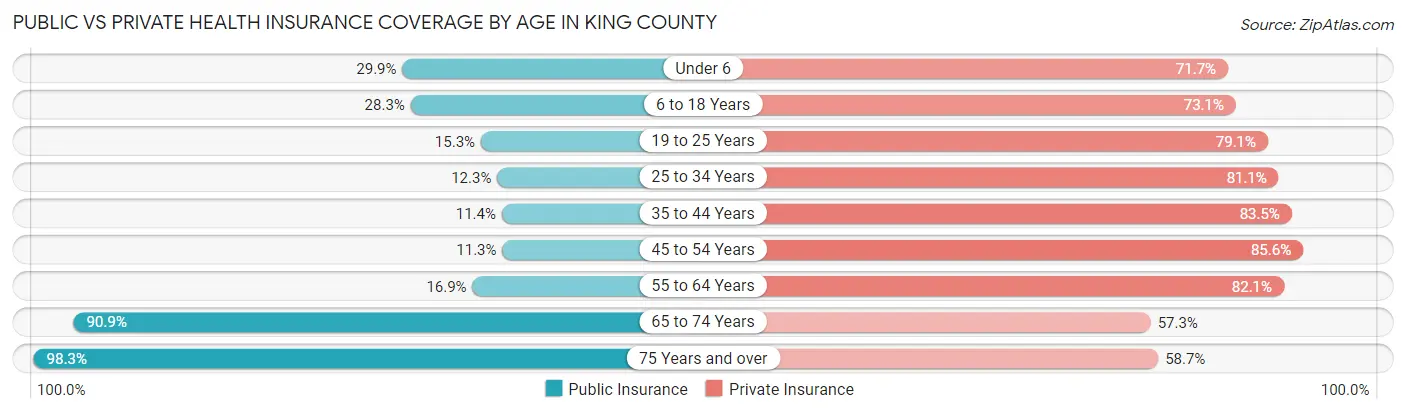
| Age Bracket | Public Insurance | Private Insurance |
| Under 6 | 43,662 (29.9%) | 104,738 (71.7%) |
| 6 to 18 Years | 92,231 (28.3%) | 237,976 (73.1%) |
| 19 to 25 Years | 29,898 (15.3%) | 154,510 (79.1%) |
| 25 to 34 Years | 45,461 (12.3%) | 300,519 (81.1%) |
| 35 to 44 Years | 39,986 (11.4%) | 292,281 (83.5%) |
| 45 to 54 Years | 33,216 (11.3%) | 251,195 (85.6%) |
| 55 to 64 Years | 43,950 (16.9%) | 213,736 (82.1%) |
| 65 to 74 Years | 165,475 (90.9%) | 104,350 (57.3%) |
| 75 Years and over | 115,238 (98.3%) | 68,842 (58.7%) |
| Total | 609,117 (27.2%) | 1,728,147 (77.1%) |
Disability Status by Sex by Age in King County
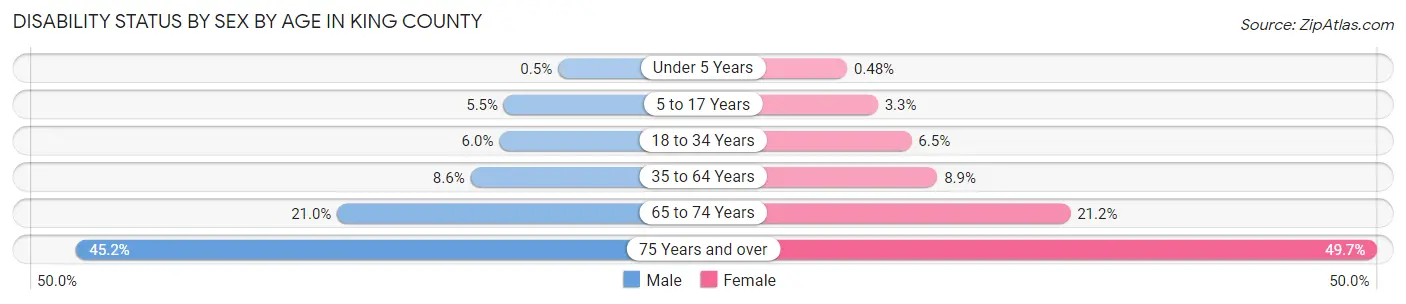
| Age Bracket | Male | Female |
| Under 5 Years | 313 (0.5%) | 285 (0.5%) |
| 5 to 17 Years | 9,105 (5.5%) | 5,264 (3.3%) |
| 18 to 34 Years | 18,329 (5.9%) | 18,406 (6.5%) |
| 35 to 64 Years | 40,147 (8.6%) | 38,822 (8.9%) |
| 65 to 74 Years | 18,108 (21.0%) | 20,291 (21.2%) |
| 75 Years and over | 21,932 (45.2%) | 34,132 (49.7%) |
Disability Class by Sex by Age in King County
Disability Class: Hearing Difficulty
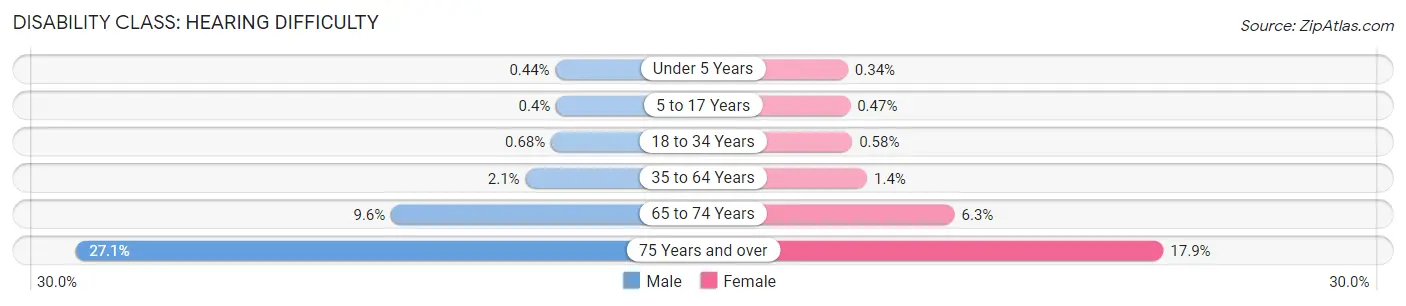
| Age Bracket | Male | Female |
| Under 5 Years | 273 (0.4%) | 199 (0.3%) |
| 5 to 17 Years | 661 (0.4%) | 739 (0.5%) |
| 18 to 34 Years | 2,079 (0.7%) | 1,658 (0.6%) |
| 35 to 64 Years | 9,811 (2.1%) | 6,202 (1.4%) |
| 65 to 74 Years | 8,270 (9.6%) | 6,011 (6.3%) |
| 75 Years and over | 13,163 (27.1%) | 12,302 (17.9%) |
Disability Class: Vision Difficulty
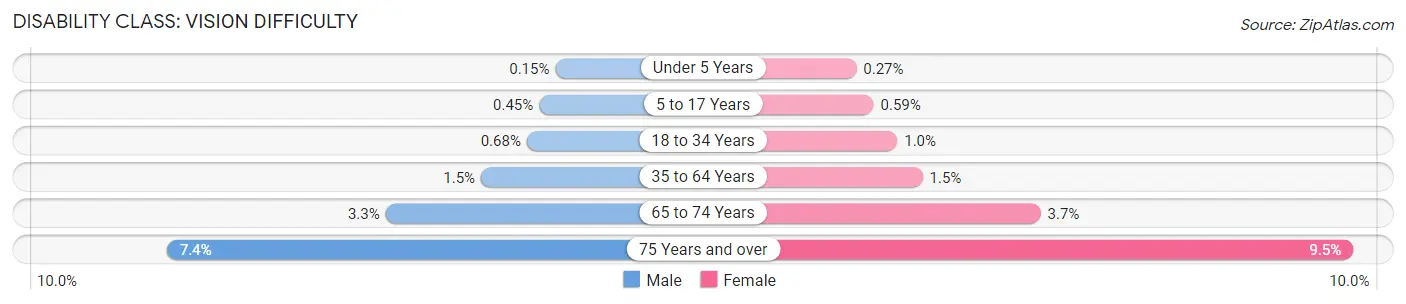
| Age Bracket | Male | Female |
| Under 5 Years | 92 (0.2%) | 162 (0.3%) |
| 5 to 17 Years | 738 (0.4%) | 941 (0.6%) |
| 18 to 34 Years | 2,084 (0.7%) | 2,926 (1.0%) |
| 35 to 64 Years | 7,138 (1.5%) | 6,592 (1.5%) |
| 65 to 74 Years | 2,851 (3.3%) | 3,537 (3.7%) |
| 75 Years and over | 3,572 (7.4%) | 6,519 (9.5%) |
Disability Class: Cognitive Difficulty
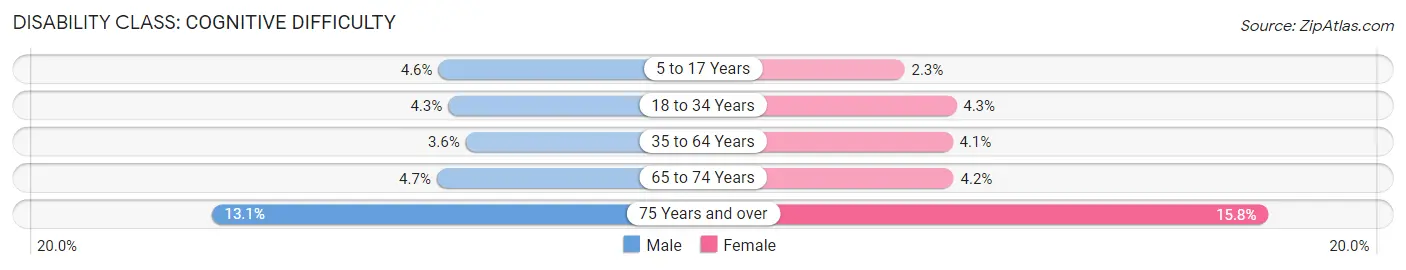
| Age Bracket | Male | Female |
| 5 to 17 Years | 7,660 (4.6%) | 3,688 (2.3%) |
| 18 to 34 Years | 13,191 (4.3%) | 12,087 (4.3%) |
| 35 to 64 Years | 16,892 (3.6%) | 18,022 (4.1%) |
| 65 to 74 Years | 4,058 (4.7%) | 3,974 (4.2%) |
| 75 Years and over | 6,337 (13.1%) | 10,874 (15.8%) |
Disability Class: Ambulatory Difficulty
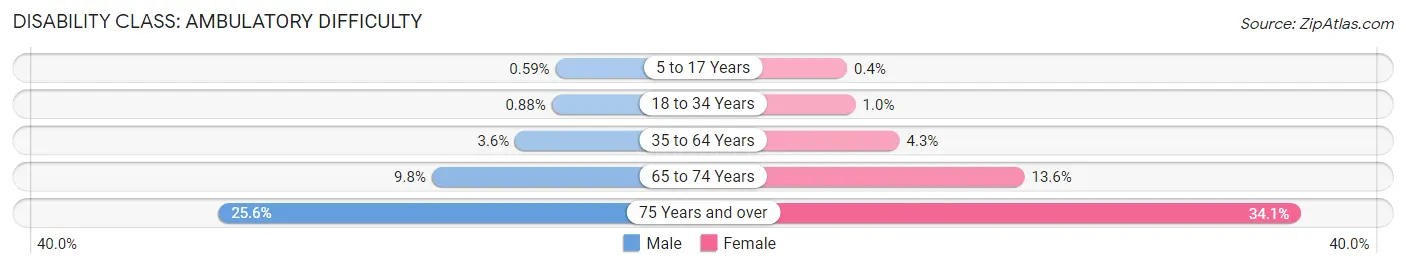
| Age Bracket | Male | Female |
| 5 to 17 Years | 974 (0.6%) | 631 (0.4%) |
| 18 to 34 Years | 2,706 (0.9%) | 2,935 (1.0%) |
| 35 to 64 Years | 16,668 (3.6%) | 18,824 (4.3%) |
| 65 to 74 Years | 8,431 (9.8%) | 12,987 (13.6%) |
| 75 Years and over | 12,435 (25.6%) | 23,416 (34.1%) |
Disability Class: Self-Care Difficulty
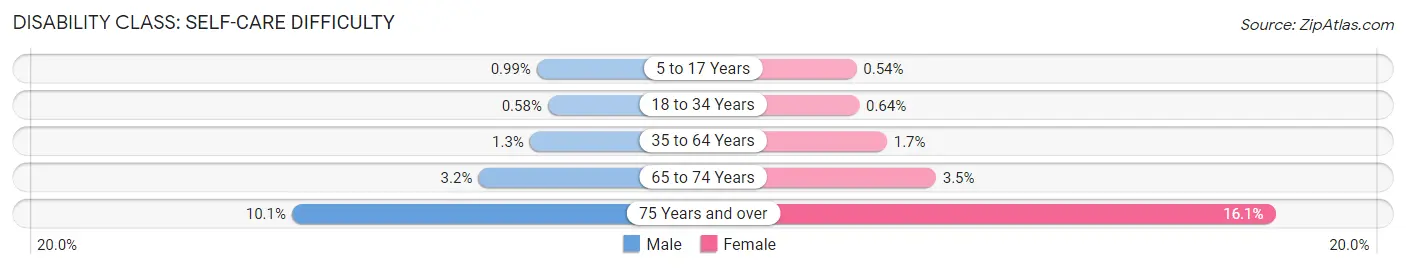
| Age Bracket | Male | Female |
| 5 to 17 Years | 1,627 (1.0%) | 862 (0.5%) |
| 18 to 34 Years | 1,777 (0.6%) | 1,813 (0.6%) |
| 35 to 64 Years | 5,841 (1.3%) | 7,301 (1.7%) |
| 65 to 74 Years | 2,724 (3.2%) | 3,344 (3.5%) |
| 75 Years and over | 4,892 (10.1%) | 11,052 (16.1%) |
Technology Access in King County
Computing Device Access in King County
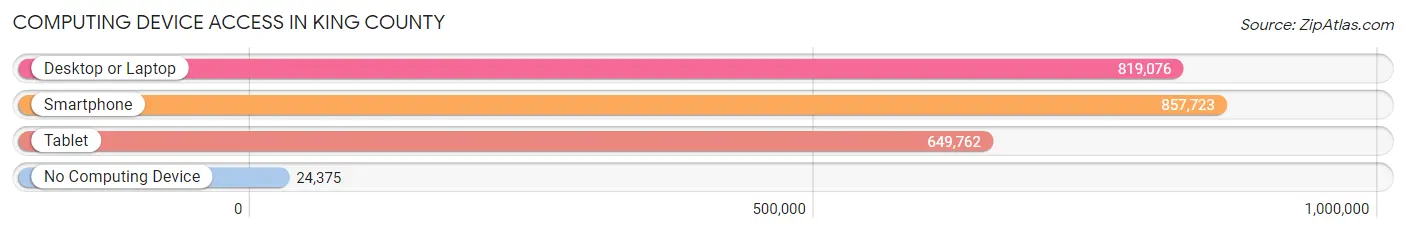
| Device Type | # Households | % Households |
| Desktop or Laptop | 819,076 | 89.4% |
| Smartphone | 857,723 | 93.6% |
| Tablet | 649,762 | 70.9% |
| No Computing Device | 24,375 | 2.7% |
| Total | 916,270 | 100.0% |
Internet Access in King County
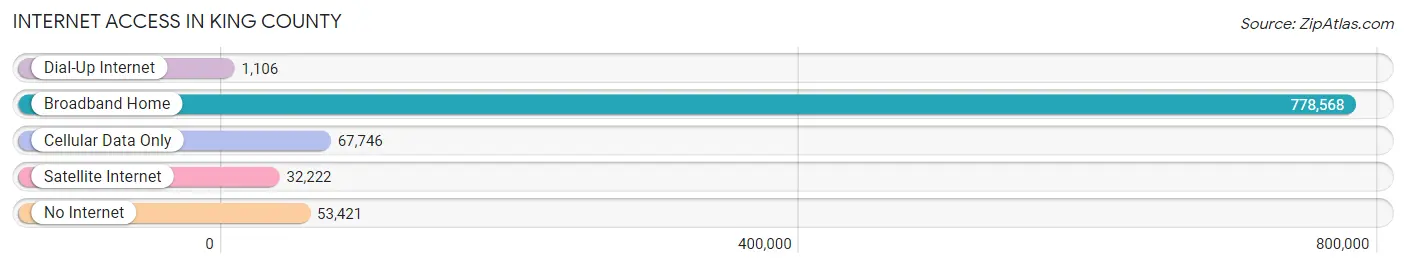
| Internet Type | # Households | % Households |
| Dial-Up Internet | 1,106 | 0.1% |
| Broadband Home | 778,568 | 85.0% |
| Cellular Data Only | 67,746 | 7.4% |
| Satellite Internet | 32,222 | 3.5% |
| No Internet | 53,421 | 5.8% |
| Total | 916,270 | 100.0% |
King County Summary
King County, Washington is located in the western part of the United States, in the state of Washington. It is the most populous county in the state, with a population of 2,252,782 as of the 2019 census. The county seat is Seattle, the largest city in the state. King County is bordered by Snohomish County to the north, Kitsap County to the west, Pierce County to the south, and the Cascade Range to the east.
History
The area that is now King County was first inhabited by Native American tribes, including the Duwamish, Muckleshoot, and Snoqualmie. The first European settlers arrived in the area in the late 1850s, and the county was officially established in 1852. The county was named after William Rufus King, the 13th Vice President of the United States.
In the late 19th century, the area experienced a population boom due to the arrival of the Great Northern Railway and the Seattle, Lake Shore and Eastern Railway. This led to the development of many towns and cities, including Seattle, Bellevue, and Redmond.
In the early 20th century, the county experienced rapid growth due to the arrival of the Boeing Company and the growth of the technology industry. This led to the development of many suburbs, including Kirkland, Issaquah, and Mercer Island.
Geography
King County covers an area of 2,307 square miles, making it the largest county in Washington. The county is located in the Puget Sound region of the Pacific Northwest, and is bordered by Snohomish County to the north, Kitsap County to the west, Pierce County to the south, and the Cascade Range to the east.
The county is home to several mountain ranges, including the Cascade Range, the Olympic Mountains, and the Olympic National Park. The county also contains several rivers, including the Snoqualmie River, the Skykomish River, and the Green River.
Economy
King County has a diverse economy, with major industries including technology, manufacturing, healthcare, retail, and tourism. The county is home to several major companies, including Amazon, Microsoft, Boeing, Starbucks, and Costco.
The county is also home to several major ports, including the Port of Seattle, the Port of Tacoma, and the Port of Everett. These ports are major hubs for international trade, and are responsible for billions of dollars in economic activity each year.
Demographics
As of the 2019 census, King County had a population of 2,252,782. The population is racially and ethnically diverse, with the largest racial/ethnic groups being White (63.2%), Asian (17.2%), Hispanic or Latino (9.2%), and Black or African American (5.3%).
The median household income in the county is $90,837, and the median home value is $541,400. The county also has a high rate of educational attainment, with 87.2% of adults having at least a high school diploma and 57.2% having a bachelor's degree or higher.
Conclusion
King County, Washington is a vibrant and diverse county located in the western part of the United States. It is the most populous county in the state, with a population of 2,252,782 as of the 2019 census. The county has a diverse economy, with major industries including technology, manufacturing, healthcare, retail, and tourism. The county is also racially and ethnically diverse, with the largest racial/ethnic groups being White, Asian, Hispanic or Latino, and Black or African American.
Common Questions
What is Per Capita Income in King County?
Per Capita income in King County is $66,811.
What is the Median Family Income in King County?
Median Family Income in King County is $146,231.
What is the Median Household income in King County?
Median Household Income in King County is $116,340.
What is Income or Wage Gap in King County?
Income or Wage Gap in King County is 32.1%.
Women in King County earn 67.9 cents for every dollar earned by a man.
What is Family Income Deficit in King County?
Family Income Deficit in King County is $11,159.
Families that are below poverty line in King County earn $11,159 less on average than the poverty threshold level.
What is Inequality or Gini Index in King County?
Inequality or Gini Index in King County is 0.48.
What is the Total Population of King County?
Total Population of King County is 2,254,371.
What is the Total Male Population of King County?
Total Male Population of King County is 1,143,593.
What is the Total Female Population of King County?
Total Female Population of King County is 1,110,778.
What is the Ratio of Males per 100 Females in King County?
There are 102.95 Males per 100 Females in King County.
What is the Ratio of Females per 100 Males in King County?
There are 97.13 Females per 100 Males in King County.
What is the Median Population Age in King County?
Median Population Age in King County is 37.2 Years.
What is the Average Family Size in King County
Average Family Size in King County is 3.1 People.
What is the Average Household Size in King County
Average Household Size in King County is 2.4 People.
How Large is the Labor Force in King County?
There are 1,299,748 People in the Labor Forcein in King County.
What is the Percentage of People in the Labor Force in King County?
70.0% of People are in the Labor Force in King County.
What is the Unemployment Rate in King County?
Unemployment Rate in King County is 4.5%.