Garfield County, WA Map & Demographics
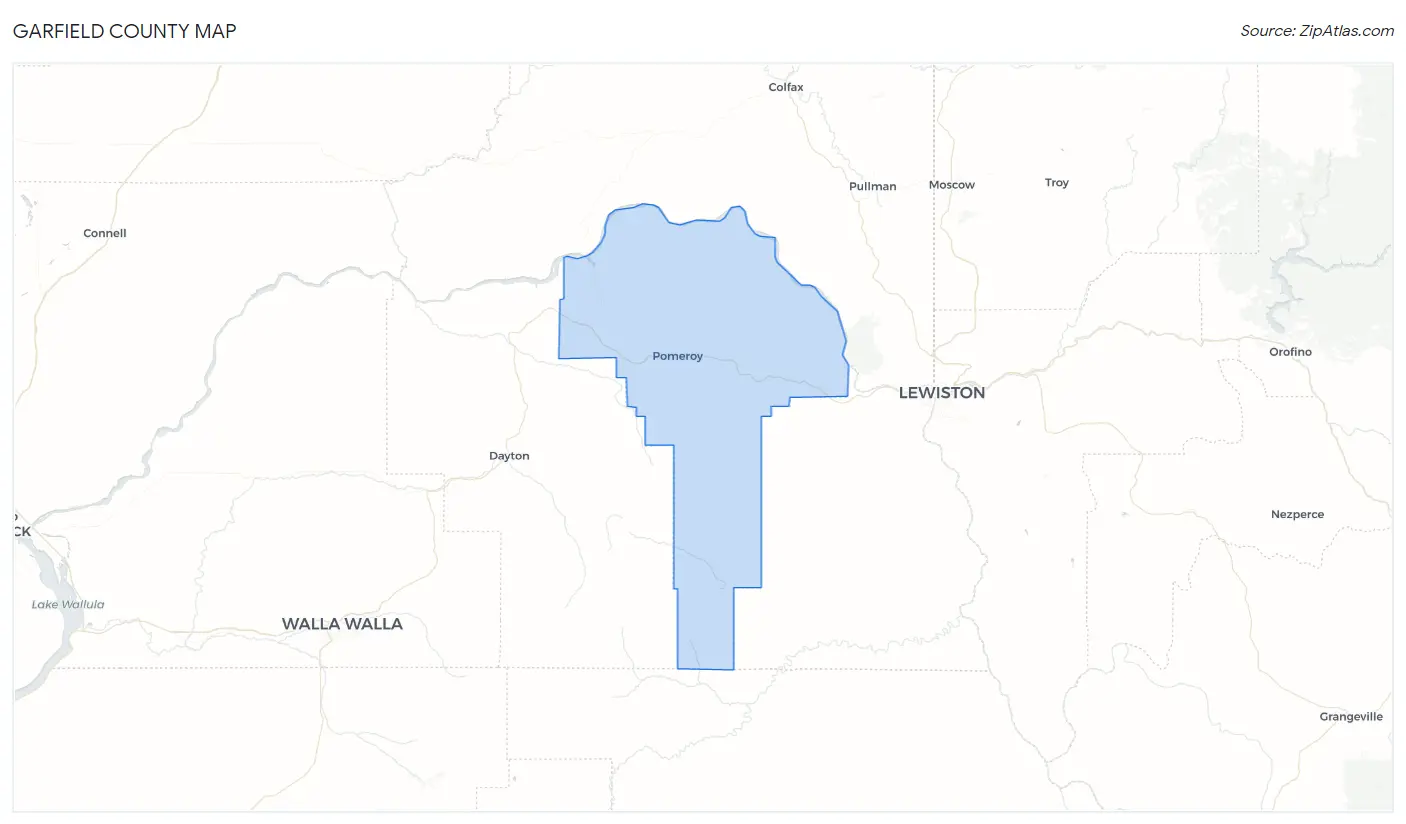
Garfield County Map
Garfield County Overview
$31,187
PER CAPITA INCOME
$77,629
AVG FAMILY INCOME
$57,958
AVG HOUSEHOLD INCOME
23.8%
WAGE / INCOME GAP [ % ]
76.2¢/ $1
WAGE / INCOME GAP [ $ ]
0.39
INEQUALITY / GINI INDEX
2,310
TOTAL POPULATION
1,174
MALE POPULATION
1,136
FEMALE POPULATION
103.35
MALES / 100 FEMALES
96.76
FEMALES / 100 MALES
49.9
MEDIAN AGE
2.8
AVG FAMILY SIZE
2.3
AVG HOUSEHOLD SIZE
972
LABOR FORCE [ PEOPLE ]
49.5%
PERCENT IN LABOR FORCE
6.5%
UNEMPLOYMENT RATE
Garfield County Area Codes
Income in Garfield County
Income Overview in Garfield County
Per Capita Income in Garfield County is $31,187, while median incomes of families and households are $77,629 and $57,958 respectively.
| Characteristic | Number | Measure |
| Per Capita Income | 2,310 | $31,187 |
| Median Family Income | 687 | $77,629 |
| Mean Family Income | 687 | $83,004 |
| Median Household Income | 1,009 | $57,958 |
| Mean Household Income | 1,009 | $70,817 |
| Income Deficit | 687 | $0 |
| Wage / Income Gap (%) | 2,310 | 23.84% |
| Wage / Income Gap ($) | 2,310 | 76.16¢ per $1 |
| Gini / Inequality Index | 2,310 | 0.39 |
Earnings by Sex in Garfield County
Average Earnings in Garfield County are $39,274, $41,689 for men and $31,750 for women, a difference of 23.8%.
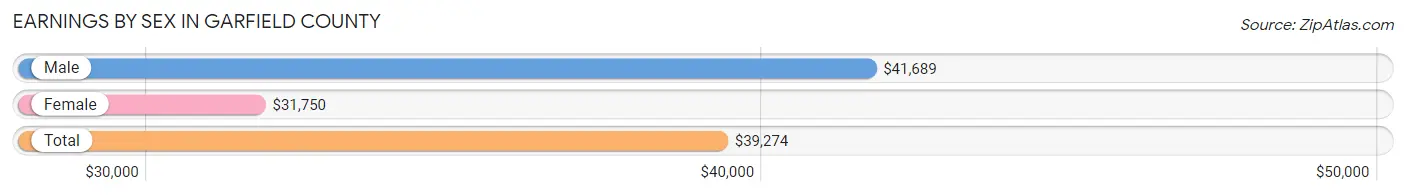
| Sex | Number | Average Earnings |
| Male | 698 (63.3%) | $41,689 |
| Female | 404 (36.7%) | $31,750 |
| Total | 1,102 (100.0%) | $39,274 |
Earnings by Sex by Income Bracket in Garfield County
The most common earnings brackets in Garfield County are $75,000 to $99,999 for men (94 | 13.5%) and $30,000 to $34,999 for women (45 | 11.1%).
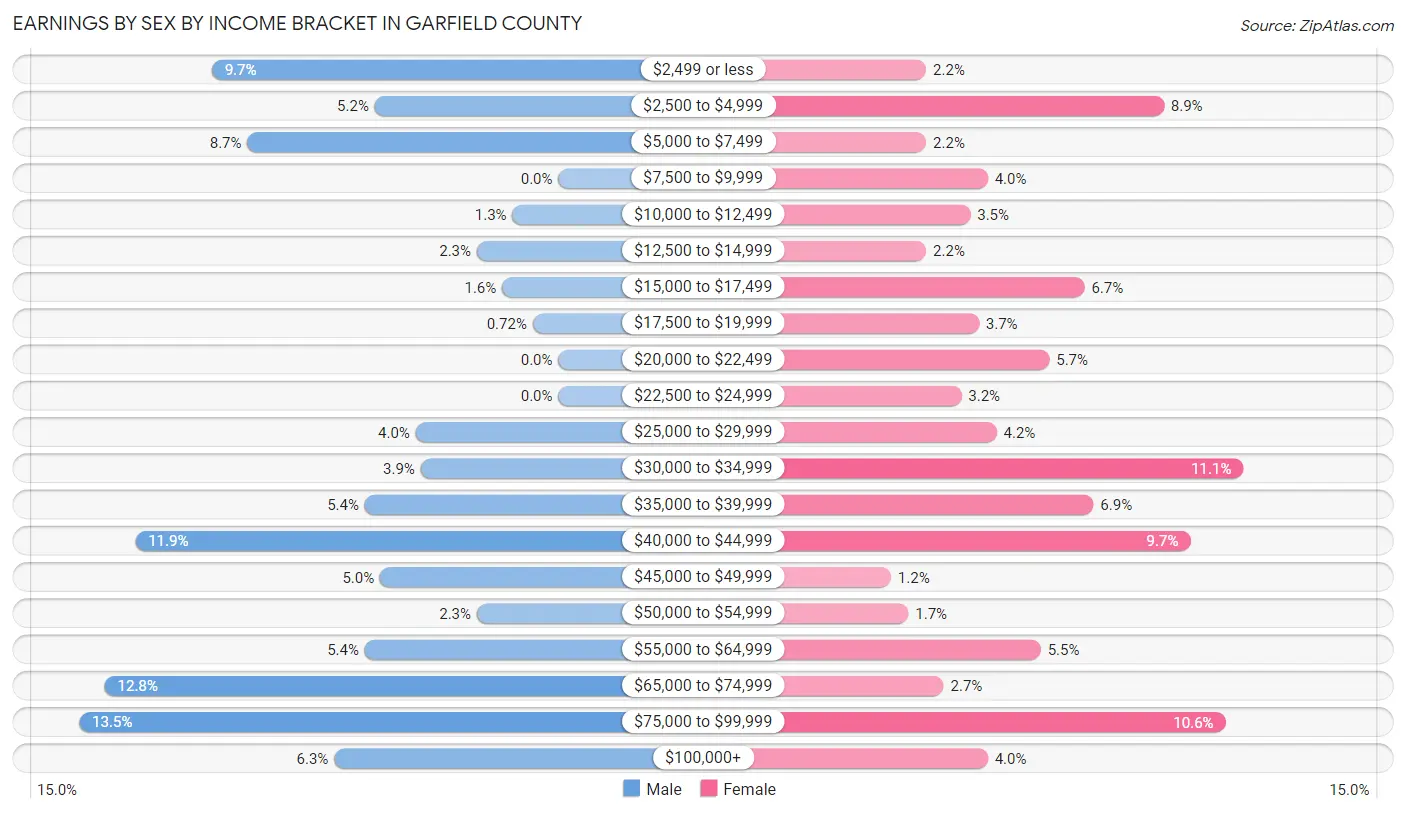
| Income | Male | Female |
| $2,499 or less | 68 (9.7%) | 9 (2.2%) |
| $2,500 to $4,999 | 36 (5.2%) | 36 (8.9%) |
| $5,000 to $7,499 | 61 (8.7%) | 9 (2.2%) |
| $7,500 to $9,999 | 0 (0.0%) | 16 (4.0%) |
| $10,000 to $12,499 | 9 (1.3%) | 14 (3.5%) |
| $12,500 to $14,999 | 16 (2.3%) | 9 (2.2%) |
| $15,000 to $17,499 | 11 (1.6%) | 27 (6.7%) |
| $17,500 to $19,999 | 5 (0.7%) | 15 (3.7%) |
| $20,000 to $22,499 | 0 (0.0%) | 23 (5.7%) |
| $22,500 to $24,999 | 0 (0.0%) | 13 (3.2%) |
| $25,000 to $29,999 | 28 (4.0%) | 17 (4.2%) |
| $30,000 to $34,999 | 27 (3.9%) | 45 (11.1%) |
| $35,000 to $39,999 | 38 (5.4%) | 28 (6.9%) |
| $40,000 to $44,999 | 83 (11.9%) | 39 (9.7%) |
| $45,000 to $49,999 | 35 (5.0%) | 5 (1.2%) |
| $50,000 to $54,999 | 16 (2.3%) | 7 (1.7%) |
| $55,000 to $64,999 | 38 (5.4%) | 22 (5.4%) |
| $65,000 to $74,999 | 89 (12.8%) | 11 (2.7%) |
| $75,000 to $99,999 | 94 (13.5%) | 43 (10.6%) |
| $100,000+ | 44 (6.3%) | 16 (4.0%) |
| Total | 698 (100.0%) | 404 (100.0%) |
Earnings by Sex by Educational Attainment in Garfield County
Average earnings in Garfield County are $48,450 for men and $33,400 for women, a difference of 31.1%. Men with an educational attainment of graduate degree enjoy the highest average annual earnings of $65,679, while those with less than high school education earn the least with $40,938. Women with an educational attainment of graduate degree earn the most with the average annual earnings of $65,313, while those with college or associate's degree education have the smallest earnings of $23,654.
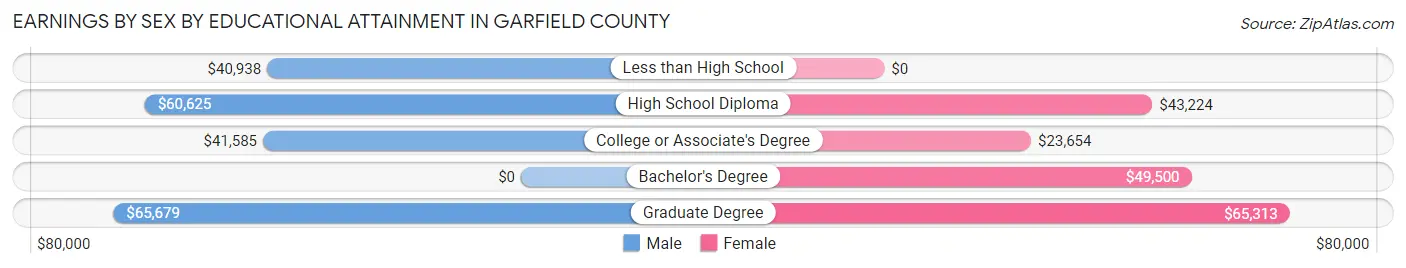
| Educational Attainment | Male Income | Female Income |
| Less than High School | $40,938 | $0 |
| High School Diploma | $60,625 | $43,224 |
| College or Associate's Degree | $41,585 | $23,654 |
| Bachelor's Degree | - | - |
| Graduate Degree | $65,679 | $65,313 |
| Total | $48,450 | $33,400 |
Family Income in Garfield County
Family Income Brackets in Garfield County
According to the Garfield County family income data, there are 174 families falling into the $75,000 to $99,999 income range, which is the most common income bracket and makes up 25.3% of all families.
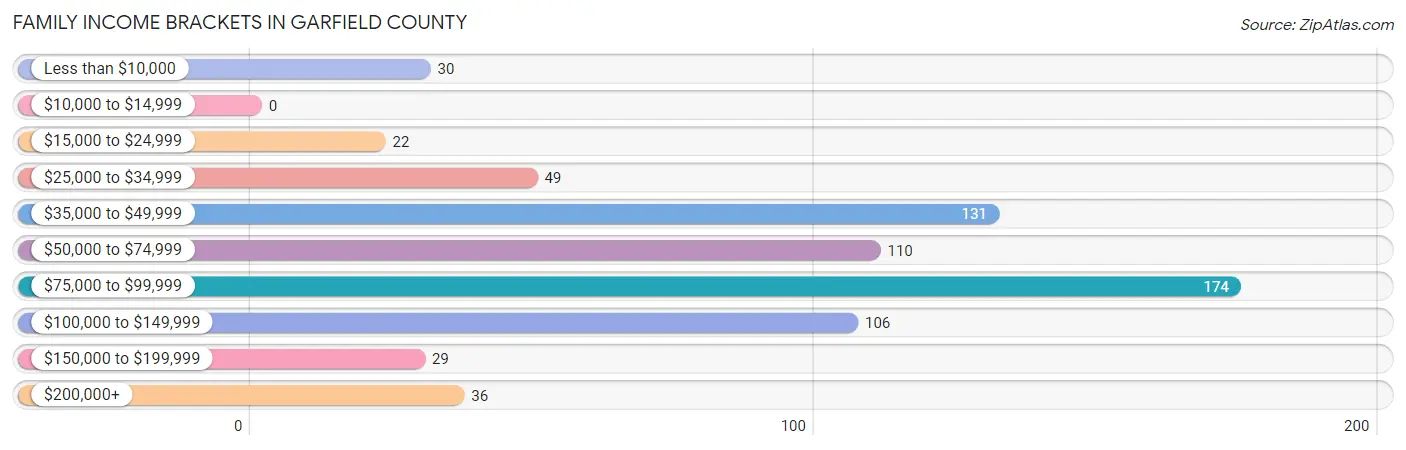
| Income Bracket | # Families | % Families |
| Less than $10,000 | 30 | 4.4% |
| $10,000 to $14,999 | 0 | 0.0% |
| $15,000 to $24,999 | 22 | 3.2% |
| $25,000 to $34,999 | 49 | 7.1% |
| $35,000 to $49,999 | 131 | 19.1% |
| $50,000 to $74,999 | 110 | 16.0% |
| $75,000 to $99,999 | 174 | 25.3% |
| $100,000 to $149,999 | 106 | 15.4% |
| $150,000 to $199,999 | 29 | 4.2% |
| $200,000+ | 36 | 5.2% |
Family Income by Famaliy Size in Garfield County
3-person families (120 | 17.5%) account for the highest median family income in Garfield County with $96,944 per family, while 3-person families (120 | 17.5%) have the highest median income of $32,315 per family member.
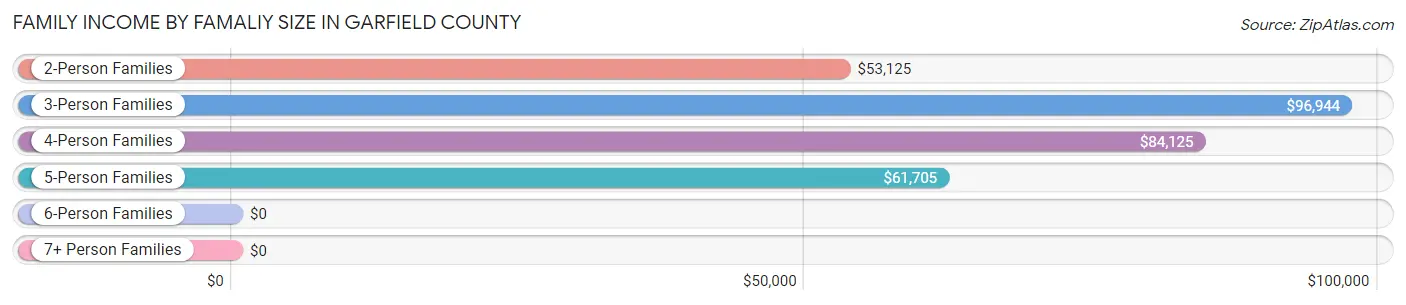
| Income Bracket | # Families | Median Income |
| 2-Person Families | 400 (58.2%) | $53,125 |
| 3-Person Families | 120 (17.5%) | $96,944 |
| 4-Person Families | 63 (9.2%) | $84,125 |
| 5-Person Families | 83 (12.1%) | $61,705 |
| 6-Person Families | 20 (2.9%) | $0 |
| 7+ Person Families | 1 (0.2%) | $0 |
| Total | 687 (100.0%) | $77,629 |
Family Income by Number of Earners in Garfield County
The median family income in Garfield County is $77,629, with families comprising 3+ earners (47) having the highest median family income of $125,521, while families with no earners (148) have the lowest median family income of $41,833, accounting for 6.8% and 21.5% of families, respectively.
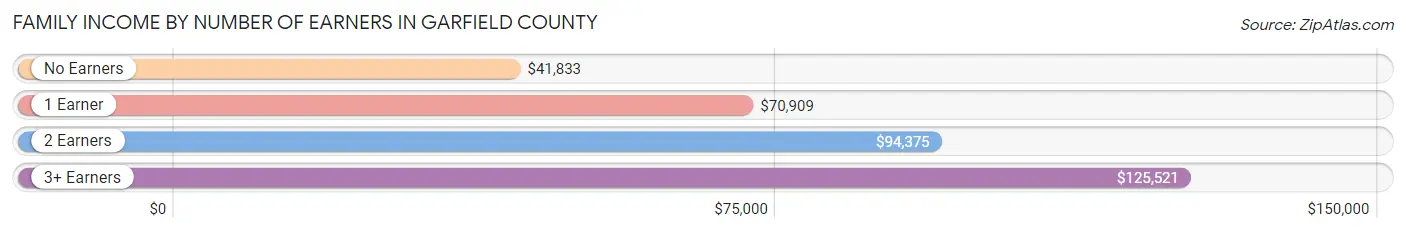
| Number of Earners | # Families | Median Income |
| No Earners | 148 (21.5%) | $41,833 |
| 1 Earner | 258 (37.6%) | $70,909 |
| 2 Earners | 234 (34.1%) | $94,375 |
| 3+ Earners | 47 (6.8%) | $125,521 |
| Total | 687 (100.0%) | $77,629 |
Household Income in Garfield County
Household Income Brackets in Garfield County
With 193 households falling in the category, the $75,000 to $99,999 income range is the most frequent in Garfield County, accounting for 19.1% of all households. In contrast, only 36 households (3.6%) fall into the $200,000+ income bracket, making it the least populous group.
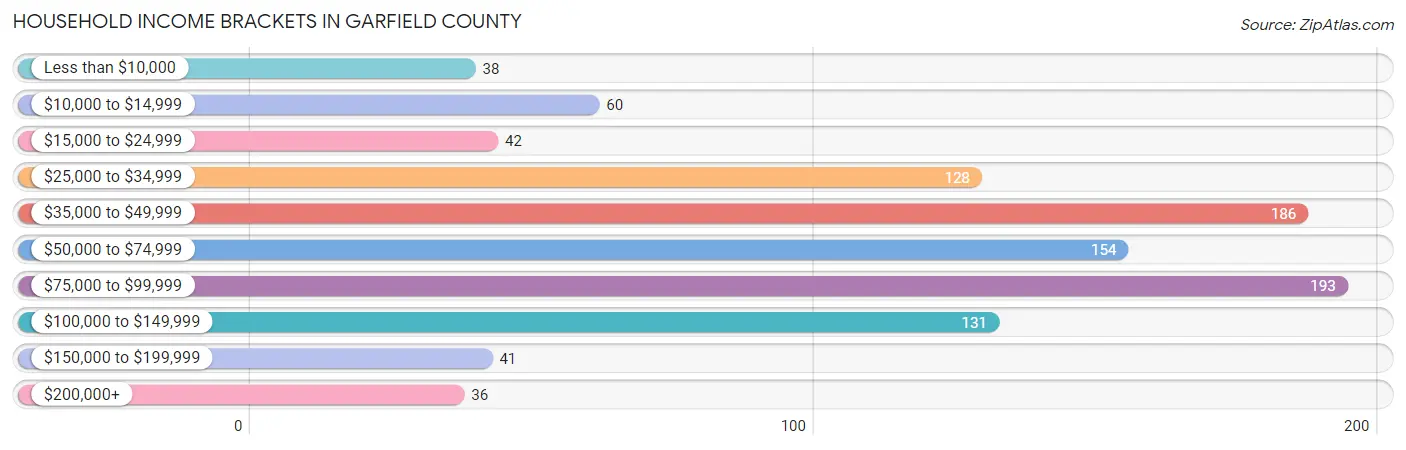
| Income Bracket | # Households | % Households |
| Less than $10,000 | 38 | 3.8% |
| $10,000 to $14,999 | 60 | 5.9% |
| $15,000 to $24,999 | 42 | 4.2% |
| $25,000 to $34,999 | 128 | 12.7% |
| $35,000 to $49,999 | 186 | 18.4% |
| $50,000 to $74,999 | 154 | 15.3% |
| $75,000 to $99,999 | 193 | 19.1% |
| $100,000 to $149,999 | 131 | 13.0% |
| $150,000 to $199,999 | 41 | 4.1% |
| $200,000+ | 36 | 3.6% |
Household Income by Householder Age in Garfield County
The median household income in Garfield County is $57,958, with the highest median household income of $84,125 found in the 25 to 44 years age bracket for the primary householder. A total of 227 households (22.5%) fall into this category. Meanwhile, the 15 to 24 years age bracket for the primary householder has the lowest median household income of $0, with 22 households (2.2%) in this group.
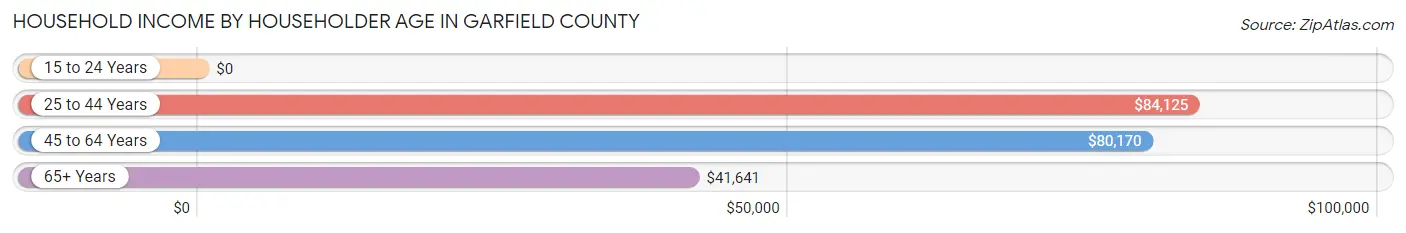
| Income Bracket | # Households | Median Income |
| 15 to 24 Years | 22 (2.2%) | $0 |
| 25 to 44 Years | 227 (22.5%) | $84,125 |
| 45 to 64 Years | 345 (34.2%) | $80,170 |
| 65+ Years | 415 (41.1%) | $41,641 |
| Total | 1,009 (100.0%) | $57,958 |
Poverty in Garfield County
Income Below Poverty by Sex and Age in Garfield County
With 10.3% poverty level for males and 12.0% for females among the residents of Garfield County, 5 year old males and 12 to 14 year old females are the most vulnerable to poverty, with 14 males (100.0%) and 5 females (45.5%) in their respective age groups living below the poverty level.
| Age Bracket | Male | Female |
| Under 5 Years | 0 (0.0%) | 18 (30.5%) |
| 5 Years | 14 (100.0%) | 0 (0.0%) |
| 6 to 11 Years | 0 (0.0%) | 14 (15.2%) |
| 12 to 14 Years | 2 (4.3%) | 5 (45.5%) |
| 15 Years | 8 (57.1%) | 0 (0.0%) |
| 16 and 17 Years | 0 (0.0%) | 11 (20.7%) |
| 18 to 24 Years | 11 (9.1%) | 0 (0.0%) |
| 25 to 34 Years | 31 (38.8%) | 28 (23.7%) |
| 35 to 44 Years | 2 (1.7%) | 13 (9.5%) |
| 45 to 54 Years | 11 (10.5%) | 23 (16.3%) |
| 55 to 64 Years | 10 (4.8%) | 14 (10.4%) |
| 65 to 74 Years | 27 (14.7%) | 9 (4.3%) |
| 75 Years and over | 3 (2.5%) | 0 (0.0%) |
| Total | 119 (10.3%) | 135 (12.0%) |
Income Above Poverty by Sex and Age in Garfield County
According to the poverty statistics in Garfield County, males aged under 5 years and females aged 5 years are the age groups that are most secure financially, with 100.0% of males and 100.0% of females in these age groups living above the poverty line.
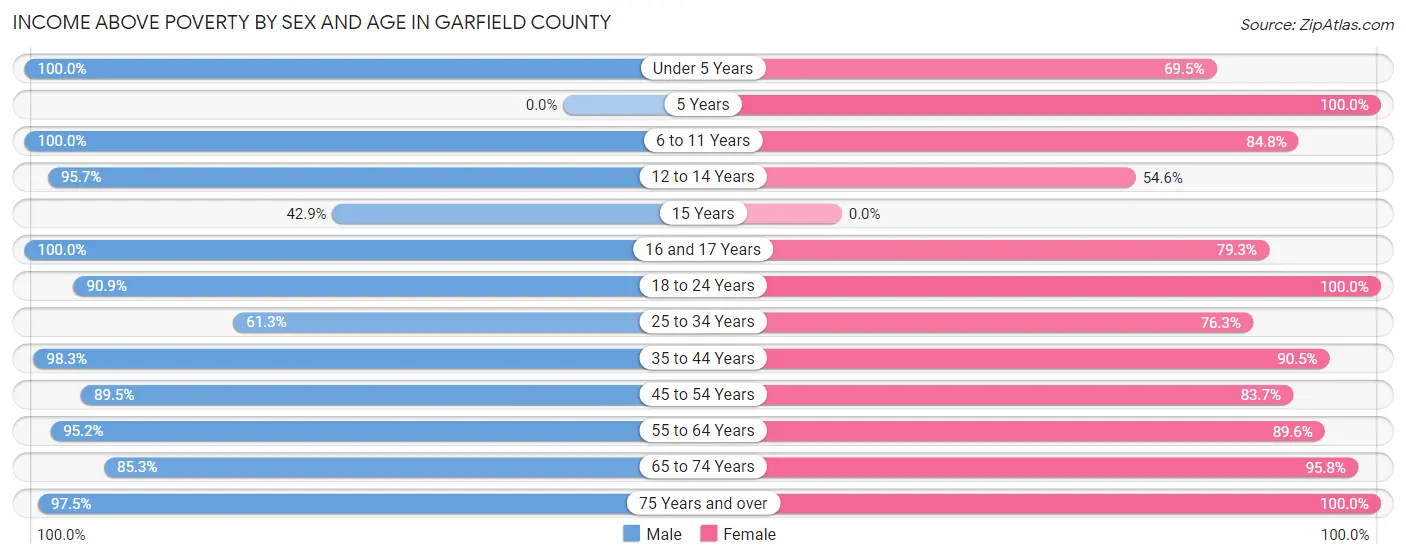
| Age Bracket | Male | Female |
| Under 5 Years | 47 (100.0%) | 41 (69.5%) |
| 5 Years | 0 (0.0%) | 15 (100.0%) |
| 6 to 11 Years | 45 (100.0%) | 78 (84.8%) |
| 12 to 14 Years | 44 (95.7%) | 6 (54.5%) |
| 15 Years | 6 (42.9%) | 0 (0.0%) |
| 16 and 17 Years | 51 (100.0%) | 42 (79.2%) |
| 18 to 24 Years | 110 (90.9%) | 43 (100.0%) |
| 25 to 34 Years | 49 (61.3%) | 90 (76.3%) |
| 35 to 44 Years | 117 (98.3%) | 124 (90.5%) |
| 45 to 54 Years | 94 (89.5%) | 118 (83.7%) |
| 55 to 64 Years | 200 (95.2%) | 121 (89.6%) |
| 65 to 74 Years | 156 (85.3%) | 203 (95.8%) |
| 75 Years and over | 117 (97.5%) | 109 (100.0%) |
| Total | 1,036 (89.7%) | 990 (88.0%) |
Income Below Poverty Among Married-Couple Families in Garfield County
The poverty statistics for married-couple families in Garfield County show that 5.1% or 32 of the total 624 families live below the poverty line. Families with 5 or more children have the highest poverty rate of 100.0%, comprising of 1 families. On the other hand, families with 1 or 2 children have the lowest poverty rate of 0.0%, which includes 0 families.
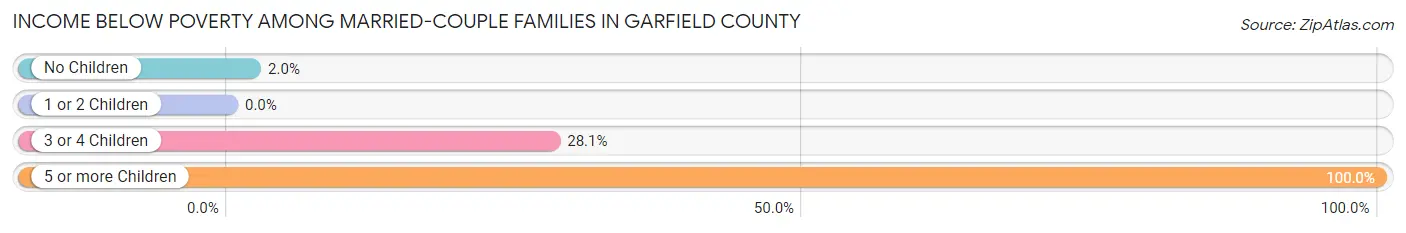
| Children | Above Poverty | Below Poverty |
| No Children | 391 (98.0%) | 8 (2.0%) |
| 1 or 2 Children | 142 (100.0%) | 0 (0.0%) |
| 3 or 4 Children | 59 (72.0%) | 23 (28.1%) |
| 5 or more Children | 0 (0.0%) | 1 (100.0%) |
| Total | 592 (94.9%) | 32 (5.1%) |
Income Below Poverty Among Single-Parent Households in Garfield County
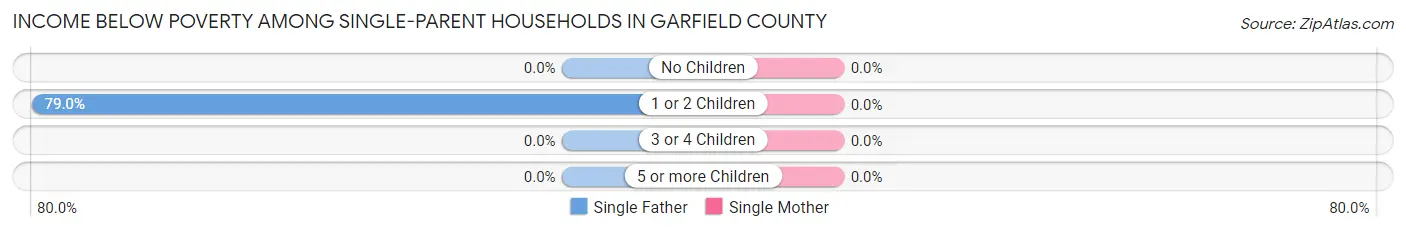
| Children | Single Father | Single Mother |
| No Children | 0 (0.0%) | 0 (0.0%) |
| 1 or 2 Children | 15 (78.9%) | 0 (0.0%) |
| 3 or 4 Children | 0 (0.0%) | 0 (0.0%) |
| 5 or more Children | 0 (0.0%) | 0 (0.0%) |
| Total | 15 (57.7%) | 0 (0.0%) |
Income Below Poverty Among Married-Couple vs Single-Parent Households in Garfield County
The poverty data for Garfield County shows that 32 of the married-couple family households (5.1%) and 15 of the single-parent households (23.8%) are living below the poverty level. Within the married-couple family households, those with 5 or more children have the highest poverty rate, with 1 households (100.0%) falling below the poverty line. Among the single-parent households, those with 1 or 2 children have the highest poverty rate, with 15 household (65.2%) living below poverty.
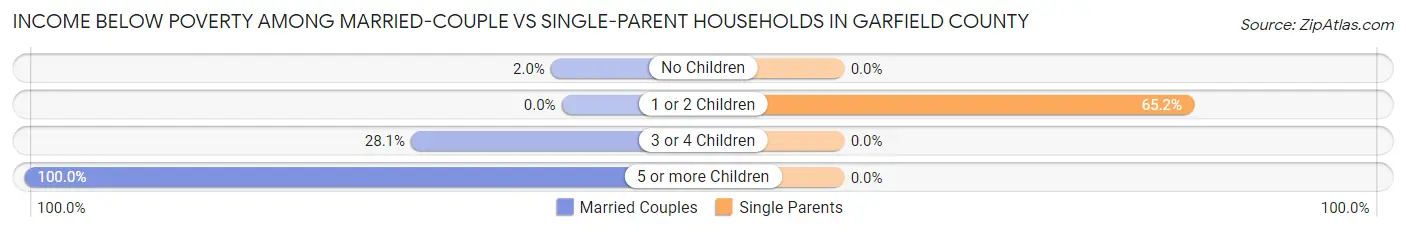
| Children | Married-Couple Families | Single-Parent Households |
| No Children | 8 (2.0%) | 0 (0.0%) |
| 1 or 2 Children | 0 (0.0%) | 15 (65.2%) |
| 3 or 4 Children | 23 (28.1%) | 0 (0.0%) |
| 5 or more Children | 1 (100.0%) | 0 (0.0%) |
| Total | 32 (5.1%) | 15 (23.8%) |
Race in Garfield County
The most populous races in Garfield County are White / Caucasian (2,085 | 90.3%), Two or more Races (138 | 6.0%), and Hispanic or Latino (87 | 3.8%).
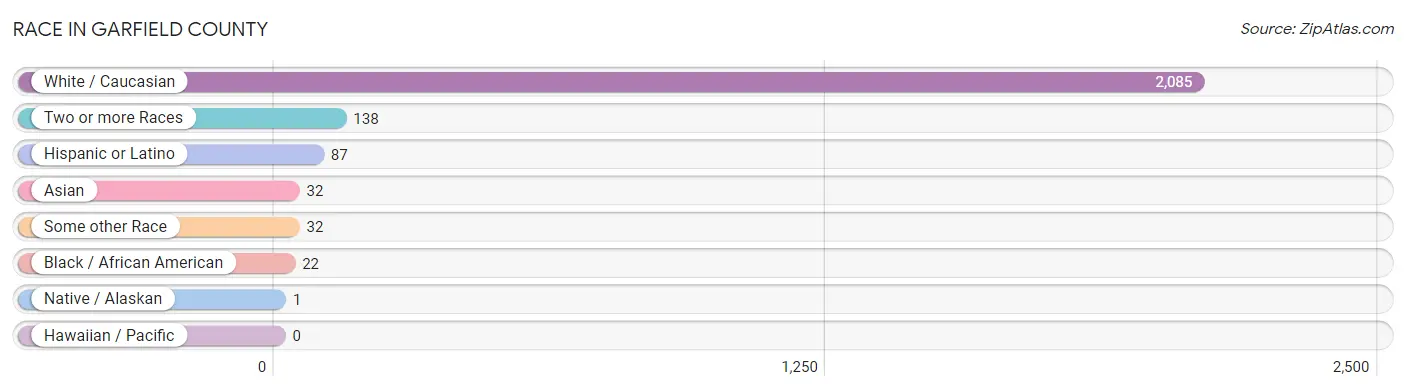
| Race | # Population | % Population |
| Asian | 32 | 1.4% |
| Black / African American | 22 | 0.9% |
| Hawaiian / Pacific | 0 | 0.0% |
| Hispanic or Latino | 87 | 3.8% |
| Native / Alaskan | 1 | 0.0% |
| White / Caucasian | 2,085 | 90.3% |
| Two or more Races | 138 | 6.0% |
| Some other Race | 32 | 1.4% |
| Total | 2,310 | 100.0% |
Ancestry in Garfield County
The most populous ancestries reported in Garfield County are German (425 | 18.4%), Irish (340 | 14.7%), English (322 | 13.9%), American (136 | 5.9%), and Norwegian (78 | 3.4%), together accounting for 56.3% of all Garfield County residents.
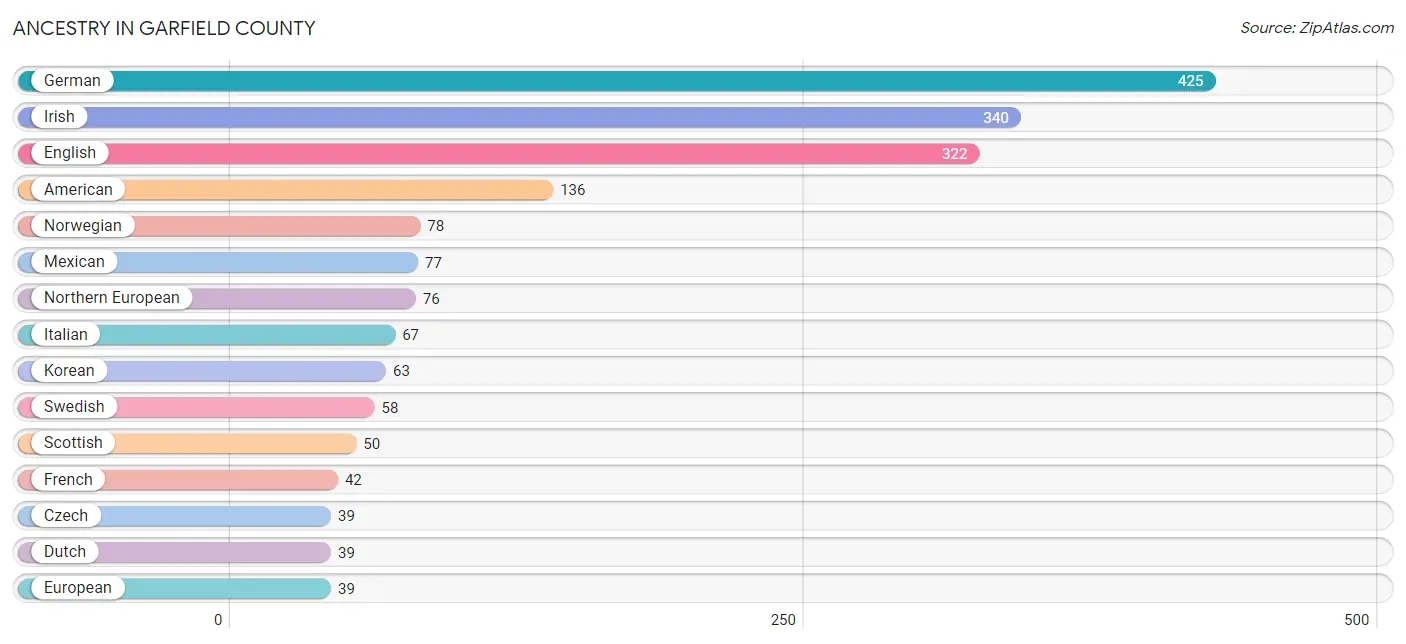
| Ancestry | # Population | % Population |
| American | 136 | 5.9% |
| Arab | 9 | 0.4% |
| Austrian | 16 | 0.7% |
| Bhutanese | 6 | 0.3% |
| British | 11 | 0.5% |
| Burmese | 6 | 0.3% |
| Czech | 39 | 1.7% |
| Danish | 6 | 0.3% |
| Dutch | 39 | 1.7% |
| Egyptian | 9 | 0.4% |
| English | 322 | 13.9% |
| European | 39 | 1.7% |
| Finnish | 6 | 0.3% |
| French | 42 | 1.8% |
| German | 425 | 18.4% |
| Irish | 340 | 14.7% |
| Italian | 67 | 2.9% |
| Korean | 63 | 2.7% |
| Lithuanian | 5 | 0.2% |
| Mexican | 77 | 3.3% |
| Mexican American Indian | 1 | 0.0% |
| Northern European | 76 | 3.3% |
| Norwegian | 78 | 3.4% |
| Peruvian | 5 | 0.2% |
| Polish | 15 | 0.6% |
| Puget Sound Salish | 3 | 0.1% |
| Romanian | 18 | 0.8% |
| Scandinavian | 29 | 1.3% |
| Scotch-Irish | 37 | 1.6% |
| Scottish | 50 | 2.2% |
| Sioux | 10 | 0.4% |
| South American | 5 | 0.2% |
| Spaniard | 5 | 0.2% |
| Swedish | 58 | 2.5% |
| Swiss | 10 | 0.4% |
| Welsh | 8 | 0.4% | View All 36 Rows |
Immigrants in Garfield County
The most numerous immigrant groups reported in Garfield County came from Asia (32 | 1.4%), Philippines (32 | 1.4%), and South Eastern Asia (32 | 1.4%), together accounting for 4.2% of all Garfield County residents.
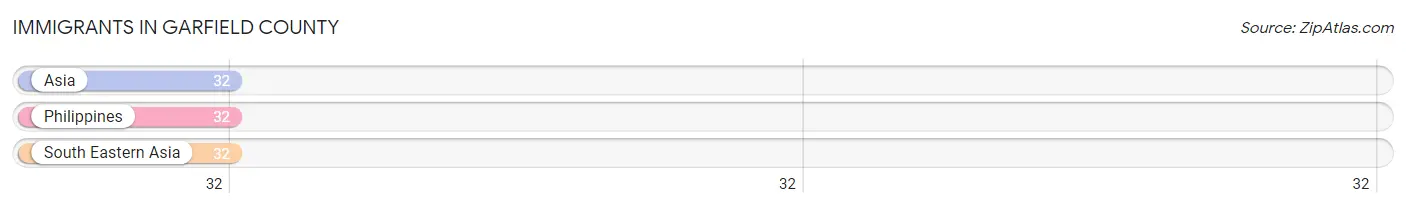
| Immigration Origin | # Population | % Population |
| Asia | 32 | 1.4% |
| Philippines | 32 | 1.4% |
| South Eastern Asia | 32 | 1.4% | View All 3 Rows |
Sex and Age in Garfield County
Sex and Age in Garfield County
The most populous age groups in Garfield County are 60 to 64 Years (185 | 15.8%) for men and 70 to 74 Years (128 | 11.3%) for women.
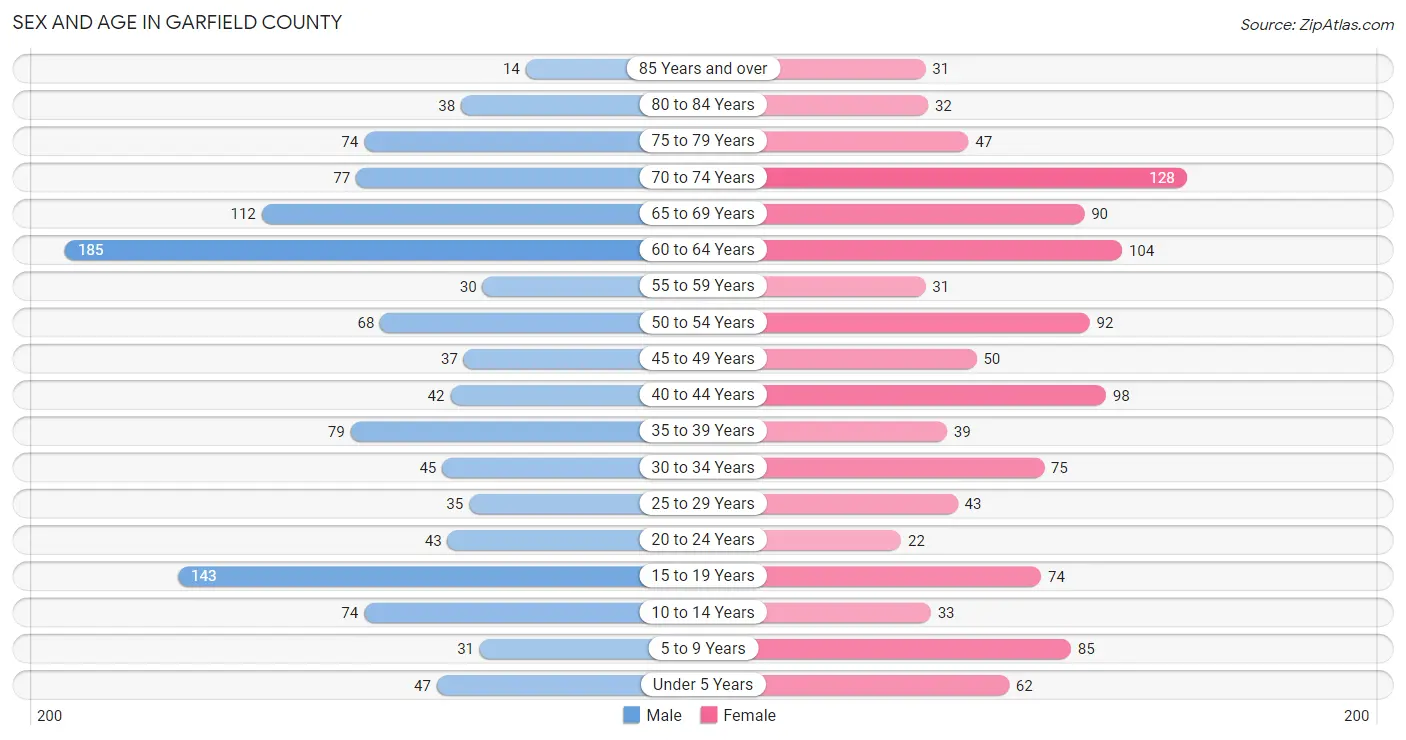
| Age Bracket | Male | Female |
| Under 5 Years | 47 (4.0%) | 62 (5.5%) |
| 5 to 9 Years | 31 (2.6%) | 85 (7.5%) |
| 10 to 14 Years | 74 (6.3%) | 33 (2.9%) |
| 15 to 19 Years | 143 (12.2%) | 74 (6.5%) |
| 20 to 24 Years | 43 (3.7%) | 22 (1.9%) |
| 25 to 29 Years | 35 (3.0%) | 43 (3.8%) |
| 30 to 34 Years | 45 (3.8%) | 75 (6.6%) |
| 35 to 39 Years | 79 (6.7%) | 39 (3.4%) |
| 40 to 44 Years | 42 (3.6%) | 98 (8.6%) |
| 45 to 49 Years | 37 (3.2%) | 50 (4.4%) |
| 50 to 54 Years | 68 (5.8%) | 92 (8.1%) |
| 55 to 59 Years | 30 (2.6%) | 31 (2.7%) |
| 60 to 64 Years | 185 (15.8%) | 104 (9.1%) |
| 65 to 69 Years | 112 (9.5%) | 90 (7.9%) |
| 70 to 74 Years | 77 (6.6%) | 128 (11.3%) |
| 75 to 79 Years | 74 (6.3%) | 47 (4.1%) |
| 80 to 84 Years | 38 (3.2%) | 32 (2.8%) |
| 85 Years and over | 14 (1.2%) | 31 (2.7%) |
| Total | 1,174 (100.0%) | 1,136 (100.0%) |
Families and Households in Garfield County
Median Family Size in Garfield County
The median family size in Garfield County is 2.79 persons per family, with married-couple families (624 | 90.8%) accounting for the largest median family size of 2.83 persons per family. On the other hand, single female/mother families (37 | 5.4%) represent the smallest median family size with 2.32 persons per family.
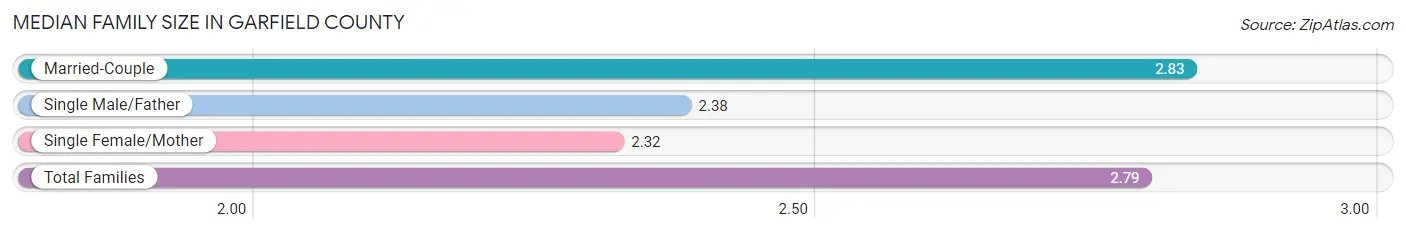
| Family Type | # Families | Family Size |
| Married-Couple | 624 (90.8%) | 2.83 |
| Single Male/Father | 26 (3.8%) | 2.38 |
| Single Female/Mother | 37 (5.4%) | 2.32 |
| Total Families | 687 (100.0%) | 2.79 |
Median Household Size in Garfield County
The median household size in Garfield County is 2.26 persons per household, with single male/father households (26 | 2.6%) accounting for the largest median household size of 3.04 persons per household. non-family households (322 | 31.9%) represent the smallest median household size with 1.02 persons per household.
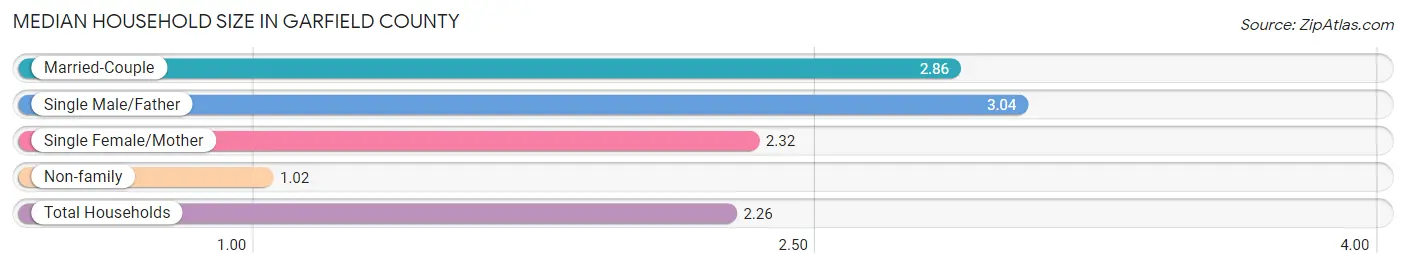
| Household Type | # Households | Household Size |
| Married-Couple | 624 (61.8%) | 2.86 |
| Single Male/Father | 26 (2.6%) | 3.04 |
| Single Female/Mother | 37 (3.7%) | 2.32 |
| Non-family | 322 (31.9%) | 1.02 |
| Total Households | 1,009 (100.0%) | 2.26 |
Household Size by Marriage Status in Garfield County
Out of a total of 1,009 households in Garfield County, 687 (68.1%) are family households, while 322 (31.9%) are nonfamily households. The most numerous type of family households are 2-person households, comprising 385, and the most common type of nonfamily households are 1-person households, comprising 319.
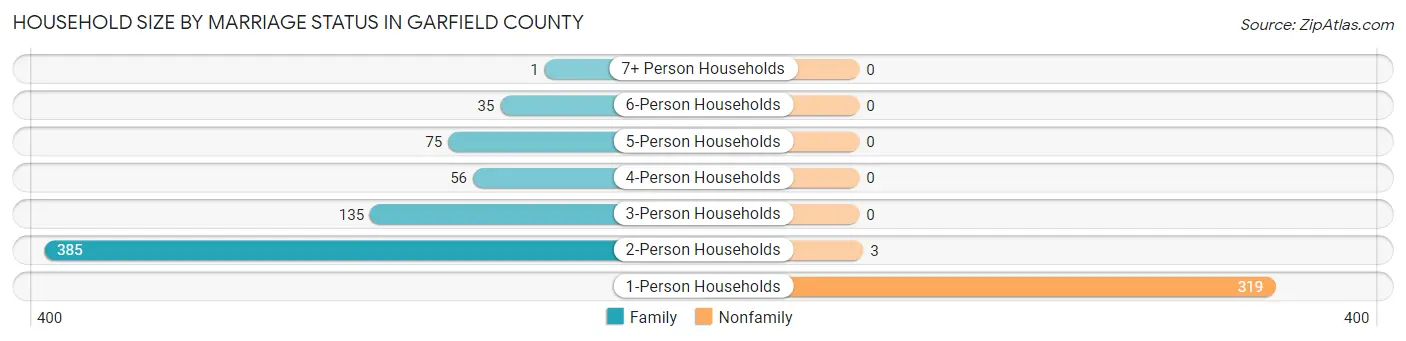
| Household Size | Family Households | Nonfamily Households |
| 1-Person Households | - | 319 (31.6%) |
| 2-Person Households | 385 (38.2%) | 3 (0.3%) |
| 3-Person Households | 135 (13.4%) | 0 (0.0%) |
| 4-Person Households | 56 (5.6%) | 0 (0.0%) |
| 5-Person Households | 75 (7.4%) | 0 (0.0%) |
| 6-Person Households | 35 (3.5%) | 0 (0.0%) |
| 7+ Person Households | 1 (0.1%) | 0 (0.0%) |
| Total | 687 (68.1%) | 322 (31.9%) |
Female Fertility in Garfield County
Fertility by Age in Garfield County
Average fertility rate in Garfield County is 99.0 births per 1,000 women. Women in the age bracket of 20 to 34 years have the highest fertility rate with 307.0 births per 1,000 women. Women in the age bracket of 20 to 34 years acount for 100.0% of all women with births.
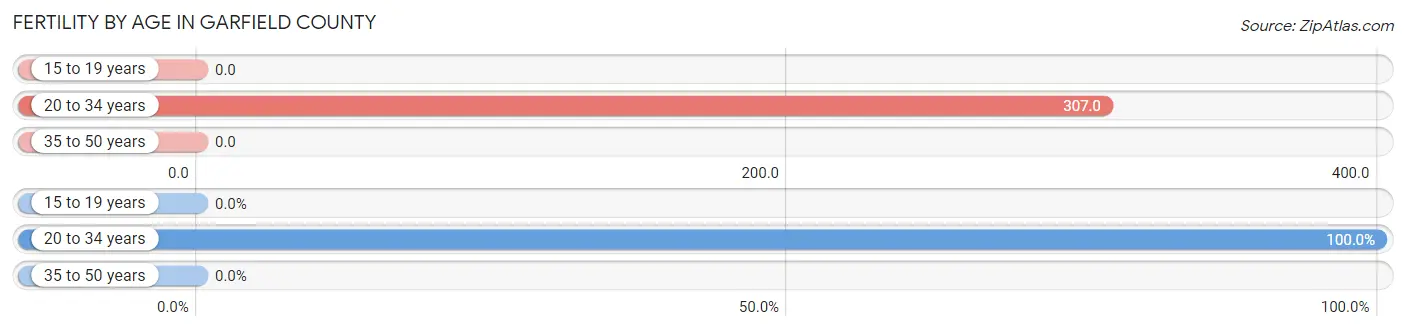
| Age Bracket | Women with Births | Births / 1,000 Women |
| 15 to 19 years | 0 (0.0%) | 0.0 |
| 20 to 34 years | 43 (100.0%) | 307.0 |
| 35 to 50 years | 0 (0.0%) | 0.0 |
| Total | 43 (100.0%) | 99.0 |
Fertility by Age by Marriage Status in Garfield County
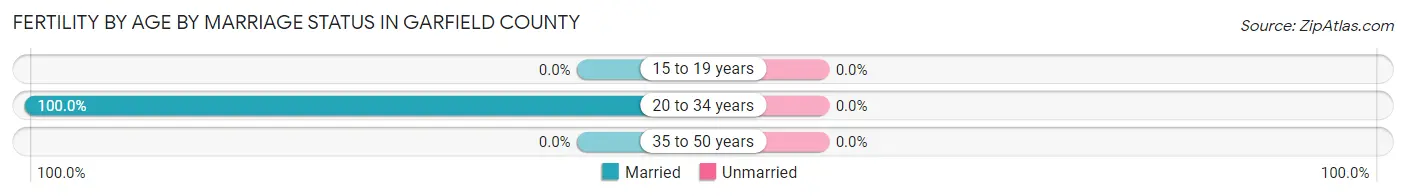
| Age Bracket | Married | Unmarried |
| 15 to 19 years | 0 (0.0%) | 0 (0.0%) |
| 20 to 34 years | 43 (100.0%) | 0 (0.0%) |
| 35 to 50 years | 0 (0.0%) | 0 (0.0%) |
| Total | 43 (100.0%) | 0 (0.0%) |
Fertility by Education in Garfield County
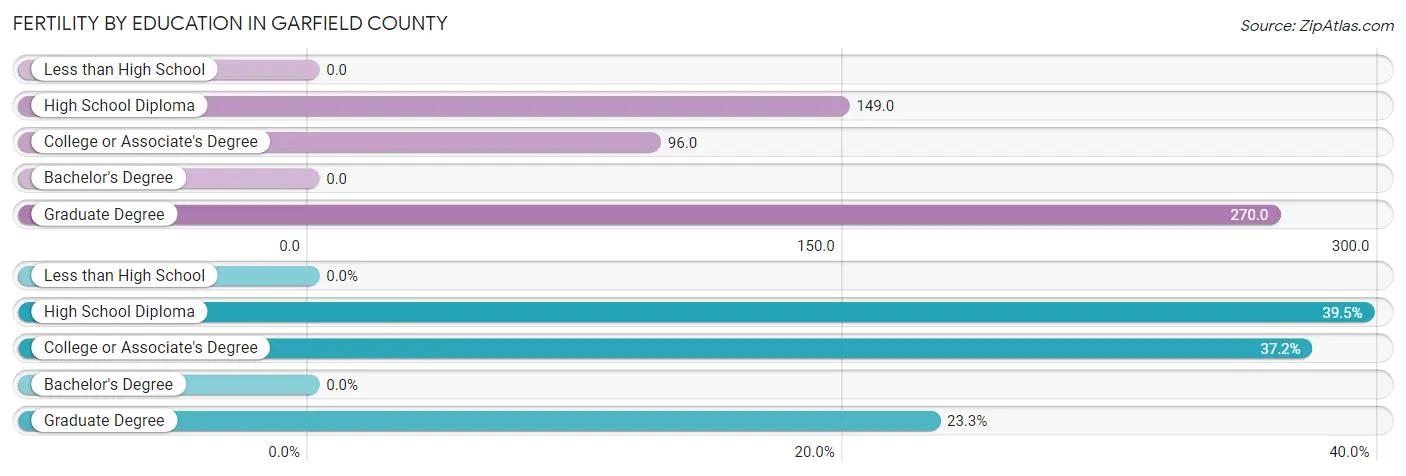
| Educational Attainment | Women with Births | Births / 1,000 Women |
| Less than High School | 0 (0.0%) | 0.0 |
| High School Diploma | 17 (39.5%) | 149.0 |
| College or Associate's Degree | 16 (37.2%) | 96.0 |
| Bachelor's Degree | 0 (0.0%) | 0.0 |
| Graduate Degree | 10 (23.3%) | 270.0 |
| Total | 43 (100.0%) | 99.0 |
Fertility by Education by Marriage Status in Garfield County
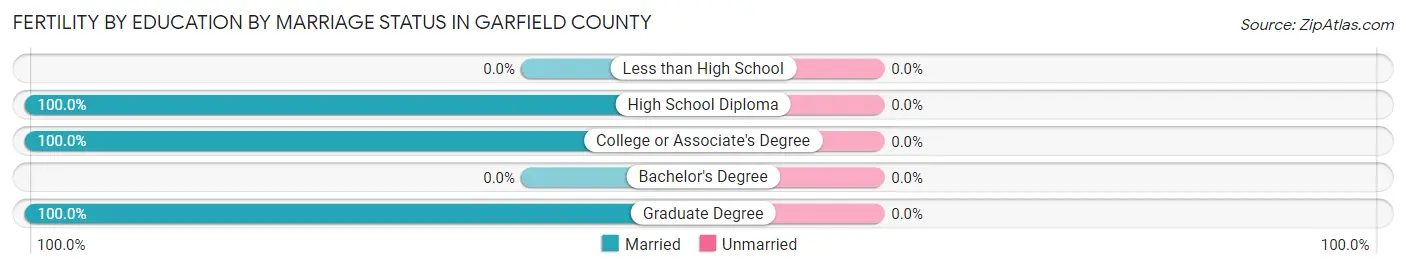
| Educational Attainment | Married | Unmarried |
| Less than High School | 0 (0.0%) | 0 (0.0%) |
| High School Diploma | 17 (100.0%) | 0 (0.0%) |
| College or Associate's Degree | 16 (100.0%) | 0 (0.0%) |
| Bachelor's Degree | 0 (0.0%) | 0 (0.0%) |
| Graduate Degree | 10 (100.0%) | 0 (0.0%) |
| Total | 43 (100.0%) | 0 (0.0%) |
Employment Characteristics in Garfield County
Employment by Class of Employer in Garfield County
Among the 862 employed individuals in Garfield County, private company employees (388 | 45.0%), local government employees (126 | 14.6%), and state government employees (111 | 12.9%) make up the most common classes of employment.
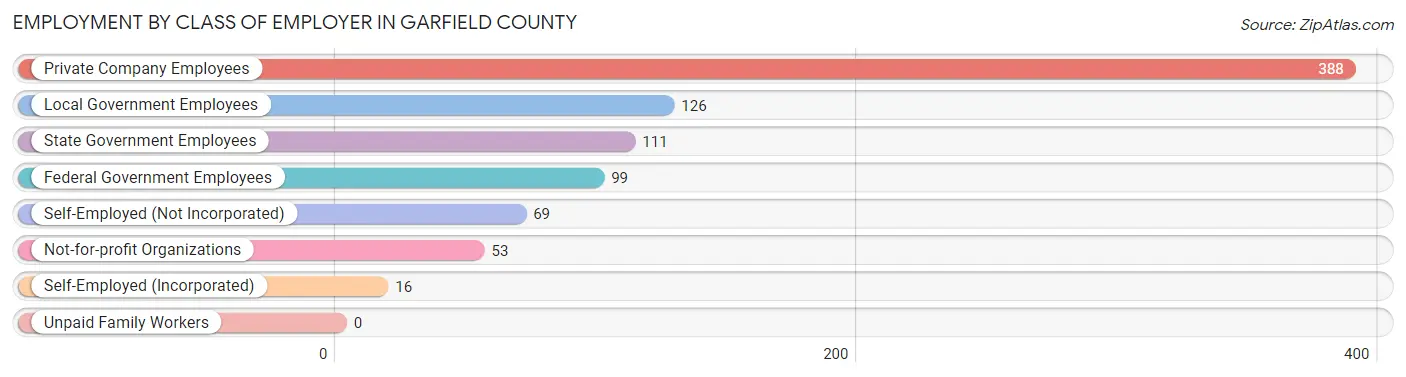
| Employer Class | # Employees | % Employees |
| Private Company Employees | 388 | 45.0% |
| Self-Employed (Incorporated) | 16 | 1.9% |
| Self-Employed (Not Incorporated) | 69 | 8.0% |
| Not-for-profit Organizations | 53 | 6.1% |
| Local Government Employees | 126 | 14.6% |
| State Government Employees | 111 | 12.9% |
| Federal Government Employees | 99 | 11.5% |
| Unpaid Family Workers | 0 | 0.0% |
| Total | 862 | 100.0% |
Employment Status by Age in Garfield County
According to the labor force statistics for Garfield County, out of the total population over 16 years of age (1,964), 49.5% or 972 individuals are in the labor force, with 6.5% or 63 of them unemployed. The age group with the highest labor force participation rate is 30 to 34 years, with 91.7% or 110 individuals in the labor force. Within the labor force, the 16 to 19 years age range has the highest percentage of unemployed individuals, with 20.7% or 18 of them being unemployed.
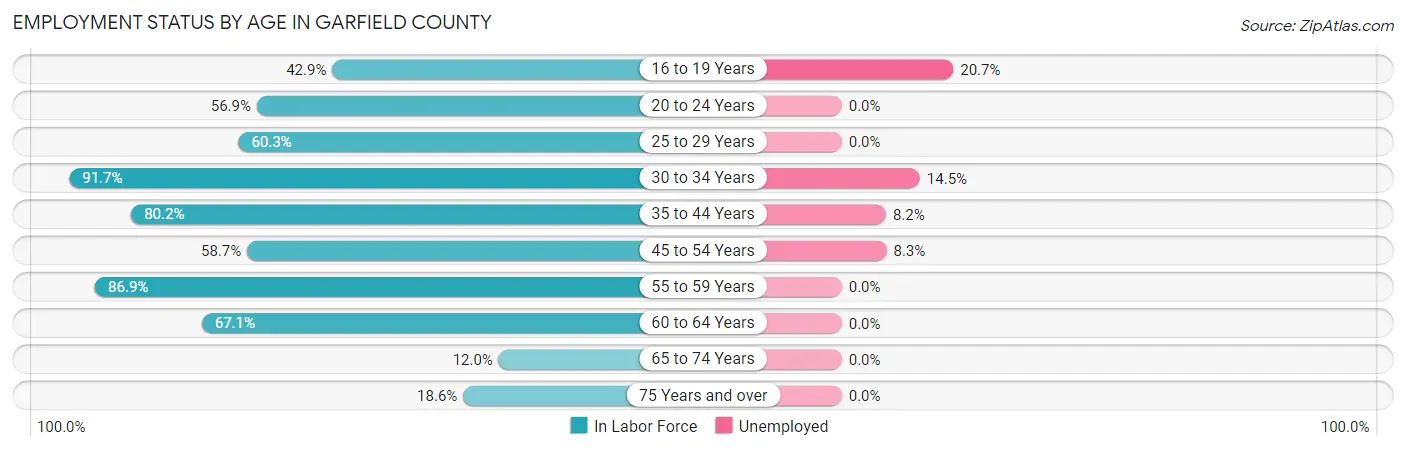
| Age Bracket | In Labor Force | Unemployed |
| 16 to 19 Years | 87 (42.9%) | 18 (20.7%) |
| 20 to 24 Years | 37 (56.9%) | 0 (0.0%) |
| 25 to 29 Years | 47 (60.3%) | 0 (0.0%) |
| 30 to 34 Years | 110 (91.7%) | 16 (14.5%) |
| 35 to 44 Years | 207 (80.2%) | 17 (8.2%) |
| 45 to 54 Years | 145 (58.7%) | 12 (8.3%) |
| 55 to 59 Years | 53 (86.9%) | 0 (0.0%) |
| 60 to 64 Years | 194 (67.1%) | 0 (0.0%) |
| 65 to 74 Years | 49 (12.0%) | 0 (0.0%) |
| 75 Years and over | 44 (18.6%) | 0 (0.0%) |
| Total | 972 (49.5%) | 63 (6.5%) |
Employment Status by Educational Attainment in Garfield County
According to labor force statistics for Garfield County, 71.8% of individuals (756) out of the total population between 25 and 64 years of age (1,053) are in the labor force, with 6.0% or 45 of them being unemployed. The group with the highest labor force participation rate are those with the educational attainment of bachelor's degree or higher, with 81.7% or 219 individuals in the labor force. Within the labor force, individuals with high school diploma education have the highest percentage of unemployment, with 12.2% or 20 of them being unemployed.
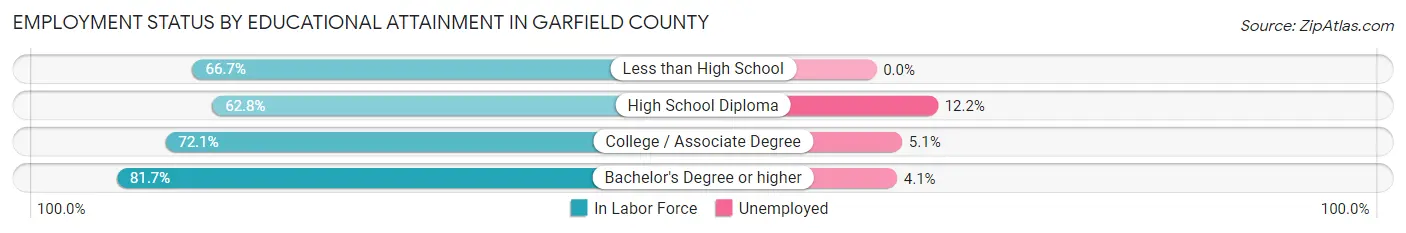
| Educational Attainment | In Labor Force | Unemployed |
| Less than High School | 60 (66.7%) | 0 (0.0%) |
| High School Diploma | 164 (62.8%) | 32 (12.2%) |
| College / Associate Degree | 313 (72.1%) | 22 (5.1%) |
| Bachelor's Degree or higher | 219 (81.7%) | 11 (4.1%) |
| Total | 756 (71.8%) | 63 (6.0%) |
Employment Occupations by Sex in Garfield County
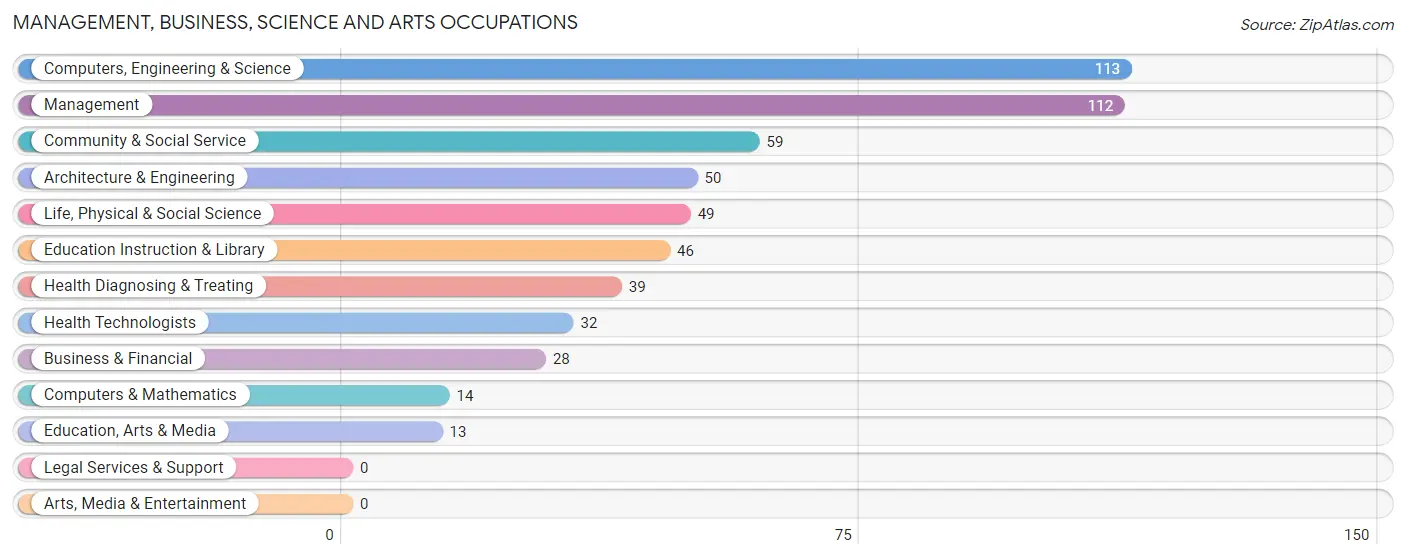
Management, Business, Science and Arts Occupations
The most common Management, Business, Science and Arts occupations in Garfield County are Computers, Engineering & Science (113 | 12.4%), Management (112 | 12.3%), Community & Social Service (59 | 6.5%), Architecture & Engineering (50 | 5.5%), and Life, Physical & Social Science (49 | 5.4%).
Management, Business, Science and Arts Occupations by Sex
Within the Management, Business, Science and Arts occupations in Garfield County, the most male-oriented occupations are Computers & Mathematics (100.0%), Life, Physical & Social Science (100.0%), and Computers, Engineering & Science (98.2%), while the most female-oriented occupations are Health Diagnosing & Treating (76.9%), Education Instruction & Library (73.9%), and Health Technologists (71.9%).
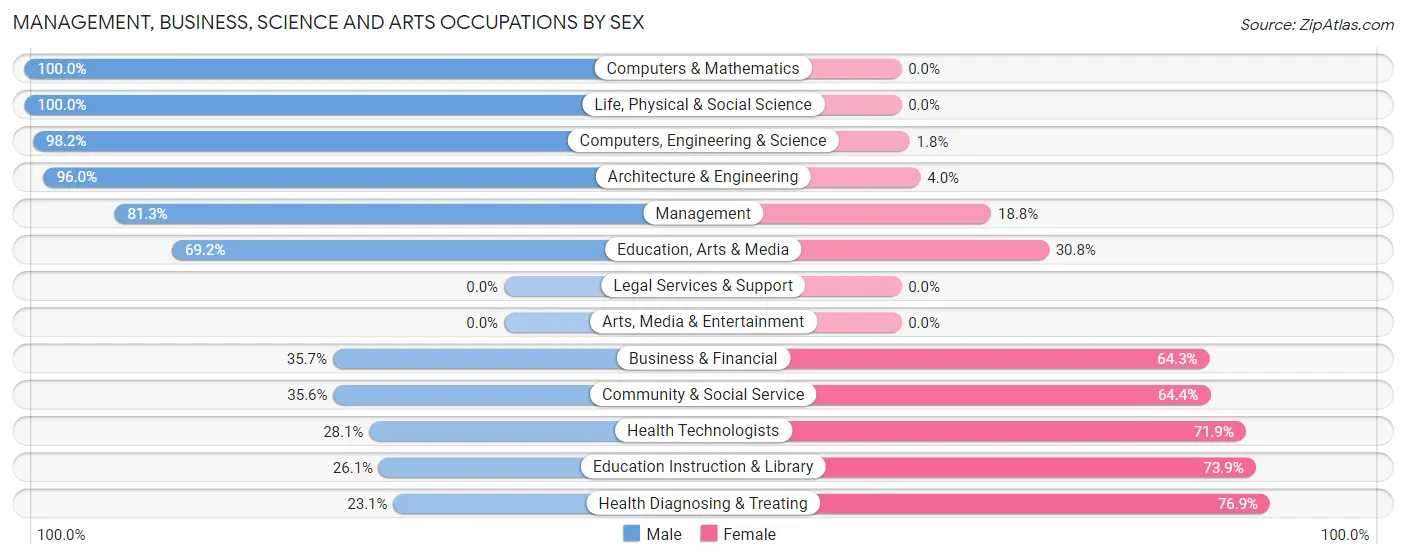
| Occupation | Male | Female |
| Management | 91 (81.2%) | 21 (18.8%) |
| Business & Financial | 10 (35.7%) | 18 (64.3%) |
| Computers, Engineering & Science | 111 (98.2%) | 2 (1.8%) |
| Computers & Mathematics | 14 (100.0%) | 0 (0.0%) |
| Architecture & Engineering | 48 (96.0%) | 2 (4.0%) |
| Life, Physical & Social Science | 49 (100.0%) | 0 (0.0%) |
| Community & Social Service | 21 (35.6%) | 38 (64.4%) |
| Education, Arts & Media | 9 (69.2%) | 4 (30.8%) |
| Legal Services & Support | 0 (0.0%) | 0 (0.0%) |
| Education Instruction & Library | 12 (26.1%) | 34 (73.9%) |
| Arts, Media & Entertainment | 0 (0.0%) | 0 (0.0%) |
| Health Diagnosing & Treating | 9 (23.1%) | 30 (76.9%) |
| Health Technologists | 9 (28.1%) | 23 (71.9%) |
| Total (Category) | 242 (69.0%) | 109 (31.0%) |
| Total (Overall) | 574 (63.1%) | 336 (36.9%) |
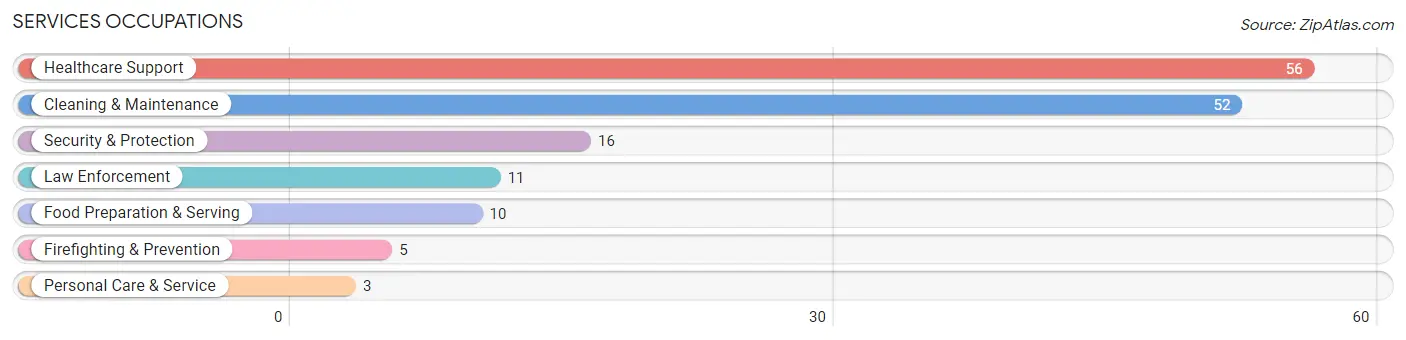
Services Occupations
The most common Services occupations in Garfield County are Healthcare Support (56 | 6.1%), Cleaning & Maintenance (52 | 5.7%), Security & Protection (16 | 1.8%), Law Enforcement (11 | 1.2%), and Food Preparation & Serving (10 | 1.1%).
Services Occupations by Sex
Within the Services occupations in Garfield County, the most male-oriented occupations are Law Enforcement (100.0%), Food Preparation & Serving (100.0%), and Security & Protection (68.8%), while the most female-oriented occupations are Firefighting & Prevention (100.0%), Personal Care & Service (100.0%), and Healthcare Support (94.6%).
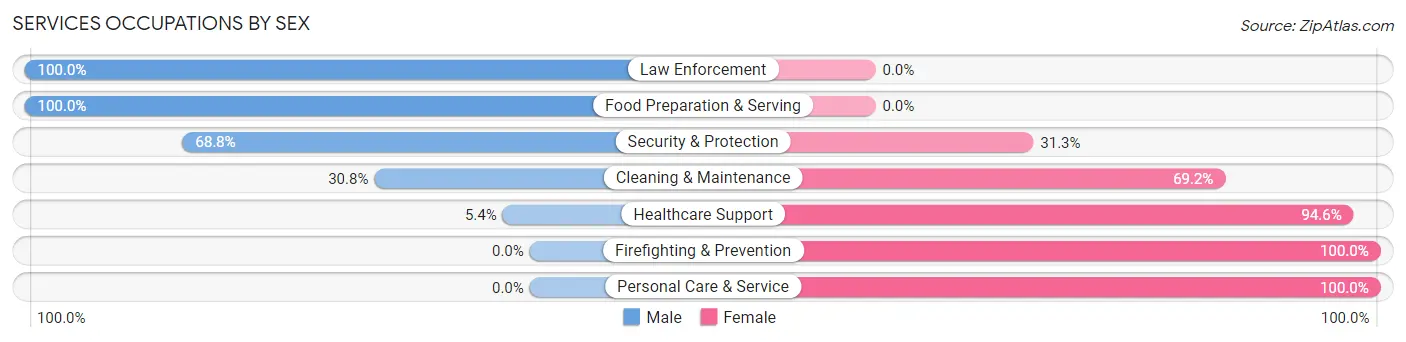
| Occupation | Male | Female |
| Healthcare Support | 3 (5.4%) | 53 (94.6%) |
| Security & Protection | 11 (68.8%) | 5 (31.2%) |
| Firefighting & Prevention | 0 (0.0%) | 5 (100.0%) |
| Law Enforcement | 11 (100.0%) | 0 (0.0%) |
| Food Preparation & Serving | 10 (100.0%) | 0 (0.0%) |
| Cleaning & Maintenance | 16 (30.8%) | 36 (69.2%) |
| Personal Care & Service | 0 (0.0%) | 3 (100.0%) |
| Total (Category) | 40 (29.2%) | 97 (70.8%) |
| Total (Overall) | 574 (63.1%) | 336 (36.9%) |
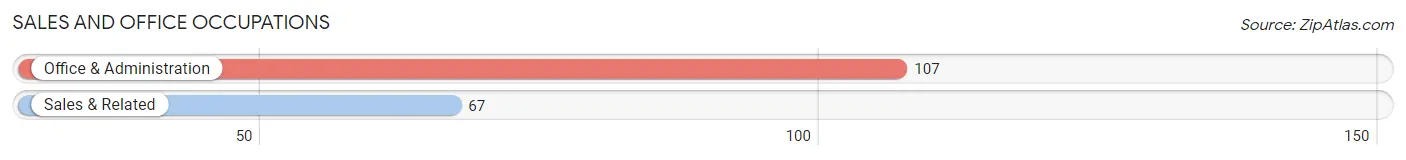
Sales and Office Occupations
The most common Sales and Office occupations in Garfield County are Office & Administration (107 | 11.8%), and Sales & Related (67 | 7.4%).
Sales and Office Occupations by Sex
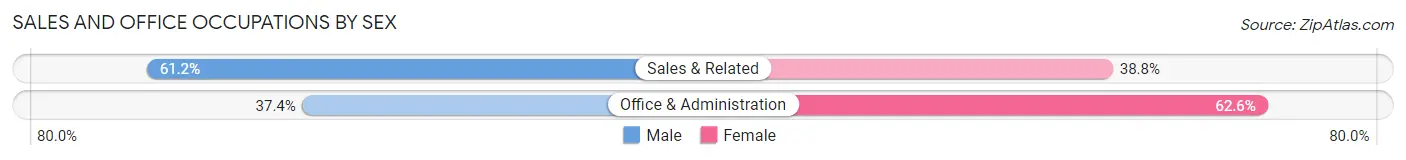
| Occupation | Male | Female |
| Sales & Related | 41 (61.2%) | 26 (38.8%) |
| Office & Administration | 40 (37.4%) | 67 (62.6%) |
| Total (Category) | 81 (46.6%) | 93 (53.4%) |
| Total (Overall) | 574 (63.1%) | 336 (36.9%) |
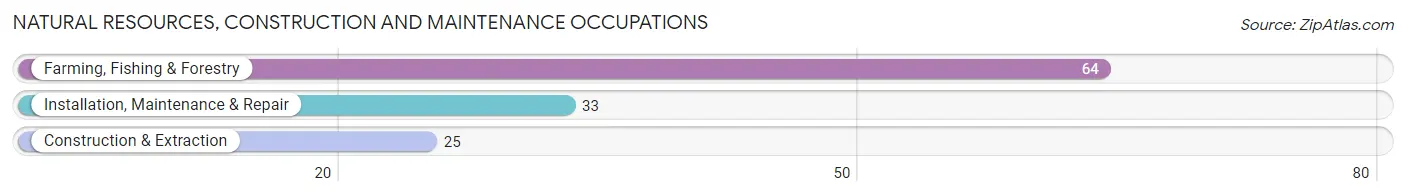
Natural Resources, Construction and Maintenance Occupations
The most common Natural Resources, Construction and Maintenance occupations in Garfield County are Farming, Fishing & Forestry (64 | 7.0%), Installation, Maintenance & Repair (33 | 3.6%), and Construction & Extraction (25 | 2.8%).
Natural Resources, Construction and Maintenance Occupations by Sex
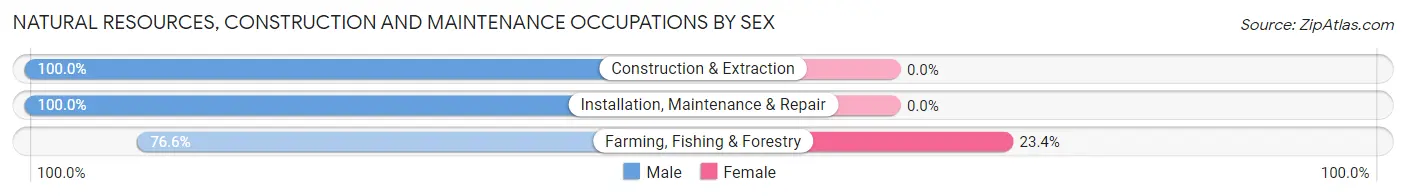
| Occupation | Male | Female |
| Farming, Fishing & Forestry | 49 (76.6%) | 15 (23.4%) |
| Construction & Extraction | 25 (100.0%) | 0 (0.0%) |
| Installation, Maintenance & Repair | 33 (100.0%) | 0 (0.0%) |
| Total (Category) | 107 (87.7%) | 15 (12.3%) |
| Total (Overall) | 574 (63.1%) | 336 (36.9%) |
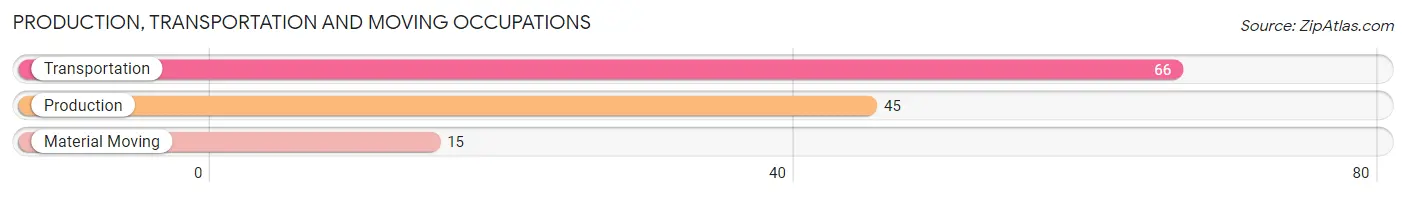
Production, Transportation and Moving Occupations
The most common Production, Transportation and Moving occupations in Garfield County are Transportation (66 | 7.2%), Production (45 | 5.0%), and Material Moving (15 | 1.7%).
Production, Transportation and Moving Occupations by Sex
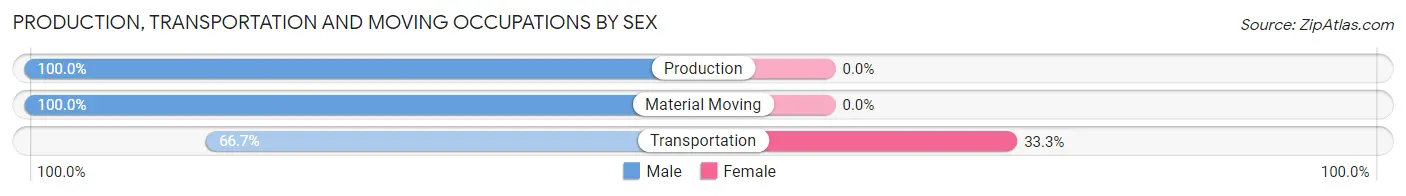
| Occupation | Male | Female |
| Production | 45 (100.0%) | 0 (0.0%) |
| Transportation | 44 (66.7%) | 22 (33.3%) |
| Material Moving | 15 (100.0%) | 0 (0.0%) |
| Total (Category) | 104 (82.5%) | 22 (17.5%) |
| Total (Overall) | 574 (63.1%) | 336 (36.9%) |
Employment Industries by Sex in Garfield County
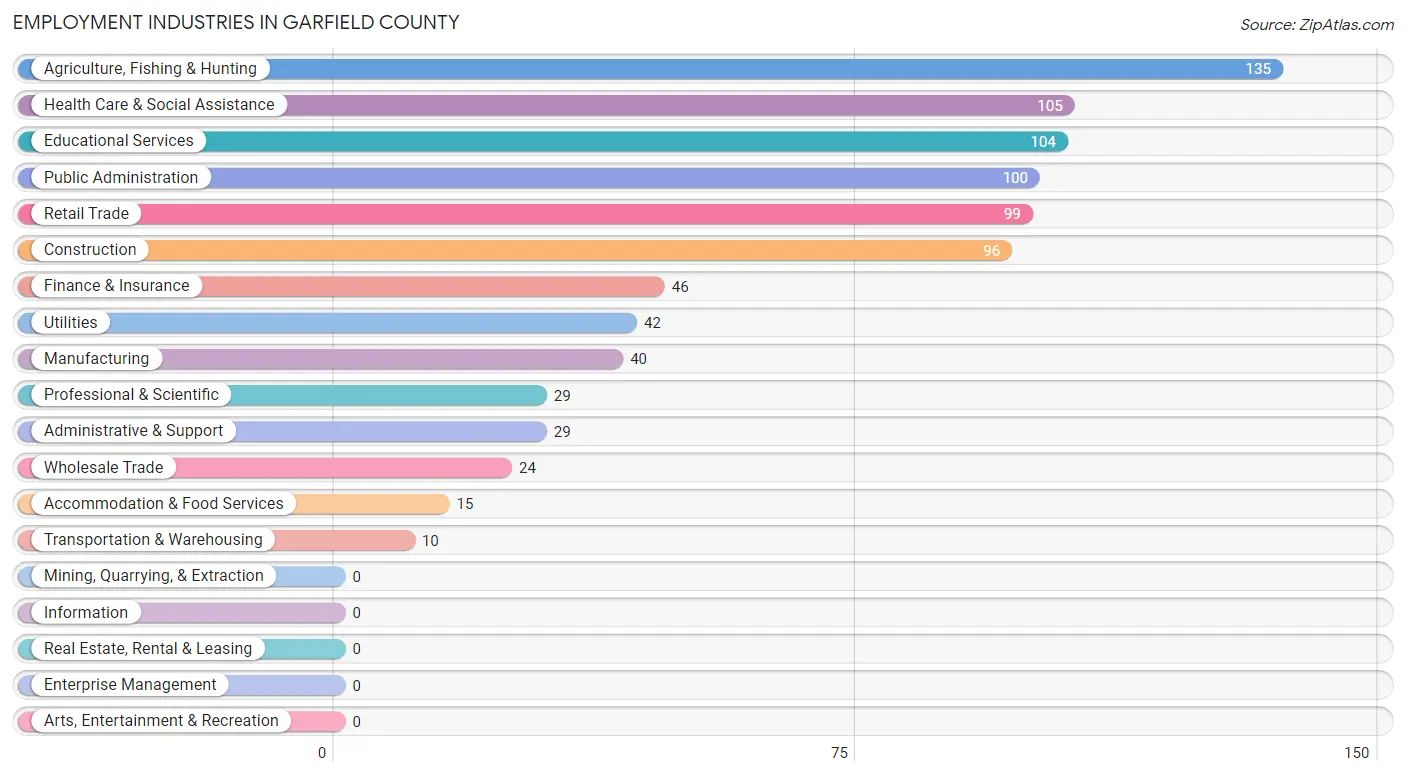
Employment Industries in Garfield County
The major employment industries in Garfield County include Agriculture, Fishing & Hunting (135 | 14.8%), Health Care & Social Assistance (105 | 11.5%), Educational Services (104 | 11.4%), Public Administration (100 | 11.0%), and Retail Trade (99 | 10.9%).
Employment Industries by Sex in Garfield County
The Garfield County industries that see more men than women are Transportation & Warehousing (100.0%), Utilities (100.0%), and Public Administration (97.0%), whereas the industries that tend to have a higher number of women are Accommodation & Food Services (100.0%), Educational Services (85.6%), and Health Care & Social Assistance (76.2%).
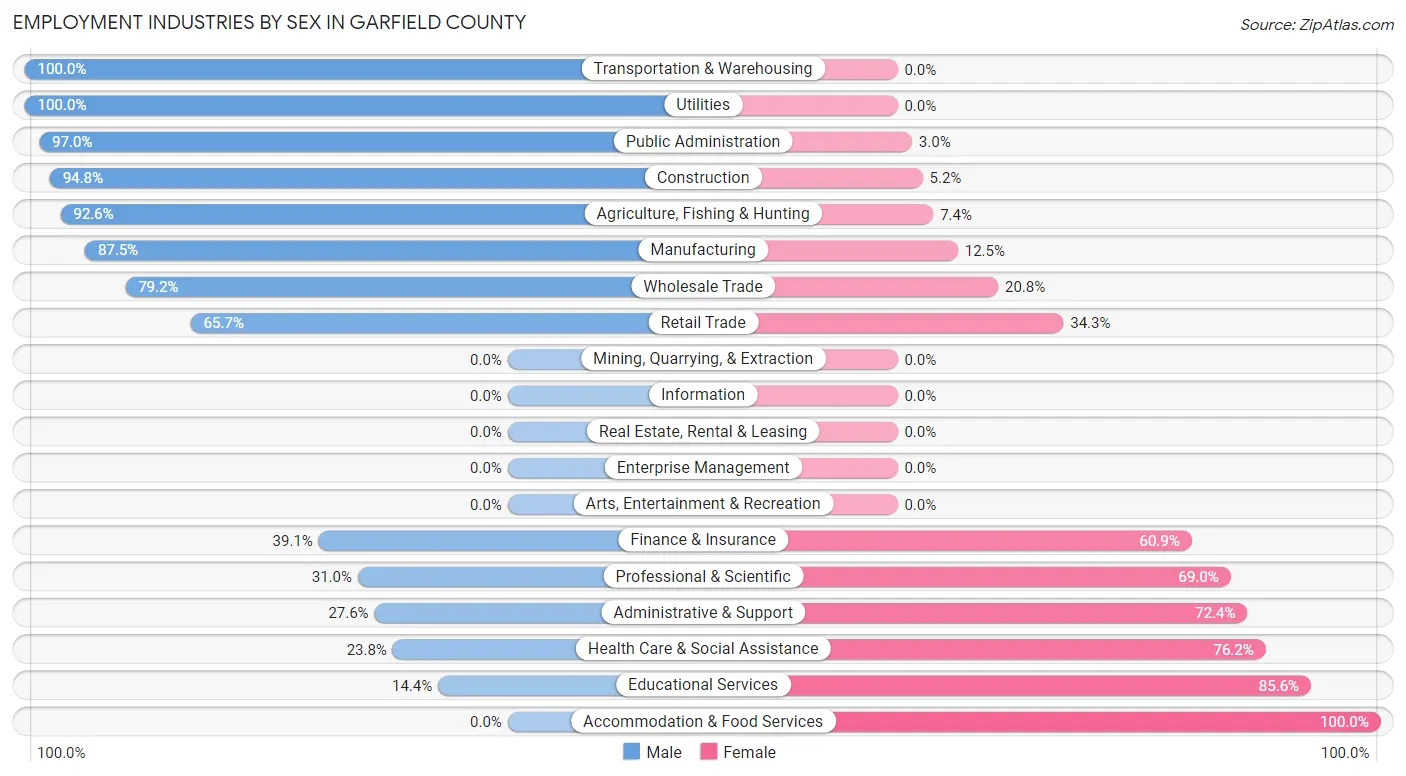
| Industry | Male | Female |
| Agriculture, Fishing & Hunting | 125 (92.6%) | 10 (7.4%) |
| Mining, Quarrying, & Extraction | 0 (0.0%) | 0 (0.0%) |
| Construction | 91 (94.8%) | 5 (5.2%) |
| Manufacturing | 35 (87.5%) | 5 (12.5%) |
| Wholesale Trade | 19 (79.2%) | 5 (20.8%) |
| Retail Trade | 65 (65.7%) | 34 (34.3%) |
| Transportation & Warehousing | 10 (100.0%) | 0 (0.0%) |
| Utilities | 42 (100.0%) | 0 (0.0%) |
| Information | 0 (0.0%) | 0 (0.0%) |
| Finance & Insurance | 18 (39.1%) | 28 (60.9%) |
| Real Estate, Rental & Leasing | 0 (0.0%) | 0 (0.0%) |
| Professional & Scientific | 9 (31.0%) | 20 (69.0%) |
| Enterprise Management | 0 (0.0%) | 0 (0.0%) |
| Administrative & Support | 8 (27.6%) | 21 (72.4%) |
| Educational Services | 15 (14.4%) | 89 (85.6%) |
| Health Care & Social Assistance | 25 (23.8%) | 80 (76.2%) |
| Arts, Entertainment & Recreation | 0 (0.0%) | 0 (0.0%) |
| Accommodation & Food Services | 0 (0.0%) | 15 (100.0%) |
| Public Administration | 97 (97.0%) | 3 (3.0%) |
| Total | 574 (63.1%) | 336 (36.9%) |
Education in Garfield County
School Enrollment in Garfield County
The most common levels of schooling among the 403 students in Garfield County are high school (139 | 34.5%), middle school (106 | 26.3%), and elementary school (70 | 17.4%).
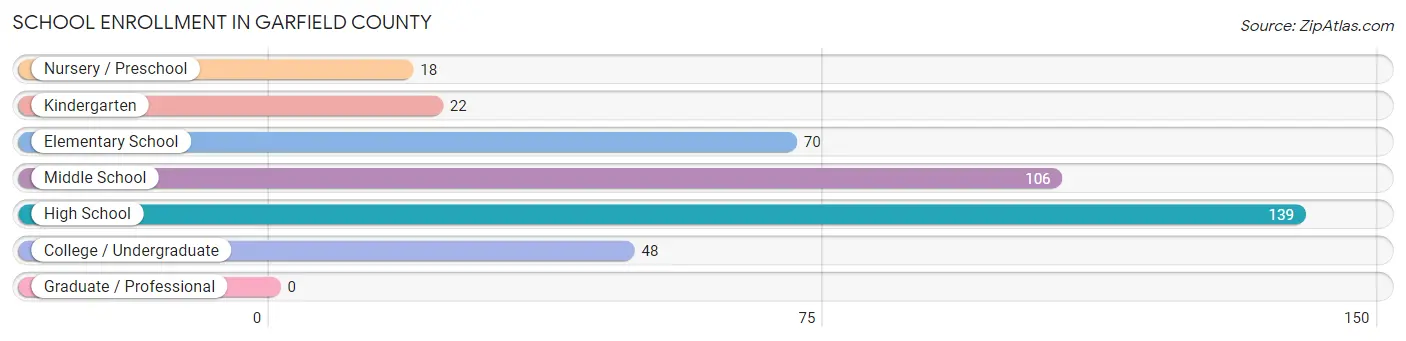
| School Level | # Students | % Students |
| Nursery / Preschool | 18 | 4.5% |
| Kindergarten | 22 | 5.5% |
| Elementary School | 70 | 17.4% |
| Middle School | 106 | 26.3% |
| High School | 139 | 34.5% |
| College / Undergraduate | 48 | 11.9% |
| Graduate / Professional | 0 | 0.0% |
| Total | 403 | 100.0% |
School Enrollment by Age by Funding Source in Garfield County
Out of a total of 403 students who are enrolled in schools in Garfield County, 32 (7.9%) attend a private institution, while the remaining 371 (92.1%) are enrolled in public schools. The age group of 10 to 14 year olds has the highest likelihood of being enrolled in private schools, with 13 (12.1% in the age bracket) enrolled. Conversely, the age group of 3 to 4 year olds has the lowest likelihood of being enrolled in a private school, with 9 (100.0% in the age bracket) attending a public institution.
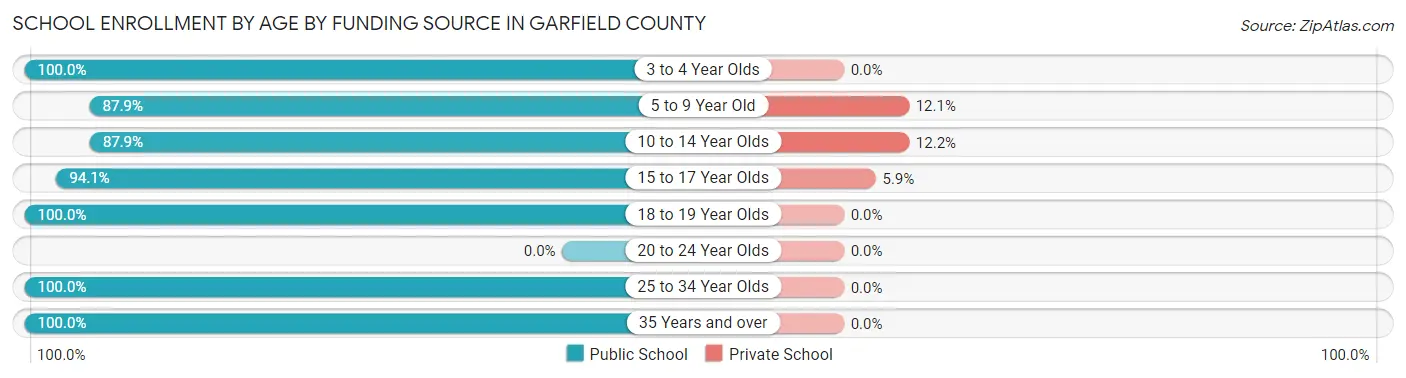
| Age Bracket | Public School | Private School |
| 3 to 4 Year Olds | 9 (100.0%) | 0 (0.0%) |
| 5 to 9 Year Old | 87 (87.9%) | 12 (12.1%) |
| 10 to 14 Year Olds | 94 (87.8%) | 13 (12.1%) |
| 15 to 17 Year Olds | 111 (94.1%) | 7 (5.9%) |
| 18 to 19 Year Olds | 49 (100.0%) | 0 (0.0%) |
| 20 to 24 Year Olds | 0 (0.0%) | 0 (0.0%) |
| 25 to 34 Year Olds | 7 (100.0%) | 0 (0.0%) |
| 35 Years and over | 14 (100.0%) | 0 (0.0%) |
| Total | 371 (92.1%) | 32 (7.9%) |
Educational Attainment by Field of Study in Garfield County
Education (132 | 26.7%), bio, nature & agricultural (94 | 19.0%), science & technology (94 | 19.0%), liberal arts & history (37 | 7.5%), and literature & languages (36 | 7.3%) are the most common fields of study among 494 individuals in Garfield County who have obtained a bachelor's degree or higher.
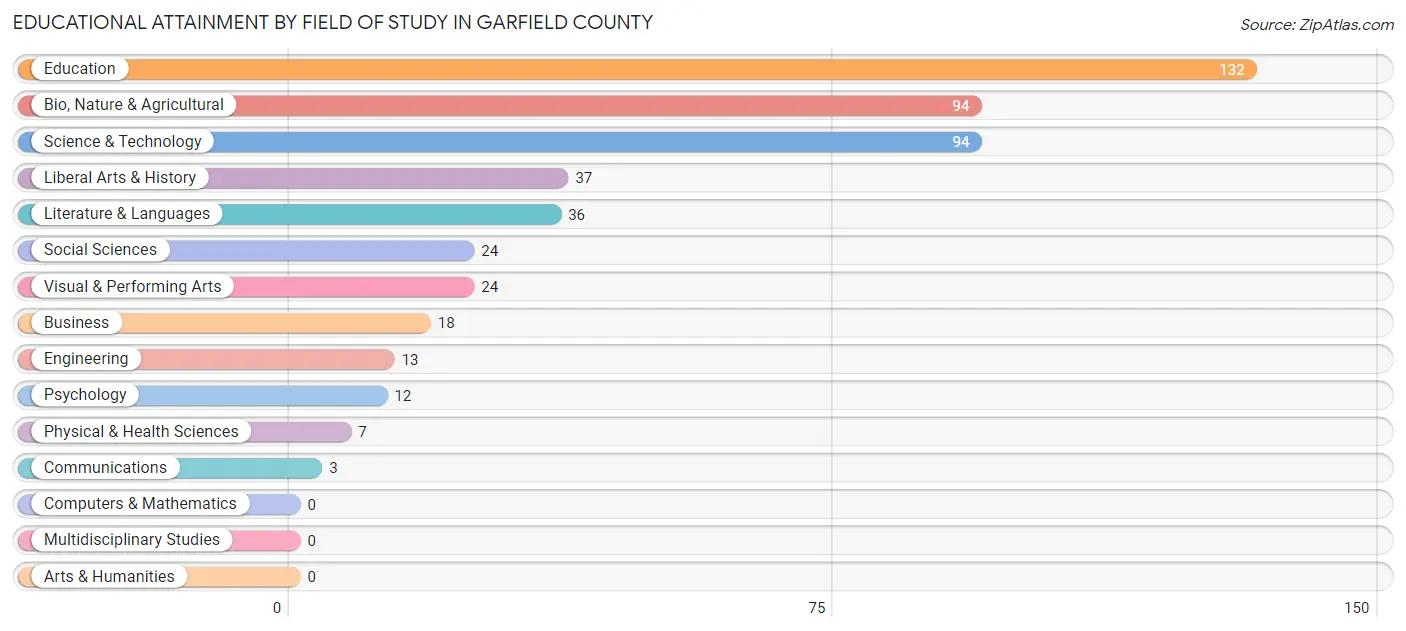
| Field of Study | # Graduates | % Graduates |
| Computers & Mathematics | 0 | 0.0% |
| Bio, Nature & Agricultural | 94 | 19.0% |
| Physical & Health Sciences | 7 | 1.4% |
| Psychology | 12 | 2.4% |
| Social Sciences | 24 | 4.9% |
| Engineering | 13 | 2.6% |
| Multidisciplinary Studies | 0 | 0.0% |
| Science & Technology | 94 | 19.0% |
| Business | 18 | 3.6% |
| Education | 132 | 26.7% |
| Literature & Languages | 36 | 7.3% |
| Liberal Arts & History | 37 | 7.5% |
| Visual & Performing Arts | 24 | 4.9% |
| Communications | 3 | 0.6% |
| Arts & Humanities | 0 | 0.0% |
| Total | 494 | 100.0% |
Transportation & Commute in Garfield County
Vehicle Availability by Sex in Garfield County
The most prevalent vehicle ownership categories in Garfield County are males with 2 vehicles (216, accounting for 39.7%) and females with 2 vehicles (122, making up 67.9%).
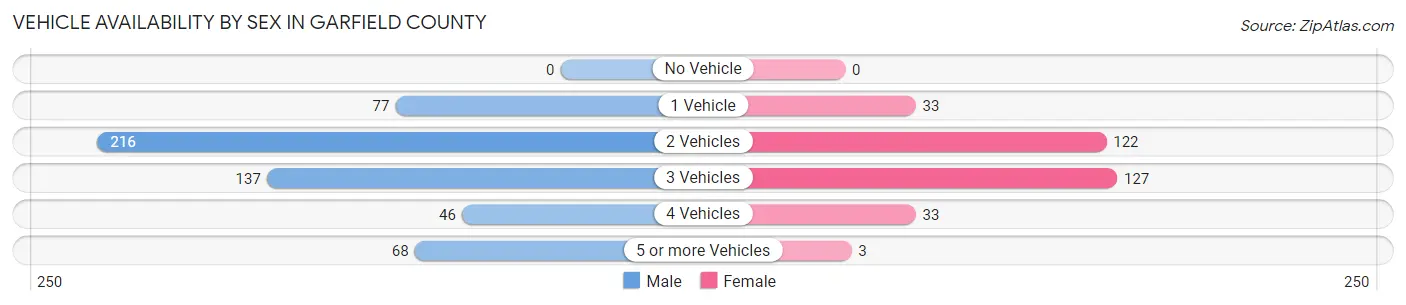
| Vehicles Available | Male | Female |
| No Vehicle | 0 (0.0%) | 0 (0.0%) |
| 1 Vehicle | 77 (14.1%) | 33 (10.4%) |
| 2 Vehicles | 216 (39.7%) | 122 (38.4%) |
| 3 Vehicles | 137 (25.2%) | 127 (39.9%) |
| 4 Vehicles | 46 (8.5%) | 33 (10.4%) |
| 5 or more Vehicles | 68 (12.5%) | 3 (0.9%) |
| Total | 544 (100.0%) | 318 (100.0%) |
Commute Time in Garfield County
The most frequently occuring commute durations in Garfield County are less than 5 minutes (157 commuters, 21.7%), 30 to 34 minutes (136 commuters, 18.8%), and 5 to 9 minutes (65 commuters, 9.0%).
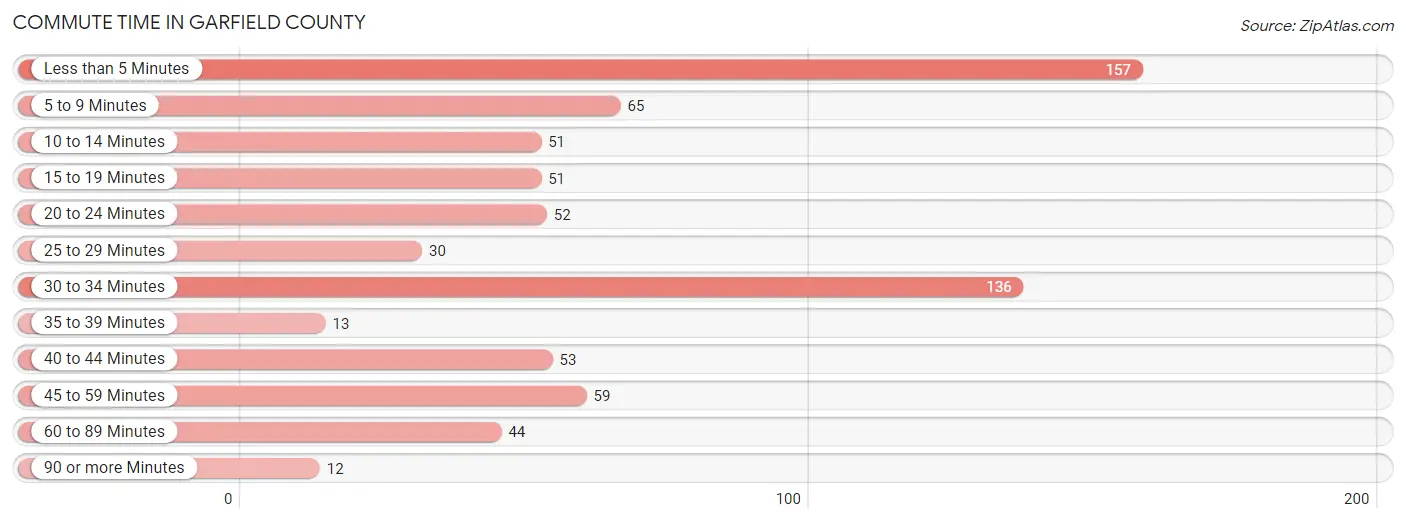
| Commute Time | # Commuters | % Commuters |
| Less than 5 Minutes | 157 | 21.7% |
| 5 to 9 Minutes | 65 | 9.0% |
| 10 to 14 Minutes | 51 | 7.0% |
| 15 to 19 Minutes | 51 | 7.0% |
| 20 to 24 Minutes | 52 | 7.2% |
| 25 to 29 Minutes | 30 | 4.2% |
| 30 to 34 Minutes | 136 | 18.8% |
| 35 to 39 Minutes | 13 | 1.8% |
| 40 to 44 Minutes | 53 | 7.3% |
| 45 to 59 Minutes | 59 | 8.2% |
| 60 to 89 Minutes | 44 | 6.1% |
| 90 or more Minutes | 12 | 1.7% |
Commute Time by Sex in Garfield County
The most common commute times in Garfield County are 30 to 34 minutes (95 commuters, 21.9%) for males and less than 5 minutes (88 commuters, 30.4%) for females.
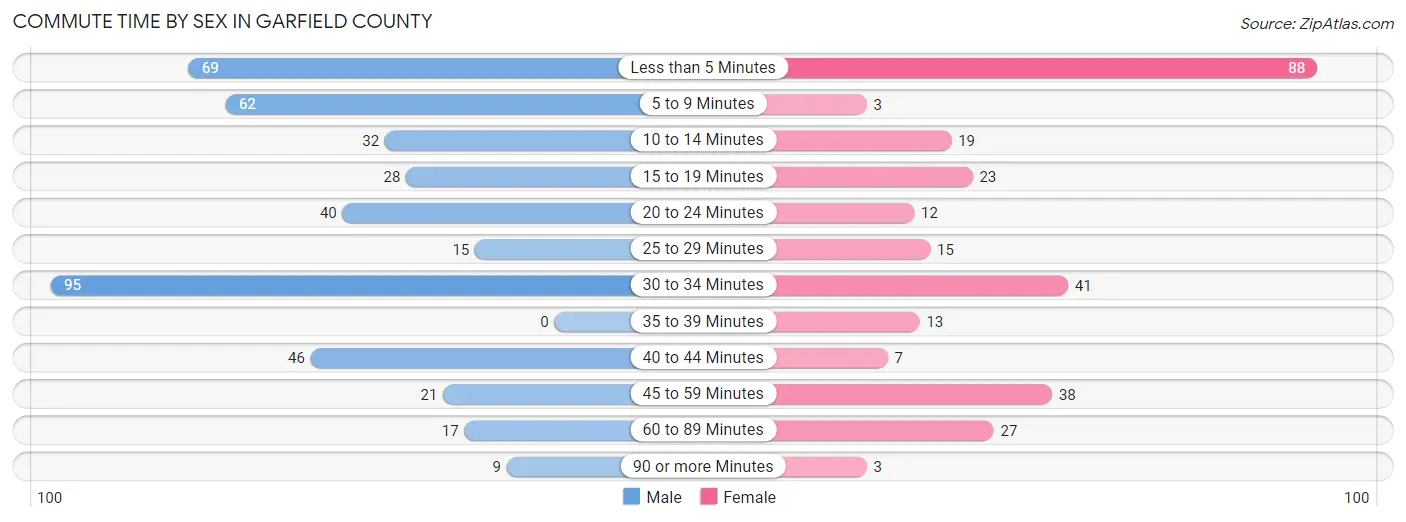
| Commute Time | Male | Female |
| Less than 5 Minutes | 69 (15.9%) | 88 (30.4%) |
| 5 to 9 Minutes | 62 (14.3%) | 3 (1.0%) |
| 10 to 14 Minutes | 32 (7.4%) | 19 (6.6%) |
| 15 to 19 Minutes | 28 (6.5%) | 23 (8.0%) |
| 20 to 24 Minutes | 40 (9.2%) | 12 (4.2%) |
| 25 to 29 Minutes | 15 (3.5%) | 15 (5.2%) |
| 30 to 34 Minutes | 95 (21.9%) | 41 (14.2%) |
| 35 to 39 Minutes | 0 (0.0%) | 13 (4.5%) |
| 40 to 44 Minutes | 46 (10.6%) | 7 (2.4%) |
| 45 to 59 Minutes | 21 (4.8%) | 38 (13.2%) |
| 60 to 89 Minutes | 17 (3.9%) | 27 (9.3%) |
| 90 or more Minutes | 9 (2.1%) | 3 (1.0%) |
Time of Departure to Work by Sex in Garfield County
The most frequent times of departure to work in Garfield County are 7:00 AM to 7:29 AM (59, 13.6%) for males and 6:00 AM to 6:29 AM (64, 22.2%) for females.
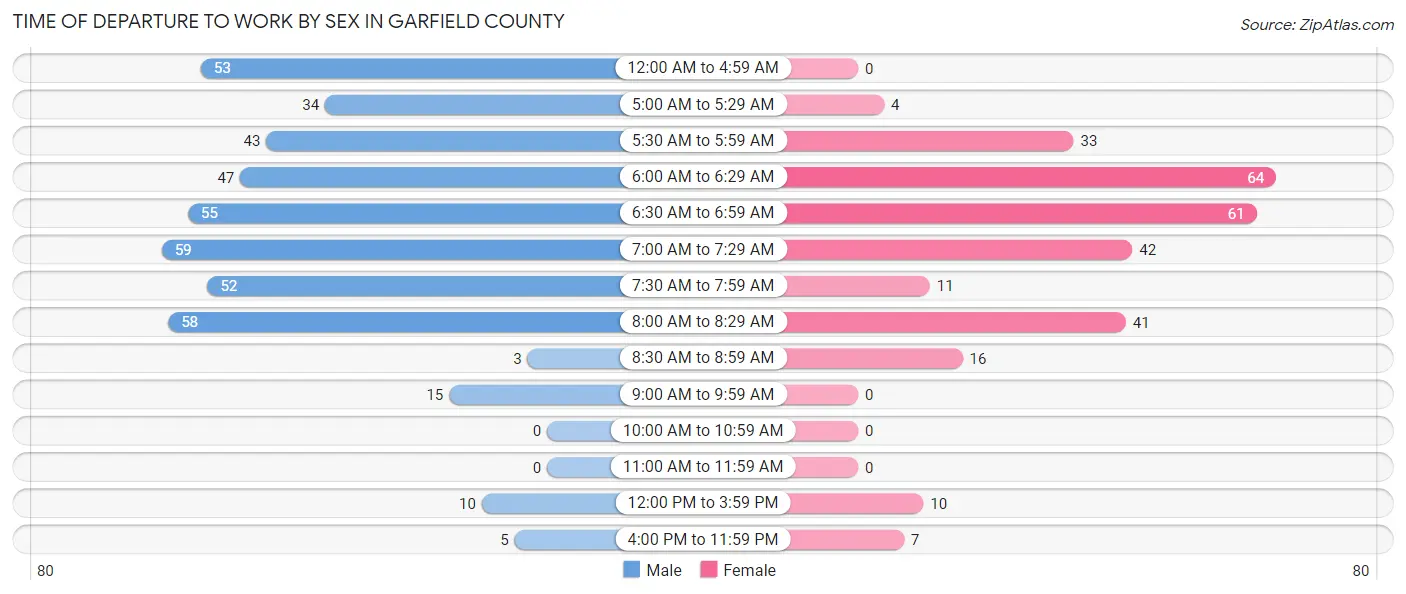
| Time of Departure | Male | Female |
| 12:00 AM to 4:59 AM | 53 (12.2%) | 0 (0.0%) |
| 5:00 AM to 5:29 AM | 34 (7.8%) | 4 (1.4%) |
| 5:30 AM to 5:59 AM | 43 (9.9%) | 33 (11.4%) |
| 6:00 AM to 6:29 AM | 47 (10.8%) | 64 (22.2%) |
| 6:30 AM to 6:59 AM | 55 (12.7%) | 61 (21.1%) |
| 7:00 AM to 7:29 AM | 59 (13.6%) | 42 (14.5%) |
| 7:30 AM to 7:59 AM | 52 (12.0%) | 11 (3.8%) |
| 8:00 AM to 8:29 AM | 58 (13.4%) | 41 (14.2%) |
| 8:30 AM to 8:59 AM | 3 (0.7%) | 16 (5.5%) |
| 9:00 AM to 9:59 AM | 15 (3.5%) | 0 (0.0%) |
| 10:00 AM to 10:59 AM | 0 (0.0%) | 0 (0.0%) |
| 11:00 AM to 11:59 AM | 0 (0.0%) | 0 (0.0%) |
| 12:00 PM to 3:59 PM | 10 (2.3%) | 10 (3.5%) |
| 4:00 PM to 11:59 PM | 5 (1.1%) | 7 (2.4%) |
| Total | 434 (100.0%) | 289 (100.0%) |
Housing Occupancy in Garfield County
Occupancy by Ownership in Garfield County
Of the total 1,009 dwellings in Garfield County, owner-occupied units account for 782 (77.5%), while renter-occupied units make up 227 (22.5%).
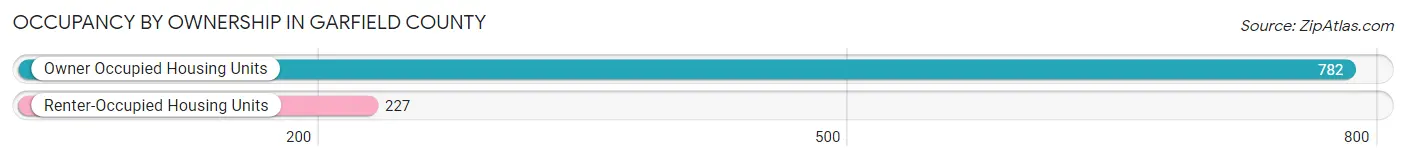
| Occupancy | # Housing Units | % Housing Units |
| Owner Occupied Housing Units | 782 | 77.5% |
| Renter-Occupied Housing Units | 227 | 22.5% |
| Total Occupied Housing Units | 1,009 | 100.0% |
Occupancy by Household Size in Garfield County
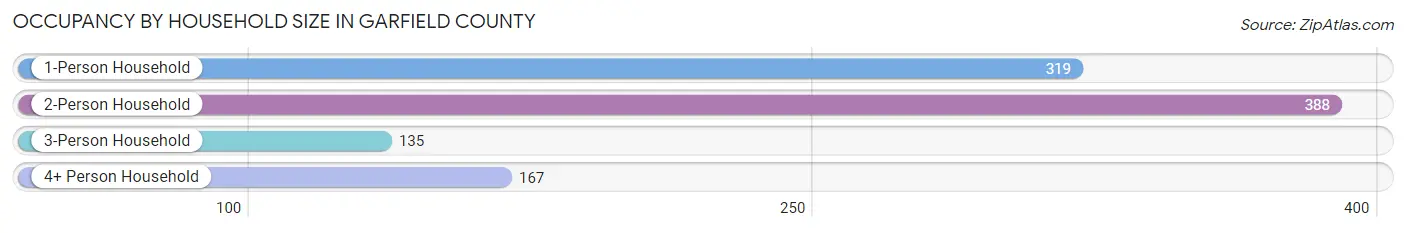
| Household Size | # Housing Units | % Housing Units |
| 1-Person Household | 319 | 31.6% |
| 2-Person Household | 388 | 38.5% |
| 3-Person Household | 135 | 13.4% |
| 4+ Person Household | 167 | 16.6% |
| Total Housing Units | 1,009 | 100.0% |
Occupancy by Ownership by Household Size in Garfield County
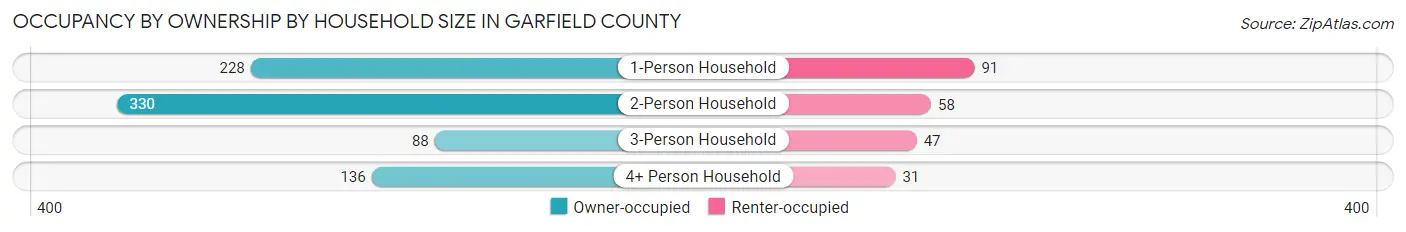
| Household Size | Owner-occupied | Renter-occupied |
| 1-Person Household | 228 (71.5%) | 91 (28.5%) |
| 2-Person Household | 330 (85.1%) | 58 (14.9%) |
| 3-Person Household | 88 (65.2%) | 47 (34.8%) |
| 4+ Person Household | 136 (81.4%) | 31 (18.6%) |
| Total Housing Units | 782 (77.5%) | 227 (22.5%) |
Occupancy by Educational Attainment in Garfield County
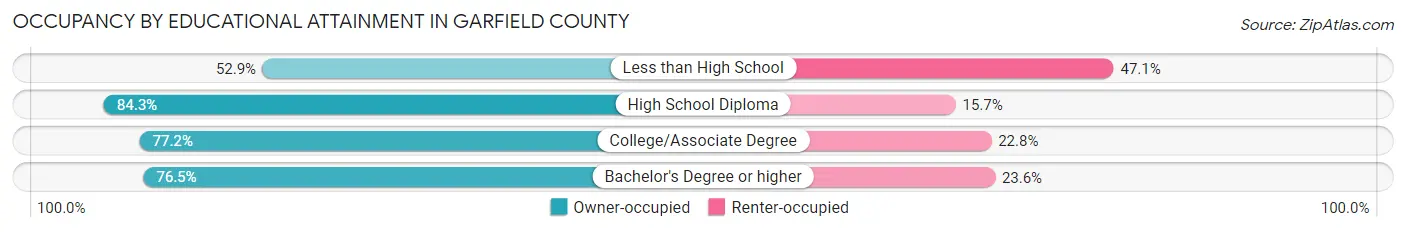
| Household Size | Owner-occupied | Renter-occupied |
| Less than High School | 27 (52.9%) | 24 (47.1%) |
| High School Diploma | 209 (84.3%) | 39 (15.7%) |
| College/Associate Degree | 335 (77.2%) | 99 (22.8%) |
| Bachelor's Degree or higher | 211 (76.4%) | 65 (23.5%) |
Occupancy by Age of Householder in Garfield County
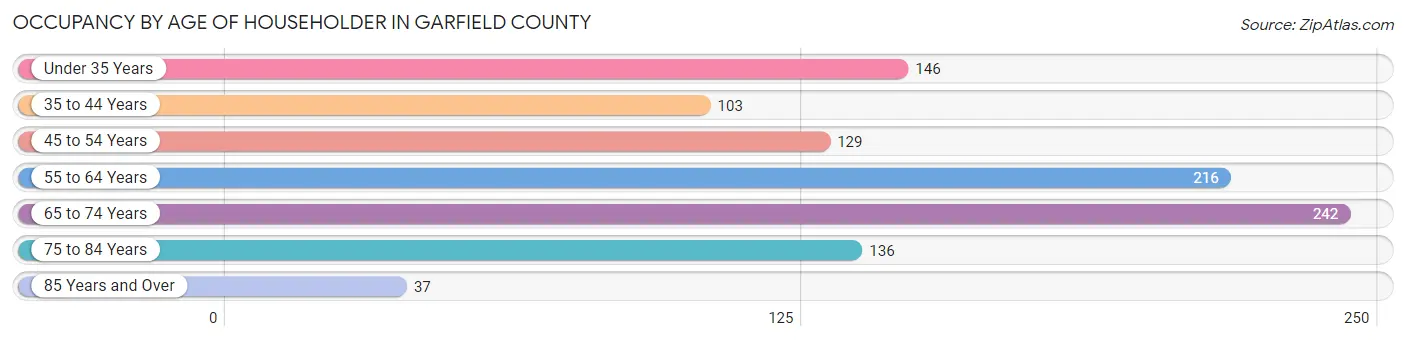
| Age Bracket | # Households | % Households |
| Under 35 Years | 146 | 14.5% |
| 35 to 44 Years | 103 | 10.2% |
| 45 to 54 Years | 129 | 12.8% |
| 55 to 64 Years | 216 | 21.4% |
| 65 to 74 Years | 242 | 24.0% |
| 75 to 84 Years | 136 | 13.5% |
| 85 Years and Over | 37 | 3.7% |
| Total | 1,009 | 100.0% |
Housing Finances in Garfield County
Median Income by Occupancy in Garfield County
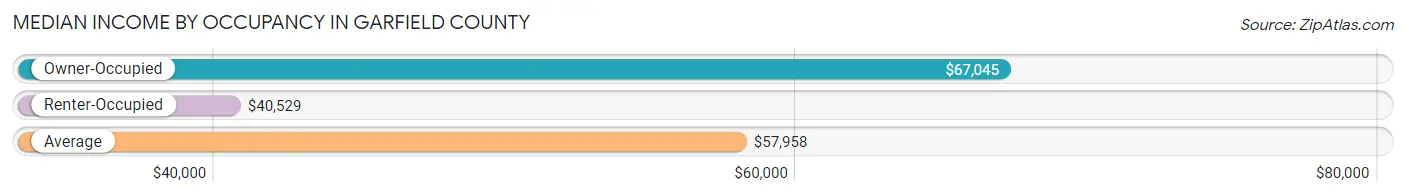
| Occupancy Type | # Households | Median Income |
| Owner-Occupied | 782 (77.5%) | $67,045 |
| Renter-Occupied | 227 (22.5%) | $40,529 |
| Average | 1,009 (100.0%) | $57,958 |
Occupancy by Householder Income Bracket in Garfield County
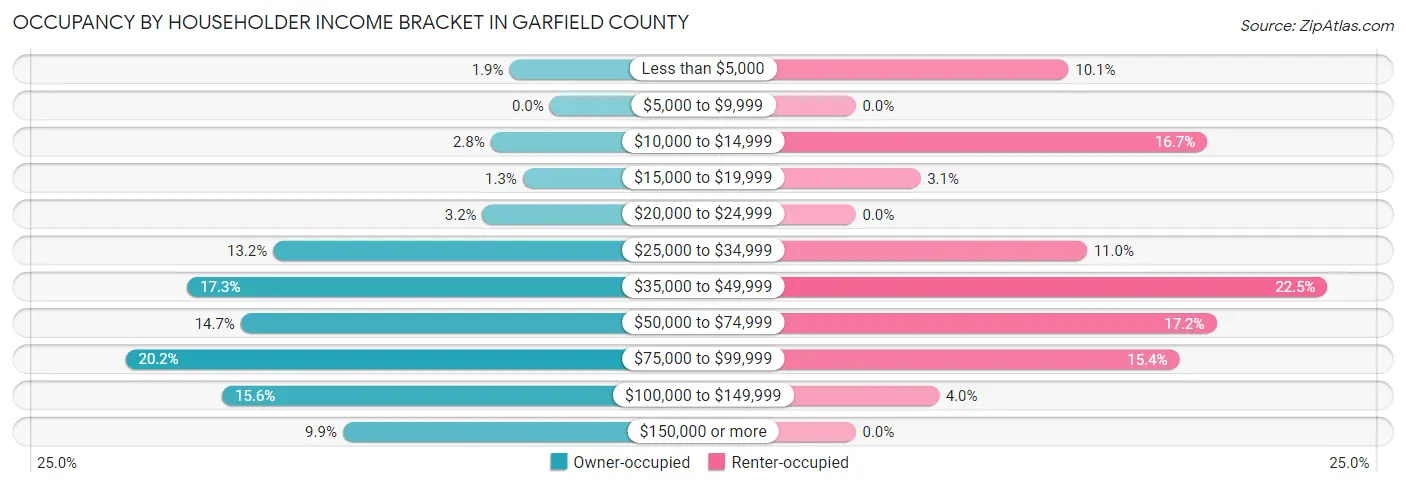
| Income Bracket | Owner-occupied | Renter-occupied |
| Less than $5,000 | 15 (1.9%) | 23 (10.1%) |
| $5,000 to $9,999 | 0 (0.0%) | 0 (0.0%) |
| $10,000 to $14,999 | 22 (2.8%) | 38 (16.7%) |
| $15,000 to $19,999 | 10 (1.3%) | 7 (3.1%) |
| $20,000 to $24,999 | 25 (3.2%) | 0 (0.0%) |
| $25,000 to $34,999 | 103 (13.2%) | 25 (11.0%) |
| $35,000 to $49,999 | 135 (17.3%) | 51 (22.5%) |
| $50,000 to $74,999 | 115 (14.7%) | 39 (17.2%) |
| $75,000 to $99,999 | 158 (20.2%) | 35 (15.4%) |
| $100,000 to $149,999 | 122 (15.6%) | 9 (4.0%) |
| $150,000 or more | 77 (9.9%) | 0 (0.0%) |
| Total | 782 (100.0%) | 227 (100.0%) |
Monthly Housing Cost Tiers in Garfield County
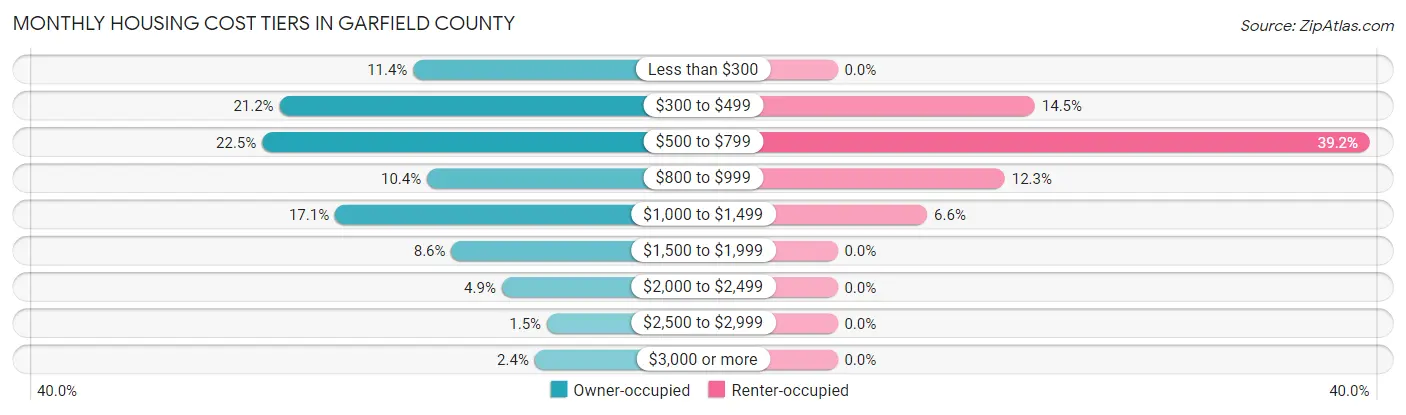
| Monthly Cost | Owner-occupied | Renter-occupied |
| Less than $300 | 89 (11.4%) | 0 (0.0%) |
| $300 to $499 | 166 (21.2%) | 33 (14.5%) |
| $500 to $799 | 176 (22.5%) | 89 (39.2%) |
| $800 to $999 | 81 (10.4%) | 28 (12.3%) |
| $1,000 to $1,499 | 134 (17.1%) | 15 (6.6%) |
| $1,500 to $1,999 | 67 (8.6%) | 0 (0.0%) |
| $2,000 to $2,499 | 38 (4.9%) | 0 (0.0%) |
| $2,500 to $2,999 | 12 (1.5%) | 0 (0.0%) |
| $3,000 or more | 19 (2.4%) | 0 (0.0%) |
| Total | 782 (100.0%) | 227 (100.0%) |
Physical Housing Characteristics in Garfield County
Housing Structures in Garfield County
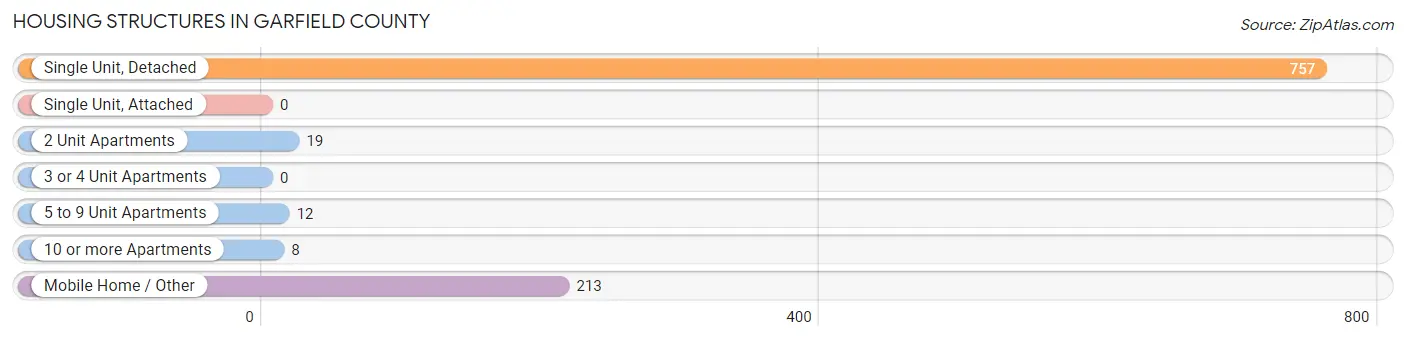
| Structure Type | # Housing Units | % Housing Units |
| Single Unit, Detached | 757 | 75.0% |
| Single Unit, Attached | 0 | 0.0% |
| 2 Unit Apartments | 19 | 1.9% |
| 3 or 4 Unit Apartments | 0 | 0.0% |
| 5 to 9 Unit Apartments | 12 | 1.2% |
| 10 or more Apartments | 8 | 0.8% |
| Mobile Home / Other | 213 | 21.1% |
| Total | 1,009 | 100.0% |
Housing Structures by Occupancy in Garfield County
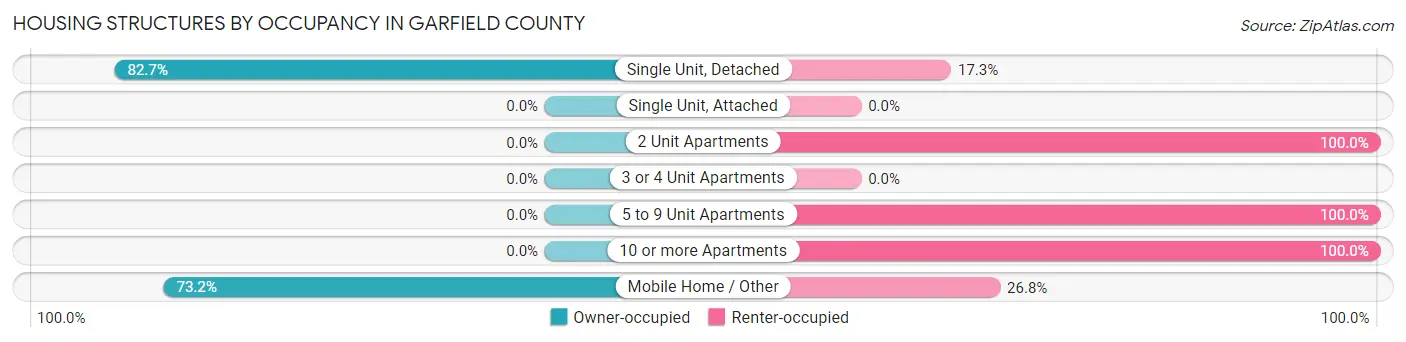
| Structure Type | Owner-occupied | Renter-occupied |
| Single Unit, Detached | 626 (82.7%) | 131 (17.3%) |
| Single Unit, Attached | 0 (0.0%) | 0 (0.0%) |
| 2 Unit Apartments | 0 (0.0%) | 19 (100.0%) |
| 3 or 4 Unit Apartments | 0 (0.0%) | 0 (0.0%) |
| 5 to 9 Unit Apartments | 0 (0.0%) | 12 (100.0%) |
| 10 or more Apartments | 0 (0.0%) | 8 (100.0%) |
| Mobile Home / Other | 156 (73.2%) | 57 (26.8%) |
| Total | 782 (77.5%) | 227 (22.5%) |
Housing Structures by Number of Rooms in Garfield County
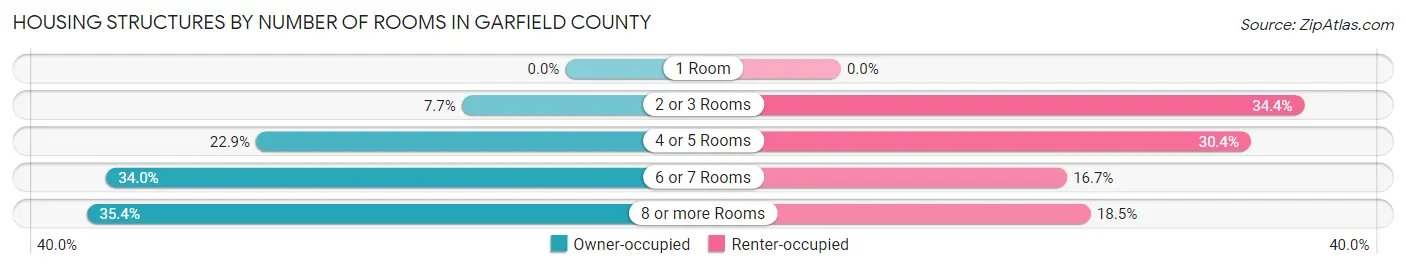
| Number of Rooms | Owner-occupied | Renter-occupied |
| 1 Room | 0 (0.0%) | 0 (0.0%) |
| 2 or 3 Rooms | 60 (7.7%) | 78 (34.4%) |
| 4 or 5 Rooms | 179 (22.9%) | 69 (30.4%) |
| 6 or 7 Rooms | 266 (34.0%) | 38 (16.7%) |
| 8 or more Rooms | 277 (35.4%) | 42 (18.5%) |
| Total | 782 (100.0%) | 227 (100.0%) |
Housing Structure by Heating Type in Garfield County
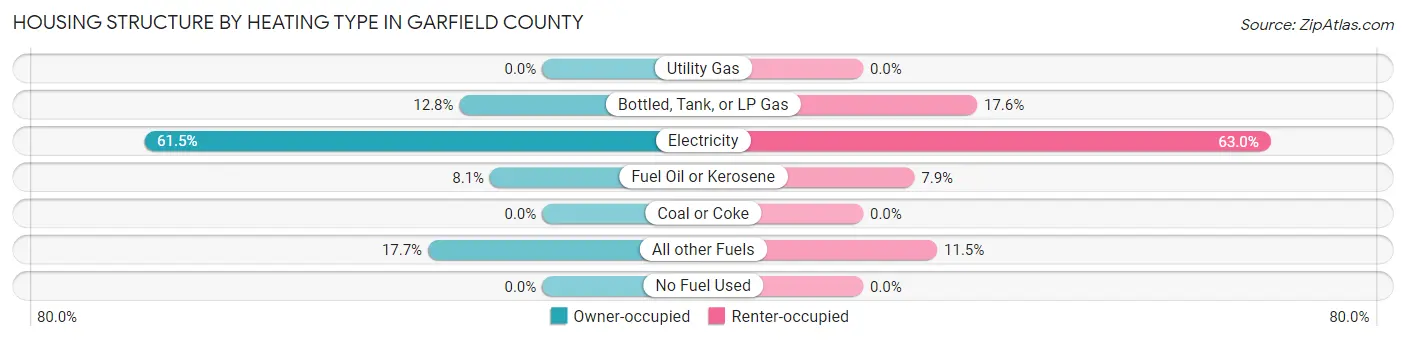
| Heating Type | Owner-occupied | Renter-occupied |
| Utility Gas | 0 (0.0%) | 0 (0.0%) |
| Bottled, Tank, or LP Gas | 100 (12.8%) | 40 (17.6%) |
| Electricity | 481 (61.5%) | 143 (63.0%) |
| Fuel Oil or Kerosene | 63 (8.1%) | 18 (7.9%) |
| Coal or Coke | 0 (0.0%) | 0 (0.0%) |
| All other Fuels | 138 (17.6%) | 26 (11.5%) |
| No Fuel Used | 0 (0.0%) | 0 (0.0%) |
| Total | 782 (100.0%) | 227 (100.0%) |
Household Vehicle Usage in Garfield County
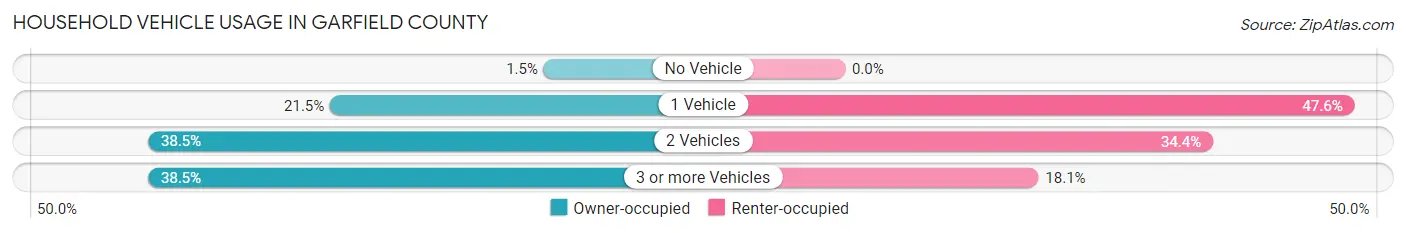
| Vehicles per Household | Owner-occupied | Renter-occupied |
| No Vehicle | 12 (1.5%) | 0 (0.0%) |
| 1 Vehicle | 168 (21.5%) | 108 (47.6%) |
| 2 Vehicles | 301 (38.5%) | 78 (34.4%) |
| 3 or more Vehicles | 301 (38.5%) | 41 (18.1%) |
| Total | 782 (100.0%) | 227 (100.0%) |
Real Estate & Mortgages in Garfield County
Real Estate and Mortgage Overview in Garfield County
| Characteristic | Without Mortgage | With Mortgage |
| Housing Units | 403 | 379 |
| Median Property Value | $140,200 | $216,700 |
| Median Household Income | $64,375 | $41 |
| Monthly Housing Costs | $450 | $19 |
| Real Estate Taxes | $1,093 | $1 |
Property Value by Mortgage Status in Garfield County
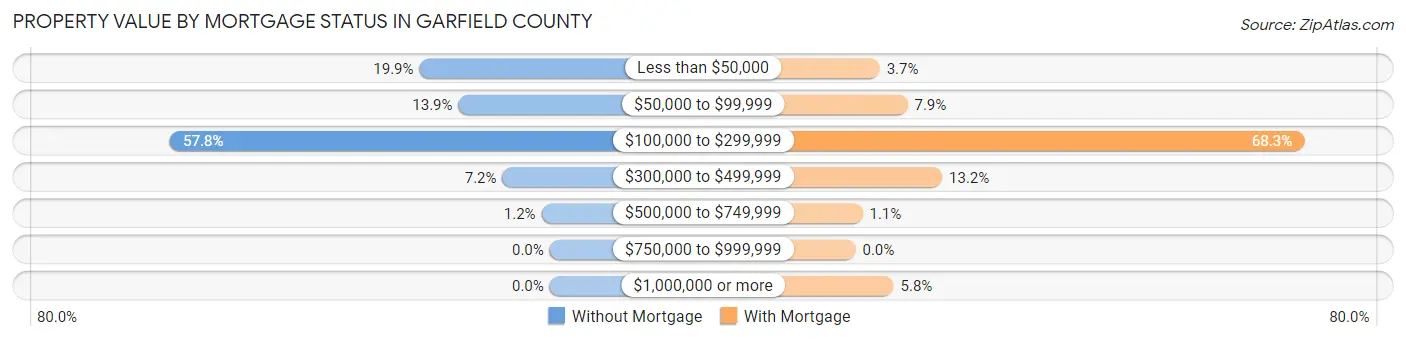
| Property Value | Without Mortgage | With Mortgage |
| Less than $50,000 | 80 (19.9%) | 14 (3.7%) |
| $50,000 to $99,999 | 56 (13.9%) | 30 (7.9%) |
| $100,000 to $299,999 | 233 (57.8%) | 259 (68.3%) |
| $300,000 to $499,999 | 29 (7.2%) | 50 (13.2%) |
| $500,000 to $749,999 | 5 (1.2%) | 4 (1.1%) |
| $750,000 to $999,999 | 0 (0.0%) | 0 (0.0%) |
| $1,000,000 or more | 0 (0.0%) | 22 (5.8%) |
| Total | 403 (100.0%) | 379 (100.0%) |
Household Income by Mortgage Status in Garfield County
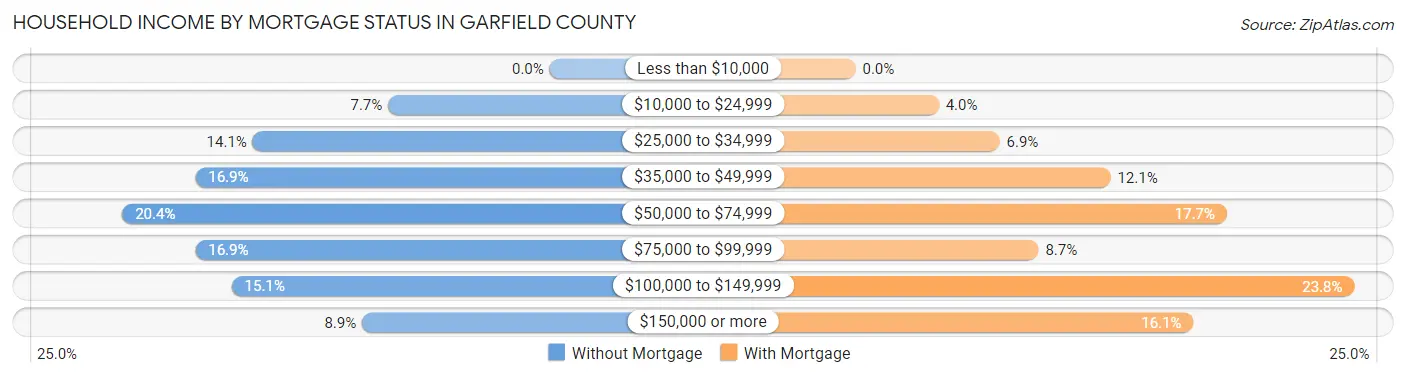
| Household Income | Without Mortgage | With Mortgage |
| Less than $10,000 | 0 (0.0%) | 0 (0.0%) |
| $10,000 to $24,999 | 31 (7.7%) | 15 (4.0%) |
| $25,000 to $34,999 | 57 (14.1%) | 26 (6.9%) |
| $35,000 to $49,999 | 68 (16.9%) | 46 (12.1%) |
| $50,000 to $74,999 | 82 (20.3%) | 67 (17.7%) |
| $75,000 to $99,999 | 68 (16.9%) | 33 (8.7%) |
| $100,000 to $149,999 | 61 (15.1%) | 90 (23.7%) |
| $150,000 or more | 36 (8.9%) | 61 (16.1%) |
| Total | 403 (100.0%) | 379 (100.0%) |
Property Value to Household Income Ratio in Garfield County
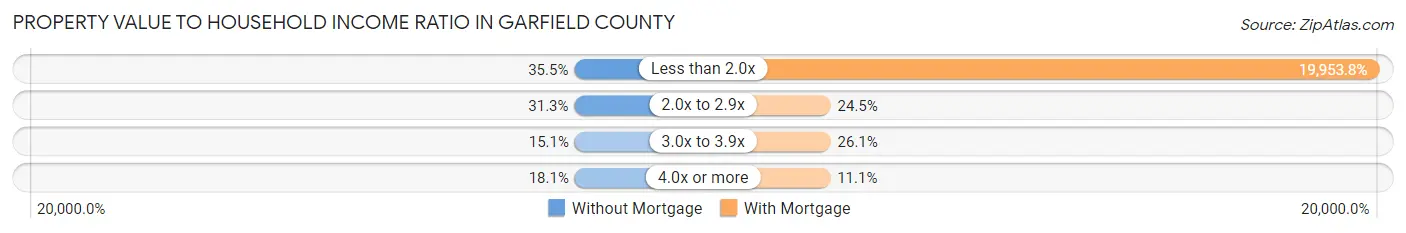
| Value-to-Income Ratio | Without Mortgage | With Mortgage |
| Less than 2.0x | 143 (35.5%) | 75,625 (19,953.8%) |
| 2.0x to 2.9x | 126 (31.3%) | 93 (24.5%) |
| 3.0x to 3.9x | 61 (15.1%) | 99 (26.1%) |
| 4.0x or more | 73 (18.1%) | 42 (11.1%) |
| Total | 403 (100.0%) | 379 (100.0%) |
Real Estate Taxes by Mortgage Status in Garfield County
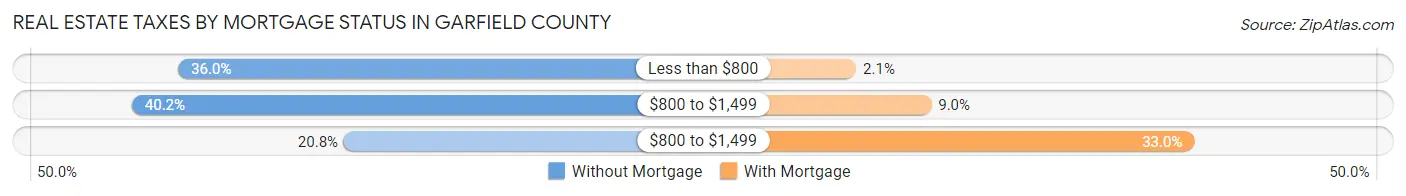
| Property Taxes | Without Mortgage | With Mortgage |
| Less than $800 | 145 (36.0%) | 8 (2.1%) |
| $800 to $1,499 | 162 (40.2%) | 34 (9.0%) |
| $800 to $1,499 | 84 (20.8%) | 125 (33.0%) |
| Total | 403 (100.0%) | 379 (100.0%) |
Health & Disability in Garfield County
Health Insurance Coverage by Age in Garfield County
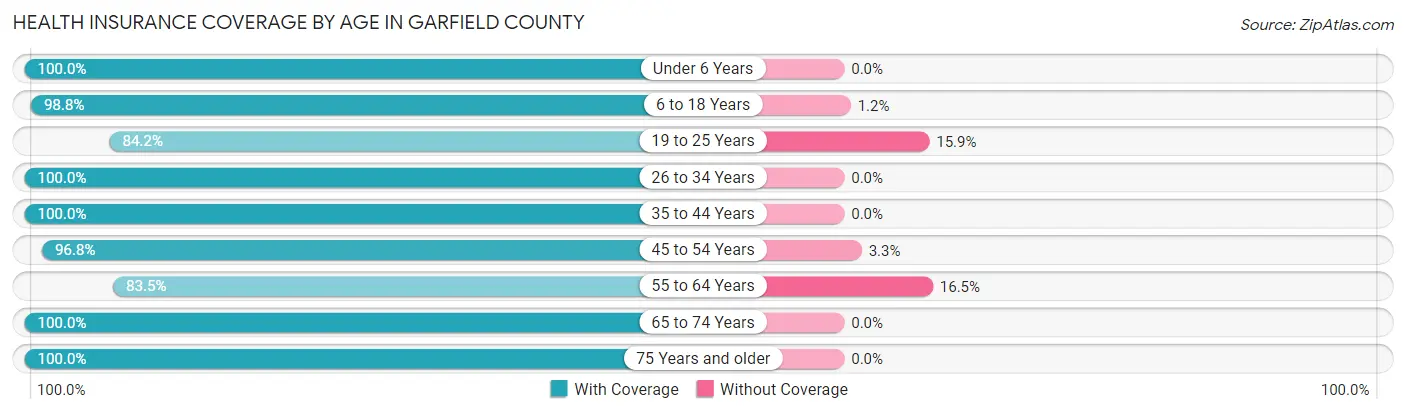
| Age Bracket | With Coverage | Without Coverage |
| Under 6 Years | 138 (100.0%) | 0 (0.0%) |
| 6 to 18 Years | 329 (98.8%) | 4 (1.2%) |
| 19 to 25 Years | 138 (84.2%) | 26 (15.9%) |
| 26 to 34 Years | 177 (100.0%) | 0 (0.0%) |
| 35 to 44 Years | 256 (100.0%) | 0 (0.0%) |
| 45 to 54 Years | 238 (96.8%) | 8 (3.3%) |
| 55 to 64 Years | 288 (83.5%) | 57 (16.5%) |
| 65 to 74 Years | 395 (100.0%) | 0 (0.0%) |
| 75 Years and older | 229 (100.0%) | 0 (0.0%) |
| Total | 2,188 (95.8%) | 95 (4.2%) |
Health Insurance Coverage by Citizenship Status in Garfield County
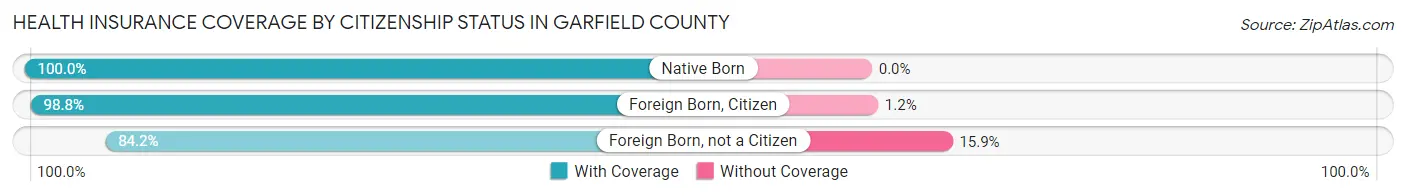
| Citizenship Status | With Coverage | Without Coverage |
| Native Born | 138 (100.0%) | 0 (0.0%) |
| Foreign Born, Citizen | 329 (98.8%) | 4 (1.2%) |
| Foreign Born, not a Citizen | 138 (84.2%) | 26 (15.9%) |
Health Insurance Coverage by Household Income in Garfield County
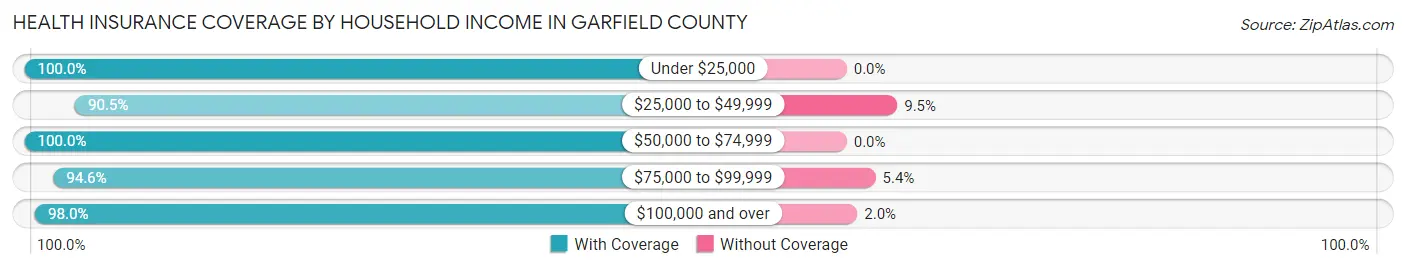
| Household Income | With Coverage | Without Coverage |
| Under $25,000 | 235 (100.0%) | 0 (0.0%) |
| $25,000 to $49,999 | 536 (90.5%) | 56 (9.5%) |
| $50,000 to $74,999 | 345 (100.0%) | 0 (0.0%) |
| $75,000 to $99,999 | 473 (94.6%) | 27 (5.4%) |
| $100,000 and over | 595 (98.0%) | 12 (2.0%) |
Public vs Private Health Insurance Coverage by Age in Garfield County
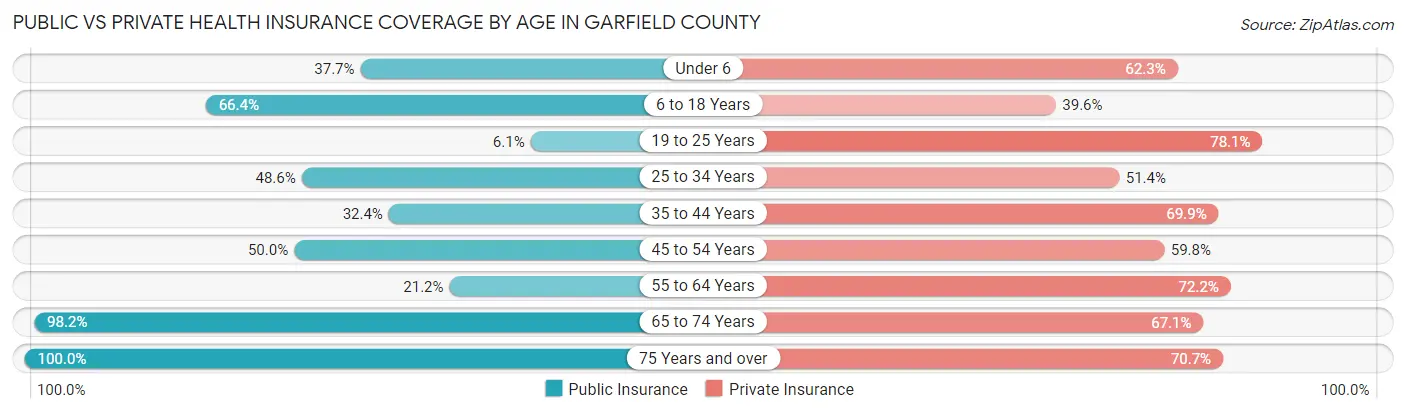
| Age Bracket | Public Insurance | Private Insurance |
| Under 6 | 52 (37.7%) | 86 (62.3%) |
| 6 to 18 Years | 221 (66.4%) | 132 (39.6%) |
| 19 to 25 Years | 10 (6.1%) | 128 (78.0%) |
| 25 to 34 Years | 86 (48.6%) | 91 (51.4%) |
| 35 to 44 Years | 83 (32.4%) | 179 (69.9%) |
| 45 to 54 Years | 123 (50.0%) | 147 (59.8%) |
| 55 to 64 Years | 73 (21.2%) | 249 (72.2%) |
| 65 to 74 Years | 388 (98.2%) | 265 (67.1%) |
| 75 Years and over | 229 (100.0%) | 162 (70.7%) |
| Total | 1,265 (55.4%) | 1,439 (63.0%) |
Disability Status by Sex by Age in Garfield County
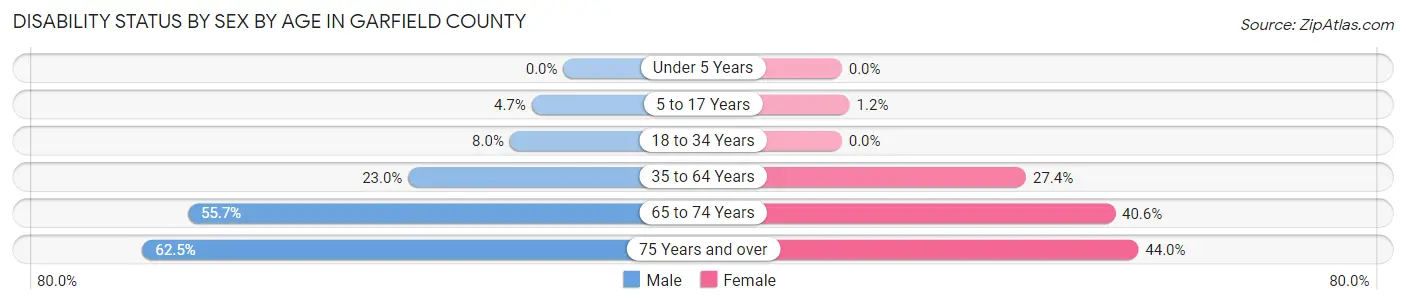
| Age Bracket | Male | Female |
| Under 5 Years | 0 (0.0%) | 0 (0.0%) |
| 5 to 17 Years | 8 (4.7%) | 2 (1.2%) |
| 18 to 34 Years | 16 (8.0%) | 0 (0.0%) |
| 35 to 64 Years | 100 (23.0%) | 113 (27.4%) |
| 65 to 74 Years | 102 (55.7%) | 86 (40.6%) |
| 75 Years and over | 75 (62.5%) | 48 (44.0%) |
Disability Class by Sex by Age in Garfield County
Disability Class: Hearing Difficulty
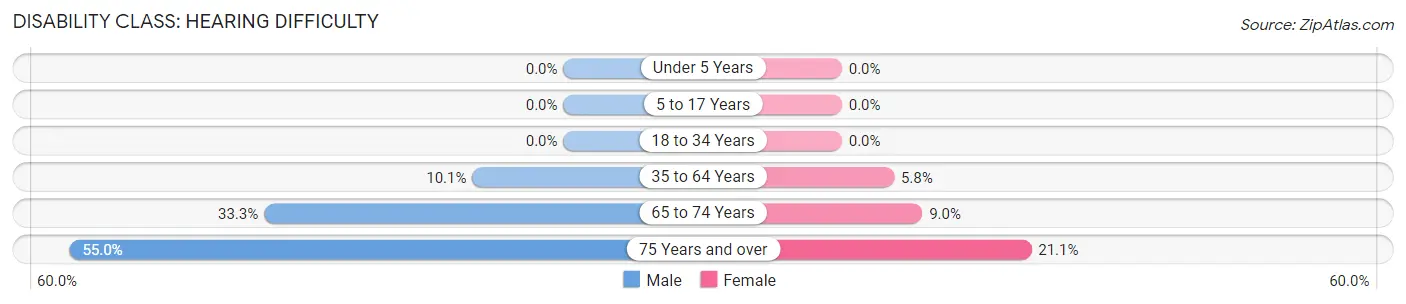
| Age Bracket | Male | Female |
| Under 5 Years | 0 (0.0%) | 0 (0.0%) |
| 5 to 17 Years | 0 (0.0%) | 0 (0.0%) |
| 18 to 34 Years | 0 (0.0%) | 0 (0.0%) |
| 35 to 64 Years | 44 (10.1%) | 24 (5.8%) |
| 65 to 74 Years | 61 (33.3%) | 19 (9.0%) |
| 75 Years and over | 66 (55.0%) | 23 (21.1%) |
Disability Class: Vision Difficulty
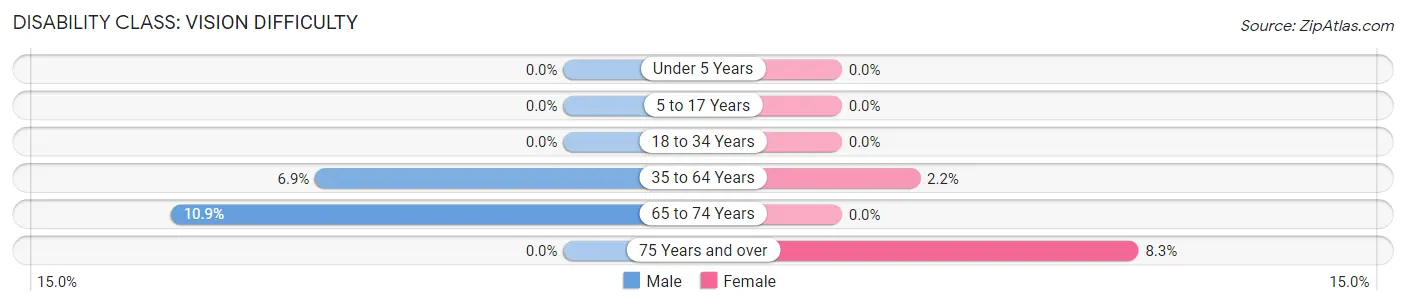
| Age Bracket | Male | Female |
| Under 5 Years | 0 (0.0%) | 0 (0.0%) |
| 5 to 17 Years | 0 (0.0%) | 0 (0.0%) |
| 18 to 34 Years | 0 (0.0%) | 0 (0.0%) |
| 35 to 64 Years | 30 (6.9%) | 9 (2.2%) |
| 65 to 74 Years | 20 (10.9%) | 0 (0.0%) |
| 75 Years and over | 0 (0.0%) | 9 (8.3%) |
Disability Class: Cognitive Difficulty
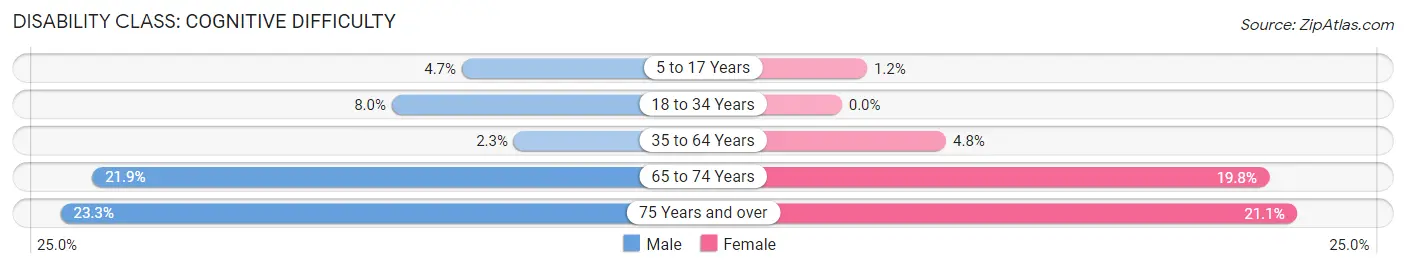
| Age Bracket | Male | Female |
| 5 to 17 Years | 8 (4.7%) | 2 (1.2%) |
| 18 to 34 Years | 16 (8.0%) | 0 (0.0%) |
| 35 to 64 Years | 10 (2.3%) | 20 (4.8%) |
| 65 to 74 Years | 40 (21.9%) | 42 (19.8%) |
| 75 Years and over | 28 (23.3%) | 23 (21.1%) |
Disability Class: Ambulatory Difficulty
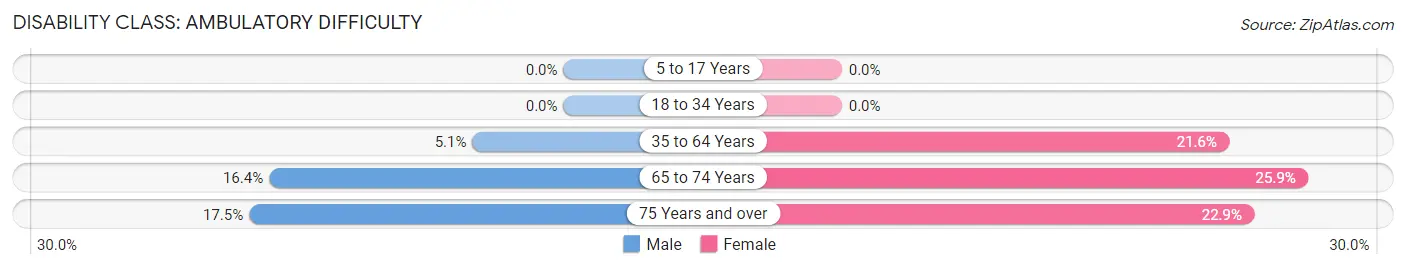
| Age Bracket | Male | Female |
| 5 to 17 Years | 0 (0.0%) | 0 (0.0%) |
| 18 to 34 Years | 0 (0.0%) | 0 (0.0%) |
| 35 to 64 Years | 22 (5.1%) | 89 (21.5%) |
| 65 to 74 Years | 30 (16.4%) | 55 (25.9%) |
| 75 Years and over | 21 (17.5%) | 25 (22.9%) |
Disability Class: Self-Care Difficulty
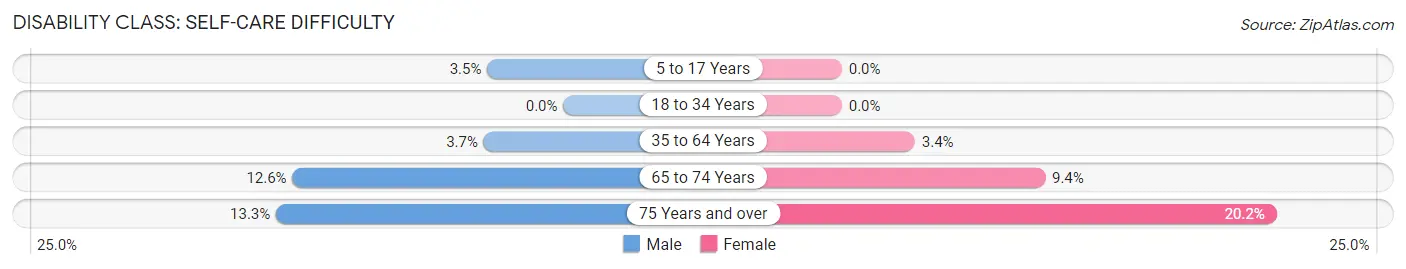
| Age Bracket | Male | Female |
| 5 to 17 Years | 6 (3.5%) | 0 (0.0%) |
| 18 to 34 Years | 0 (0.0%) | 0 (0.0%) |
| 35 to 64 Years | 16 (3.7%) | 14 (3.4%) |
| 65 to 74 Years | 23 (12.6%) | 20 (9.4%) |
| 75 Years and over | 16 (13.3%) | 22 (20.2%) |
Technology Access in Garfield County
Computing Device Access in Garfield County
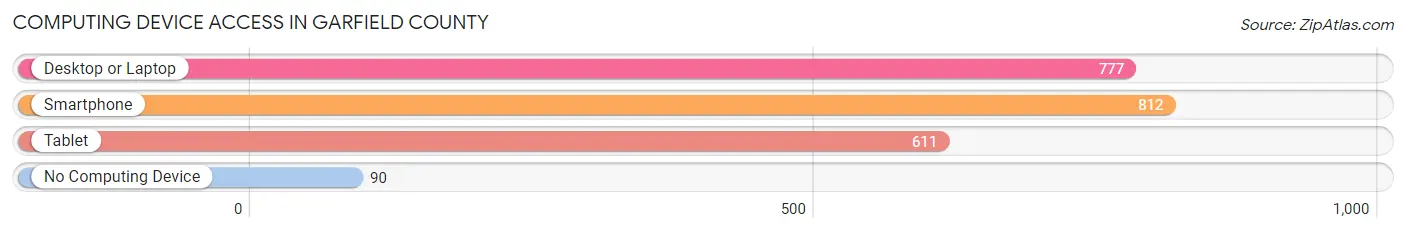
| Device Type | # Households | % Households |
| Desktop or Laptop | 777 | 77.0% |
| Smartphone | 812 | 80.5% |
| Tablet | 611 | 60.6% |
| No Computing Device | 90 | 8.9% |
| Total | 1,009 | 100.0% |
Internet Access in Garfield County
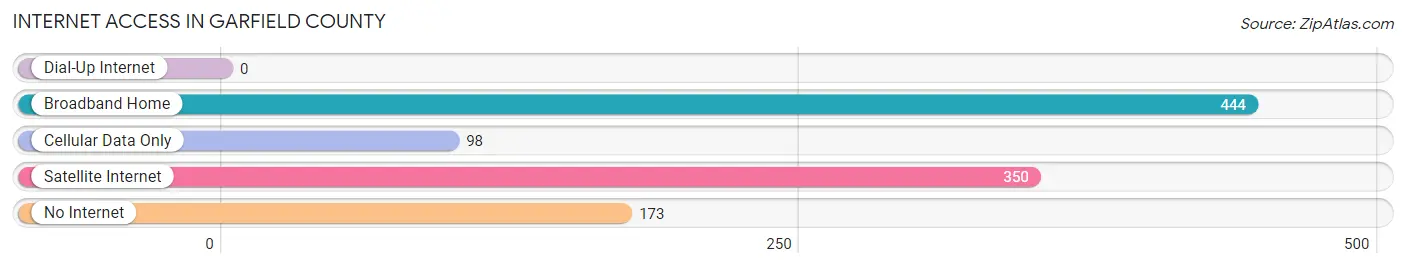
| Internet Type | # Households | % Households |
| Dial-Up Internet | 0 | 0.0% |
| Broadband Home | 444 | 44.0% |
| Cellular Data Only | 98 | 9.7% |
| Satellite Internet | 350 | 34.7% |
| No Internet | 173 | 17.2% |
| Total | 1,009 | 100.0% |
Garfield County Summary
Garfield County is located in the southeastern corner of Washington State, and is bordered by Columbia, Walla Walla, and Asotin Counties. The county seat is Pomeroy, and the county is named after James A. Garfield, the 20th President of the United States. Garfield County covers an area of 1,741 square miles, and has a population of 2,717 people, according to the 2010 census.
History
Garfield County was created in 1883 from parts of Columbia and Walla Walla Counties. The county was named after James A. Garfield, the 20th President of the United States. The county seat was originally located in the town of Garfield, but was moved to Pomeroy in 1887.
The area was originally inhabited by the Nez Perce and Palouse tribes, who were later displaced by settlers in the late 19th century. The first settlers in the area were miners, who were attracted to the area by the discovery of gold in the nearby mountains. The gold rush was short-lived, however, and the area soon became an agricultural center, with wheat, barley, and oats being the main crops.
Geography
Garfield County is located in the southeastern corner of Washington State, and is bordered by Columbia, Walla Walla, and Asotin Counties. The county covers an area of 1,741 square miles, and is mostly rural, with only a few small towns. The county is located in the Palouse region of Washington, and is characterized by rolling hills and fertile soil. The county is home to several rivers, including the Snake, Palouse, and Tucannon Rivers.
The highest point in the county is Mount Garfield, which has an elevation of 5,890 feet. The county is also home to several lakes, including Lake Herbert, Lake Bryan, and Lake Pomeroy.
Economy
The economy of Garfield County is largely based on agriculture. Wheat, barley, and oats are the main crops, and the county is also home to several dairy farms. The county is also home to several small businesses, including restaurants, retail stores, and service providers.
The county is also home to several natural resources, including timber, coal, and natural gas. The county is also home to several recreational activities, including fishing, hunting, and camping.
Demographics
According to the 2010 census, Garfield County had a population of 2,717 people. The population was spread out, with 48.3% male and 51.7% female. The median age was 44.7 years, and the median household income was $37,917.
The racial makeup of the county was 94.2% White, 0.7% African American, 0.7% Native American, 0.3% Asian, 0.1% Pacific Islander, 1.2% from other races, and 2.8% from two or more races. Hispanic or Latino of any race were 4.2% of the population.
Conclusion
Garfield County is a rural county located in the southeastern corner of Washington State. The county is home to a population of 2,717 people, and is largely based on agriculture. The county is also home to several natural resources, including timber, coal, and natural gas. The county is also home to several recreational activities, including fishing, hunting, and camping.
Common Questions
What is Per Capita Income in Garfield County?
Per Capita income in Garfield County is $31,187.
What is the Median Family Income in Garfield County?
Median Family Income in Garfield County is $77,629.
What is the Median Household income in Garfield County?
Median Household Income in Garfield County is $57,958.
What is Income or Wage Gap in Garfield County?
Income or Wage Gap in Garfield County is 23.8%.
Women in Garfield County earn 76.2 cents for every dollar earned by a man.
What is Inequality or Gini Index in Garfield County?
Inequality or Gini Index in Garfield County is 0.39.
What is the Total Population of Garfield County?
Total Population of Garfield County is 2,310.
What is the Total Male Population of Garfield County?
Total Male Population of Garfield County is 1,174.
What is the Total Female Population of Garfield County?
Total Female Population of Garfield County is 1,136.
What is the Ratio of Males per 100 Females in Garfield County?
There are 103.35 Males per 100 Females in Garfield County.
What is the Ratio of Females per 100 Males in Garfield County?
There are 96.76 Females per 100 Males in Garfield County.
What is the Median Population Age in Garfield County?
Median Population Age in Garfield County is 49.9 Years.
What is the Average Family Size in Garfield County
Average Family Size in Garfield County is 2.8 People.
What is the Average Household Size in Garfield County
Average Household Size in Garfield County is 2.3 People.
How Large is the Labor Force in Garfield County?
There are 972 People in the Labor Forcein in Garfield County.
What is the Percentage of People in the Labor Force in Garfield County?
49.5% of People are in the Labor Force in Garfield County.
What is the Unemployment Rate in Garfield County?
Unemployment Rate in Garfield County is 6.5%.