Ferry County, WA Map & Demographics
Ferry County Map
Ferry County Overview
$31,355
PER CAPITA INCOME
$71,099
AVG FAMILY INCOME
$50,424
AVG HOUSEHOLD INCOME
17.5%
WAGE / INCOME GAP [ % ]
82.5¢/ $1
WAGE / INCOME GAP [ $ ]
$10,053
FAMILY INCOME DEFICIT
0.48
INEQUALITY / GINI INDEX
7,260
TOTAL POPULATION
3,645
MALE POPULATION
3,615
FEMALE POPULATION
100.83
MALES / 100 FEMALES
99.18
FEMALES / 100 MALES
51.8
MEDIAN AGE
3.0
AVG FAMILY SIZE
2.3
AVG HOUSEHOLD SIZE
2,726
LABOR FORCE [ PEOPLE ]
44.3%
PERCENT IN LABOR FORCE
7.6%
UNEMPLOYMENT RATE
Ferry County Area Codes
Income in Ferry County
Income Overview in Ferry County
Per Capita Income in Ferry County is $31,355, while median incomes of families and households are $71,099 and $50,424 respectively.
| Characteristic | Number | Measure |
| Per Capita Income | 7,260 | $31,355 |
| Median Family Income | 1,770 | $71,099 |
| Mean Family Income | 1,770 | $92,069 |
| Median Household Income | 3,025 | $50,424 |
| Mean Household Income | 3,025 | $70,873 |
| Income Deficit | 1,770 | $10,053 |
| Wage / Income Gap (%) | 7,260 | 17.50% |
| Wage / Income Gap ($) | 7,260 | 82.50¢ per $1 |
| Gini / Inequality Index | 7,260 | 0.48 |
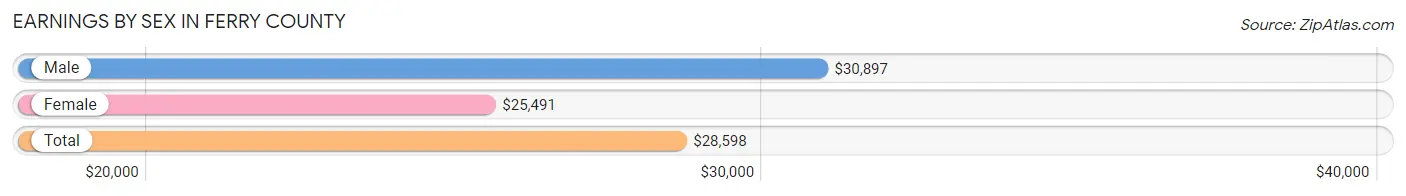
Earnings by Sex in Ferry County
Average Earnings in Ferry County are $28,598, $30,897 for men and $25,491 for women, a difference of 17.5%.
| Sex | Number | Average Earnings |
| Male | 1,703 (55.7%) | $30,897 |
| Female | 1,353 (44.3%) | $25,491 |
| Total | 3,056 (100.0%) | $28,598 |
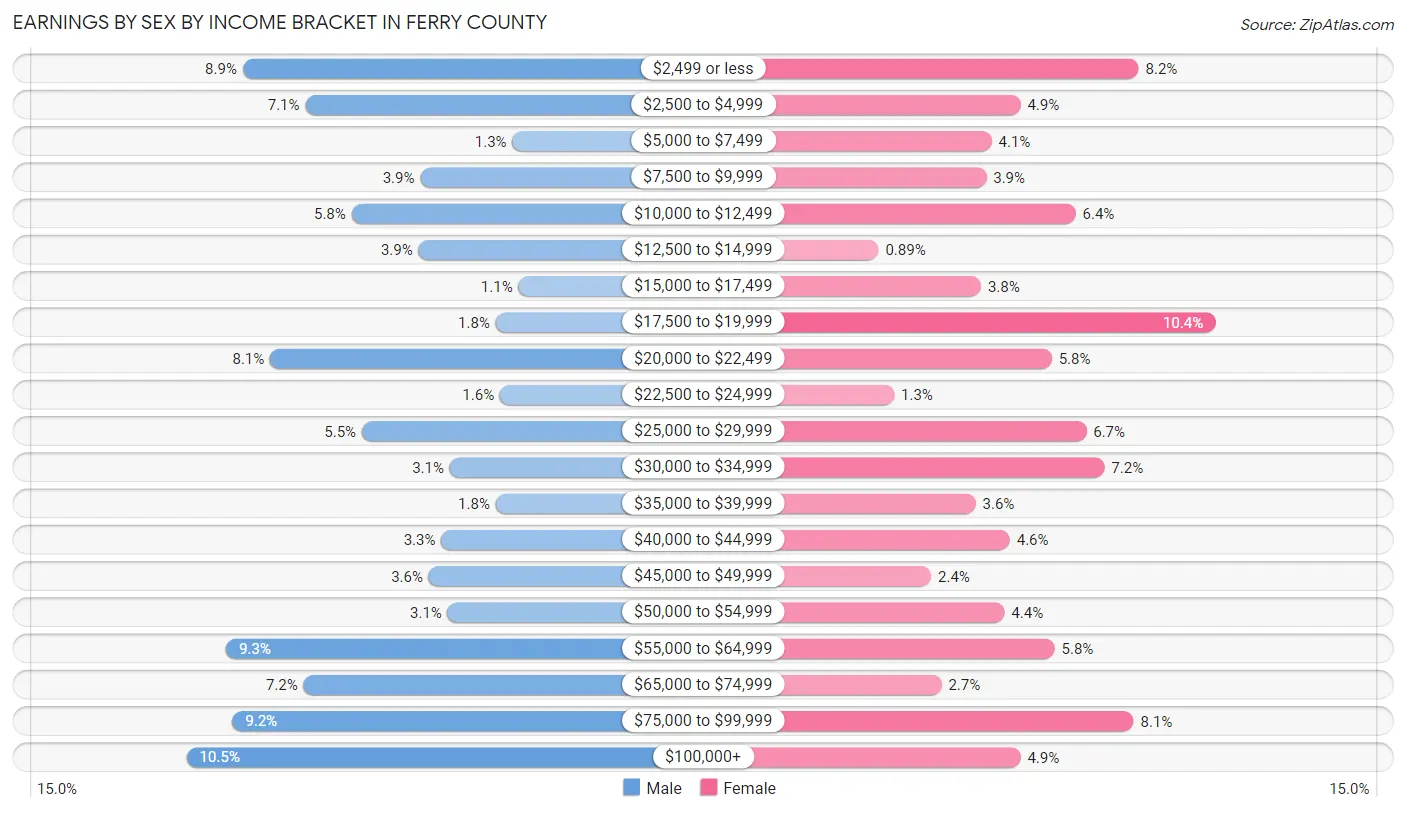
Earnings by Sex by Income Bracket in Ferry County
The most common earnings brackets in Ferry County are $100,000+ for men (178 | 10.4%) and $17,500 to $19,999 for women (140 | 10.3%).
| Income | Male | Female |
| $2,499 or less | 151 (8.9%) | 111 (8.2%) |
| $2,500 to $4,999 | 121 (7.1%) | 66 (4.9%) |
| $5,000 to $7,499 | 22 (1.3%) | 55 (4.1%) |
| $7,500 to $9,999 | 66 (3.9%) | 53 (3.9%) |
| $10,000 to $12,499 | 99 (5.8%) | 87 (6.4%) |
| $12,500 to $14,999 | 67 (3.9%) | 12 (0.9%) |
| $15,000 to $17,499 | 19 (1.1%) | 51 (3.8%) |
| $17,500 to $19,999 | 30 (1.8%) | 140 (10.3%) |
| $20,000 to $22,499 | 138 (8.1%) | 78 (5.8%) |
| $22,500 to $24,999 | 28 (1.6%) | 18 (1.3%) |
| $25,000 to $29,999 | 94 (5.5%) | 91 (6.7%) |
| $30,000 to $34,999 | 52 (3.0%) | 98 (7.2%) |
| $35,000 to $39,999 | 30 (1.8%) | 49 (3.6%) |
| $40,000 to $44,999 | 56 (3.3%) | 62 (4.6%) |
| $45,000 to $49,999 | 62 (3.6%) | 32 (2.4%) |
| $50,000 to $54,999 | 53 (3.1%) | 60 (4.4%) |
| $55,000 to $64,999 | 159 (9.3%) | 79 (5.8%) |
| $65,000 to $74,999 | 122 (7.2%) | 36 (2.7%) |
| $75,000 to $99,999 | 156 (9.2%) | 109 (8.1%) |
| $100,000+ | 178 (10.4%) | 66 (4.9%) |
| Total | 1,703 (100.0%) | 1,353 (100.0%) |
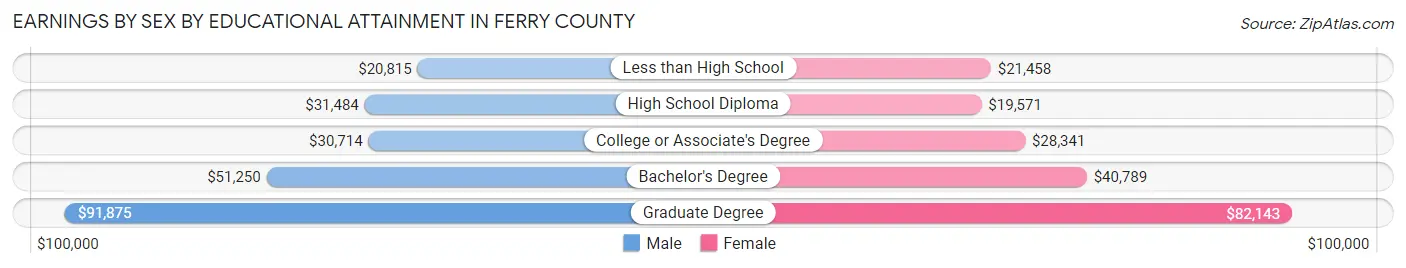
Earnings by Sex by Educational Attainment in Ferry County
Average earnings in Ferry County are $41,014 for men and $28,472 for women, a difference of 30.6%. Men with an educational attainment of graduate degree enjoy the highest average annual earnings of $91,875, while those with less than high school education earn the least with $20,815. Women with an educational attainment of graduate degree earn the most with the average annual earnings of $82,143, while those with high school diploma education have the smallest earnings of $19,571.
| Educational Attainment | Male Income | Female Income |
| Less than High School | $20,815 | $21,458 |
| High School Diploma | $31,484 | $19,571 |
| College or Associate's Degree | $30,714 | $28,341 |
| Bachelor's Degree | $51,250 | $40,789 |
| Graduate Degree | $91,875 | $82,143 |
| Total | $41,014 | $28,472 |
Family Income in Ferry County
Family Income Brackets in Ferry County
According to the Ferry County family income data, there are 363 families falling into the $50,000 to $74,999 income range, which is the most common income bracket and makes up 20.5% of all families. Conversely, the less than $10,000 income bracket is the least frequent group with only 42 families (2.4%) belonging to this category.
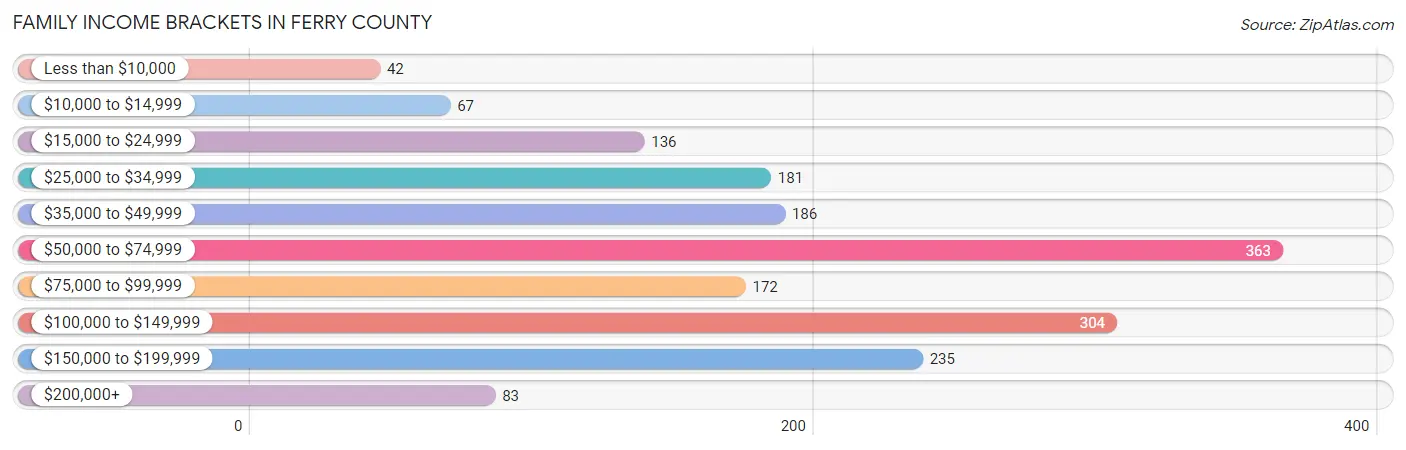
| Income Bracket | # Families | % Families |
| Less than $10,000 | 42 | 2.4% |
| $10,000 to $14,999 | 67 | 3.8% |
| $15,000 to $24,999 | 136 | 7.7% |
| $25,000 to $34,999 | 181 | 10.2% |
| $35,000 to $49,999 | 186 | 10.5% |
| $50,000 to $74,999 | 363 | 20.5% |
| $75,000 to $99,999 | 172 | 9.7% |
| $100,000 to $149,999 | 304 | 17.2% |
| $150,000 to $199,999 | 235 | 13.3% |
| $200,000+ | 83 | 4.7% |
Family Income by Famaliy Size in Ferry County
7+ person families (20 | 1.1%) account for the highest median family income in Ferry County with $233,077 per family, while 3-person families (330 | 18.6%) have the highest median income of $33,553 per family member.
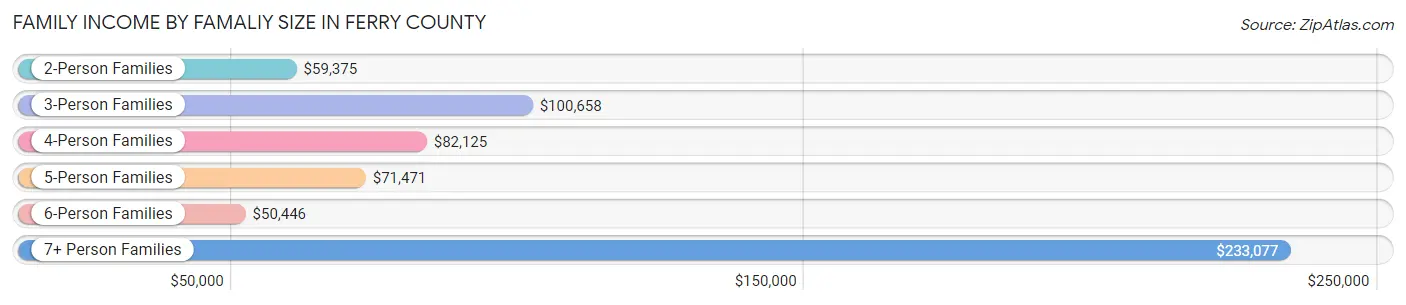
| Income Bracket | # Families | Median Income |
| 2-Person Families | 1,047 (59.2%) | $59,375 |
| 3-Person Families | 330 (18.6%) | $100,658 |
| 4-Person Families | 212 (12.0%) | $82,125 |
| 5-Person Families | 104 (5.9%) | $71,471 |
| 6-Person Families | 57 (3.2%) | $50,446 |
| 7+ Person Families | 20 (1.1%) | $233,077 |
| Total | 1,770 (100.0%) | $71,099 |
Family Income by Number of Earners in Ferry County
The median family income in Ferry County is $71,099, with families comprising 3+ earners (130) having the highest median family income of $140,250, while families with no earners (449) have the lowest median family income of $49,659, accounting for 7.3% and 25.4% of families, respectively.
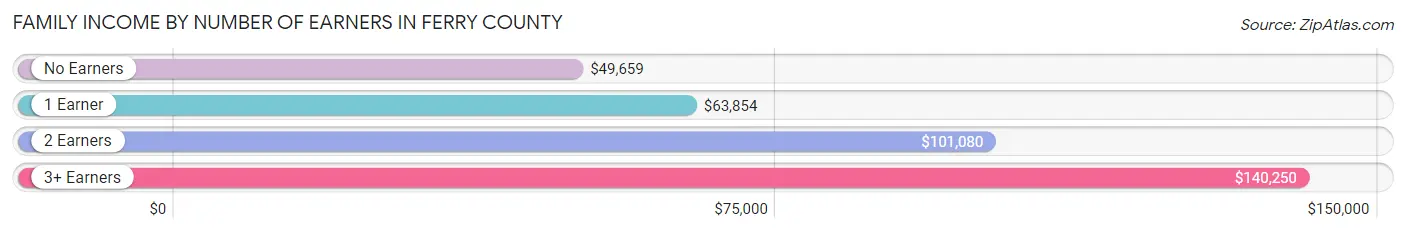
| Number of Earners | # Families | Median Income |
| No Earners | 449 (25.4%) | $49,659 |
| 1 Earner | 700 (39.6%) | $63,854 |
| 2 Earners | 491 (27.7%) | $101,080 |
| 3+ Earners | 130 (7.3%) | $140,250 |
| Total | 1,770 (100.0%) | $71,099 |
Household Income in Ferry County
Household Income Brackets in Ferry County
With 554 households falling in the category, the $50,000 to $74,999 income range is the most frequent in Ferry County, accounting for 18.3% of all households. In contrast, only 97 households (3.2%) fall into the $200,000+ income bracket, making it the least populous group.
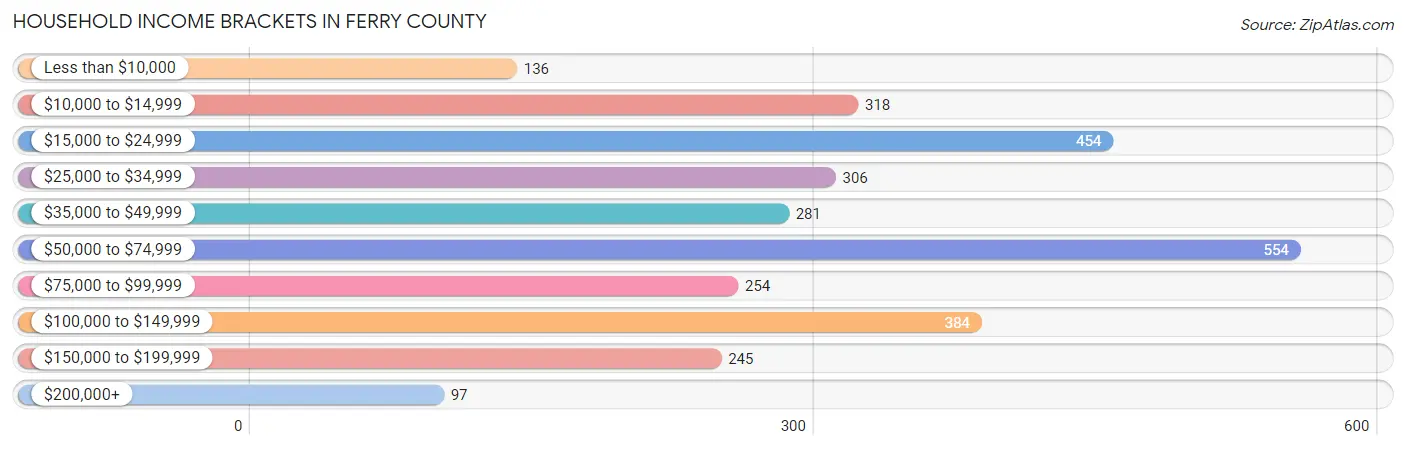
| Income Bracket | # Households | % Households |
| Less than $10,000 | 136 | 4.5% |
| $10,000 to $14,999 | 318 | 10.5% |
| $15,000 to $24,999 | 454 | 15.0% |
| $25,000 to $34,999 | 306 | 10.1% |
| $35,000 to $49,999 | 281 | 9.3% |
| $50,000 to $74,999 | 554 | 18.3% |
| $75,000 to $99,999 | 254 | 8.4% |
| $100,000 to $149,999 | 384 | 12.7% |
| $150,000 to $199,999 | 245 | 8.1% |
| $200,000+ | 97 | 3.2% |
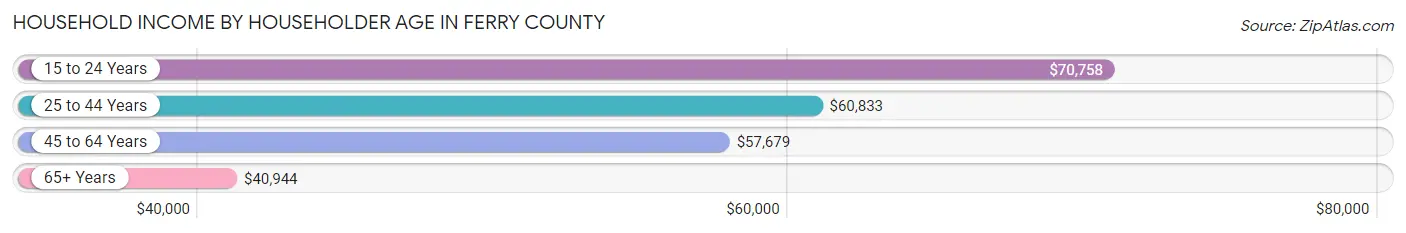
Household Income by Householder Age in Ferry County
The median household income in Ferry County is $50,424, with the highest median household income of $70,758 found in the 15 to 24 years age bracket for the primary householder. A total of 56 households (1.8%) fall into this category. Meanwhile, the 65+ years age bracket for the primary householder has the lowest median household income of $40,944, with 1,321 households (43.7%) in this group.
| Income Bracket | # Households | Median Income |
| 15 to 24 Years | 56 (1.8%) | $70,758 |
| 25 to 44 Years | 428 (14.1%) | $60,833 |
| 45 to 64 Years | 1,220 (40.3%) | $57,679 |
| 65+ Years | 1,321 (43.7%) | $40,944 |
| Total | 3,025 (100.0%) | $50,424 |
Poverty in Ferry County
Income Below Poverty by Sex and Age in Ferry County
With 17.0% poverty level for males and 14.0% for females among the residents of Ferry County, 6 to 11 year old males and 16 and 17 year old females are the most vulnerable to poverty, with 64 males (30.8%) and 23 females (29.1%) in their respective age groups living below the poverty level.
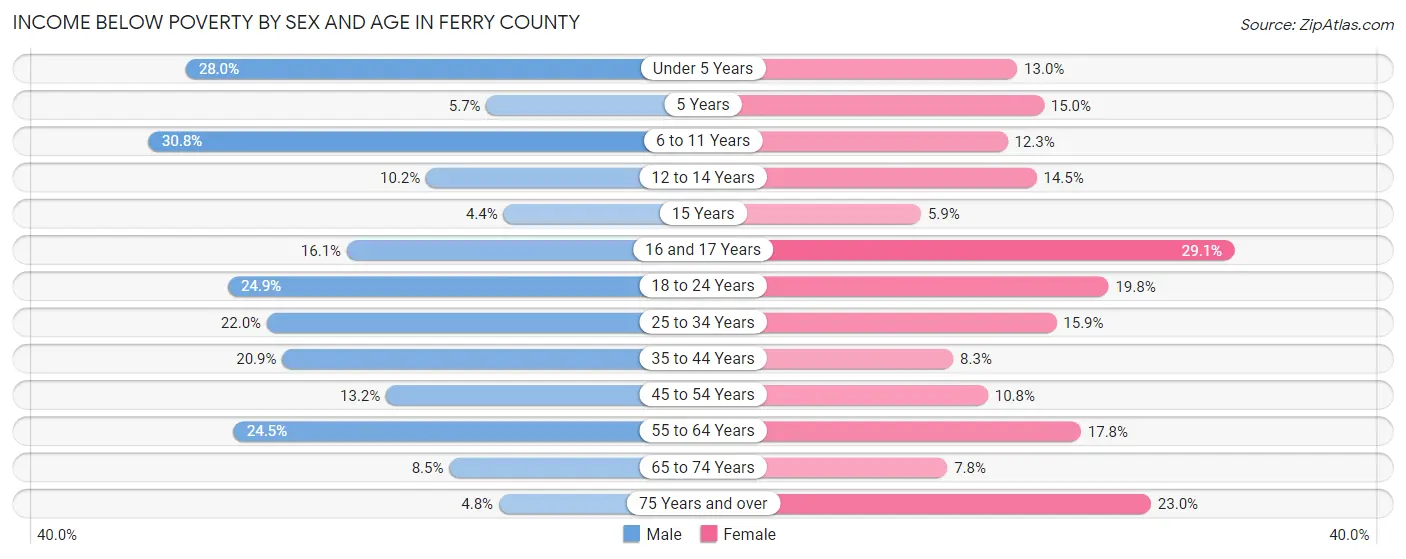
| Age Bracket | Male | Female |
| Under 5 Years | 44 (28.0%) | 22 (13.0%) |
| 5 Years | 2 (5.7%) | 3 (15.0%) |
| 6 to 11 Years | 64 (30.8%) | 30 (12.3%) |
| 12 to 14 Years | 11 (10.2%) | 12 (14.5%) |
| 15 Years | 2 (4.4%) | 1 (5.9%) |
| 16 and 17 Years | 9 (16.1%) | 23 (29.1%) |
| 18 to 24 Years | 62 (24.9%) | 40 (19.8%) |
| 25 to 34 Years | 59 (22.0%) | 47 (15.9%) |
| 35 to 44 Years | 77 (20.9%) | 34 (8.3%) |
| 45 to 54 Years | 55 (13.2%) | 45 (10.8%) |
| 55 to 64 Years | 147 (24.5%) | 112 (17.7%) |
| 65 to 74 Years | 60 (8.5%) | 52 (7.8%) |
| 75 Years and over | 17 (4.8%) | 84 (23.0%) |
| Total | 609 (17.0%) | 505 (14.0%) |
Income Above Poverty by Sex and Age in Ferry County
According to the poverty statistics in Ferry County, males aged 15 years and females aged 15 years are the age groups that are most secure financially, with 95.6% of males and 94.1% of females in these age groups living above the poverty line.
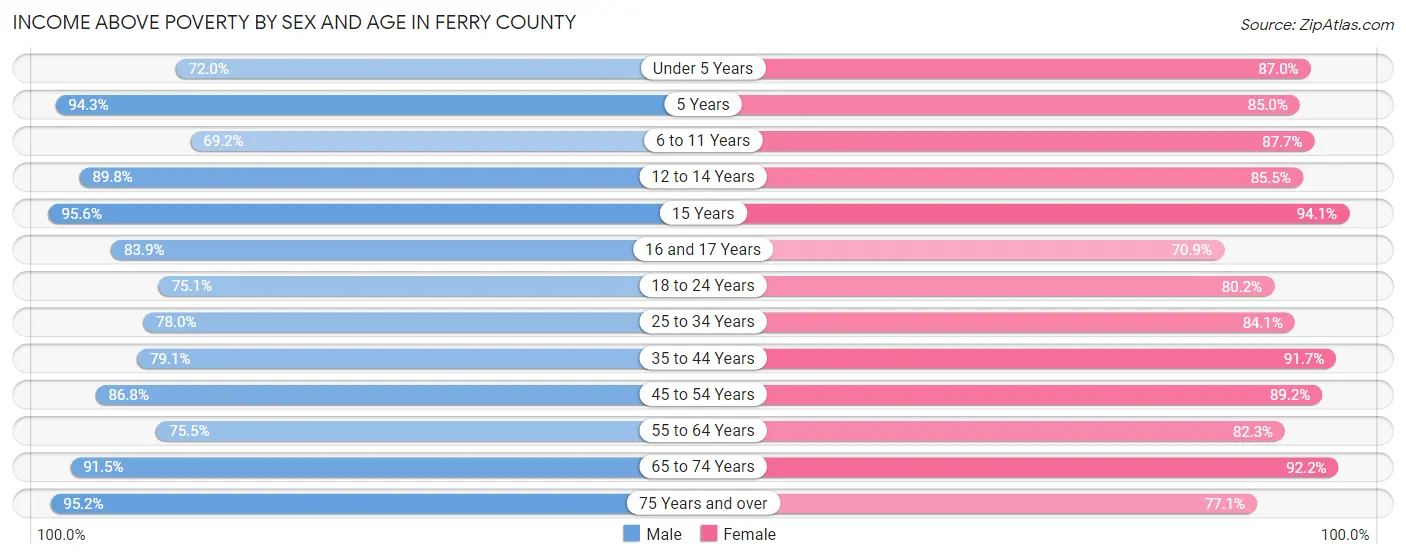
| Age Bracket | Male | Female |
| Under 5 Years | 113 (72.0%) | 147 (87.0%) |
| 5 Years | 33 (94.3%) | 17 (85.0%) |
| 6 to 11 Years | 144 (69.2%) | 214 (87.7%) |
| 12 to 14 Years | 97 (89.8%) | 71 (85.5%) |
| 15 Years | 43 (95.6%) | 16 (94.1%) |
| 16 and 17 Years | 47 (83.9%) | 56 (70.9%) |
| 18 to 24 Years | 187 (75.1%) | 162 (80.2%) |
| 25 to 34 Years | 209 (78.0%) | 248 (84.1%) |
| 35 to 44 Years | 292 (79.1%) | 377 (91.7%) |
| 45 to 54 Years | 363 (86.8%) | 370 (89.2%) |
| 55 to 64 Years | 454 (75.5%) | 519 (82.3%) |
| 65 to 74 Years | 648 (91.5%) | 612 (92.2%) |
| 75 Years and over | 339 (95.2%) | 282 (77.0%) |
| Total | 2,969 (83.0%) | 3,091 (86.0%) |
Income Below Poverty Among Married-Couple Families in Ferry County
The poverty statistics for married-couple families in Ferry County show that 5.4% or 75 of the total 1,379 families live below the poverty line. Families with 3 or 4 children have the highest poverty rate of 13.0%, comprising of 9 families. On the other hand, families with 5 or more children have the lowest poverty rate of 0.0%, which includes 0 families.
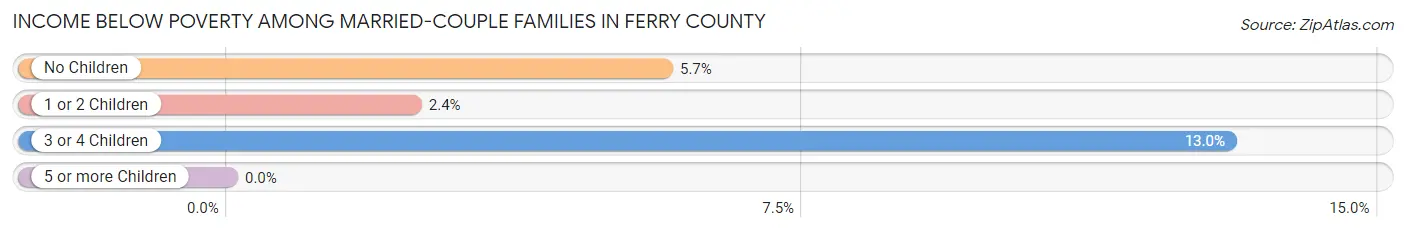
| Children | Above Poverty | Below Poverty |
| No Children | 997 (94.3%) | 60 (5.7%) |
| 1 or 2 Children | 244 (97.6%) | 6 (2.4%) |
| 3 or 4 Children | 60 (87.0%) | 9 (13.0%) |
| 5 or more Children | 3 (100.0%) | 0 (0.0%) |
| Total | 1,304 (94.6%) | 75 (5.4%) |
Income Below Poverty Among Single-Parent Households in Ferry County
According to the poverty data in Ferry County, 32.8% or 41 single-father households and 15.0% or 40 single-mother households are living below the poverty line. Among single-father households, those with 3 or 4 children have the highest poverty rate, with 13 households (86.7%) experiencing poverty. Likewise, among single-mother households, those with 1 or 2 children have the highest poverty rate, with 21 households (30.4%) falling below the poverty line.
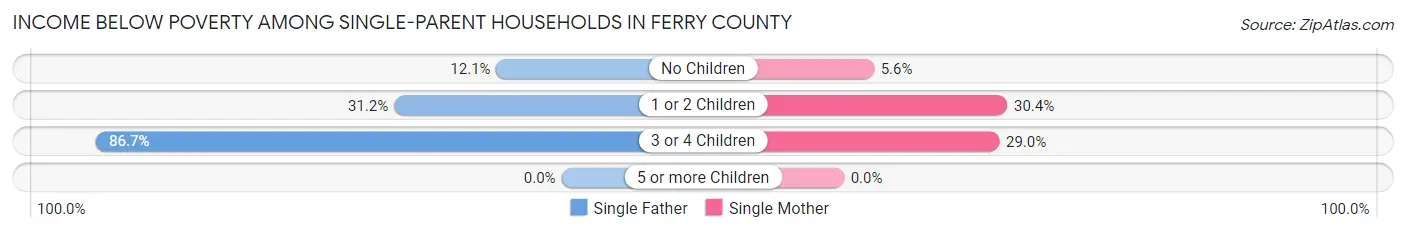
| Children | Single Father | Single Mother |
| No Children | 4 (12.1%) | 8 (5.6%) |
| 1 or 2 Children | 24 (31.2%) | 21 (30.4%) |
| 3 or 4 Children | 13 (86.7%) | 11 (28.9%) |
| 5 or more Children | 0 (0.0%) | 0 (0.0%) |
| Total | 41 (32.8%) | 40 (15.0%) |
Income Below Poverty Among Married-Couple vs Single-Parent Households in Ferry County
The poverty data for Ferry County shows that 75 of the married-couple family households (5.4%) and 81 of the single-parent households (20.7%) are living below the poverty level. Within the married-couple family households, those with 3 or 4 children have the highest poverty rate, with 9 households (13.0%) falling below the poverty line. Among the single-parent households, those with 3 or 4 children have the highest poverty rate, with 24 household (45.3%) living below poverty.
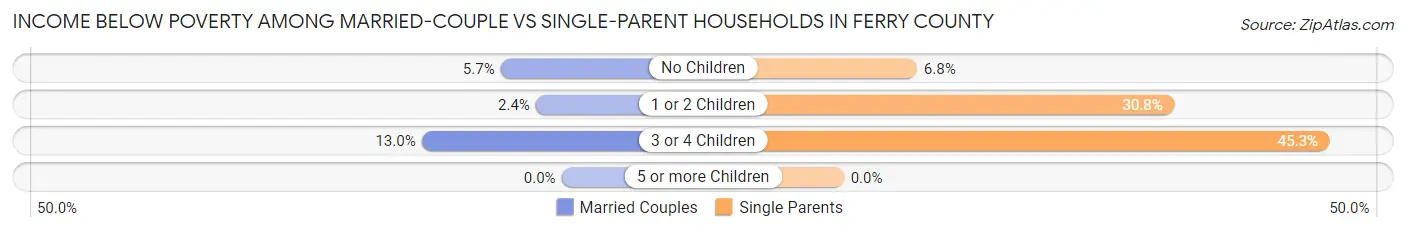
| Children | Married-Couple Families | Single-Parent Households |
| No Children | 60 (5.7%) | 12 (6.8%) |
| 1 or 2 Children | 6 (2.4%) | 45 (30.8%) |
| 3 or 4 Children | 9 (13.0%) | 24 (45.3%) |
| 5 or more Children | 0 (0.0%) | 0 (0.0%) |
| Total | 75 (5.4%) | 81 (20.7%) |
Race in Ferry County
The most populous races in Ferry County are White / Caucasian (5,254 | 72.4%), Native / Alaskan (1,094 | 15.1%), and Two or more Races (766 | 10.5%).
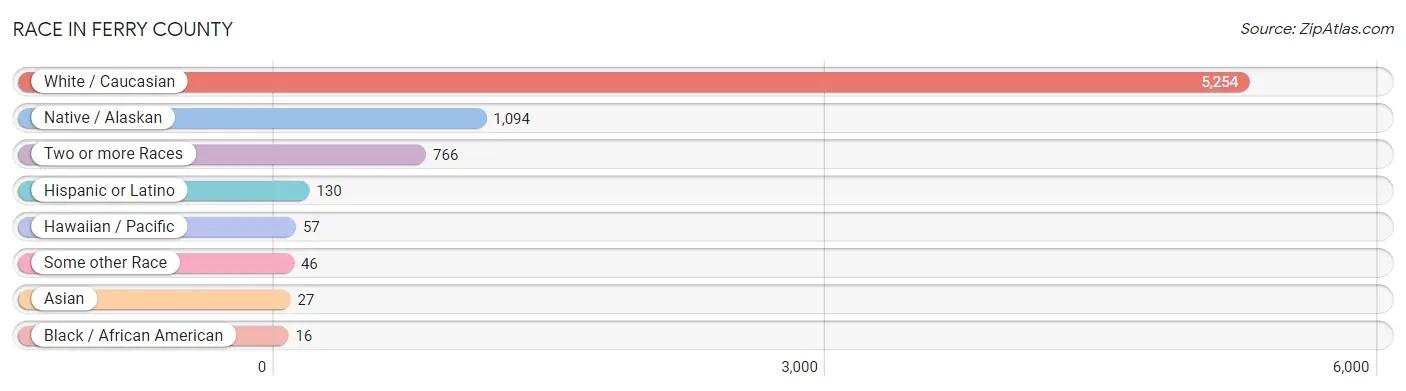
| Race | # Population | % Population |
| Asian | 27 | 0.4% |
| Black / African American | 16 | 0.2% |
| Hawaiian / Pacific | 57 | 0.8% |
| Hispanic or Latino | 130 | 1.8% |
| Native / Alaskan | 1,094 | 15.1% |
| White / Caucasian | 5,254 | 72.4% |
| Two or more Races | 766 | 10.5% |
| Some other Race | 46 | 0.6% |
| Total | 7,260 | 100.0% |
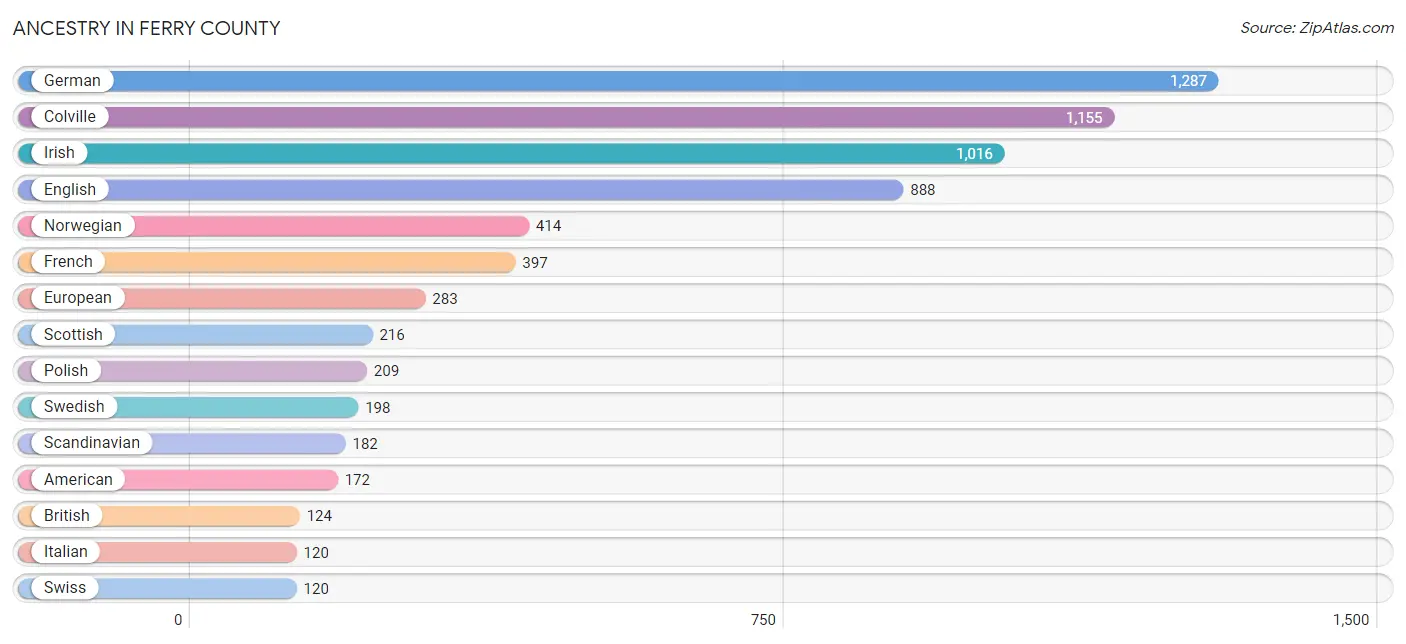
Ancestry in Ferry County
The most populous ancestries reported in Ferry County are German (1,287 | 17.7%), Colville (1,155 | 15.9%), Irish (1,016 | 14.0%), English (888 | 12.2%), and Norwegian (414 | 5.7%), together accounting for 65.6% of all Ferry County residents.
| Ancestry | # Population | % Population |
| African | 4 | 0.1% |
| Aleut | 14 | 0.2% |
| American | 172 | 2.4% |
| Arab | 20 | 0.3% |
| Bhutanese | 91 | 1.3% |
| Blackfeet | 67 | 0.9% |
| British | 124 | 1.7% |
| Canadian | 17 | 0.2% |
| Cherokee | 58 | 0.8% |
| Chippewa | 9 | 0.1% |
| Choctaw | 8 | 0.1% |
| Colombian | 1 | 0.0% |
| Colville | 1,155 | 15.9% |
| Cree | 13 | 0.2% |
| Crow | 28 | 0.4% |
| Czech | 8 | 0.1% |
| Danish | 47 | 0.6% |
| Delaware | 26 | 0.4% |
| Dutch | 79 | 1.1% |
| Eastern European | 47 | 0.6% |
| English | 888 | 12.2% |
| Ethiopian | 1 | 0.0% |
| European | 283 | 3.9% |
| Filipino | 7 | 0.1% |
| Finnish | 16 | 0.2% |
| French | 397 | 5.5% |
| French Canadian | 49 | 0.7% |
| German | 1,287 | 17.7% |
| Greek | 19 | 0.3% |
| Guamanian / Chamorro | 36 | 0.5% |
| Icelander | 4 | 0.1% |
| Indian (Asian) | 5 | 0.1% |
| Inupiat | 7 | 0.1% |
| Irish | 1,016 | 14.0% |
| Iroquois | 1 | 0.0% |
| Italian | 120 | 1.7% |
| Jamaican | 1 | 0.0% |
| Lithuanian | 23 | 0.3% |
| Luxembourger | 17 | 0.2% |
| Mexican | 86 | 1.2% |
| Mexican American Indian | 6 | 0.1% |
| Native Hawaiian | 12 | 0.2% |
| Navajo | 42 | 0.6% |
| Northern European | 51 | 0.7% |
| Norwegian | 414 | 5.7% |
| Polish | 209 | 2.9% |
| Portuguese | 93 | 1.3% |
| Puerto Rican | 13 | 0.2% |
| Puget Sound Salish | 55 | 0.8% |
| Russian | 2 | 0.0% |
| Scandinavian | 182 | 2.5% |
| Scotch-Irish | 91 | 1.3% |
| Scottish | 216 | 3.0% |
| Serbian | 18 | 0.3% |
| Shoshone | 7 | 0.1% |
| Sioux | 27 | 0.4% |
| Slovak | 4 | 0.1% |
| South American | 1 | 0.0% |
| Spaniard | 9 | 0.1% |
| Spanish | 20 | 0.3% |
| Sri Lankan | 10 | 0.1% |
| Subsaharan African | 5 | 0.1% |
| Swedish | 198 | 2.7% |
| Swiss | 120 | 1.7% |
| Thai | 21 | 0.3% |
| Turkish | 4 | 0.1% |
| Welsh | 40 | 0.5% |
| West Indian | 2 | 0.0% |
| Yakama | 1 | 0.0% |
| Yugoslavian | 3 | 0.0% | View All 70 Rows |
Immigrants in Ferry County
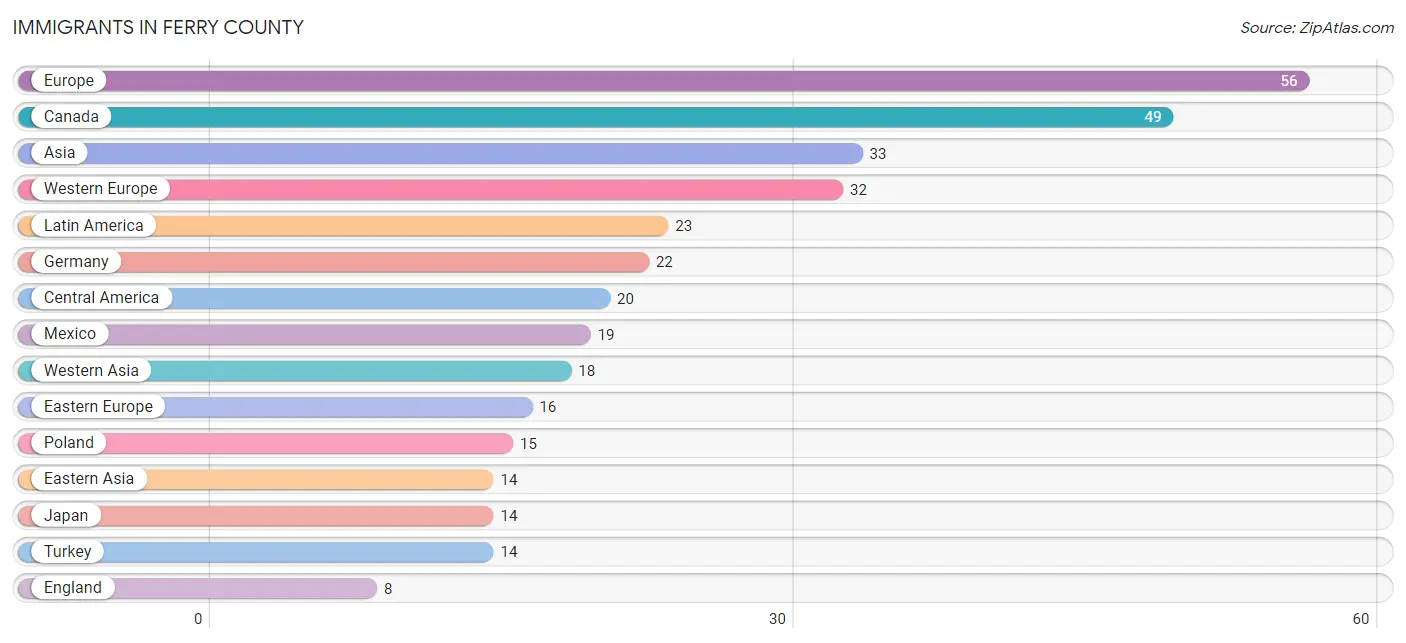
The most numerous immigrant groups reported in Ferry County came from Europe (56 | 0.8%), Canada (49 | 0.7%), Asia (33 | 0.4%), Western Europe (32 | 0.4%), and Latin America (23 | 0.3%), together accounting for 2.7% of all Ferry County residents.
| Immigration Origin | # Population | % Population |
| Africa | 5 | 0.1% |
| Asia | 33 | 0.4% |
| Canada | 49 | 0.7% |
| Caribbean | 3 | 0.0% |
| Central America | 20 | 0.3% |
| Eastern Asia | 14 | 0.2% |
| Eastern Europe | 16 | 0.2% |
| El Salvador | 1 | 0.0% |
| England | 8 | 0.1% |
| Europe | 56 | 0.8% |
| France | 7 | 0.1% |
| Germany | 22 | 0.3% |
| Jamaica | 1 | 0.0% |
| Japan | 14 | 0.2% |
| Latin America | 23 | 0.3% |
| Mexico | 19 | 0.3% |
| Netherlands | 3 | 0.0% |
| Northern Europe | 8 | 0.1% |
| Poland | 15 | 0.2% |
| Russia | 1 | 0.0% |
| Saudi Arabia | 4 | 0.1% |
| South Africa | 5 | 0.1% |
| South Eastern Asia | 1 | 0.0% |
| Turkey | 14 | 0.2% |
| Vietnam | 1 | 0.0% |
| Western Asia | 18 | 0.3% |
| Western Europe | 32 | 0.4% | View All 27 Rows |
Sex and Age in Ferry County
Sex and Age in Ferry County
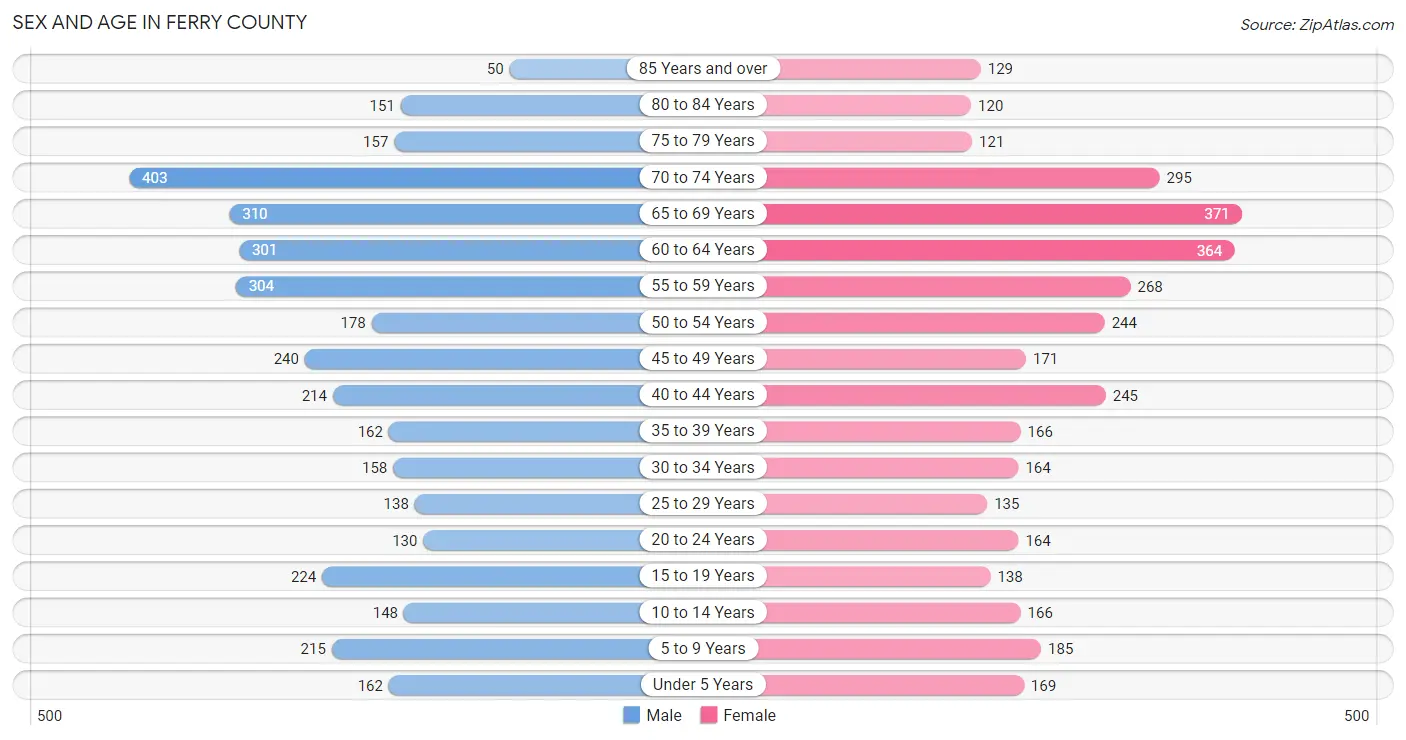
The most populous age groups in Ferry County are 70 to 74 Years (403 | 11.1%) for men and 65 to 69 Years (371 | 10.3%) for women.
| Age Bracket | Male | Female |
| Under 5 Years | 162 (4.4%) | 169 (4.7%) |
| 5 to 9 Years | 215 (5.9%) | 185 (5.1%) |
| 10 to 14 Years | 148 (4.1%) | 166 (4.6%) |
| 15 to 19 Years | 224 (6.1%) | 138 (3.8%) |
| 20 to 24 Years | 130 (3.6%) | 164 (4.5%) |
| 25 to 29 Years | 138 (3.8%) | 135 (3.7%) |
| 30 to 34 Years | 158 (4.3%) | 164 (4.5%) |
| 35 to 39 Years | 162 (4.4%) | 166 (4.6%) |
| 40 to 44 Years | 214 (5.9%) | 245 (6.8%) |
| 45 to 49 Years | 240 (6.6%) | 171 (4.7%) |
| 50 to 54 Years | 178 (4.9%) | 244 (6.8%) |
| 55 to 59 Years | 304 (8.3%) | 268 (7.4%) |
| 60 to 64 Years | 301 (8.3%) | 364 (10.1%) |
| 65 to 69 Years | 310 (8.5%) | 371 (10.3%) |
| 70 to 74 Years | 403 (11.1%) | 295 (8.2%) |
| 75 to 79 Years | 157 (4.3%) | 121 (3.4%) |
| 80 to 84 Years | 151 (4.1%) | 120 (3.3%) |
| 85 Years and over | 50 (1.4%) | 129 (3.6%) |
| Total | 3,645 (100.0%) | 3,615 (100.0%) |
Families and Households in Ferry County
Median Family Size in Ferry County
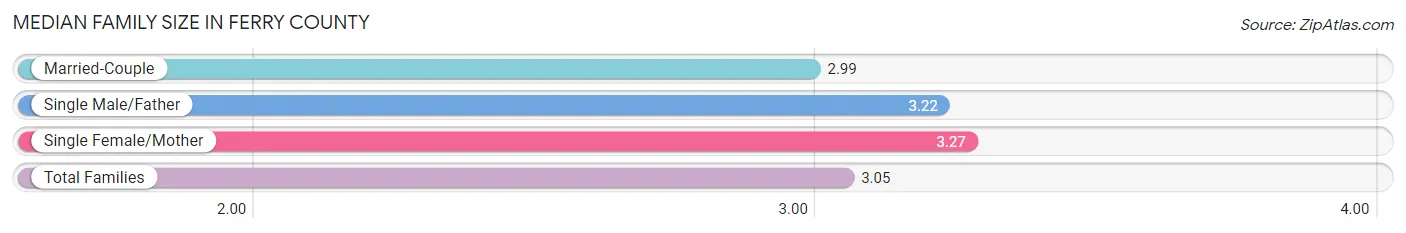
The median family size in Ferry County is 3.05 persons per family, with single female/mother families (266 | 15.0%) accounting for the largest median family size of 3.27 persons per family. On the other hand, married-couple families (1,379 | 77.9%) represent the smallest median family size with 2.99 persons per family.
| Family Type | # Families | Family Size |
| Married-Couple | 1,379 (77.9%) | 2.99 |
| Single Male/Father | 125 (7.1%) | 3.22 |
| Single Female/Mother | 266 (15.0%) | 3.27 |
| Total Families | 1,770 (100.0%) | 3.05 |
Median Household Size in Ferry County
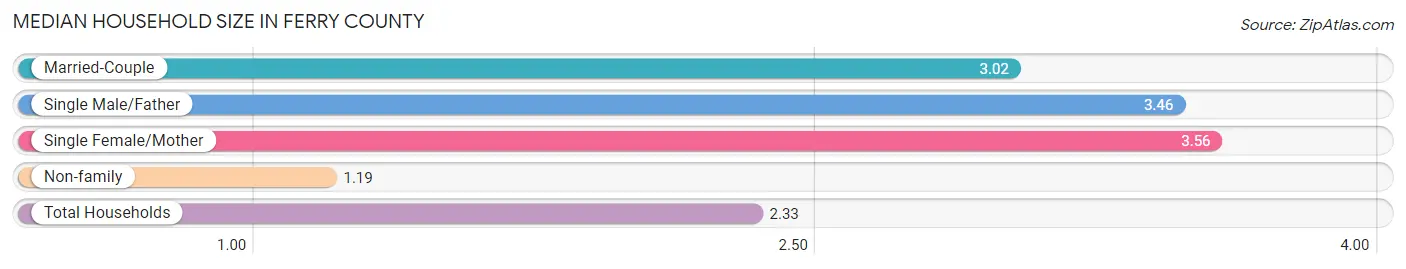
The median household size in Ferry County is 2.33 persons per household, with single female/mother households (266 | 8.8%) accounting for the largest median household size of 3.56 persons per household. non-family households (1,255 | 41.5%) represent the smallest median household size with 1.19 persons per household.
| Household Type | # Households | Household Size |
| Married-Couple | 1,379 (45.6%) | 3.02 |
| Single Male/Father | 125 (4.1%) | 3.46 |
| Single Female/Mother | 266 (8.8%) | 3.56 |
| Non-family | 1,255 (41.5%) | 1.19 |
| Total Households | 3,025 (100.0%) | 2.33 |
Household Size by Marriage Status in Ferry County
Out of a total of 3,025 households in Ferry County, 1,770 (58.5%) are family households, while 1,255 (41.5%) are nonfamily households. The most numerous type of family households are 2-person households, comprising 1,011, and the most common type of nonfamily households are 1-person households, comprising 1,048.
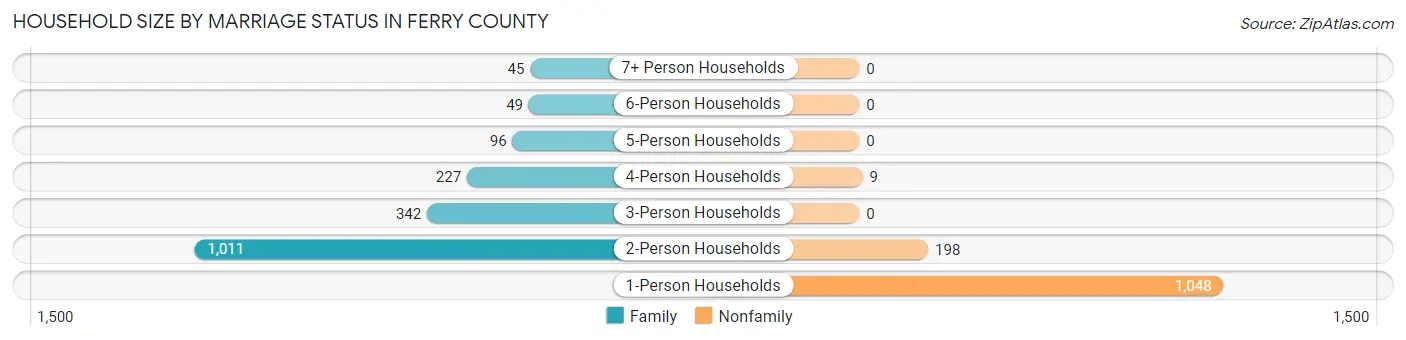
| Household Size | Family Households | Nonfamily Households |
| 1-Person Households | - | 1,048 (34.6%) |
| 2-Person Households | 1,011 (33.4%) | 198 (6.6%) |
| 3-Person Households | 342 (11.3%) | 0 (0.0%) |
| 4-Person Households | 227 (7.5%) | 9 (0.3%) |
| 5-Person Households | 96 (3.2%) | 0 (0.0%) |
| 6-Person Households | 49 (1.6%) | 0 (0.0%) |
| 7+ Person Households | 45 (1.5%) | 0 (0.0%) |
| Total | 1,770 (58.5%) | 1,255 (41.5%) |
Female Fertility in Ferry County
Fertility by Age in Ferry County
Average fertility rate in Ferry County is 31.0 births per 1,000 women. Women in the age bracket of 20 to 34 years have the highest fertility rate with 45.0 births per 1,000 women. Women in the age bracket of 20 to 34 years acount for 55.3% of all women with births.
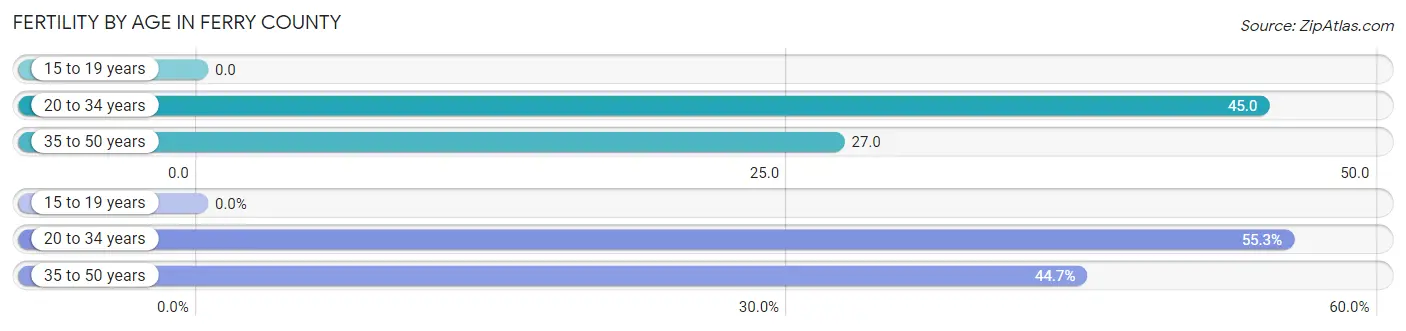
| Age Bracket | Women with Births | Births / 1,000 Women |
| 15 to 19 years | 0 (0.0%) | 0.0 |
| 20 to 34 years | 21 (55.3%) | 45.0 |
| 35 to 50 years | 17 (44.7%) | 27.0 |
| Total | 38 (100.0%) | 31.0 |
Fertility by Age by Marriage Status in Ferry County
47.4% of women with births (38) in Ferry County are married. The highest percentage of unmarried women with births falls into 35 to 50 years age bracket with 76.5% of them unmarried at the time of birth, while the lowest percentage of unmarried women with births belong to 20 to 34 years age bracket with 33.3% of them unmarried.
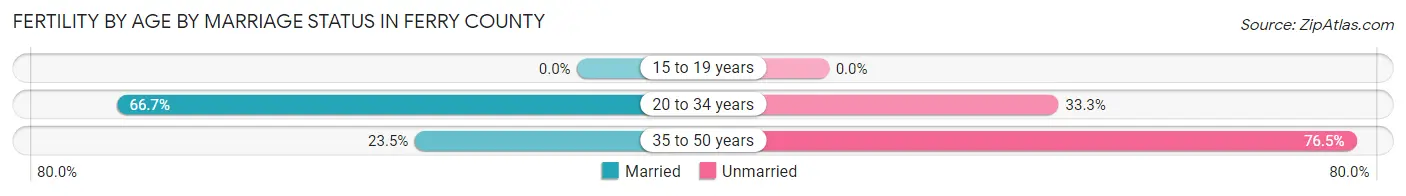
| Age Bracket | Married | Unmarried |
| 15 to 19 years | 0 (0.0%) | 0 (0.0%) |
| 20 to 34 years | 14 (66.7%) | 7 (33.3%) |
| 35 to 50 years | 4 (23.5%) | 13 (76.5%) |
| Total | 18 (47.4%) | 20 (52.6%) |
Fertility by Education in Ferry County
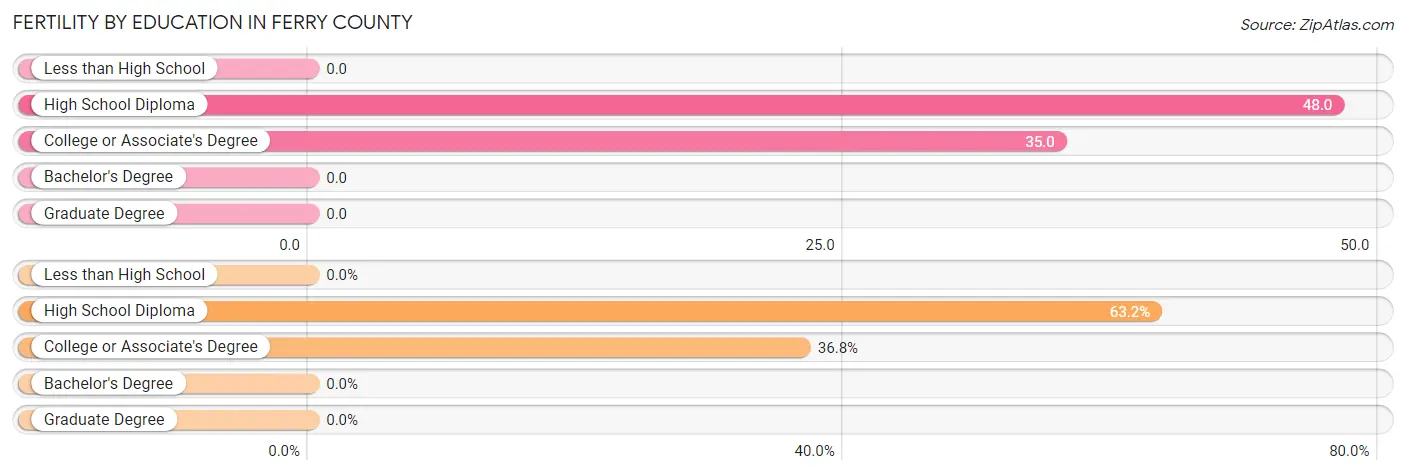
| Educational Attainment | Women with Births | Births / 1,000 Women |
| Less than High School | 0 (0.0%) | 0.0 |
| High School Diploma | 24 (63.2%) | 48.0 |
| College or Associate's Degree | 14 (36.8%) | 35.0 |
| Bachelor's Degree | 0 (0.0%) | 0.0 |
| Graduate Degree | 0 (0.0%) | 0.0 |
| Total | 38 (100.0%) | 31.0 |
Fertility by Education by Marriage Status in Ferry County
52.6% of women with births in Ferry County are unmarried. Women with the educational attainment of high school diploma are most likely to be married with 75.0% of them married at childbirth, while women with the educational attainment of college or associate's degree are least likely to be married with 100.0% of them unmarried at childbirth.
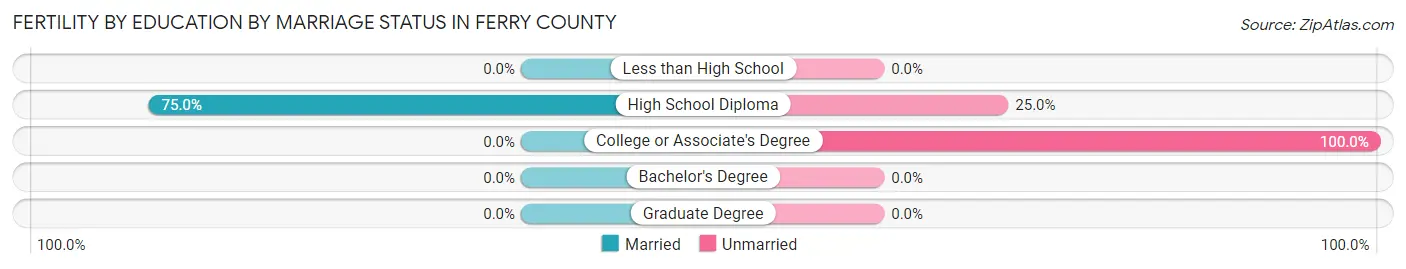
| Educational Attainment | Married | Unmarried |
| Less than High School | 0 (0.0%) | 0 (0.0%) |
| High School Diploma | 18 (75.0%) | 6 (25.0%) |
| College or Associate's Degree | 0 (0.0%) | 14 (100.0%) |
| Bachelor's Degree | 0 (0.0%) | 0 (0.0%) |
| Graduate Degree | 0 (0.0%) | 0 (0.0%) |
| Total | 18 (47.4%) | 20 (52.6%) |
Employment Characteristics in Ferry County
Employment by Class of Employer in Ferry County
Among the 2,460 employed individuals in Ferry County, private company employees (647 | 26.3%), local government employees (513 | 20.8%), and state government employees (347 | 14.1%) make up the most common classes of employment.
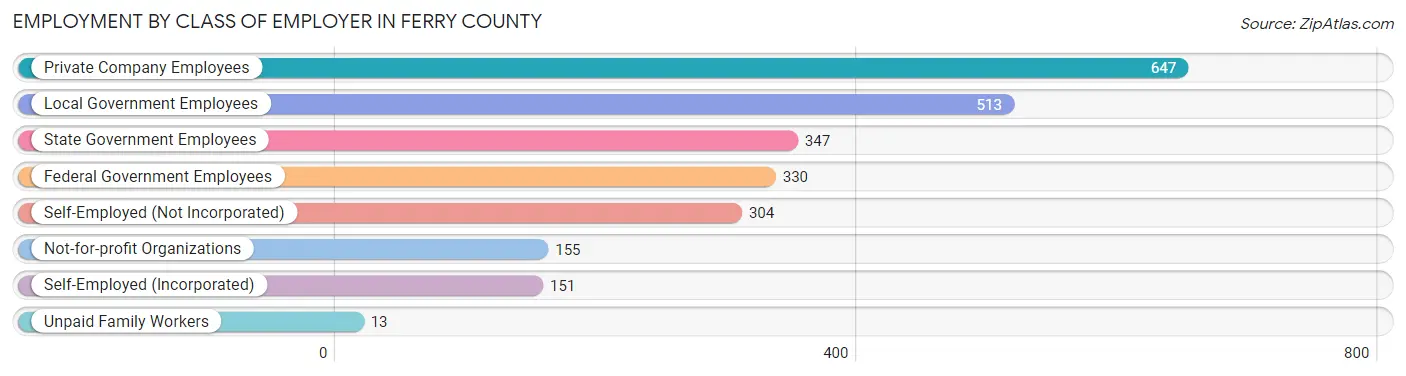
| Employer Class | # Employees | % Employees |
| Private Company Employees | 647 | 26.3% |
| Self-Employed (Incorporated) | 151 | 6.1% |
| Self-Employed (Not Incorporated) | 304 | 12.4% |
| Not-for-profit Organizations | 155 | 6.3% |
| Local Government Employees | 513 | 20.8% |
| State Government Employees | 347 | 14.1% |
| Federal Government Employees | 330 | 13.4% |
| Unpaid Family Workers | 13 | 0.5% |
| Total | 2,460 | 100.0% |
Employment Status by Age in Ferry County
According to the labor force statistics for Ferry County, out of the total population over 16 years of age (6,153), 44.3% or 2,726 individuals are in the labor force, with 7.6% or 207 of them unemployed. The age group with the highest labor force participation rate is 25 to 29 years, with 79.1% or 216 individuals in the labor force. Within the labor force, the 16 to 19 years age range has the highest percentage of unemployed individuals, with 23.6% or 25 of them being unemployed.
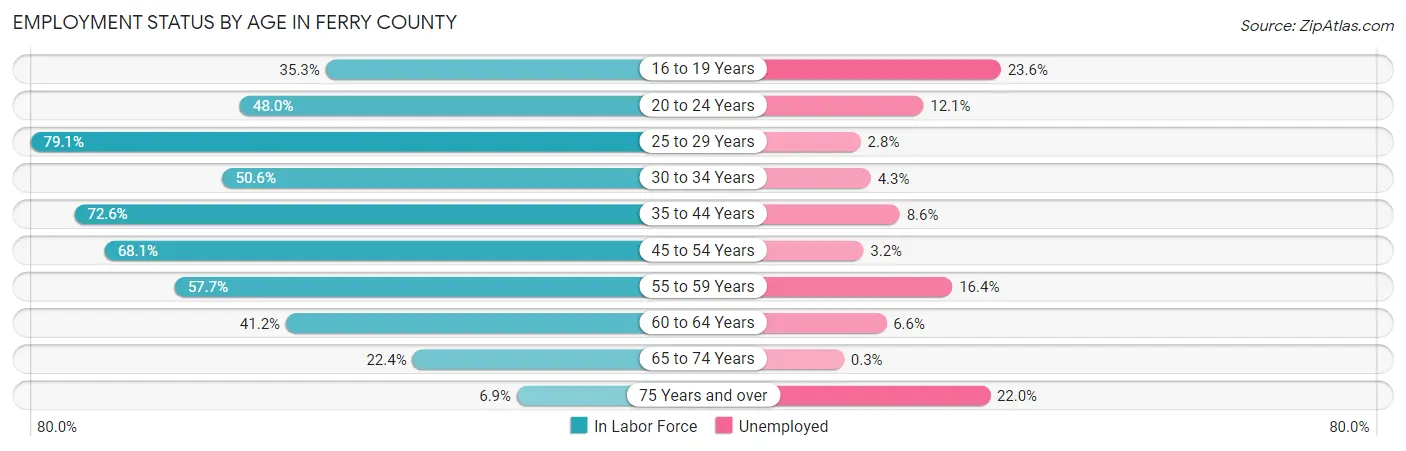
| Age Bracket | In Labor Force | Unemployed |
| 16 to 19 Years | 106 (35.3%) | 25 (23.6%) |
| 20 to 24 Years | 141 (48.0%) | 17 (12.1%) |
| 25 to 29 Years | 216 (79.1%) | 6 (2.8%) |
| 30 to 34 Years | 163 (50.6%) | 7 (4.3%) |
| 35 to 44 Years | 571 (72.6%) | 49 (8.6%) |
| 45 to 54 Years | 567 (68.1%) | 18 (3.2%) |
| 55 to 59 Years | 330 (57.7%) | 54 (16.4%) |
| 60 to 64 Years | 274 (41.2%) | 18 (6.6%) |
| 65 to 74 Years | 309 (22.4%) | 1 (0.3%) |
| 75 Years and over | 50 (6.9%) | 11 (22.0%) |
| Total | 2,726 (44.3%) | 207 (7.6%) |
Employment Status by Educational Attainment in Ferry County
According to labor force statistics for Ferry County, 61.4% of individuals (2,120) out of the total population between 25 and 64 years of age (3,452) are in the labor force, with 7.2% or 153 of them being unemployed. The group with the highest labor force participation rate are those with the educational attainment of bachelor's degree or higher, with 79.3% or 461 individuals in the labor force. Within the labor force, individuals with high school diploma education have the highest percentage of unemployment, with 14.4% or 109 of them being unemployed.
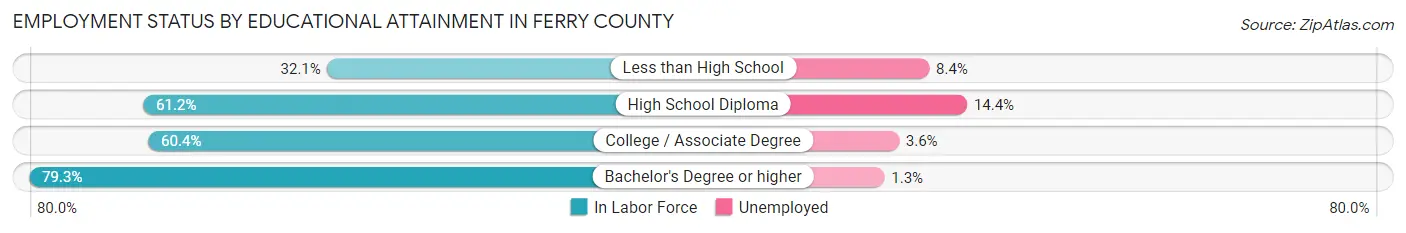
| Educational Attainment | In Labor Force | Unemployed |
| Less than High School | 95 (32.1%) | 25 (8.4%) |
| High School Diploma | 758 (61.2%) | 178 (14.4%) |
| College / Associate Degree | 807 (60.4%) | 48 (3.6%) |
| Bachelor's Degree or higher | 461 (79.3%) | 8 (1.3%) |
| Total | 2,120 (61.4%) | 249 (7.2%) |
Employment Occupations by Sex in Ferry County
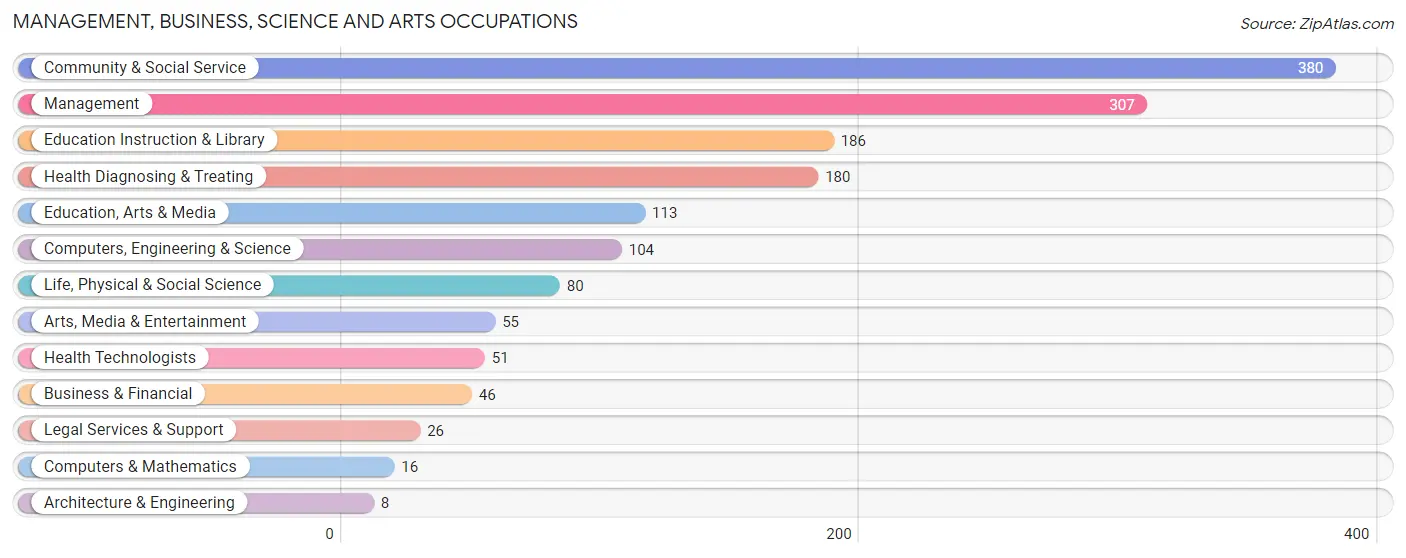
Management, Business, Science and Arts Occupations
The most common Management, Business, Science and Arts occupations in Ferry County are Community & Social Service (380 | 15.1%), Management (307 | 12.2%), Education Instruction & Library (186 | 7.4%), Health Diagnosing & Treating (180 | 7.1%), and Education, Arts & Media (113 | 4.5%).
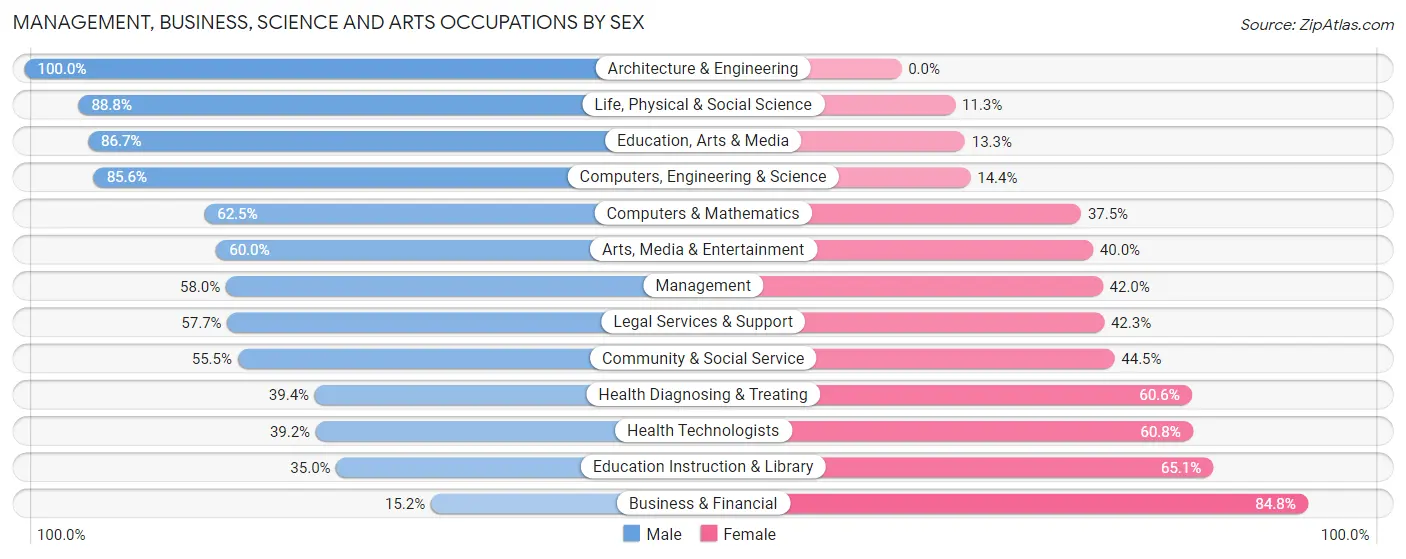
Management, Business, Science and Arts Occupations by Sex
Within the Management, Business, Science and Arts occupations in Ferry County, the most male-oriented occupations are Architecture & Engineering (100.0%), Life, Physical & Social Science (88.7%), and Education, Arts & Media (86.7%), while the most female-oriented occupations are Business & Financial (84.8%), Education Instruction & Library (65.0%), and Health Technologists (60.8%).
| Occupation | Male | Female |
| Management | 178 (58.0%) | 129 (42.0%) |
| Business & Financial | 7 (15.2%) | 39 (84.8%) |
| Computers, Engineering & Science | 89 (85.6%) | 15 (14.4%) |
| Computers & Mathematics | 10 (62.5%) | 6 (37.5%) |
| Architecture & Engineering | 8 (100.0%) | 0 (0.0%) |
| Life, Physical & Social Science | 71 (88.7%) | 9 (11.3%) |
| Community & Social Service | 211 (55.5%) | 169 (44.5%) |
| Education, Arts & Media | 98 (86.7%) | 15 (13.3%) |
| Legal Services & Support | 15 (57.7%) | 11 (42.3%) |
| Education Instruction & Library | 65 (34.9%) | 121 (65.0%) |
| Arts, Media & Entertainment | 33 (60.0%) | 22 (40.0%) |
| Health Diagnosing & Treating | 71 (39.4%) | 109 (60.6%) |
| Health Technologists | 20 (39.2%) | 31 (60.8%) |
| Total (Category) | 556 (54.7%) | 461 (45.3%) |
| Total (Overall) | 1,393 (55.3%) | 1,128 (44.7%) |
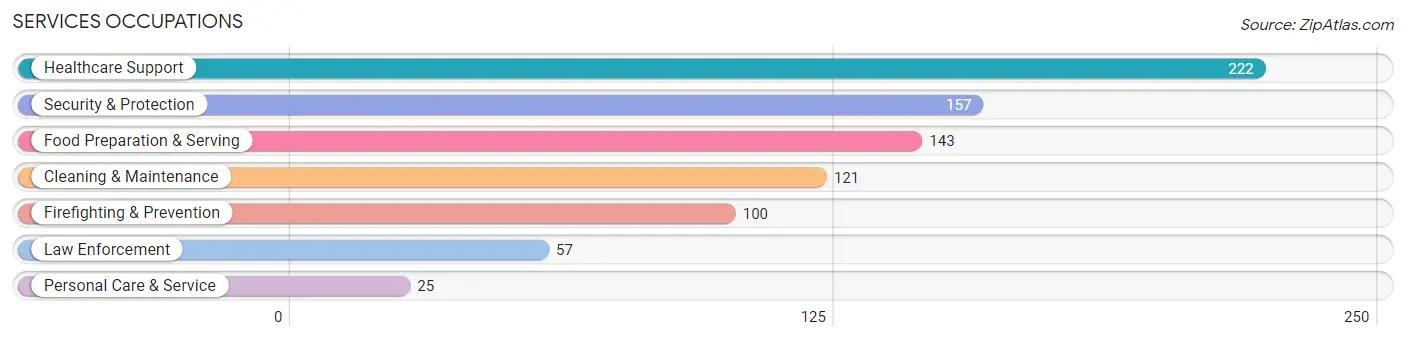
Services Occupations
The most common Services occupations in Ferry County are Healthcare Support (222 | 8.8%), Security & Protection (157 | 6.2%), Food Preparation & Serving (143 | 5.7%), Cleaning & Maintenance (121 | 4.8%), and Firefighting & Prevention (100 | 4.0%).
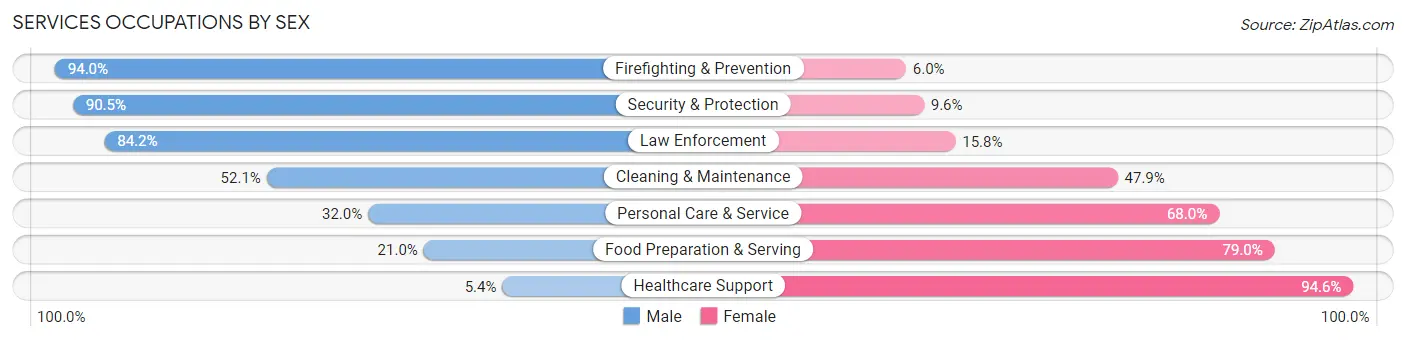
Services Occupations by Sex
Within the Services occupations in Ferry County, the most male-oriented occupations are Firefighting & Prevention (94.0%), Security & Protection (90.4%), and Law Enforcement (84.2%), while the most female-oriented occupations are Healthcare Support (94.6%), Food Preparation & Serving (79.0%), and Personal Care & Service (68.0%).
| Occupation | Male | Female |
| Healthcare Support | 12 (5.4%) | 210 (94.6%) |
| Security & Protection | 142 (90.4%) | 15 (9.6%) |
| Firefighting & Prevention | 94 (94.0%) | 6 (6.0%) |
| Law Enforcement | 48 (84.2%) | 9 (15.8%) |
| Food Preparation & Serving | 30 (21.0%) | 113 (79.0%) |
| Cleaning & Maintenance | 63 (52.1%) | 58 (47.9%) |
| Personal Care & Service | 8 (32.0%) | 17 (68.0%) |
| Total (Category) | 255 (38.2%) | 413 (61.8%) |
| Total (Overall) | 1,393 (55.3%) | 1,128 (44.7%) |
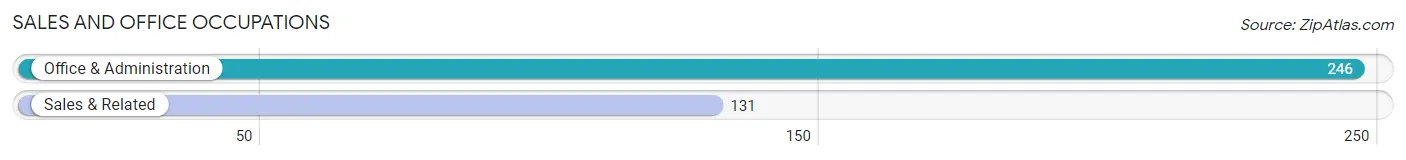
Sales and Office Occupations
The most common Sales and Office occupations in Ferry County are Office & Administration (246 | 9.8%), and Sales & Related (131 | 5.2%).
Sales and Office Occupations by Sex
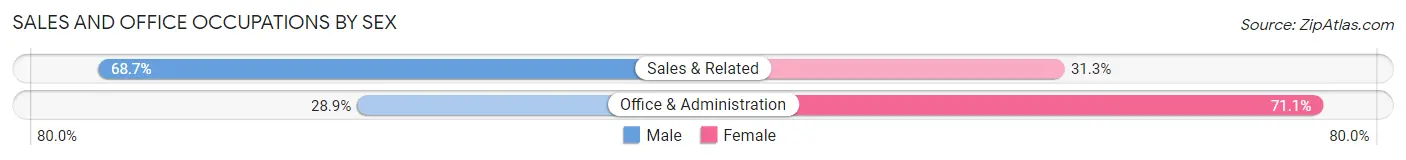
| Occupation | Male | Female |
| Sales & Related | 90 (68.7%) | 41 (31.3%) |
| Office & Administration | 71 (28.9%) | 175 (71.1%) |
| Total (Category) | 161 (42.7%) | 216 (57.3%) |
| Total (Overall) | 1,393 (55.3%) | 1,128 (44.7%) |
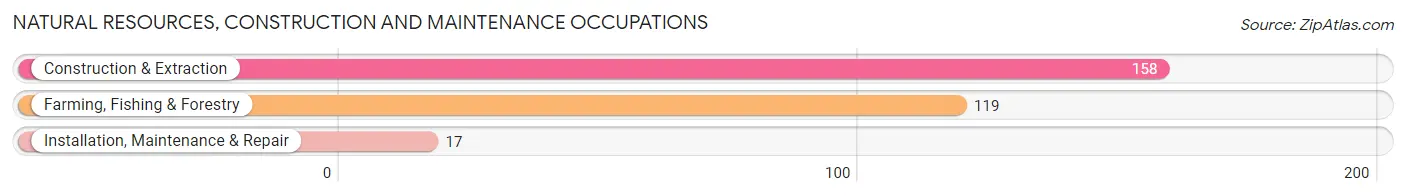
Natural Resources, Construction and Maintenance Occupations
The most common Natural Resources, Construction and Maintenance occupations in Ferry County are Construction & Extraction (158 | 6.3%), Farming, Fishing & Forestry (119 | 4.7%), and Installation, Maintenance & Repair (17 | 0.7%).
Natural Resources, Construction and Maintenance Occupations by Sex
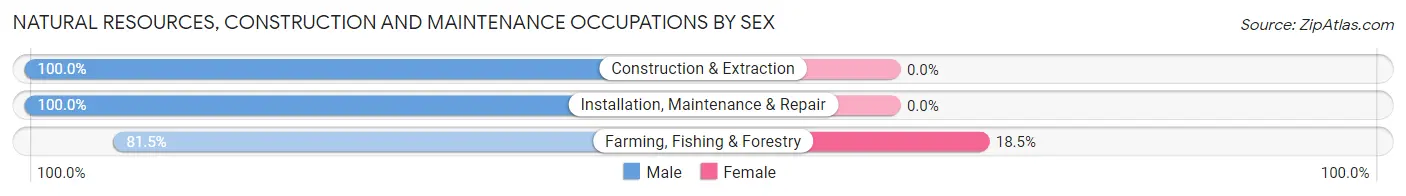
| Occupation | Male | Female |
| Farming, Fishing & Forestry | 97 (81.5%) | 22 (18.5%) |
| Construction & Extraction | 158 (100.0%) | 0 (0.0%) |
| Installation, Maintenance & Repair | 17 (100.0%) | 0 (0.0%) |
| Total (Category) | 272 (92.5%) | 22 (7.5%) |
| Total (Overall) | 1,393 (55.3%) | 1,128 (44.7%) |
Production, Transportation and Moving Occupations
The most common Production, Transportation and Moving occupations in Ferry County are Transportation (75 | 3.0%), Production (62 | 2.5%), and Material Moving (28 | 1.1%).
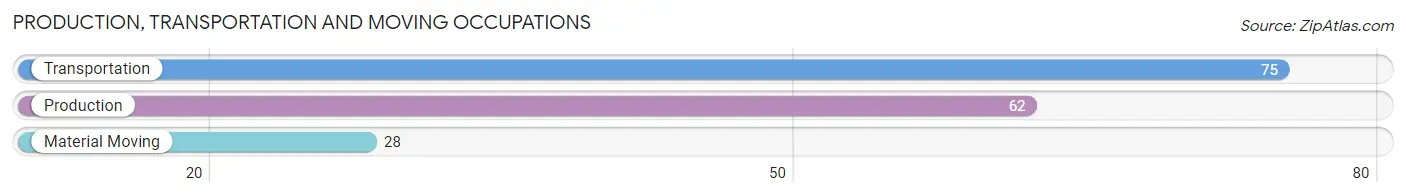
Production, Transportation and Moving Occupations by Sex
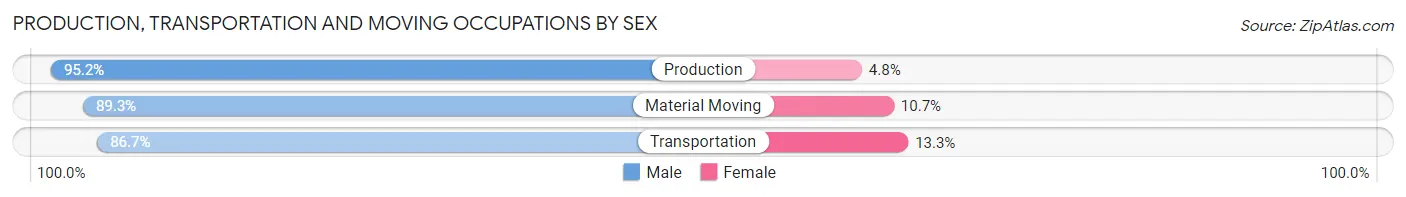
| Occupation | Male | Female |
| Production | 59 (95.2%) | 3 (4.8%) |
| Transportation | 65 (86.7%) | 10 (13.3%) |
| Material Moving | 25 (89.3%) | 3 (10.7%) |
| Total (Category) | 149 (90.3%) | 16 (9.7%) |
| Total (Overall) | 1,393 (55.3%) | 1,128 (44.7%) |
Employment Industries by Sex in Ferry County
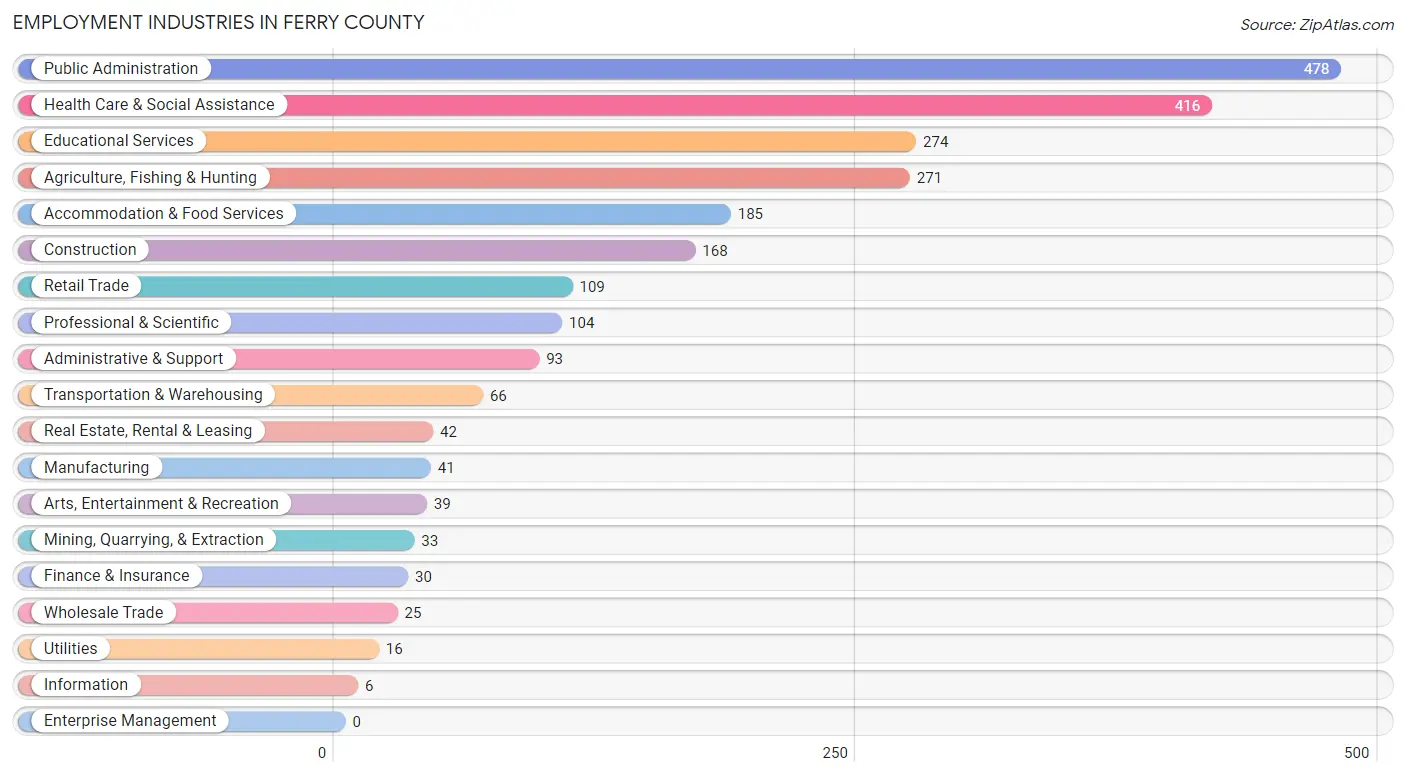
Employment Industries in Ferry County
The major employment industries in Ferry County include Public Administration (478 | 19.0%), Health Care & Social Assistance (416 | 16.5%), Educational Services (274 | 10.9%), Agriculture, Fishing & Hunting (271 | 10.7%), and Accommodation & Food Services (185 | 7.3%).
Employment Industries by Sex in Ferry County
The Ferry County industries that see more men than women are Wholesale Trade (100.0%), Construction (98.8%), and Mining, Quarrying, & Extraction (87.9%), whereas the industries that tend to have a higher number of women are Information (83.3%), Real Estate, Rental & Leasing (76.2%), and Accommodation & Food Services (69.2%).
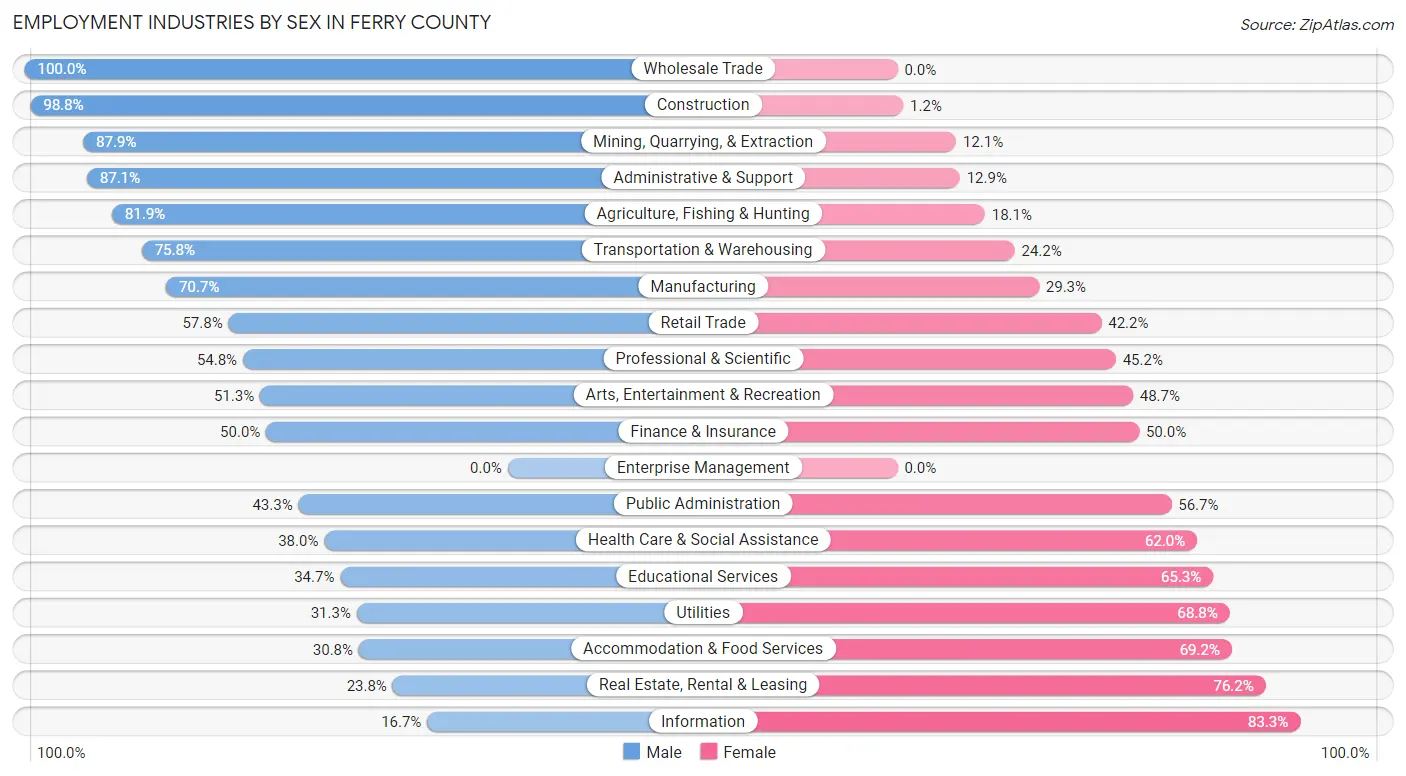
| Industry | Male | Female |
| Agriculture, Fishing & Hunting | 222 (81.9%) | 49 (18.1%) |
| Mining, Quarrying, & Extraction | 29 (87.9%) | 4 (12.1%) |
| Construction | 166 (98.8%) | 2 (1.2%) |
| Manufacturing | 29 (70.7%) | 12 (29.3%) |
| Wholesale Trade | 25 (100.0%) | 0 (0.0%) |
| Retail Trade | 63 (57.8%) | 46 (42.2%) |
| Transportation & Warehousing | 50 (75.8%) | 16 (24.2%) |
| Utilities | 5 (31.2%) | 11 (68.8%) |
| Information | 1 (16.7%) | 5 (83.3%) |
| Finance & Insurance | 15 (50.0%) | 15 (50.0%) |
| Real Estate, Rental & Leasing | 10 (23.8%) | 32 (76.2%) |
| Professional & Scientific | 57 (54.8%) | 47 (45.2%) |
| Enterprise Management | 0 (0.0%) | 0 (0.0%) |
| Administrative & Support | 81 (87.1%) | 12 (12.9%) |
| Educational Services | 95 (34.7%) | 179 (65.3%) |
| Health Care & Social Assistance | 158 (38.0%) | 258 (62.0%) |
| Arts, Entertainment & Recreation | 20 (51.3%) | 19 (48.7%) |
| Accommodation & Food Services | 57 (30.8%) | 128 (69.2%) |
| Public Administration | 207 (43.3%) | 271 (56.7%) |
| Total | 1,393 (55.3%) | 1,128 (44.7%) |
Education in Ferry County
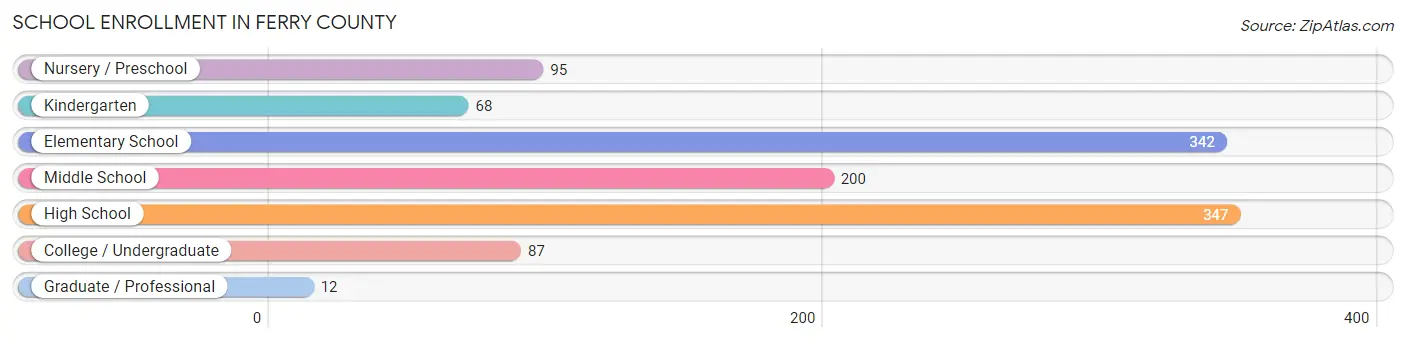
School Enrollment in Ferry County
The most common levels of schooling among the 1,151 students in Ferry County are high school (347 | 30.1%), elementary school (342 | 29.7%), and middle school (200 | 17.4%).
| School Level | # Students | % Students |
| Nursery / Preschool | 95 | 8.3% |
| Kindergarten | 68 | 5.9% |
| Elementary School | 342 | 29.7% |
| Middle School | 200 | 17.4% |
| High School | 347 | 30.1% |
| College / Undergraduate | 87 | 7.6% |
| Graduate / Professional | 12 | 1.0% |
| Total | 1,151 | 100.0% |
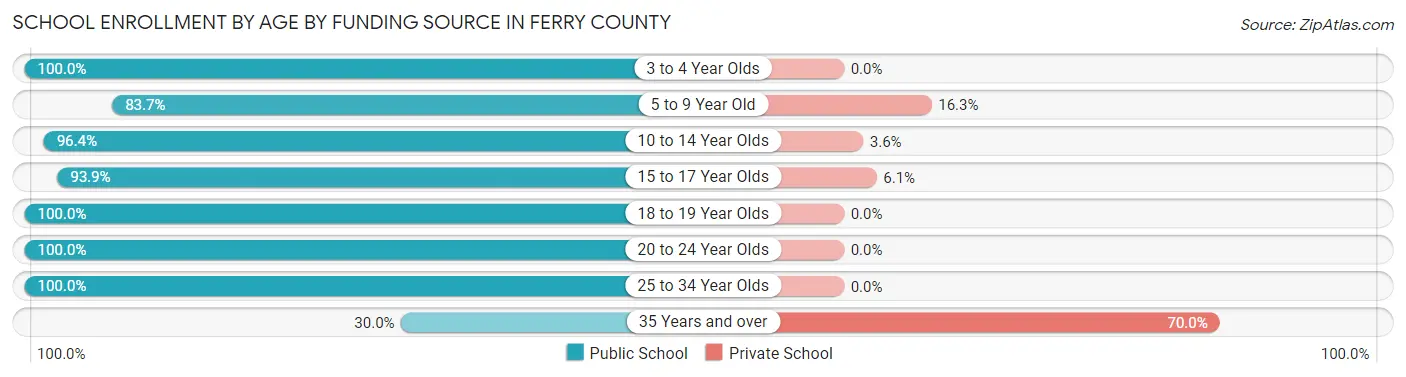
School Enrollment by Age by Funding Source in Ferry County
Out of a total of 1,151 students who are enrolled in schools in Ferry County, 99 (8.6%) attend a private institution, while the remaining 1,052 (91.4%) are enrolled in public schools. The age group of 35 years and over has the highest likelihood of being enrolled in private schools, with 14 (70.0% in the age bracket) enrolled. Conversely, the age group of 3 to 4 year olds has the lowest likelihood of being enrolled in a private school, with 72 (100.0% in the age bracket) attending a public institution.
| Age Bracket | Public School | Private School |
| 3 to 4 Year Olds | 72 (100.0%) | 0 (0.0%) |
| 5 to 9 Year Old | 318 (83.7%) | 62 (16.3%) |
| 10 to 14 Year Olds | 297 (96.4%) | 11 (3.6%) |
| 15 to 17 Year Olds | 185 (93.9%) | 12 (6.1%) |
| 18 to 19 Year Olds | 88 (100.0%) | 0 (0.0%) |
| 20 to 24 Year Olds | 77 (100.0%) | 0 (0.0%) |
| 25 to 34 Year Olds | 9 (100.0%) | 0 (0.0%) |
| 35 Years and over | 6 (30.0%) | 14 (70.0%) |
| Total | 1,052 (91.4%) | 99 (8.6%) |
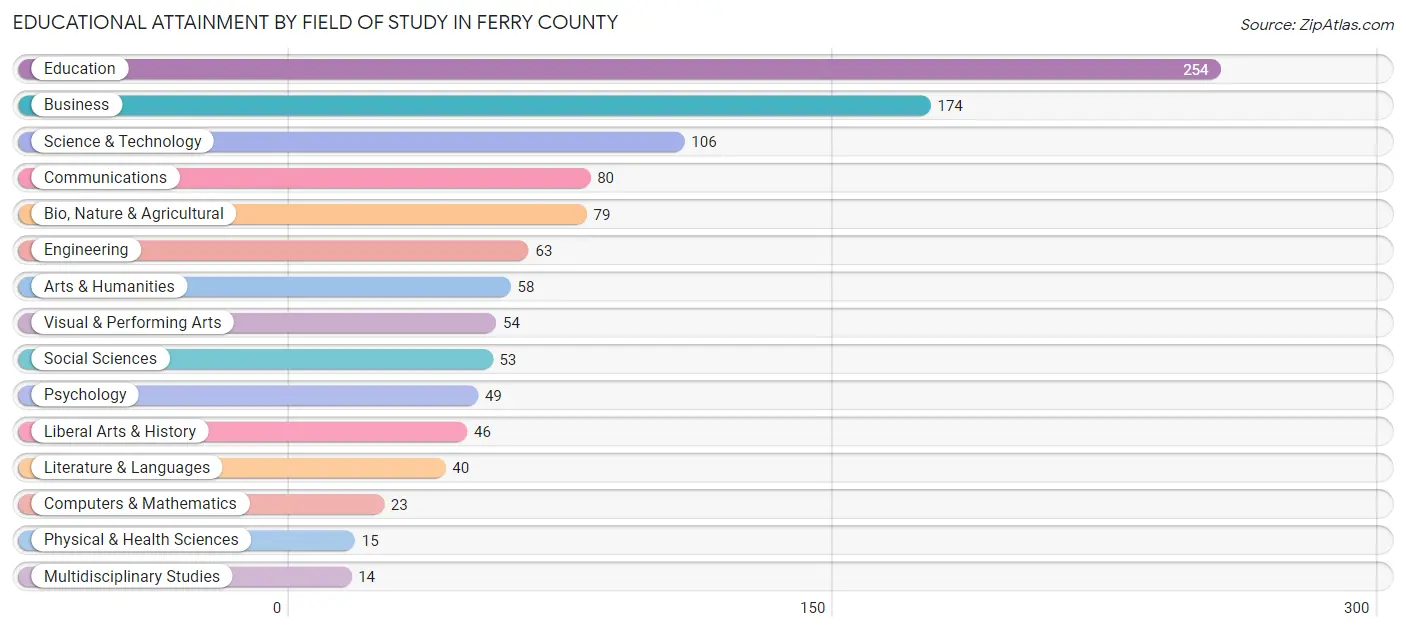
Educational Attainment by Field of Study in Ferry County
Education (254 | 22.9%), business (174 | 15.7%), science & technology (106 | 9.6%), communications (80 | 7.2%), and bio, nature & agricultural (79 | 7.1%) are the most common fields of study among 1,108 individuals in Ferry County who have obtained a bachelor's degree or higher.
| Field of Study | # Graduates | % Graduates |
| Computers & Mathematics | 23 | 2.1% |
| Bio, Nature & Agricultural | 79 | 7.1% |
| Physical & Health Sciences | 15 | 1.3% |
| Psychology | 49 | 4.4% |
| Social Sciences | 53 | 4.8% |
| Engineering | 63 | 5.7% |
| Multidisciplinary Studies | 14 | 1.3% |
| Science & Technology | 106 | 9.6% |
| Business | 174 | 15.7% |
| Education | 254 | 22.9% |
| Literature & Languages | 40 | 3.6% |
| Liberal Arts & History | 46 | 4.2% |
| Visual & Performing Arts | 54 | 4.9% |
| Communications | 80 | 7.2% |
| Arts & Humanities | 58 | 5.2% |
| Total | 1,108 | 100.0% |
Transportation & Commute in Ferry County
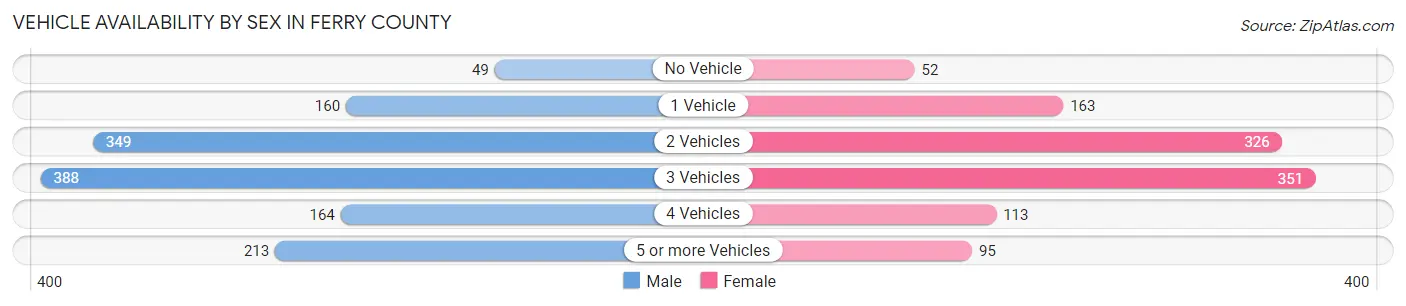
Vehicle Availability by Sex in Ferry County
The most prevalent vehicle ownership categories in Ferry County are males with 3 vehicles (388, accounting for 29.3%) and females with 3 vehicles (351, making up 35.3%).
| Vehicles Available | Male | Female |
| No Vehicle | 49 (3.7%) | 52 (4.7%) |
| 1 Vehicle | 160 (12.1%) | 163 (14.8%) |
| 2 Vehicles | 349 (26.4%) | 326 (29.6%) |
| 3 Vehicles | 388 (29.3%) | 351 (31.9%) |
| 4 Vehicles | 164 (12.4%) | 113 (10.3%) |
| 5 or more Vehicles | 213 (16.1%) | 95 (8.6%) |
| Total | 1,323 (100.0%) | 1,100 (100.0%) |
Commute Time in Ferry County
The most frequently occuring commute durations in Ferry County are 5 to 9 minutes (397 commuters, 19.2%), 15 to 19 minutes (342 commuters, 16.6%), and 25 to 29 minutes (219 commuters, 10.6%).
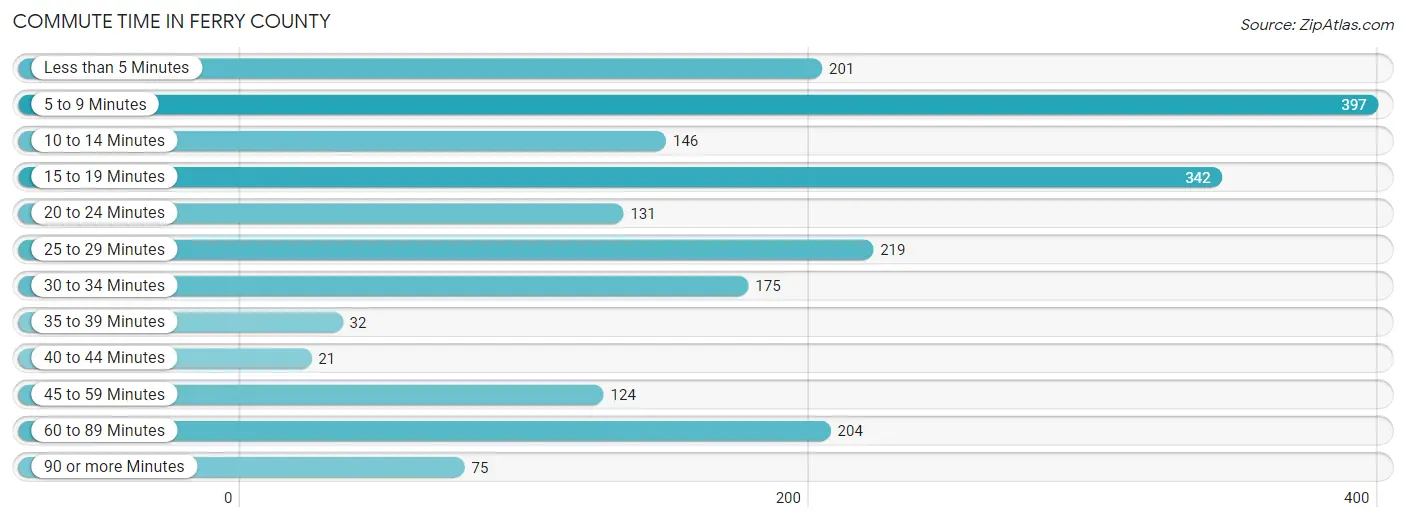
| Commute Time | # Commuters | % Commuters |
| Less than 5 Minutes | 201 | 9.7% |
| 5 to 9 Minutes | 397 | 19.2% |
| 10 to 14 Minutes | 146 | 7.1% |
| 15 to 19 Minutes | 342 | 16.6% |
| 20 to 24 Minutes | 131 | 6.3% |
| 25 to 29 Minutes | 219 | 10.6% |
| 30 to 34 Minutes | 175 | 8.5% |
| 35 to 39 Minutes | 32 | 1.5% |
| 40 to 44 Minutes | 21 | 1.0% |
| 45 to 59 Minutes | 124 | 6.0% |
| 60 to 89 Minutes | 204 | 9.9% |
| 90 or more Minutes | 75 | 3.6% |
Commute Time by Sex in Ferry County
The most common commute times in Ferry County are 15 to 19 minutes (245 commuters, 20.6%) for males and 5 to 9 minutes (268 commuters, 30.6%) for females.
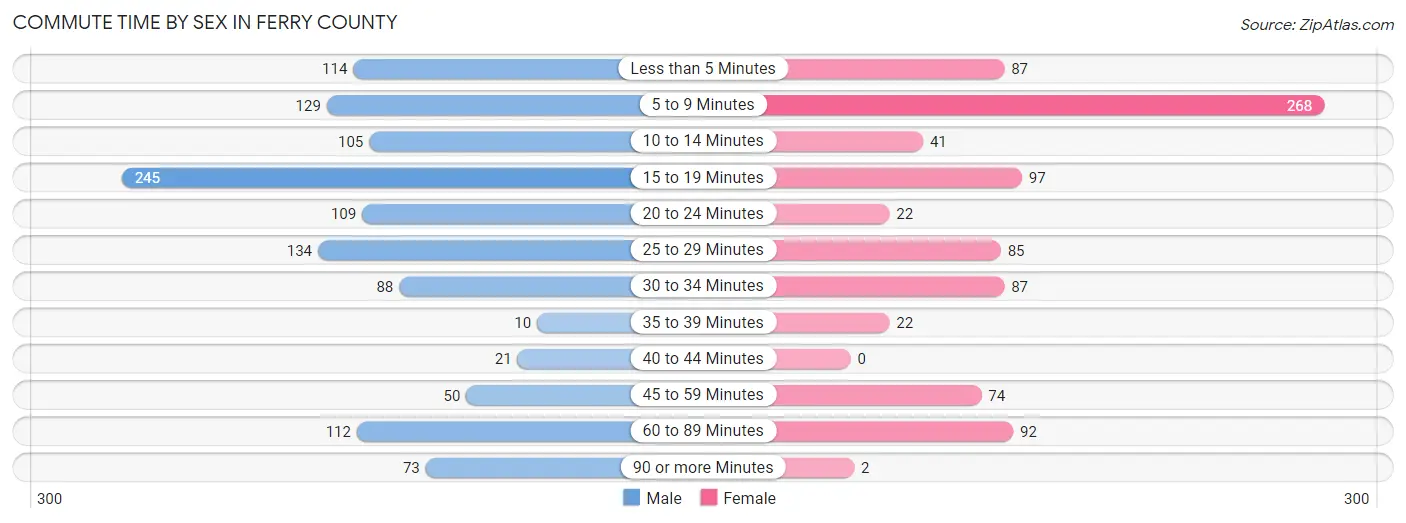
| Commute Time | Male | Female |
| Less than 5 Minutes | 114 (9.6%) | 87 (9.9%) |
| 5 to 9 Minutes | 129 (10.8%) | 268 (30.6%) |
| 10 to 14 Minutes | 105 (8.8%) | 41 (4.7%) |
| 15 to 19 Minutes | 245 (20.6%) | 97 (11.1%) |
| 20 to 24 Minutes | 109 (9.2%) | 22 (2.5%) |
| 25 to 29 Minutes | 134 (11.3%) | 85 (9.7%) |
| 30 to 34 Minutes | 88 (7.4%) | 87 (9.9%) |
| 35 to 39 Minutes | 10 (0.8%) | 22 (2.5%) |
| 40 to 44 Minutes | 21 (1.8%) | 0 (0.0%) |
| 45 to 59 Minutes | 50 (4.2%) | 74 (8.4%) |
| 60 to 89 Minutes | 112 (9.4%) | 92 (10.5%) |
| 90 or more Minutes | 73 (6.1%) | 2 (0.2%) |
Time of Departure to Work by Sex in Ferry County
The most frequent times of departure to work in Ferry County are 6:00 AM to 6:29 AM (209, 17.6%) for males and 6:30 AM to 6:59 AM (125, 14.2%) for females.
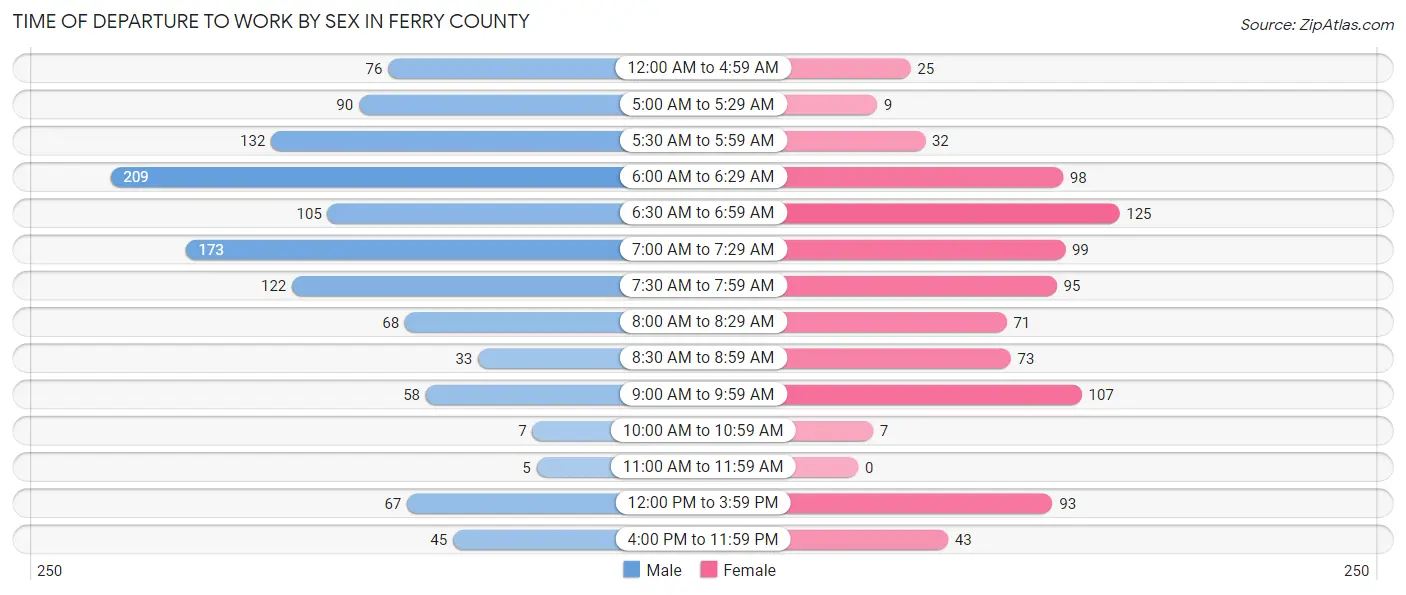
| Time of Departure | Male | Female |
| 12:00 AM to 4:59 AM | 76 (6.4%) | 25 (2.9%) |
| 5:00 AM to 5:29 AM | 90 (7.6%) | 9 (1.0%) |
| 5:30 AM to 5:59 AM | 132 (11.1%) | 32 (3.6%) |
| 6:00 AM to 6:29 AM | 209 (17.6%) | 98 (11.2%) |
| 6:30 AM to 6:59 AM | 105 (8.8%) | 125 (14.2%) |
| 7:00 AM to 7:29 AM | 173 (14.5%) | 99 (11.3%) |
| 7:30 AM to 7:59 AM | 122 (10.2%) | 95 (10.8%) |
| 8:00 AM to 8:29 AM | 68 (5.7%) | 71 (8.1%) |
| 8:30 AM to 8:59 AM | 33 (2.8%) | 73 (8.3%) |
| 9:00 AM to 9:59 AM | 58 (4.9%) | 107 (12.2%) |
| 10:00 AM to 10:59 AM | 7 (0.6%) | 7 (0.8%) |
| 11:00 AM to 11:59 AM | 5 (0.4%) | 0 (0.0%) |
| 12:00 PM to 3:59 PM | 67 (5.6%) | 93 (10.6%) |
| 4:00 PM to 11:59 PM | 45 (3.8%) | 43 (4.9%) |
| Total | 1,190 (100.0%) | 877 (100.0%) |
Housing Occupancy in Ferry County
Occupancy by Ownership in Ferry County
Of the total 3,025 dwellings in Ferry County, owner-occupied units account for 2,304 (76.2%), while renter-occupied units make up 721 (23.8%).
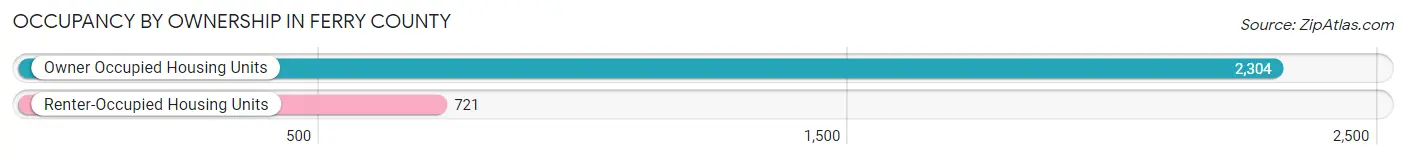
| Occupancy | # Housing Units | % Housing Units |
| Owner Occupied Housing Units | 2,304 | 76.2% |
| Renter-Occupied Housing Units | 721 | 23.8% |
| Total Occupied Housing Units | 3,025 | 100.0% |
Occupancy by Household Size in Ferry County
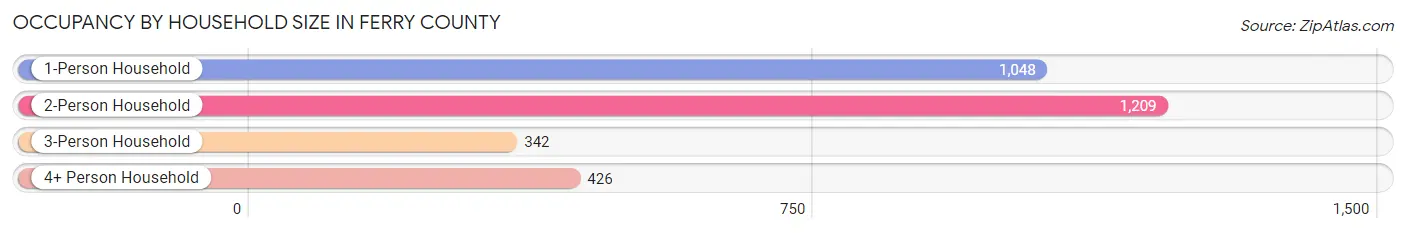
| Household Size | # Housing Units | % Housing Units |
| 1-Person Household | 1,048 | 34.6% |
| 2-Person Household | 1,209 | 40.0% |
| 3-Person Household | 342 | 11.3% |
| 4+ Person Household | 426 | 14.1% |
| Total Housing Units | 3,025 | 100.0% |
Occupancy by Ownership by Household Size in Ferry County
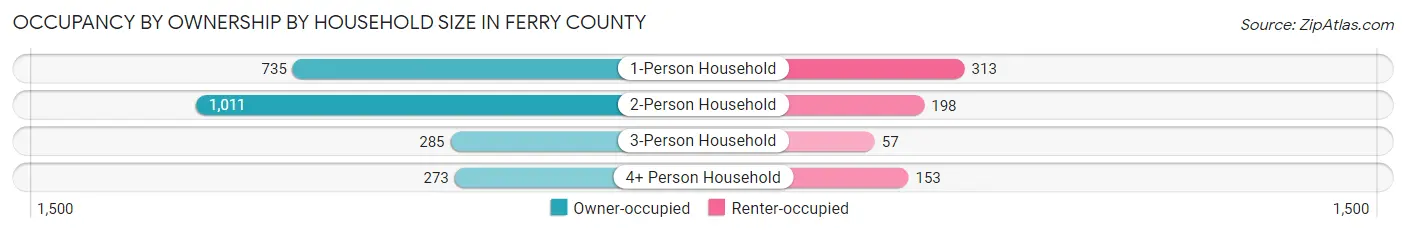
| Household Size | Owner-occupied | Renter-occupied |
| 1-Person Household | 735 (70.1%) | 313 (29.9%) |
| 2-Person Household | 1,011 (83.6%) | 198 (16.4%) |
| 3-Person Household | 285 (83.3%) | 57 (16.7%) |
| 4+ Person Household | 273 (64.1%) | 153 (35.9%) |
| Total Housing Units | 2,304 (76.2%) | 721 (23.8%) |
Occupancy by Educational Attainment in Ferry County
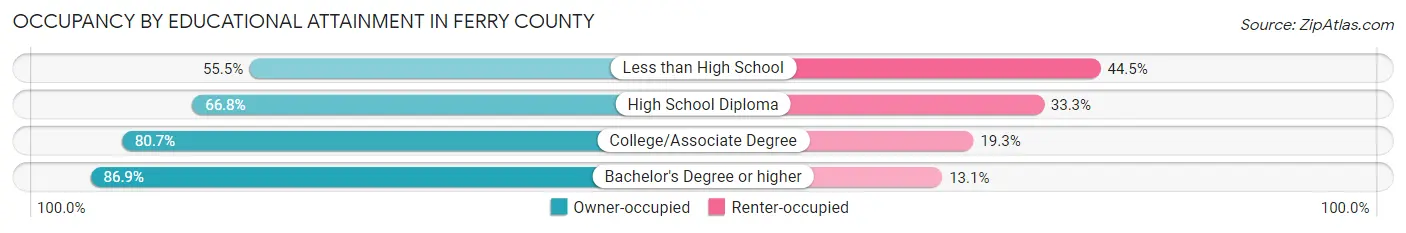
| Household Size | Owner-occupied | Renter-occupied |
| Less than High School | 146 (55.5%) | 117 (44.5%) |
| High School Diploma | 526 (66.7%) | 262 (33.3%) |
| College/Associate Degree | 1,088 (80.7%) | 260 (19.3%) |
| Bachelor's Degree or higher | 544 (86.9%) | 82 (13.1%) |
Occupancy by Age of Householder in Ferry County
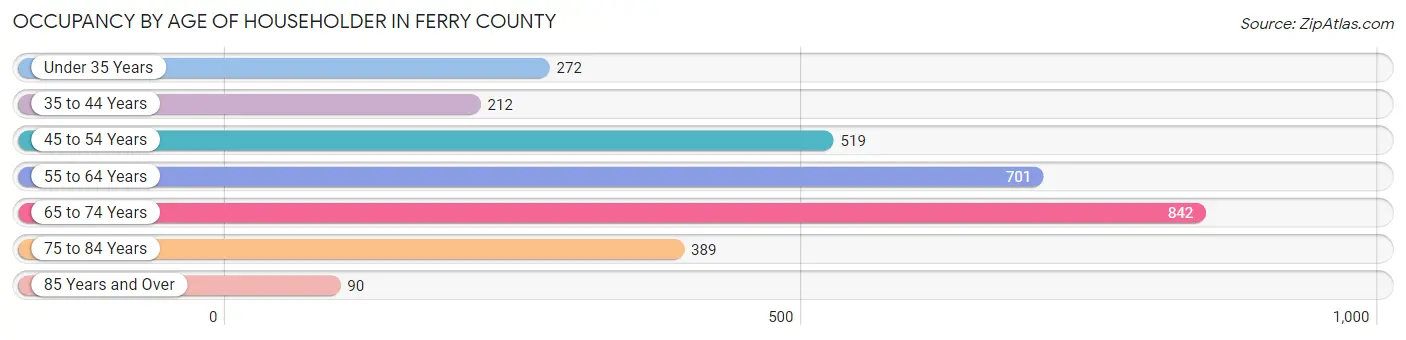
| Age Bracket | # Households | % Households |
| Under 35 Years | 272 | 9.0% |
| 35 to 44 Years | 212 | 7.0% |
| 45 to 54 Years | 519 | 17.2% |
| 55 to 64 Years | 701 | 23.2% |
| 65 to 74 Years | 842 | 27.8% |
| 75 to 84 Years | 389 | 12.9% |
| 85 Years and Over | 90 | 3.0% |
| Total | 3,025 | 100.0% |
Housing Finances in Ferry County
Median Income by Occupancy in Ferry County
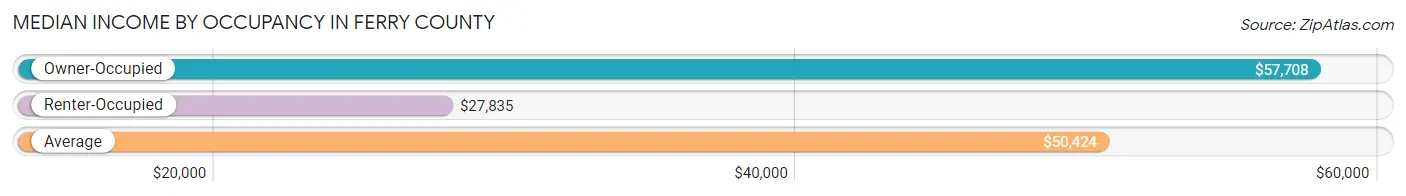
| Occupancy Type | # Households | Median Income |
| Owner-Occupied | 2,304 (76.2%) | $57,708 |
| Renter-Occupied | 721 (23.8%) | $27,835 |
| Average | 3,025 (100.0%) | $50,424 |
Occupancy by Householder Income Bracket in Ferry County
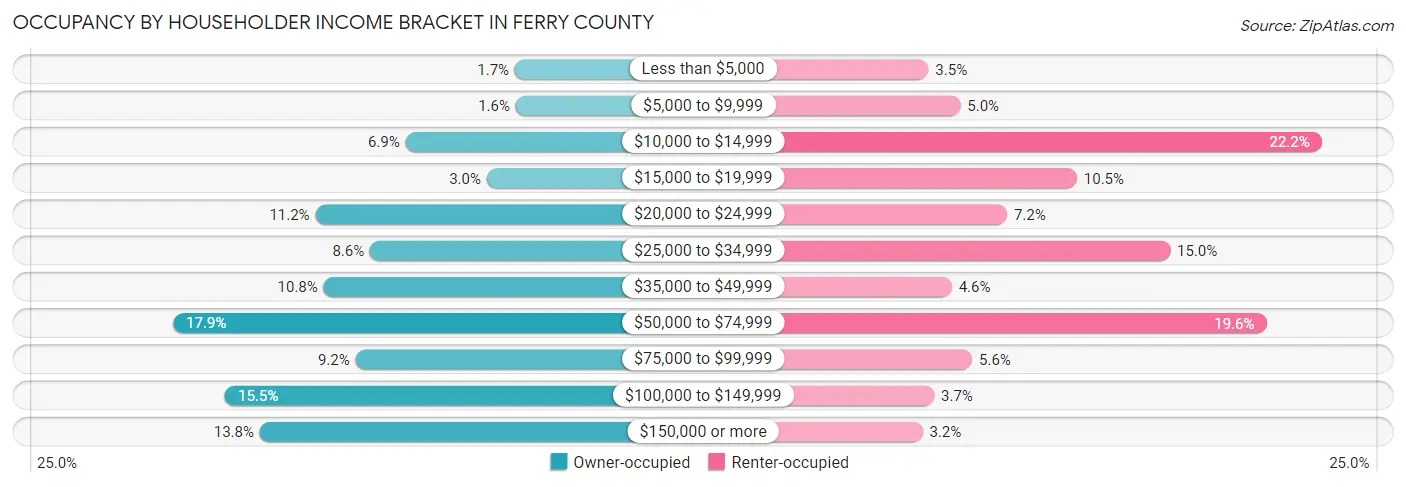
| Income Bracket | Owner-occupied | Renter-occupied |
| Less than $5,000 | 38 (1.7%) | 25 (3.5%) |
| $5,000 to $9,999 | 37 (1.6%) | 36 (5.0%) |
| $10,000 to $14,999 | 158 (6.9%) | 160 (22.2%) |
| $15,000 to $19,999 | 69 (3.0%) | 76 (10.5%) |
| $20,000 to $24,999 | 257 (11.2%) | 52 (7.2%) |
| $25,000 to $34,999 | 197 (8.6%) | 108 (15.0%) |
| $35,000 to $49,999 | 248 (10.8%) | 33 (4.6%) |
| $50,000 to $74,999 | 413 (17.9%) | 141 (19.6%) |
| $75,000 to $99,999 | 213 (9.2%) | 40 (5.6%) |
| $100,000 to $149,999 | 356 (15.4%) | 27 (3.7%) |
| $150,000 or more | 318 (13.8%) | 23 (3.2%) |
| Total | 2,304 (100.0%) | 721 (100.0%) |
Monthly Housing Cost Tiers in Ferry County
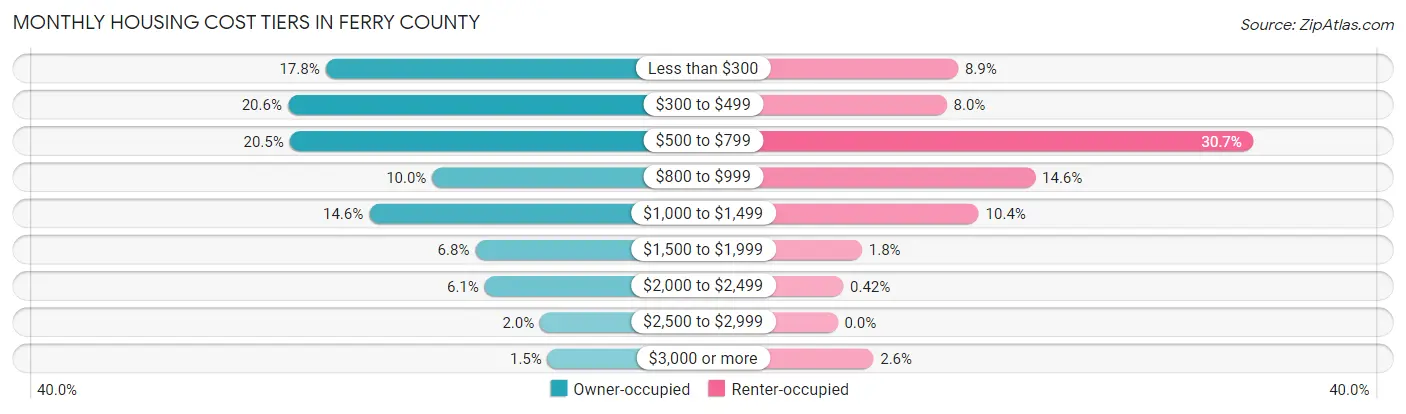
| Monthly Cost | Owner-occupied | Renter-occupied |
| Less than $300 | 411 (17.8%) | 64 (8.9%) |
| $300 to $499 | 475 (20.6%) | 58 (8.0%) |
| $500 to $799 | 472 (20.5%) | 221 (30.6%) |
| $800 to $999 | 230 (10.0%) | 105 (14.6%) |
| $1,000 to $1,499 | 337 (14.6%) | 75 (10.4%) |
| $1,500 to $1,999 | 157 (6.8%) | 13 (1.8%) |
| $2,000 to $2,499 | 141 (6.1%) | 3 (0.4%) |
| $2,500 to $2,999 | 47 (2.0%) | 0 (0.0%) |
| $3,000 or more | 34 (1.5%) | 19 (2.6%) |
| Total | 2,304 (100.0%) | 721 (100.0%) |
Physical Housing Characteristics in Ferry County
Housing Structures in Ferry County
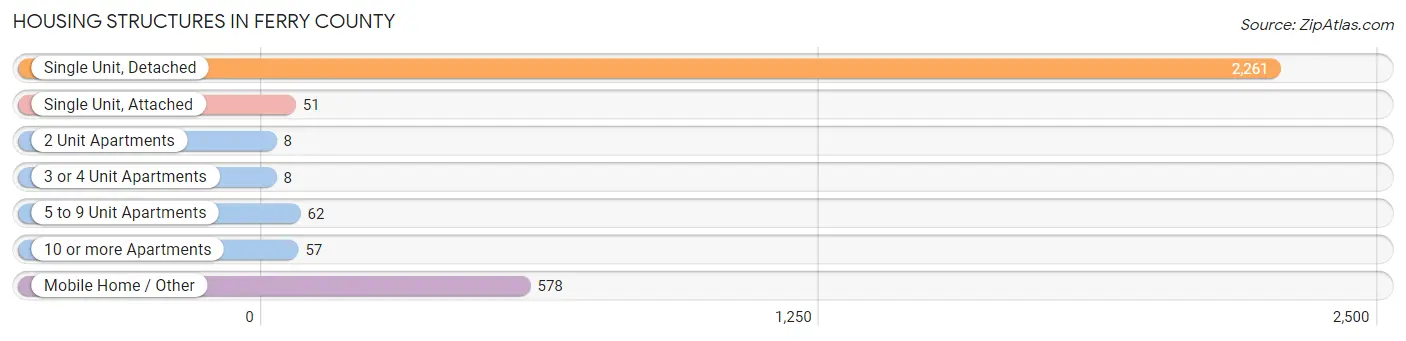
| Structure Type | # Housing Units | % Housing Units |
| Single Unit, Detached | 2,261 | 74.7% |
| Single Unit, Attached | 51 | 1.7% |
| 2 Unit Apartments | 8 | 0.3% |
| 3 or 4 Unit Apartments | 8 | 0.3% |
| 5 to 9 Unit Apartments | 62 | 2.1% |
| 10 or more Apartments | 57 | 1.9% |
| Mobile Home / Other | 578 | 19.1% |
| Total | 3,025 | 100.0% |
Housing Structures by Occupancy in Ferry County
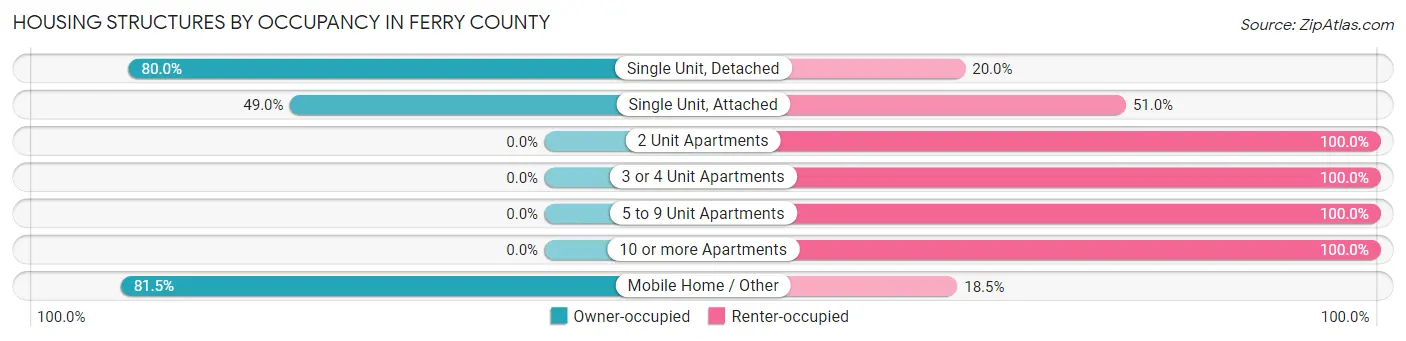
| Structure Type | Owner-occupied | Renter-occupied |
| Single Unit, Detached | 1,808 (80.0%) | 453 (20.0%) |
| Single Unit, Attached | 25 (49.0%) | 26 (51.0%) |
| 2 Unit Apartments | 0 (0.0%) | 8 (100.0%) |
| 3 or 4 Unit Apartments | 0 (0.0%) | 8 (100.0%) |
| 5 to 9 Unit Apartments | 0 (0.0%) | 62 (100.0%) |
| 10 or more Apartments | 0 (0.0%) | 57 (100.0%) |
| Mobile Home / Other | 471 (81.5%) | 107 (18.5%) |
| Total | 2,304 (76.2%) | 721 (23.8%) |
Housing Structures by Number of Rooms in Ferry County
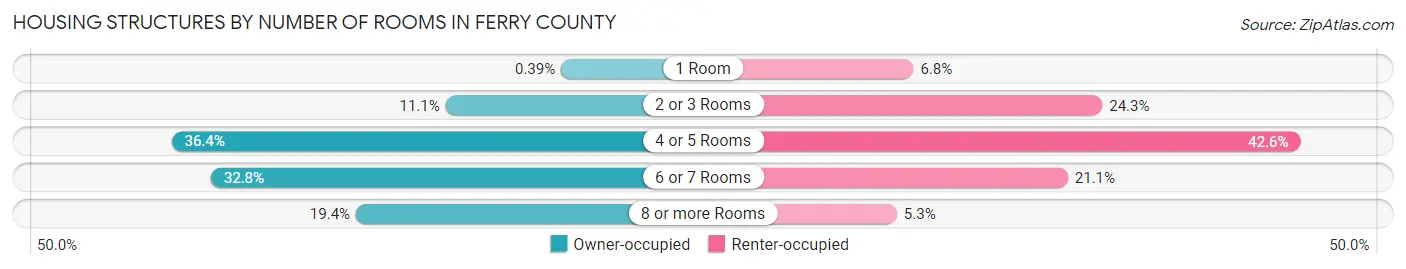
| Number of Rooms | Owner-occupied | Renter-occupied |
| 1 Room | 9 (0.4%) | 49 (6.8%) |
| 2 or 3 Rooms | 255 (11.1%) | 175 (24.3%) |
| 4 or 5 Rooms | 839 (36.4%) | 307 (42.6%) |
| 6 or 7 Rooms | 755 (32.8%) | 152 (21.1%) |
| 8 or more Rooms | 446 (19.4%) | 38 (5.3%) |
| Total | 2,304 (100.0%) | 721 (100.0%) |
Housing Structure by Heating Type in Ferry County
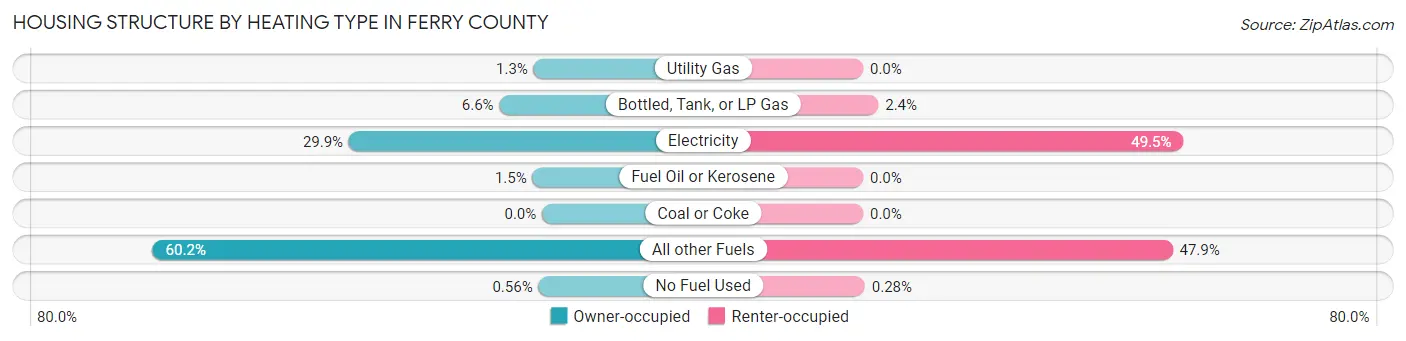
| Heating Type | Owner-occupied | Renter-occupied |
| Utility Gas | 30 (1.3%) | 0 (0.0%) |
| Bottled, Tank, or LP Gas | 152 (6.6%) | 17 (2.4%) |
| Electricity | 688 (29.9%) | 357 (49.5%) |
| Fuel Oil or Kerosene | 34 (1.5%) | 0 (0.0%) |
| Coal or Coke | 0 (0.0%) | 0 (0.0%) |
| All other Fuels | 1,387 (60.2%) | 345 (47.8%) |
| No Fuel Used | 13 (0.6%) | 2 (0.3%) |
| Total | 2,304 (100.0%) | 721 (100.0%) |
Household Vehicle Usage in Ferry County
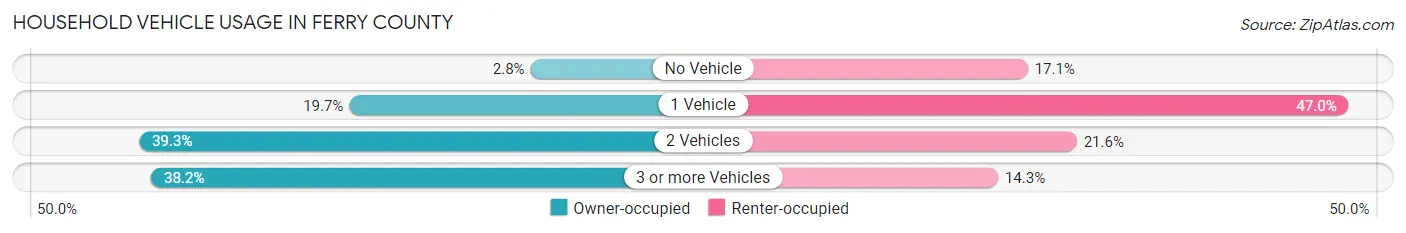
| Vehicles per Household | Owner-occupied | Renter-occupied |
| No Vehicle | 64 (2.8%) | 123 (17.1%) |
| 1 Vehicle | 454 (19.7%) | 339 (47.0%) |
| 2 Vehicles | 906 (39.3%) | 156 (21.6%) |
| 3 or more Vehicles | 880 (38.2%) | 103 (14.3%) |
| Total | 2,304 (100.0%) | 721 (100.0%) |
Real Estate & Mortgages in Ferry County
Real Estate and Mortgage Overview in Ferry County
| Characteristic | Without Mortgage | With Mortgage |
| Housing Units | 1,321 | 983 |
| Median Property Value | $256,100 | $247,200 |
| Median Household Income | $50,186 | $166 |
| Monthly Housing Costs | $446 | $34 |
| Real Estate Taxes | $1,641 | $90 |
Property Value by Mortgage Status in Ferry County
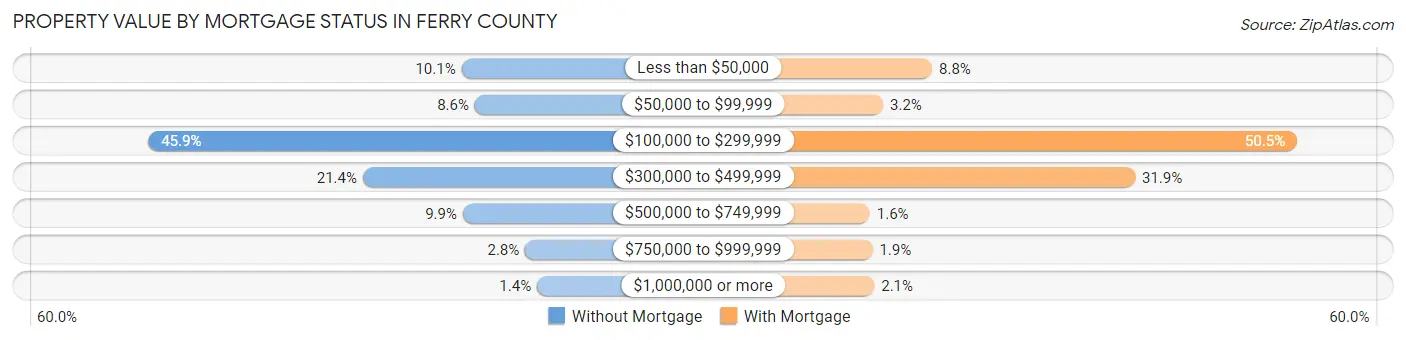
| Property Value | Without Mortgage | With Mortgage |
| Less than $50,000 | 133 (10.1%) | 86 (8.7%) |
| $50,000 to $99,999 | 113 (8.6%) | 31 (3.2%) |
| $100,000 to $299,999 | 606 (45.9%) | 496 (50.5%) |
| $300,000 to $499,999 | 282 (21.3%) | 314 (31.9%) |
| $500,000 to $749,999 | 131 (9.9%) | 16 (1.6%) |
| $750,000 to $999,999 | 37 (2.8%) | 19 (1.9%) |
| $1,000,000 or more | 19 (1.4%) | 21 (2.1%) |
| Total | 1,321 (100.0%) | 983 (100.0%) |
Household Income by Mortgage Status in Ferry County
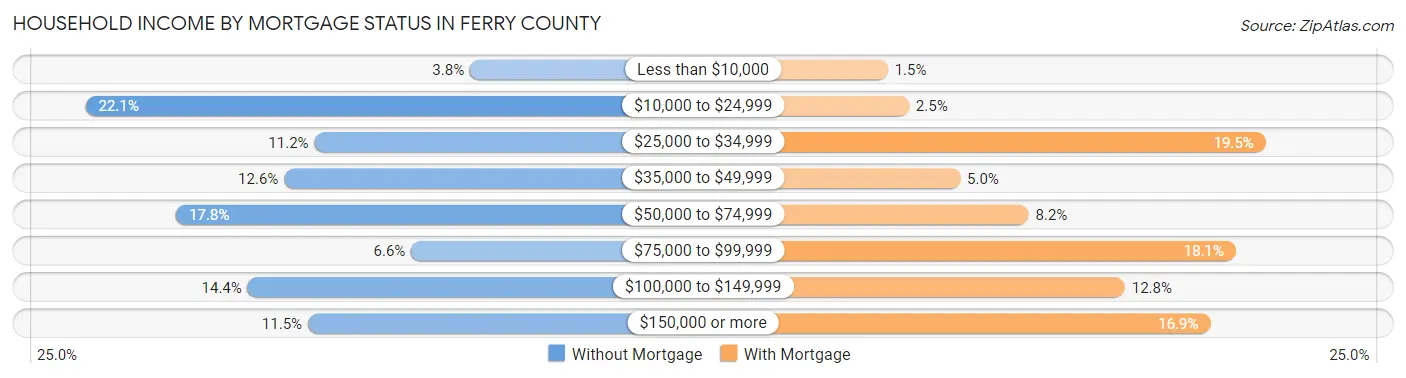
| Household Income | Without Mortgage | With Mortgage |
| Less than $10,000 | 50 (3.8%) | 15 (1.5%) |
| $10,000 to $24,999 | 292 (22.1%) | 25 (2.5%) |
| $25,000 to $34,999 | 148 (11.2%) | 192 (19.5%) |
| $35,000 to $49,999 | 167 (12.6%) | 49 (5.0%) |
| $50,000 to $74,999 | 235 (17.8%) | 81 (8.2%) |
| $75,000 to $99,999 | 87 (6.6%) | 178 (18.1%) |
| $100,000 to $149,999 | 190 (14.4%) | 126 (12.8%) |
| $150,000 or more | 152 (11.5%) | 166 (16.9%) |
| Total | 1,321 (100.0%) | 983 (100.0%) |
Property Value to Household Income Ratio in Ferry County
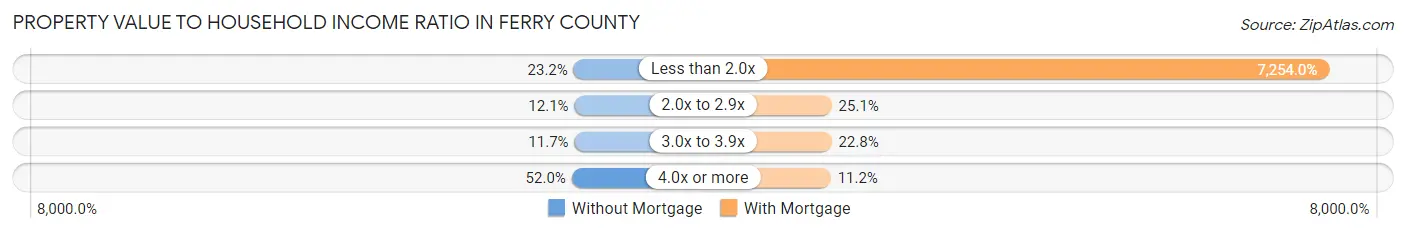
| Value-to-Income Ratio | Without Mortgage | With Mortgage |
| Less than 2.0x | 306 (23.2%) | 71,307 (7,254.0%) |
| 2.0x to 2.9x | 160 (12.1%) | 247 (25.1%) |
| 3.0x to 3.9x | 154 (11.7%) | 224 (22.8%) |
| 4.0x or more | 687 (52.0%) | 110 (11.2%) |
| Total | 1,321 (100.0%) | 983 (100.0%) |
Real Estate Taxes by Mortgage Status in Ferry County
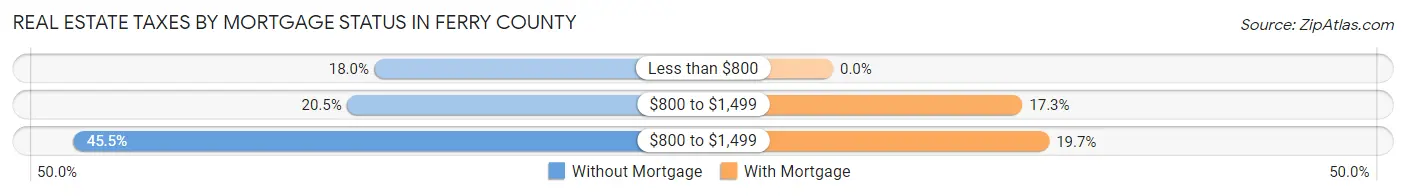
| Property Taxes | Without Mortgage | With Mortgage |
| Less than $800 | 238 (18.0%) | 0 (0.0%) |
| $800 to $1,499 | 271 (20.5%) | 170 (17.3%) |
| $800 to $1,499 | 601 (45.5%) | 194 (19.7%) |
| Total | 1,321 (100.0%) | 983 (100.0%) |
Health & Disability in Ferry County
Health Insurance Coverage by Age in Ferry County
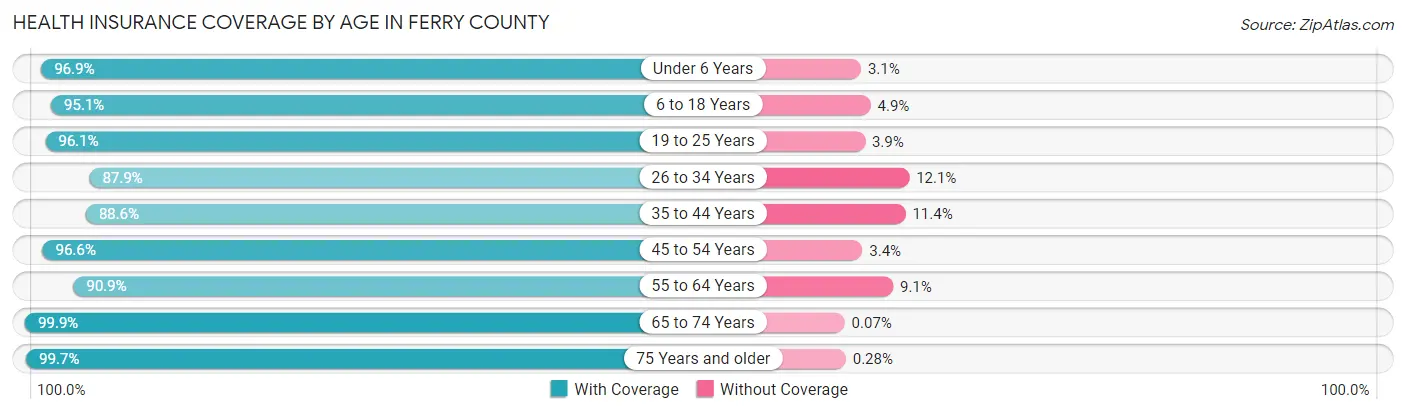
| Age Bracket | With Coverage | Without Coverage |
| Under 6 Years | 374 (96.9%) | 12 (3.1%) |
| 6 to 18 Years | 929 (95.1%) | 48 (4.9%) |
| 19 to 25 Years | 374 (96.1%) | 15 (3.9%) |
| 26 to 34 Years | 443 (87.9%) | 61 (12.1%) |
| 35 to 44 Years | 691 (88.6%) | 89 (11.4%) |
| 45 to 54 Years | 805 (96.6%) | 28 (3.4%) |
| 55 to 64 Years | 1,120 (90.9%) | 112 (9.1%) |
| 65 to 74 Years | 1,371 (99.9%) | 1 (0.1%) |
| 75 Years and older | 720 (99.7%) | 2 (0.3%) |
| Total | 6,827 (94.9%) | 368 (5.1%) |
Health Insurance Coverage by Citizenship Status in Ferry County
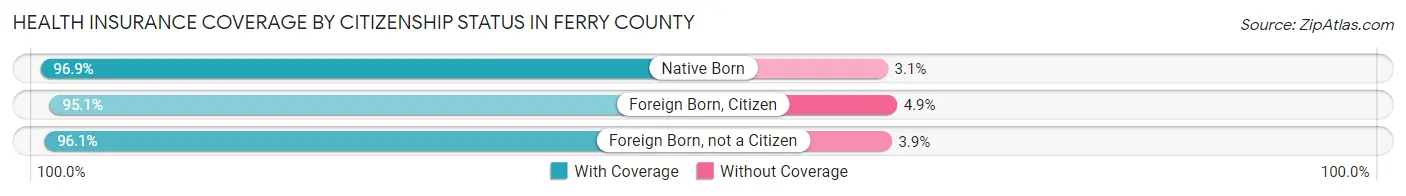
| Citizenship Status | With Coverage | Without Coverage |
| Native Born | 374 (96.9%) | 12 (3.1%) |
| Foreign Born, Citizen | 929 (95.1%) | 48 (4.9%) |
| Foreign Born, not a Citizen | 374 (96.1%) | 15 (3.9%) |
Health Insurance Coverage by Household Income in Ferry County
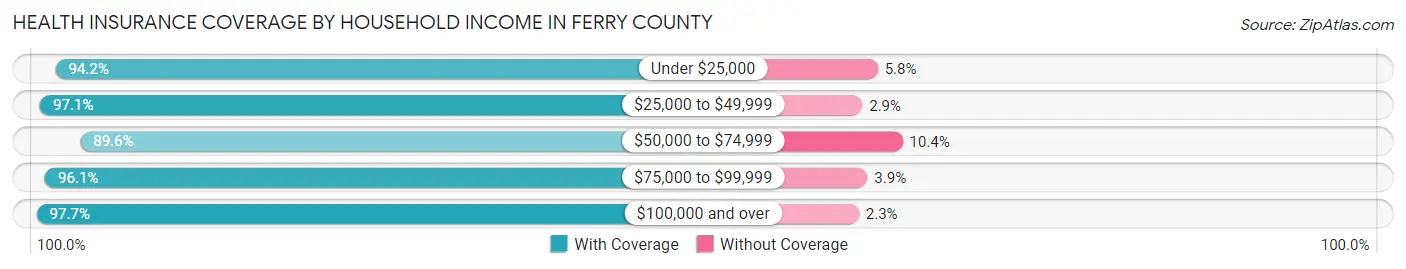
| Household Income | With Coverage | Without Coverage |
| Under $25,000 | 1,285 (94.2%) | 79 (5.8%) |
| $25,000 to $49,999 | 1,273 (97.1%) | 38 (2.9%) |
| $50,000 to $74,999 | 1,270 (89.6%) | 148 (10.4%) |
| $75,000 to $99,999 | 622 (96.1%) | 25 (3.9%) |
| $100,000 and over | 2,245 (97.7%) | 52 (2.3%) |
Public vs Private Health Insurance Coverage by Age in Ferry County
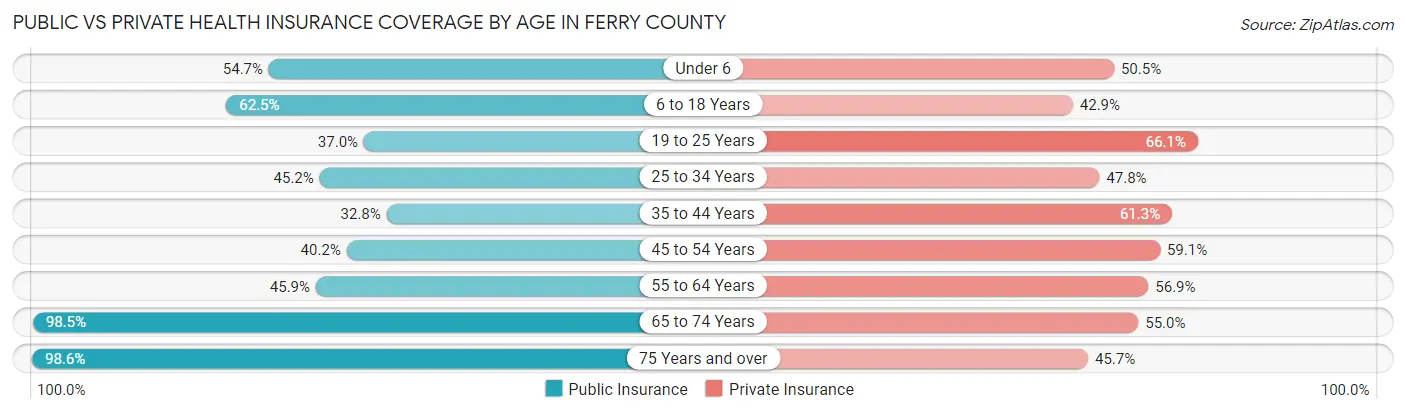
| Age Bracket | Public Insurance | Private Insurance |
| Under 6 | 211 (54.7%) | 195 (50.5%) |
| 6 to 18 Years | 611 (62.5%) | 419 (42.9%) |
| 19 to 25 Years | 144 (37.0%) | 257 (66.1%) |
| 25 to 34 Years | 228 (45.2%) | 241 (47.8%) |
| 35 to 44 Years | 256 (32.8%) | 478 (61.3%) |
| 45 to 54 Years | 335 (40.2%) | 492 (59.1%) |
| 55 to 64 Years | 566 (45.9%) | 701 (56.9%) |
| 65 to 74 Years | 1,351 (98.5%) | 755 (55.0%) |
| 75 Years and over | 712 (98.6%) | 330 (45.7%) |
| Total | 4,414 (61.4%) | 3,868 (53.8%) |
Disability Status by Sex by Age in Ferry County
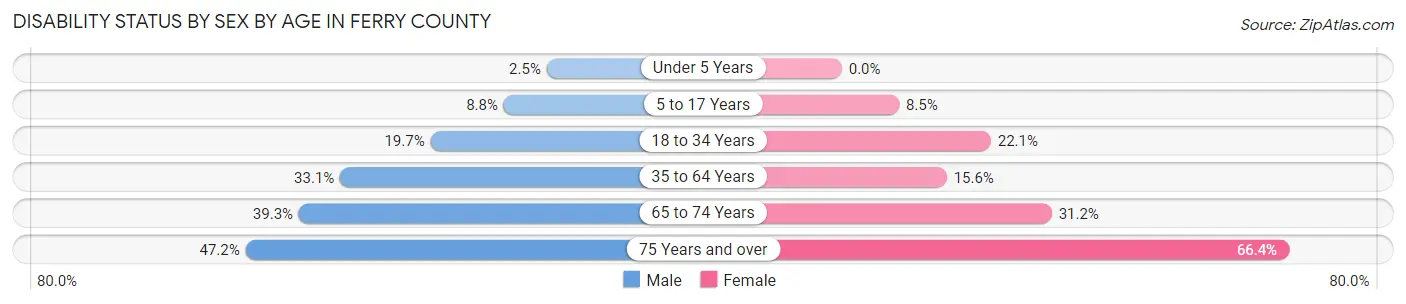
| Age Bracket | Male | Female |
| Under 5 Years | 4 (2.5%) | 0 (0.0%) |
| 5 to 17 Years | 41 (8.8%) | 38 (8.5%) |
| 18 to 34 Years | 102 (19.7%) | 110 (22.1%) |
| 35 to 64 Years | 460 (33.1%) | 227 (15.6%) |
| 65 to 74 Years | 278 (39.3%) | 207 (31.2%) |
| 75 Years and over | 168 (47.2%) | 243 (66.4%) |
Disability Class by Sex by Age in Ferry County
Disability Class: Hearing Difficulty
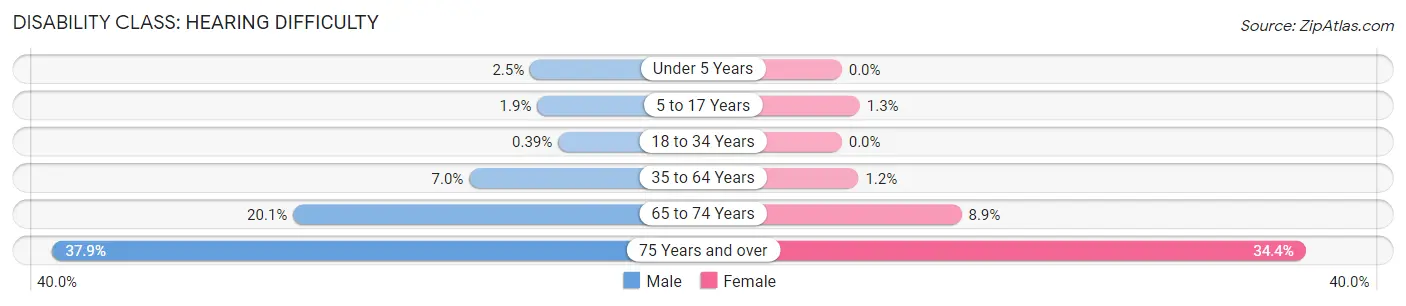
| Age Bracket | Male | Female |
| Under 5 Years | 4 (2.5%) | 0 (0.0%) |
| 5 to 17 Years | 9 (1.9%) | 6 (1.3%) |
| 18 to 34 Years | 2 (0.4%) | 0 (0.0%) |
| 35 to 64 Years | 97 (7.0%) | 18 (1.2%) |
| 65 to 74 Years | 142 (20.1%) | 59 (8.9%) |
| 75 Years and over | 135 (37.9%) | 126 (34.4%) |
Disability Class: Vision Difficulty
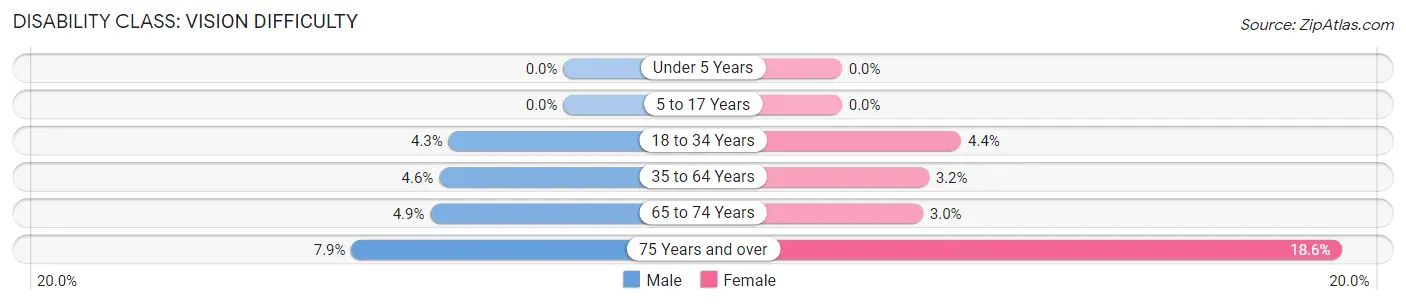
| Age Bracket | Male | Female |
| Under 5 Years | 0 (0.0%) | 0 (0.0%) |
| 5 to 17 Years | 0 (0.0%) | 0 (0.0%) |
| 18 to 34 Years | 22 (4.3%) | 22 (4.4%) |
| 35 to 64 Years | 64 (4.6%) | 47 (3.2%) |
| 65 to 74 Years | 35 (4.9%) | 20 (3.0%) |
| 75 Years and over | 28 (7.9%) | 68 (18.6%) |
Disability Class: Cognitive Difficulty
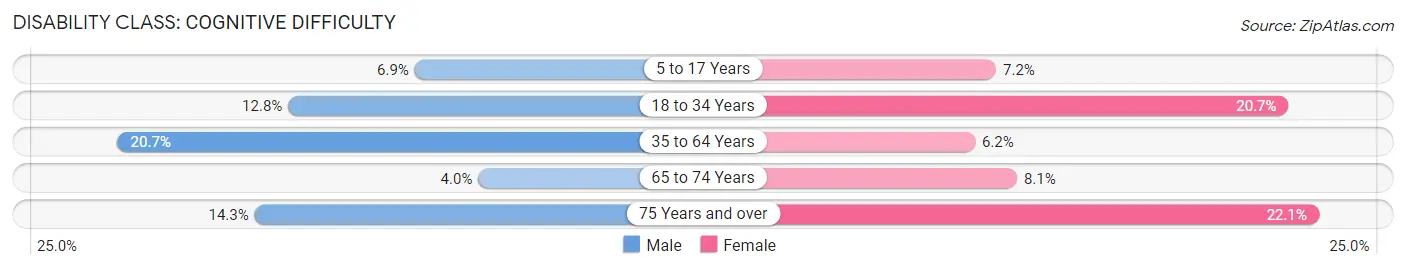
| Age Bracket | Male | Female |
| 5 to 17 Years | 32 (6.9%) | 32 (7.2%) |
| 18 to 34 Years | 66 (12.8%) | 103 (20.7%) |
| 35 to 64 Years | 287 (20.7%) | 90 (6.2%) |
| 65 to 74 Years | 28 (4.0%) | 54 (8.1%) |
| 75 Years and over | 51 (14.3%) | 81 (22.1%) |
Disability Class: Ambulatory Difficulty
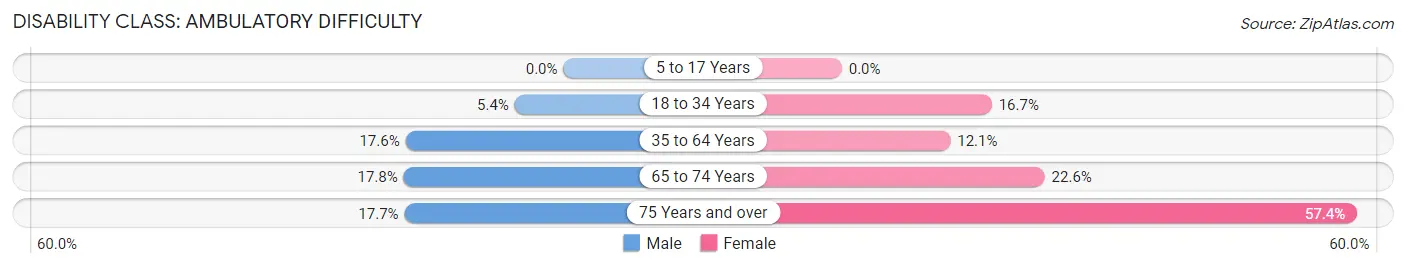
| Age Bracket | Male | Female |
| 5 to 17 Years | 0 (0.0%) | 0 (0.0%) |
| 18 to 34 Years | 28 (5.4%) | 83 (16.7%) |
| 35 to 64 Years | 244 (17.6%) | 176 (12.1%) |
| 65 to 74 Years | 126 (17.8%) | 150 (22.6%) |
| 75 Years and over | 63 (17.7%) | 210 (57.4%) |
Disability Class: Self-Care Difficulty
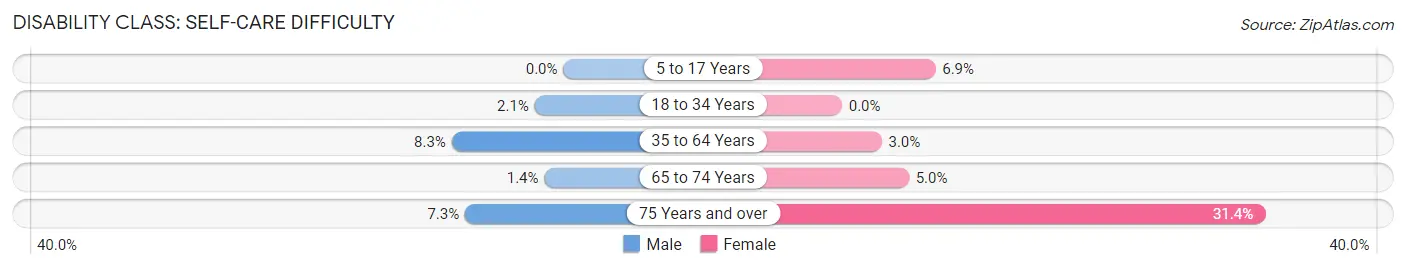
| Age Bracket | Male | Female |
| 5 to 17 Years | 0 (0.0%) | 31 (6.9%) |
| 18 to 34 Years | 11 (2.1%) | 0 (0.0%) |
| 35 to 64 Years | 115 (8.3%) | 43 (2.9%) |
| 65 to 74 Years | 10 (1.4%) | 33 (5.0%) |
| 75 Years and over | 26 (7.3%) | 115 (31.4%) |
Technology Access in Ferry County
Computing Device Access in Ferry County
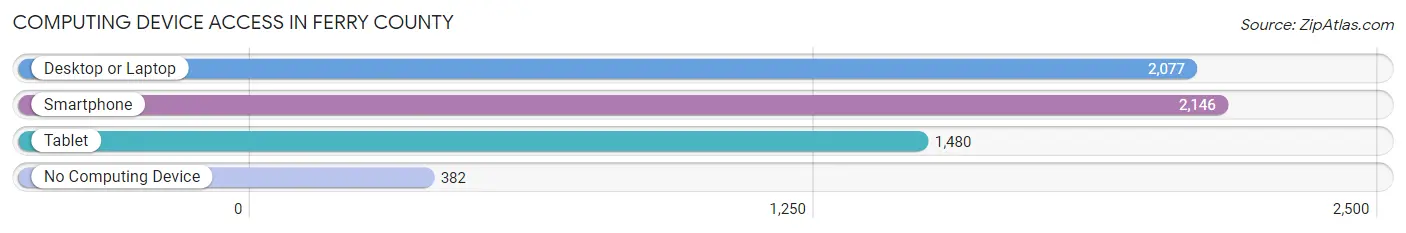
| Device Type | # Households | % Households |
| Desktop or Laptop | 2,077 | 68.7% |
| Smartphone | 2,146 | 70.9% |
| Tablet | 1,480 | 48.9% |
| No Computing Device | 382 | 12.6% |
| Total | 3,025 | 100.0% |
Internet Access in Ferry County
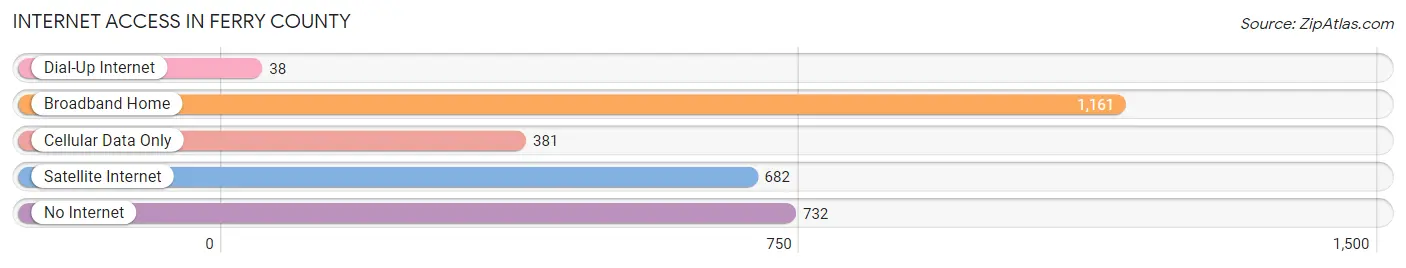
| Internet Type | # Households | % Households |
| Dial-Up Internet | 38 | 1.3% |
| Broadband Home | 1,161 | 38.4% |
| Cellular Data Only | 381 | 12.6% |
| Satellite Internet | 682 | 22.6% |
| No Internet | 732 | 24.2% |
| Total | 3,025 | 100.0% |
Ferry County Summary
Ferry County is a county located in the northeastern corner of the U.S. state of Washington. As of the 2010 census, the population was 7,551, making it the least populous county in Washington. The county seat and largest city is Republic. The county was created out of Stevens County on February 22, 1899, and is named for Elisha P. Ferry, the first governor of the state of Washington.
Geography
Ferry County is located in the northeastern corner of Washington, bordered by the Canadian province of British Columbia to the north, Stevens County to the west, and Pend Oreille County to the south. According to the U.S. Census Bureau, the county has a total area of 2,256 square miles (5,837 km2), of which 2,253 square miles (5,828 km2) is land and 3.3 square miles (8.5 km2) (0.1%) is water.
The county is located in the Columbia Plateau region of Washington, and is characterized by rolling hills and valleys. The Kettle River, a tributary of the Columbia River, flows through the county. The highest point in the county is Mount Hull, at an elevation of 6,890 feet (2,100 m).
Demographics
As of the 2010 United States Census, there were 7,551 people, 3,072 households, and 2,092 families residing in the county. The population density was 3.3 inhabitants per square mile (1.3/km2). There were 4,093 housing units at an average density of 1.8 per square mile (0.7/km2). The racial makeup of the county was 92.2% white, 0.3% American Indian, 0.2% Asian, 0.2% Pacific islander, 0.2% black or African American, 4.7% from other races, and 2.2% from two or more races. Those of Hispanic or Latino origin made up 8.2% of the population. In terms of ancestry, 24.2% were German, 11.7% were English, 11.3% were Irish, and 5.2% were American.
Of the 3,072 households, 28.2% had children under the age of 18 living with them, 54.2% were married couples living together, 8.7% had a female householder with no husband present, 32.2% were non-families, and 27.2% of all households were made up of individuals. The average household size was 2.41 and the average family size was 2.90. The median age was 44.7 years.
The median income for a household in the county was $37,945 and the median income for a family was $45,938. Males had a median income of $37,813 versus $27,917 for females. The per capita income for the county was $19,945. About 11.2% of families and 14.7% of the population were below the poverty line, including 20.2% of those under age 18 and 8.2% of those age 65 or over.
Economy
Ferry County is largely rural and agricultural, with a few small towns and villages. The county is home to several small businesses, including a few wineries, a brewery, and a distillery. The county is also home to several recreational activities, including camping, fishing, hunting, and hiking.
The county is home to several large employers, including the Grand Coulee Dam, which is the largest hydroelectric power plant in the United States. The dam provides electricity to much of the Pacific Northwest. The county is also home to several timber companies, which provide jobs to many of the county's residents.
The county is also home to several small businesses, including a few wineries, a brewery, and a distillery. The county is also home to several recreational activities, including camping, fishing, hunting, and hiking.
Conclusion
Ferry County is a rural county located in the northeastern corner of Washington. It is home to a population of 7,551 people, and is largely agricultural and recreational in nature. The county is home to several large employers, including the Grand Coulee Dam, and several small businesses, including wineries, a brewery, and a distillery. The county is also home to several recreational activities, including camping, fishing, hunting, and hiking.
Common Questions
What is Per Capita Income in Ferry County?
Per Capita income in Ferry County is $31,355.
What is the Median Family Income in Ferry County?
Median Family Income in Ferry County is $71,099.
What is the Median Household income in Ferry County?
Median Household Income in Ferry County is $50,424.
What is Income or Wage Gap in Ferry County?
Income or Wage Gap in Ferry County is 17.5%.
Women in Ferry County earn 82.5 cents for every dollar earned by a man.
What is Family Income Deficit in Ferry County?
Family Income Deficit in Ferry County is $10,053.
Families that are below poverty line in Ferry County earn $10,053 less on average than the poverty threshold level.
What is Inequality or Gini Index in Ferry County?
Inequality or Gini Index in Ferry County is 0.48.
What is the Total Population of Ferry County?
Total Population of Ferry County is 7,260.
What is the Total Male Population of Ferry County?
Total Male Population of Ferry County is 3,645.
What is the Total Female Population of Ferry County?
Total Female Population of Ferry County is 3,615.
What is the Ratio of Males per 100 Females in Ferry County?
There are 100.83 Males per 100 Females in Ferry County.
What is the Ratio of Females per 100 Males in Ferry County?
There are 99.18 Females per 100 Males in Ferry County.
What is the Median Population Age in Ferry County?
Median Population Age in Ferry County is 51.8 Years.
What is the Average Family Size in Ferry County
Average Family Size in Ferry County is 3.0 People.
What is the Average Household Size in Ferry County
Average Household Size in Ferry County is 2.3 People.
How Large is the Labor Force in Ferry County?
There are 2,726 People in the Labor Forcein in Ferry County.
What is the Percentage of People in the Labor Force in Ferry County?
44.3% of People are in the Labor Force in Ferry County.
What is the Unemployment Rate in Ferry County?
Unemployment Rate in Ferry County is 7.6%.