Zip Codes with the Highest Percentage of Population Employed in Arts, Entertainment & Recreation in Chambersburg, PA
RELATED REPORTS & OPTIONS
Arts, Entertainment & Recreation
Chambersburg
Compare Zip Codes
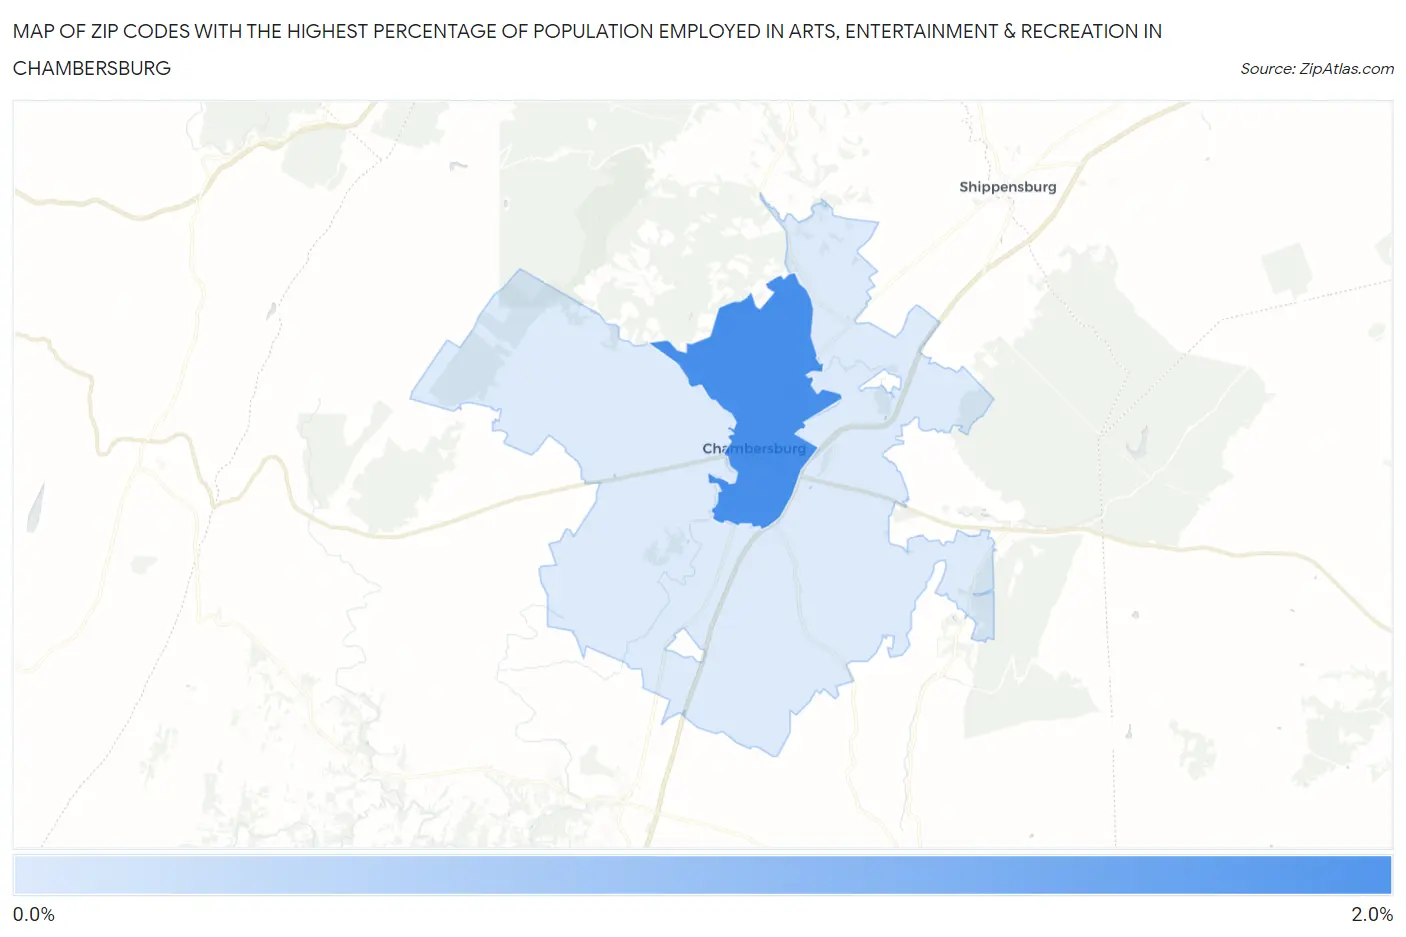
Map of Zip Codes with the Highest Percentage of Population Employed in Arts, Entertainment & Recreation in Chambersburg
0.72%
1.6%
Zip Codes with the Highest Percentage of Population Employed in Arts, Entertainment & Recreation in Chambersburg, PA
| Zip Code | % Employed | vs State | vs National | |
| 1. | 17201 | 1.6% | 1.8%(-0.196)#584 | 2.1%(-0.480)#12,443 |
| 2. | 17202 | 0.72% | 1.8%(-1.08)#951 | 2.1%(-1.36)#18,971 |
1
Common Questions
What are the Top Zip Codes with the Highest Percentage of Population Employed in Arts, Entertainment & Recreation in Chambersburg, PA?
Top Zip Codes with the Highest Percentage of Population Employed in Arts, Entertainment & Recreation in Chambersburg, PA are:
What zip code has the Highest Percentage of Population Employed in Arts, Entertainment & Recreation in Chambersburg, PA?
17201 has the Highest Percentage of Population Employed in Arts, Entertainment & Recreation in Chambersburg, PA with 1.6%.
What is the Percentage of Population Employed in Arts, Entertainment & Recreation in Pennsylvania?
Percentage of Population Employed in Arts, Entertainment & Recreation in Pennsylvania is 1.8%.
What is the Percentage of Population Employed in Arts, Entertainment & Recreation in the United States?
Percentage of Population Employed in Arts, Entertainment & Recreation in the United States is 2.1%.