Zip Codes with the Highest Percentage of Population Employed in Arts, Entertainment & Recreation in Edinboro, PA
RELATED REPORTS & OPTIONS
Arts, Entertainment & Recreation
Edinboro
Compare Zip Codes
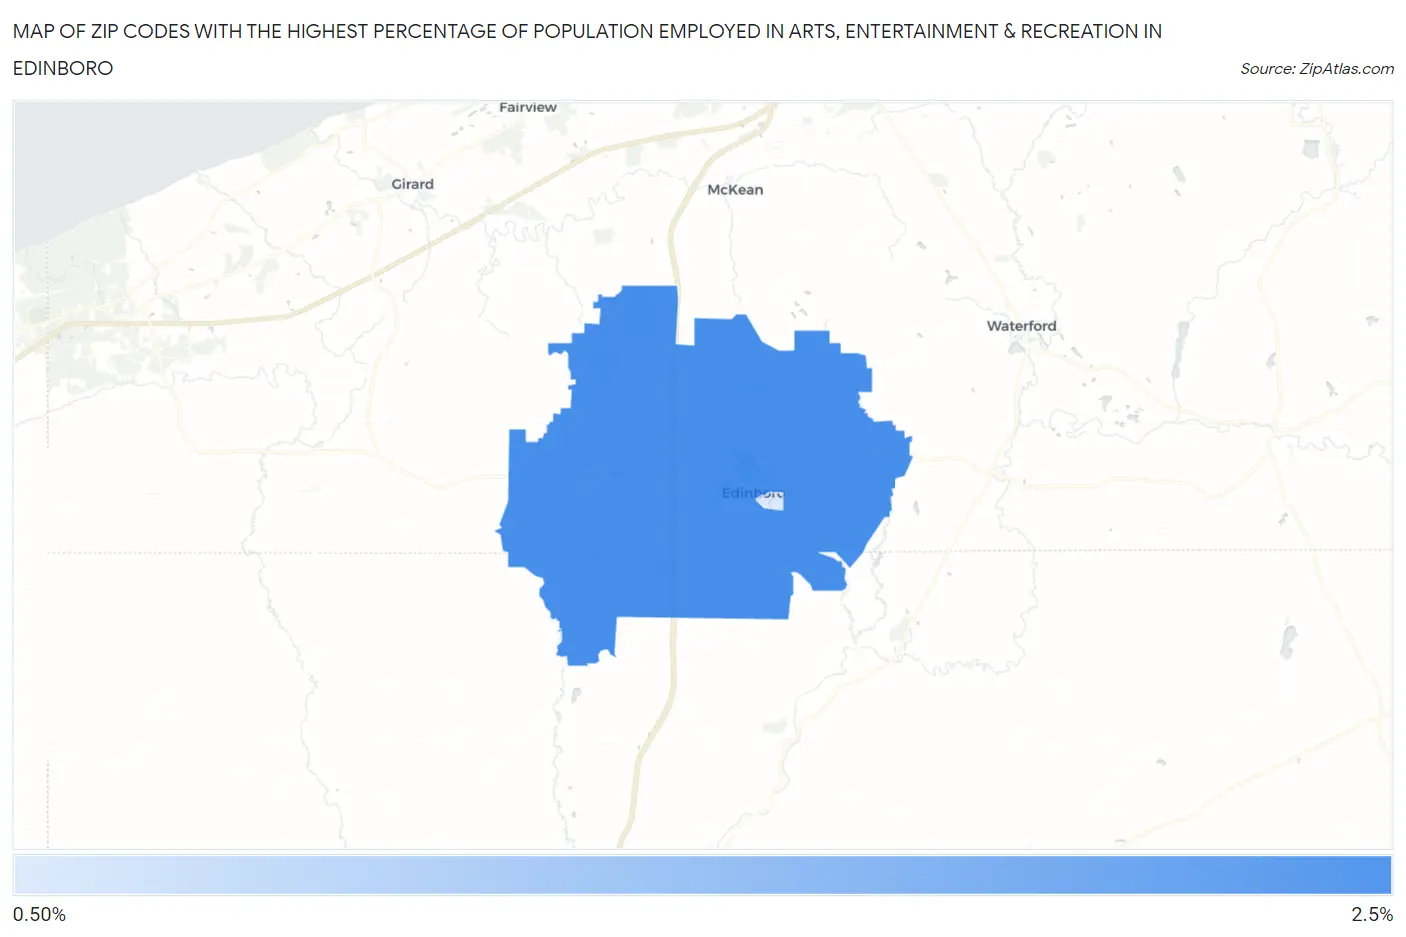
Map of Zip Codes with the Highest Percentage of Population Employed in Arts, Entertainment & Recreation in Edinboro
1.0%
2.2%
Zip Codes with the Highest Percentage of Population Employed in Arts, Entertainment & Recreation in Edinboro, PA
| Zip Code | % Employed | vs State | vs National | |
| 1. | 16412 | 2.2% | 1.8%(+0.412)#374 | 2.1%(+0.128)#8,572 |
| 2. | 16444 | 1.0% | 1.8%(-0.754)#813 | 2.1%(-1.04)#16,615 |
1
Common Questions
What are the Top Zip Codes with the Highest Percentage of Population Employed in Arts, Entertainment & Recreation in Edinboro, PA?
Top Zip Codes with the Highest Percentage of Population Employed in Arts, Entertainment & Recreation in Edinboro, PA are:
What zip code has the Highest Percentage of Population Employed in Arts, Entertainment & Recreation in Edinboro, PA?
16412 has the Highest Percentage of Population Employed in Arts, Entertainment & Recreation in Edinboro, PA with 2.2%.
What is the Percentage of Population Employed in Arts, Entertainment & Recreation in Pennsylvania?
Percentage of Population Employed in Arts, Entertainment & Recreation in Pennsylvania is 1.8%.
What is the Percentage of Population Employed in Arts, Entertainment & Recreation in the United States?
Percentage of Population Employed in Arts, Entertainment & Recreation in the United States is 2.1%.