Zip Codes with the Highest Percentage of Population Employed in Arts, Entertainment & Recreation in Pennsylvania
RELATED REPORTS & OPTIONS
Arts, Entertainment & Recreation
Pennsylvania
Compare Zip Codes
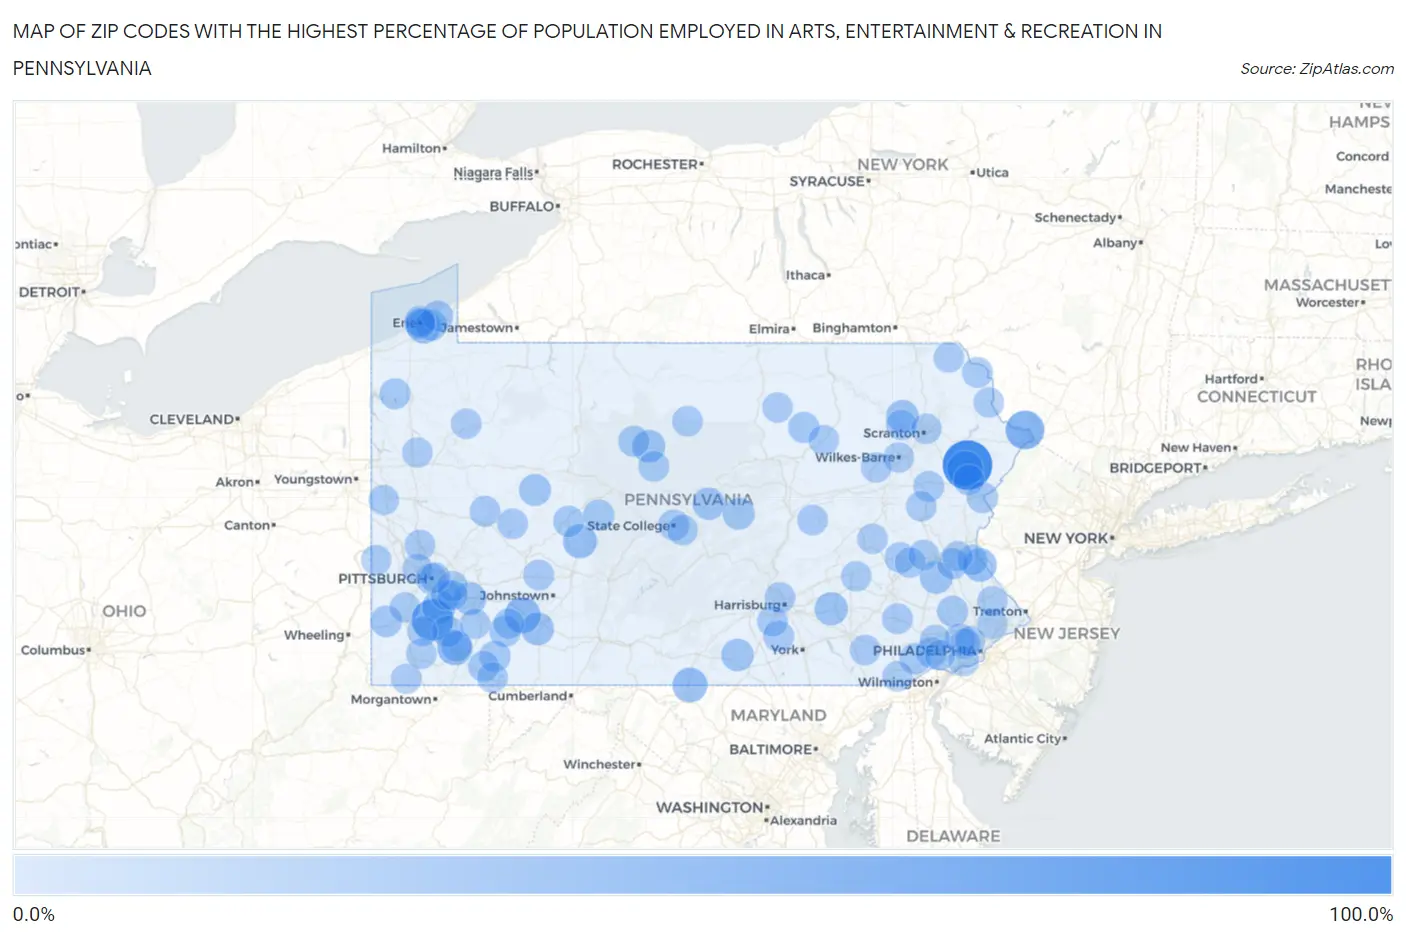
Map of Zip Codes with the Highest Percentage of Population Employed in Arts, Entertainment & Recreation in Pennsylvania
0.0%
100.0%
Zip Codes with the Highest Percentage of Population Employed in Arts, Entertainment & Recreation in Pennsylvania
| Zip Code | % Employed | vs State | vs National | |
| 1. | 18323 | 100.0% | 1.8%(+98.2)#1 | 2.1%(+97.9)#5 |
| 2. | 15366 | 59.6% | 1.8%(+57.8)#2 | 2.1%(+57.5)#23 |
| 3. | 18340 | 44.4% | 1.8%(+42.6)#3 | 2.1%(+42.4)#43 |
| 4. | 18342 | 31.8% | 1.8%(+30.0)#4 | 2.1%(+29.7)#71 |
| 5. | 15655 | 31.2% | 1.8%(+29.4)#5 | 2.1%(+29.1)#73 |
| 6. | 15449 | 28.4% | 1.8%(+26.6)#6 | 2.1%(+26.3)#88 |
| 7. | 17263 | 25.5% | 1.8%(+23.7)#7 | 2.1%(+23.4)#112 |
| 8. | 16546 | 24.0% | 1.8%(+22.2)#8 | 2.1%(+21.9)#123 |
| 9. | 16675 | 21.7% | 1.8%(+19.9)#9 | 2.1%(+19.7)#152 |
| 10. | 15038 | 20.0% | 1.8%(+18.2)#10 | 2.1%(+17.9)#184 |
| 11. | 18921 | 19.3% | 1.8%(+17.5)#11 | 2.1%(+17.2)#201 |
| 12. | 17064 | 17.5% | 1.8%(+15.7)#12 | 2.1%(+15.4)#238 |
| 13. | 15520 | 17.1% | 1.8%(+15.3)#13 | 2.1%(+15.0)#254 |
| 14. | 15611 | 16.2% | 1.8%(+14.4)#14 | 2.1%(+14.1)#279 |
| 15. | 18056 | 16.0% | 1.8%(+14.2)#15 | 2.1%(+13.9)#290 |
| 16. | 15861 | 15.9% | 1.8%(+14.1)#16 | 2.1%(+13.8)#298 |
| 17. | 18625 | 15.1% | 1.8%(+13.3)#17 | 2.1%(+13.0)#330 |
| 18. | 16852 | 14.5% | 1.8%(+12.7)#18 | 2.1%(+12.5)#359 |
| 19. | 17303 | 14.2% | 1.8%(+12.4)#19 | 2.1%(+12.1)#375 |
| 20. | 17885 | 12.2% | 1.8%(+10.4)#20 | 2.1%(+10.1)#493 |
| 21. | 15730 | 11.9% | 1.8%(+10.1)#21 | 2.1%(+9.86)#513 |
| 22. | 16563 | 10.5% | 1.8%(+8.71)#22 | 2.1%(+8.42)#650 |
| 23. | 15365 | 10.0% | 1.8%(+8.20)#23 | 2.1%(+7.92)#702 |
| 24. | 15646 | 9.7% | 1.8%(+7.91)#24 | 2.1%(+7.63)#746 |
| 25. | 15483 | 9.4% | 1.8%(+7.55)#25 | 2.1%(+7.27)#797 |
| 26. | 15464 | 8.9% | 1.8%(+7.06)#26 | 2.1%(+6.78)#873 |
| 27. | 18327 | 8.7% | 1.8%(+6.87)#27 | 2.1%(+6.59)#916 |
| 28. | 18619 | 8.6% | 1.8%(+6.77)#28 | 2.1%(+6.49)#926 |
| 29. | 19474 | 8.5% | 1.8%(+6.71)#29 | 2.1%(+6.43)#939 |
| 30. | 16421 | 7.9% | 1.8%(+6.15)#30 | 2.1%(+5.87)#1,069 |
| 31. | 15832 | 7.8% | 1.8%(+6.01)#31 | 2.1%(+5.73)#1,103 |
| 32. | 15721 | 7.8% | 1.8%(+6.01)#32 | 2.1%(+5.73)#1,104 |
| 33. | 19375 | 7.8% | 1.8%(+5.99)#33 | 2.1%(+5.71)#1,109 |
| 34. | 16861 | 7.7% | 1.8%(+5.89)#34 | 2.1%(+5.61)#1,136 |
| 35. | 18034 | 7.4% | 1.8%(+5.62)#35 | 2.1%(+5.34)#1,197 |
| 36. | 15470 | 7.2% | 1.8%(+5.37)#36 | 2.1%(+5.09)#1,279 |
| 37. | 16422 | 7.0% | 1.8%(+5.24)#37 | 2.1%(+4.96)#1,315 |
| 38. | 17365 | 6.7% | 1.8%(+4.93)#38 | 2.1%(+4.65)#1,408 |
| 39. | 18624 | 6.7% | 1.8%(+4.87)#39 | 2.1%(+4.58)#1,431 |
| 40. | 16507 | 6.6% | 1.8%(+4.82)#40 | 2.1%(+4.54)#1,451 |
| 41. | 16802 | 6.6% | 1.8%(+4.76)#41 | 2.1%(+4.48)#1,469 |
| 42. | 16871 | 6.5% | 1.8%(+4.72)#42 | 2.1%(+4.44)#1,483 |
| 43. | 19383 | 6.5% | 1.8%(+4.70)#43 | 2.1%(+4.42)#1,494 |
| 44. | 16501 | 6.4% | 1.8%(+4.63)#44 | 2.1%(+4.35)#1,527 |
| 45. | 19085 | 6.4% | 1.8%(+4.61)#45 | 2.1%(+4.33)#1,538 |
| 46. | 16210 | 6.3% | 1.8%(+4.47)#46 | 2.1%(+4.19)#1,599 |
| 47. | 16827 | 6.1% | 1.8%(+4.34)#47 | 2.1%(+4.05)#1,639 |
| 48. | 18332 | 6.1% | 1.8%(+4.32)#48 | 2.1%(+4.04)#1,648 |
| 49. | 19534 | 6.1% | 1.8%(+4.30)#49 | 2.1%(+4.02)#1,655 |
| 50. | 18417 | 6.0% | 1.8%(+4.17)#50 | 2.1%(+3.89)#1,713 |
| 51. | 15459 | 5.9% | 1.8%(+4.10)#51 | 2.1%(+3.82)#1,748 |
| 52. | 15282 | 5.9% | 1.8%(+4.08)#52 | 2.1%(+3.80)#1,758 |
| 53. | 17093 | 5.9% | 1.8%(+4.07)#53 | 2.1%(+3.79)#1,772 |
| 54. | 17860 | 5.8% | 1.8%(+4.02)#54 | 2.1%(+3.73)#1,798 |
| 55. | 15086 | 5.8% | 1.8%(+4.00)#55 | 2.1%(+3.71)#1,806 |
| 56. | 17027 | 5.7% | 1.8%(+3.93)#56 | 2.1%(+3.65)#1,837 |
| 57. | 19530 | 5.7% | 1.8%(+3.92)#57 | 2.1%(+3.64)#1,839 |
| 58. | 19543 | 5.7% | 1.8%(+3.92)#58 | 2.1%(+3.63)#1,841 |
| 59. | 16244 | 5.7% | 1.8%(+3.92)#59 | 2.1%(+3.63)#1,846 |
| 60. | 19003 | 5.7% | 1.8%(+3.90)#60 | 2.1%(+3.62)#1,858 |
| 61. | 15920 | 5.7% | 1.8%(+3.89)#61 | 2.1%(+3.61)#1,863 |
| 62. | 15133 | 5.5% | 1.8%(+3.71)#62 | 2.1%(+3.43)#1,957 |
| 63. | 15687 | 5.5% | 1.8%(+3.69)#63 | 2.1%(+3.41)#1,973 |
| 64. | 17579 | 5.5% | 1.8%(+3.68)#64 | 2.1%(+3.40)#1,979 |
| 65. | 17729 | 5.5% | 1.8%(+3.66)#65 | 2.1%(+3.37)#1,993 |
| 66. | 18077 | 5.4% | 1.8%(+3.65)#66 | 2.1%(+3.36)#1,994 |
| 67. | 15480 | 5.4% | 1.8%(+3.63)#67 | 2.1%(+3.35)#2,003 |
| 68. | 19550 | 5.3% | 1.8%(+3.49)#68 | 2.1%(+3.20)#2,086 |
| 69. | 18615 | 5.1% | 1.8%(+3.34)#69 | 2.1%(+3.06)#2,187 |
| 70. | 15035 | 5.0% | 1.8%(+3.20)#70 | 2.1%(+2.92)#2,283 |
| 71. | 15362 | 5.0% | 1.8%(+3.18)#71 | 2.1%(+2.90)#2,299 |
| 72. | 19009 | 5.0% | 1.8%(+3.17)#72 | 2.1%(+2.89)#2,306 |
| 73. | 18701 | 5.0% | 1.8%(+3.17)#73 | 2.1%(+2.89)#2,310 |
| 74. | 18617 | 4.9% | 1.8%(+3.10)#74 | 2.1%(+2.82)#2,356 |
| 75. | 15346 | 4.8% | 1.8%(+3.03)#75 | 2.1%(+2.75)#2,413 |
| 76. | 18925 | 4.7% | 1.8%(+2.94)#76 | 2.1%(+2.66)#2,490 |
| 77. | 19345 | 4.7% | 1.8%(+2.93)#77 | 2.1%(+2.65)#2,505 |
| 78. | 15131 | 4.7% | 1.8%(+2.90)#78 | 2.1%(+2.62)#2,533 |
| 79. | 15342 | 4.7% | 1.8%(+2.87)#79 | 2.1%(+2.59)#2,554 |
| 80. | 17930 | 4.6% | 1.8%(+2.83)#80 | 2.1%(+2.55)#2,604 |
| 81. | 17765 | 4.6% | 1.8%(+2.78)#81 | 2.1%(+2.50)#2,651 |
| 82. | 18509 | 4.6% | 1.8%(+2.76)#82 | 2.1%(+2.48)#2,674 |
| 83. | 18462 | 4.5% | 1.8%(+2.73)#83 | 2.1%(+2.45)#2,705 |
| 84. | 16344 | 4.5% | 1.8%(+2.69)#84 | 2.1%(+2.40)#2,759 |
| 85. | 19352 | 4.4% | 1.8%(+2.65)#85 | 2.1%(+2.37)#2,799 |
| 86. | 18405 | 4.4% | 1.8%(+2.63)#86 | 2.1%(+2.35)#2,815 |
| 87. | 19076 | 4.4% | 1.8%(+2.61)#87 | 2.1%(+2.33)#2,838 |
| 88. | 18051 | 4.4% | 1.8%(+2.57)#88 | 2.1%(+2.29)#2,879 |
| 89. | 16102 | 4.3% | 1.8%(+2.52)#89 | 2.1%(+2.24)#2,938 |
| 90. | 18015 | 4.3% | 1.8%(+2.50)#90 | 2.1%(+2.21)#2,969 |
| 91. | 17758 | 4.3% | 1.8%(+2.48)#91 | 2.1%(+2.20)#2,985 |
| 92. | 15360 | 4.2% | 1.8%(+2.43)#92 | 2.1%(+2.14)#3,046 |
| 93. | 15225 | 4.2% | 1.8%(+2.40)#93 | 2.1%(+2.12)#3,082 |
| 94. | 19319 | 4.2% | 1.8%(+2.40)#94 | 2.1%(+2.11)#3,086 |
| 95. | 19072 | 4.2% | 1.8%(+2.39)#95 | 2.1%(+2.11)#3,090 |
| 96. | 15213 | 4.1% | 1.8%(+2.35)#96 | 2.1%(+2.07)#3,145 |
| 97. | 18229 | 4.1% | 1.8%(+2.33)#97 | 2.1%(+2.04)#3,175 |
| 98. | 16133 | 4.1% | 1.8%(+2.32)#98 | 2.1%(+2.04)#3,180 |
| 99. | 15612 | 4.1% | 1.8%(+2.30)#99 | 2.1%(+2.02)#3,202 |
| 100. | 15043 | 4.1% | 1.8%(+2.26)#100 | 2.1%(+1.98)#3,248 |
Common Questions
What are the Top 10 Zip Codes with the Highest Percentage of Population Employed in Arts, Entertainment & Recreation in Pennsylvania?
Top 10 Zip Codes with the Highest Percentage of Population Employed in Arts, Entertainment & Recreation in Pennsylvania are:
What zip code has the Highest Percentage of Population Employed in Arts, Entertainment & Recreation in Pennsylvania?
18323 has the Highest Percentage of Population Employed in Arts, Entertainment & Recreation in Pennsylvania with 100.0%.
What is the Percentage of Population Employed in Arts, Entertainment & Recreation in the State of Pennsylvania?
Percentage of Population Employed in Arts, Entertainment & Recreation in Pennsylvania is 1.8%.
What is the Percentage of Population Employed in Arts, Entertainment & Recreation in the United States?
Percentage of Population Employed in Arts, Entertainment & Recreation in the United States is 2.1%.