Sunbury, OH Map & Demographics
Sunbury Map
Sunbury Overview
$41,708
PER CAPITA INCOME
$91,776
AVG FAMILY INCOME
$92,115
AVG HOUSEHOLD INCOME
9.8%
WAGE / INCOME GAP [ % ]
90.2¢/ $1
WAGE / INCOME GAP [ $ ]
0.36
INEQUALITY / GINI INDEX
6,933
TOTAL POPULATION
3,273
MALE POPULATION
3,660
FEMALE POPULATION
89.43
MALES / 100 FEMALES
111.82
FEMALES / 100 MALES
33.3
MEDIAN AGE
3.1
AVG FAMILY SIZE
2.7
AVG HOUSEHOLD SIZE
3,806
LABOR FORCE [ PEOPLE ]
70.9%
PERCENT IN LABOR FORCE
1.6%
UNEMPLOYMENT RATE
Sunbury Zip Codes
Sunbury Area Codes
Income in Sunbury
Income Overview in Sunbury
Per Capita Income in Sunbury is $41,708, while median incomes of families and households are $91,776 and $92,115 respectively.
| Characteristic | Number | Measure |
| Per Capita Income | 6,933 | $41,708 |
| Median Family Income | 1,845 | $91,776 |
| Mean Family Income | 1,845 | $114,112 |
| Median Household Income | 2,594 | $92,115 |
| Mean Household Income | 2,594 | $106,562 |
| Income Deficit | 1,845 | $0 |
| Wage / Income Gap (%) | 6,933 | 9.76% |
| Wage / Income Gap ($) | 6,933 | 90.24¢ per $1 |
| Gini / Inequality Index | 6,933 | 0.36 |
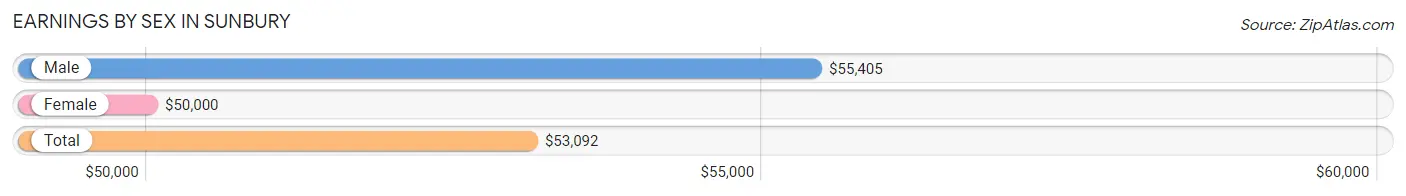
Earnings by Sex in Sunbury
Average Earnings in Sunbury are $53,092, $55,405 for men and $50,000 for women, a difference of 9.8%.
| Sex | Number | Average Earnings |
| Male | 2,046 (52.6%) | $55,405 |
| Female | 1,844 (47.4%) | $50,000 |
| Total | 3,890 (100.0%) | $53,092 |
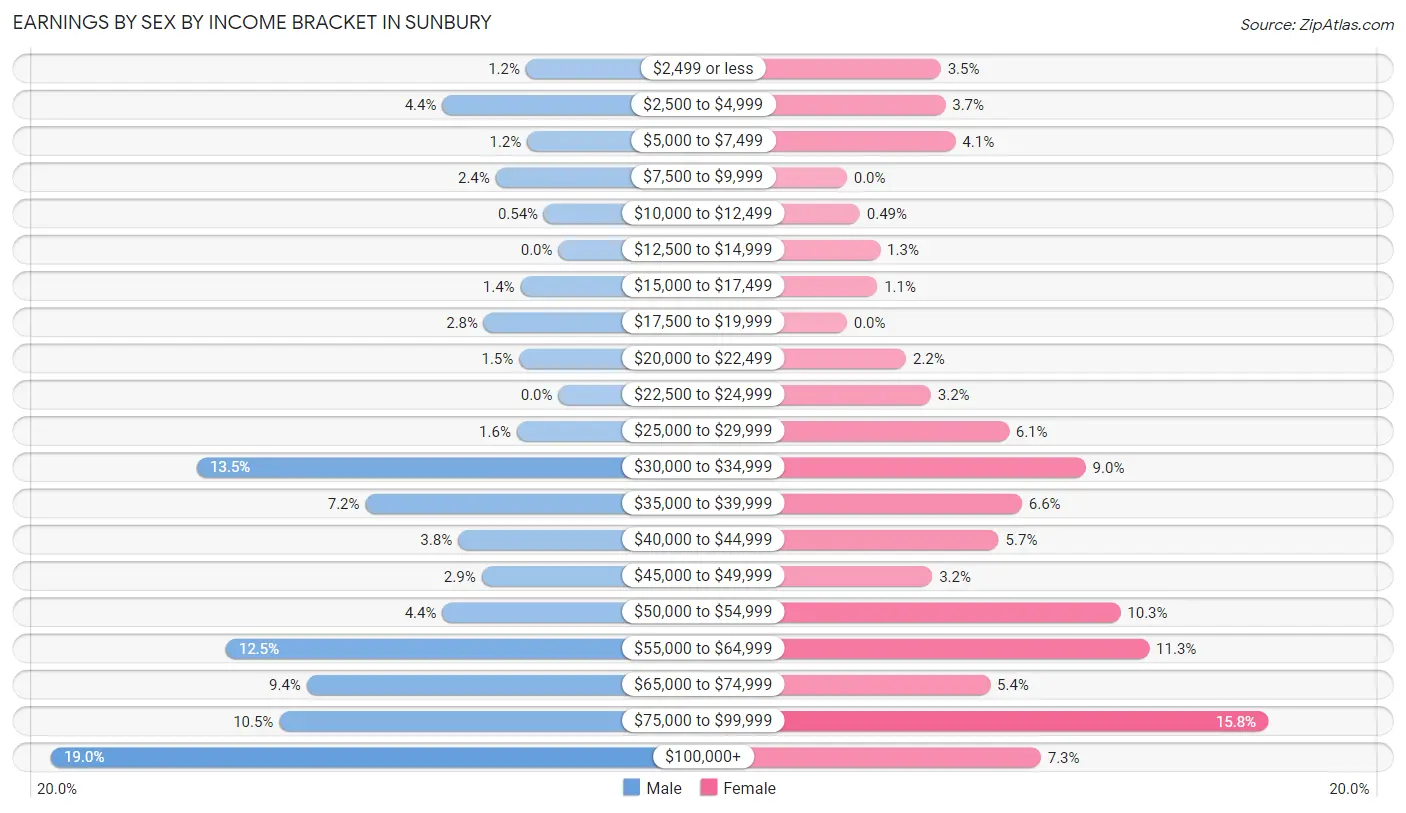
Earnings by Sex by Income Bracket in Sunbury
The most common earnings brackets in Sunbury are $100,000+ for men (389 | 19.0%) and $75,000 to $99,999 for women (291 | 15.8%).
| Income | Male | Female |
| $2,499 or less | 25 (1.2%) | 65 (3.5%) |
| $2,500 to $4,999 | 89 (4.3%) | 68 (3.7%) |
| $5,000 to $7,499 | 24 (1.2%) | 75 (4.1%) |
| $7,500 to $9,999 | 48 (2.4%) | 0 (0.0%) |
| $10,000 to $12,499 | 11 (0.5%) | 9 (0.5%) |
| $12,500 to $14,999 | 0 (0.0%) | 23 (1.3%) |
| $15,000 to $17,499 | 29 (1.4%) | 21 (1.1%) |
| $17,500 to $19,999 | 57 (2.8%) | 0 (0.0%) |
| $20,000 to $22,499 | 30 (1.5%) | 41 (2.2%) |
| $22,500 to $24,999 | 0 (0.0%) | 58 (3.2%) |
| $25,000 to $29,999 | 32 (1.6%) | 112 (6.1%) |
| $30,000 to $34,999 | 277 (13.5%) | 165 (8.9%) |
| $35,000 to $39,999 | 148 (7.2%) | 121 (6.6%) |
| $40,000 to $44,999 | 77 (3.8%) | 105 (5.7%) |
| $45,000 to $49,999 | 59 (2.9%) | 59 (3.2%) |
| $50,000 to $54,999 | 89 (4.3%) | 189 (10.2%) |
| $55,000 to $64,999 | 255 (12.5%) | 209 (11.3%) |
| $65,000 to $74,999 | 193 (9.4%) | 99 (5.4%) |
| $75,000 to $99,999 | 214 (10.5%) | 291 (15.8%) |
| $100,000+ | 389 (19.0%) | 134 (7.3%) |
| Total | 2,046 (100.0%) | 1,844 (100.0%) |
Earnings by Sex by Educational Attainment in Sunbury
Average earnings in Sunbury are $68,004 for men and $53,758 for women, a difference of 20.9%. Men with an educational attainment of graduate degree enjoy the highest average annual earnings of $126,199, while those with high school diploma education earn the least with $38,333. Women with an educational attainment of graduate degree earn the most with the average annual earnings of $99,091, while those with high school diploma education have the smallest earnings of $34,097.

| Educational Attainment | Male Income | Female Income |
| Less than High School | $72,143 | $0 |
| High School Diploma | $38,333 | $34,097 |
| College or Associate's Degree | $70,430 | $53,451 |
| Bachelor's Degree | $67,625 | $67,917 |
| Graduate Degree | $126,199 | $99,091 |
| Total | $68,004 | $53,758 |
Family Income in Sunbury
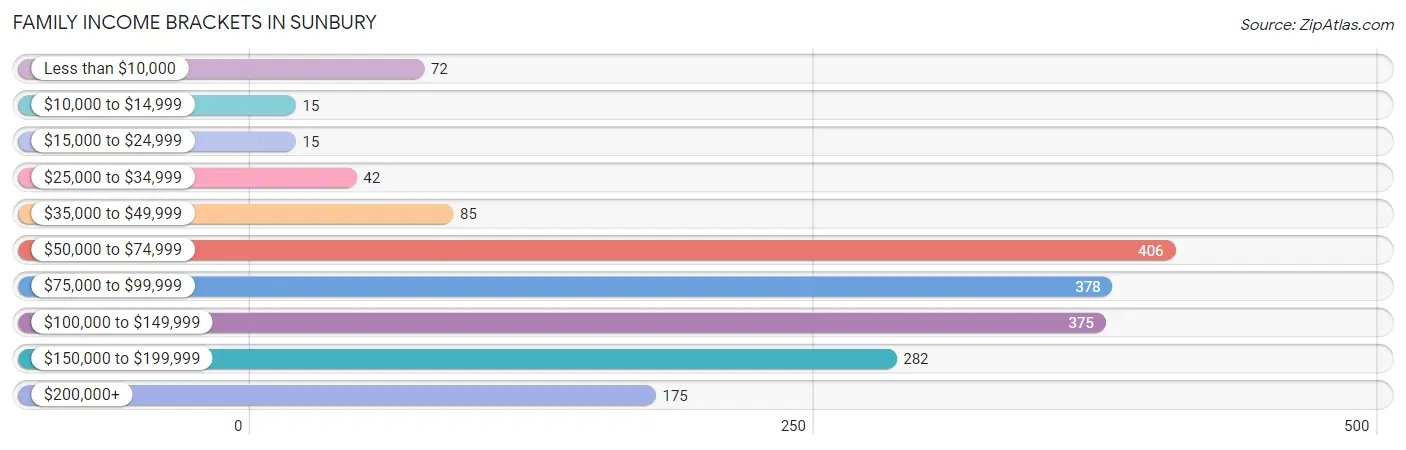
Family Income Brackets in Sunbury
According to the Sunbury family income data, there are 406 families falling into the $50,000 to $74,999 income range, which is the most common income bracket and makes up 22.0% of all families. Conversely, the $10,000 to $14,999 income bracket is the least frequent group with only 15 families (0.8%) belonging to this category.
| Income Bracket | # Families | % Families |
| Less than $10,000 | 72 | 3.9% |
| $10,000 to $14,999 | 15 | 0.8% |
| $15,000 to $24,999 | 15 | 0.8% |
| $25,000 to $34,999 | 42 | 2.3% |
| $35,000 to $49,999 | 85 | 4.6% |
| $50,000 to $74,999 | 406 | 22.0% |
| $75,000 to $99,999 | 378 | 20.5% |
| $100,000 to $149,999 | 375 | 20.3% |
| $150,000 to $199,999 | 282 | 15.3% |
| $200,000+ | 175 | 9.5% |
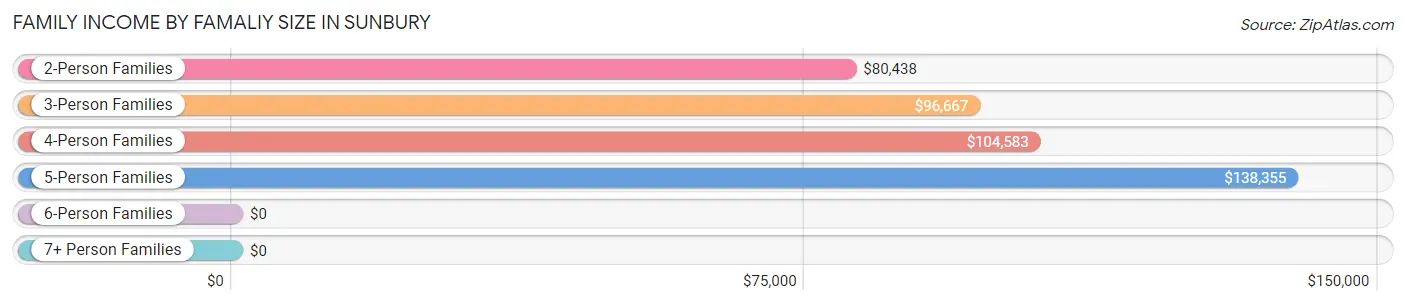
Family Income by Famaliy Size in Sunbury
5-person families (245 | 13.3%) account for the highest median family income in Sunbury with $138,355 per family, while 2-person families (872 | 47.3%) have the highest median income of $40,219 per family member.
| Income Bracket | # Families | Median Income |
| 2-Person Families | 872 (47.3%) | $80,438 |
| 3-Person Families | 376 (20.4%) | $96,667 |
| 4-Person Families | 347 (18.8%) | $104,583 |
| 5-Person Families | 245 (13.3%) | $138,355 |
| 6-Person Families | 0 (0.0%) | $0 |
| 7+ Person Families | 5 (0.3%) | $0 |
| Total | 1,845 (100.0%) | $91,776 |
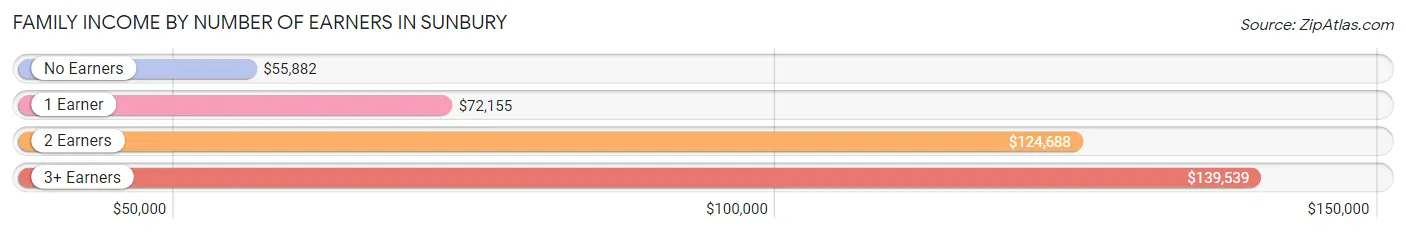
Family Income by Number of Earners in Sunbury
The median family income in Sunbury is $91,776, with families comprising 3+ earners (157) having the highest median family income of $139,539, while families with no earners (260) have the lowest median family income of $55,882, accounting for 8.5% and 14.1% of families, respectively.
| Number of Earners | # Families | Median Income |
| No Earners | 260 (14.1%) | $55,882 |
| 1 Earner | 642 (34.8%) | $72,155 |
| 2 Earners | 786 (42.6%) | $124,688 |
| 3+ Earners | 157 (8.5%) | $139,539 |
| Total | 1,845 (100.0%) | $91,776 |
Household Income in Sunbury
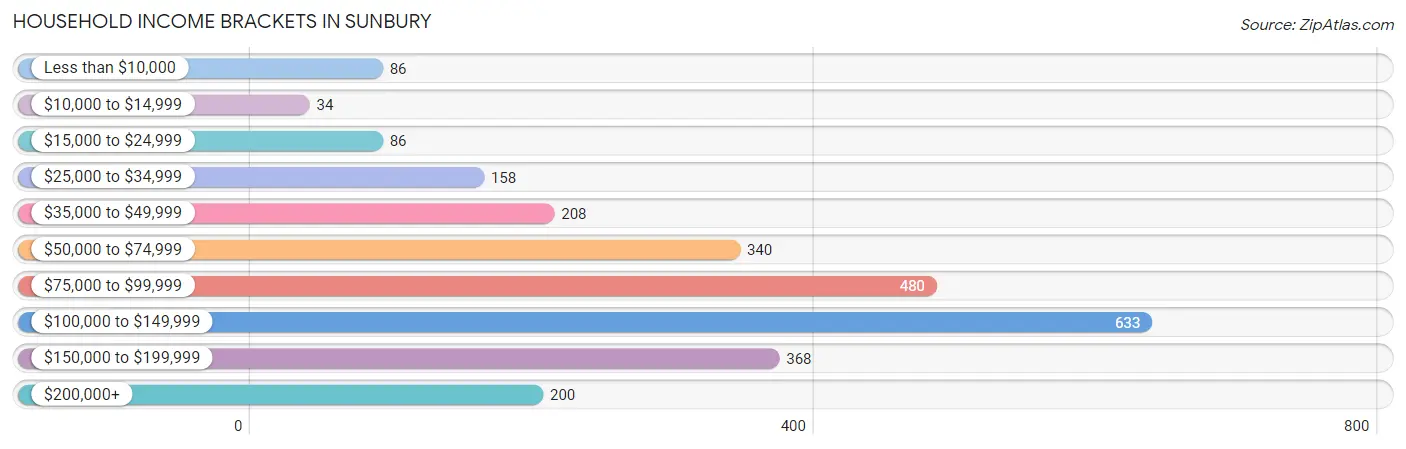
Household Income Brackets in Sunbury
With 633 households falling in the category, the $100,000 to $149,999 income range is the most frequent in Sunbury, accounting for 24.4% of all households. In contrast, only 34 households (1.3%) fall into the $10,000 to $14,999 income bracket, making it the least populous group.
| Income Bracket | # Households | % Households |
| Less than $10,000 | 86 | 3.3% |
| $10,000 to $14,999 | 34 | 1.3% |
| $15,000 to $24,999 | 86 | 3.3% |
| $25,000 to $34,999 | 158 | 6.1% |
| $35,000 to $49,999 | 208 | 8.0% |
| $50,000 to $74,999 | 340 | 13.1% |
| $75,000 to $99,999 | 480 | 18.5% |
| $100,000 to $149,999 | 633 | 24.4% |
| $150,000 to $199,999 | 368 | 14.2% |
| $200,000+ | 200 | 7.7% |
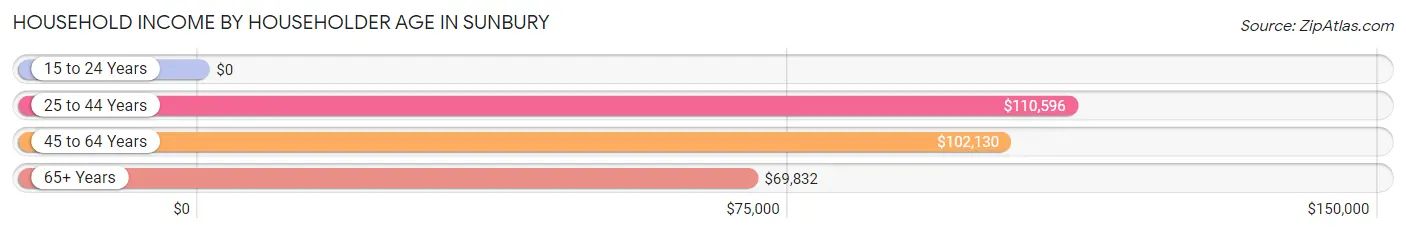
Household Income by Householder Age in Sunbury
The median household income in Sunbury is $92,115, with the highest median household income of $110,596 found in the 25 to 44 years age bracket for the primary householder. A total of 1,048 households (40.4%) fall into this category. Meanwhile, the 15 to 24 years age bracket for the primary householder has the lowest median household income of $0, with 117 households (4.5%) in this group.
| Income Bracket | # Households | Median Income |
| 15 to 24 Years | 117 (4.5%) | $0 |
| 25 to 44 Years | 1,048 (40.4%) | $110,596 |
| 45 to 64 Years | 924 (35.6%) | $102,130 |
| 65+ Years | 505 (19.5%) | $69,832 |
| Total | 2,594 (100.0%) | $92,115 |
Poverty in Sunbury
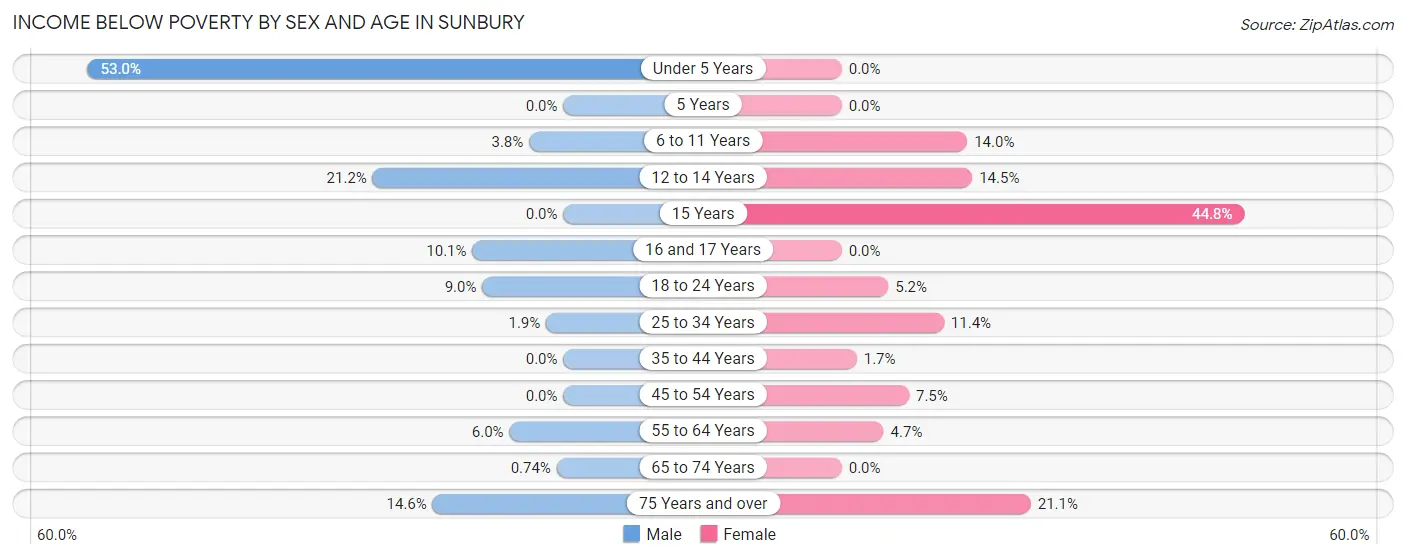
Income Below Poverty by Sex and Age in Sunbury
With 8.6% poverty level for males and 6.8% for females among the residents of Sunbury, under 5 year old males and 15 year old females are the most vulnerable to poverty, with 151 males (53.0%) and 26 females (44.8%) in their respective age groups living below the poverty level.
| Age Bracket | Male | Female |
| Under 5 Years | 151 (53.0%) | 0 (0.0%) |
| 5 Years | 0 (0.0%) | 0 (0.0%) |
| 6 to 11 Years | 9 (3.8%) | 25 (14.0%) |
| 12 to 14 Years | 24 (21.2%) | 25 (14.5%) |
| 15 Years | 0 (0.0%) | 26 (44.8%) |
| 16 and 17 Years | 8 (10.1%) | 0 (0.0%) |
| 18 to 24 Years | 43 (9.0%) | 10 (5.2%) |
| 25 to 34 Years | 9 (1.9%) | 68 (11.4%) |
| 35 to 44 Years | 0 (0.0%) | 9 (1.7%) |
| 45 to 54 Years | 0 (0.0%) | 26 (7.5%) |
| 55 to 64 Years | 22 (6.0%) | 25 (4.7%) |
| 65 to 74 Years | 2 (0.7%) | 0 (0.0%) |
| 75 Years and over | 15 (14.6%) | 36 (21.0%) |
| Total | 283 (8.6%) | 250 (6.8%) |
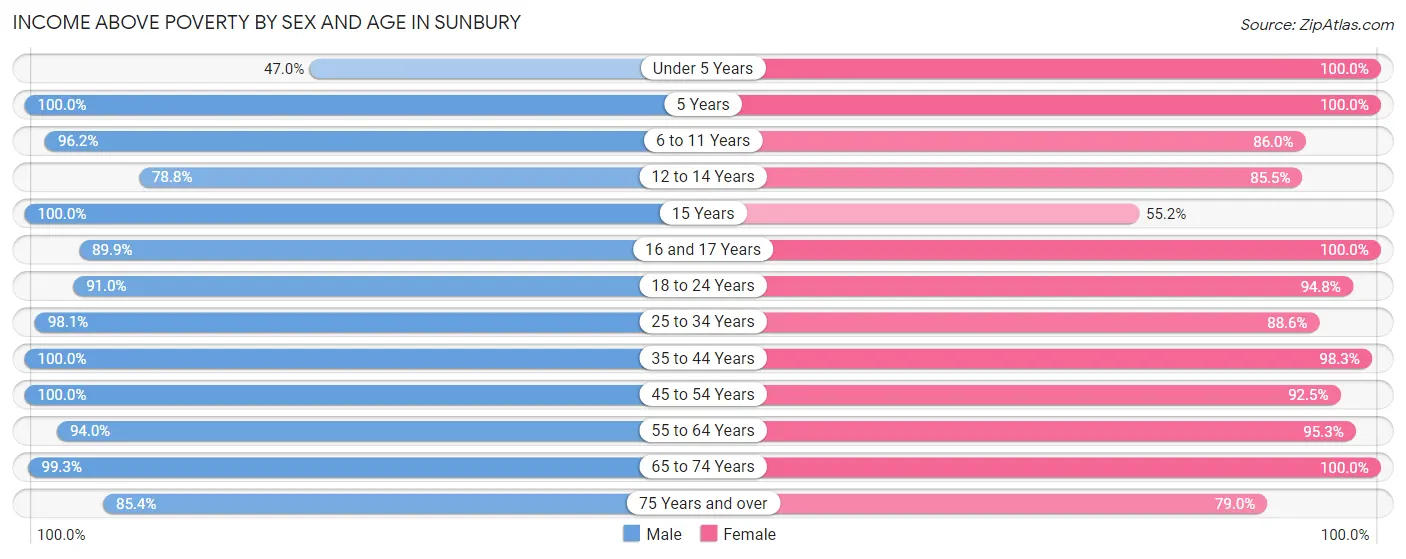
Income Above Poverty by Sex and Age in Sunbury
According to the poverty statistics in Sunbury, males aged 5 years and females aged under 5 years are the age groups that are most secure financially, with 100.0% of males and 100.0% of females in these age groups living above the poverty line.
| Age Bracket | Male | Female |
| Under 5 Years | 134 (47.0%) | 211 (100.0%) |
| 5 Years | 21 (100.0%) | 245 (100.0%) |
| 6 to 11 Years | 227 (96.2%) | 154 (86.0%) |
| 12 to 14 Years | 89 (78.8%) | 147 (85.5%) |
| 15 Years | 37 (100.0%) | 32 (55.2%) |
| 16 and 17 Years | 71 (89.9%) | 192 (100.0%) |
| 18 to 24 Years | 433 (91.0%) | 183 (94.8%) |
| 25 to 34 Years | 459 (98.1%) | 530 (88.6%) |
| 35 to 44 Years | 511 (100.0%) | 529 (98.3%) |
| 45 to 54 Years | 305 (100.0%) | 321 (92.5%) |
| 55 to 64 Years | 344 (94.0%) | 511 (95.3%) |
| 65 to 74 Years | 269 (99.3%) | 214 (100.0%) |
| 75 Years and over | 88 (85.4%) | 135 (78.9%) |
| Total | 2,988 (91.3%) | 3,404 (93.2%) |
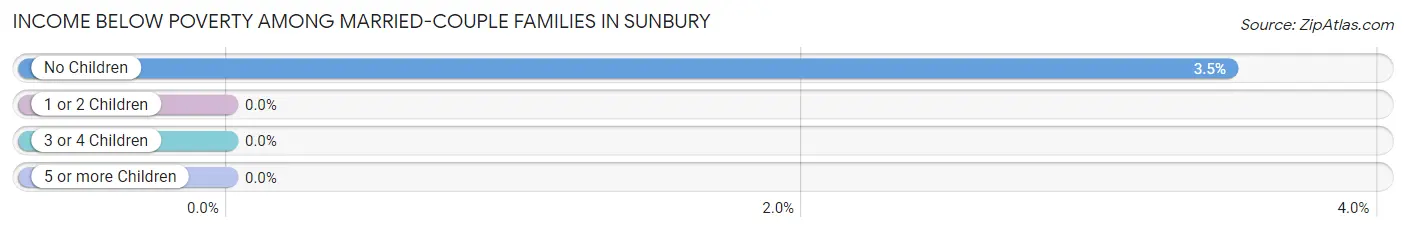
Income Below Poverty Among Married-Couple Families in Sunbury
The poverty statistics for married-couple families in Sunbury show that 1.8% or 23 of the total 1,317 families live below the poverty line. Families with no children have the highest poverty rate of 3.5%, comprising of 23 families. On the other hand, families with 1 or 2 children have the lowest poverty rate of 0.0%, which includes 0 families.
| Children | Above Poverty | Below Poverty |
| No Children | 637 (96.5%) | 23 (3.5%) |
| 1 or 2 Children | 471 (100.0%) | 0 (0.0%) |
| 3 or 4 Children | 181 (100.0%) | 0 (0.0%) |
| 5 or more Children | 5 (100.0%) | 0 (0.0%) |
| Total | 1,294 (98.3%) | 23 (1.8%) |
Income Below Poverty Among Single-Parent Households in Sunbury
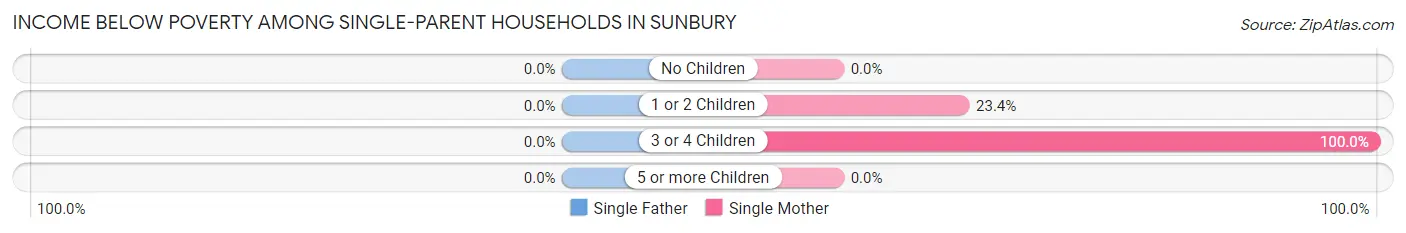
| Children | Single Father | Single Mother |
| No Children | 0 (0.0%) | 0 (0.0%) |
| 1 or 2 Children | 0 (0.0%) | 68 (23.4%) |
| 3 or 4 Children | 0 (0.0%) | 35 (100.0%) |
| 5 or more Children | 0 (0.0%) | 0 (0.0%) |
| Total | 0 (0.0%) | 103 (24.3%) |
Income Below Poverty Among Married-Couple vs Single-Parent Households in Sunbury
The poverty data for Sunbury shows that 23 of the married-couple family households (1.8%) and 103 of the single-parent households (19.5%) are living below the poverty level. Within the married-couple family households, those with no children have the highest poverty rate, with 23 households (3.5%) falling below the poverty line. Among the single-parent households, those with 3 or 4 children have the highest poverty rate, with 35 household (85.4%) living below poverty.
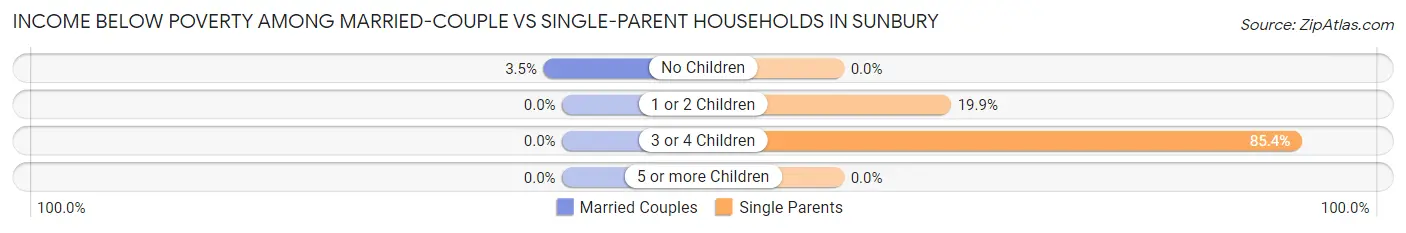
| Children | Married-Couple Families | Single-Parent Households |
| No Children | 23 (3.5%) | 0 (0.0%) |
| 1 or 2 Children | 0 (0.0%) | 68 (19.9%) |
| 3 or 4 Children | 0 (0.0%) | 35 (85.4%) |
| 5 or more Children | 0 (0.0%) | 0 (0.0%) |
| Total | 23 (1.8%) | 103 (19.5%) |
Race in Sunbury
The most populous races in Sunbury are White / Caucasian (6,257 | 90.2%), Hispanic or Latino (483 | 7.0%), and Two or more Races (261 | 3.8%).
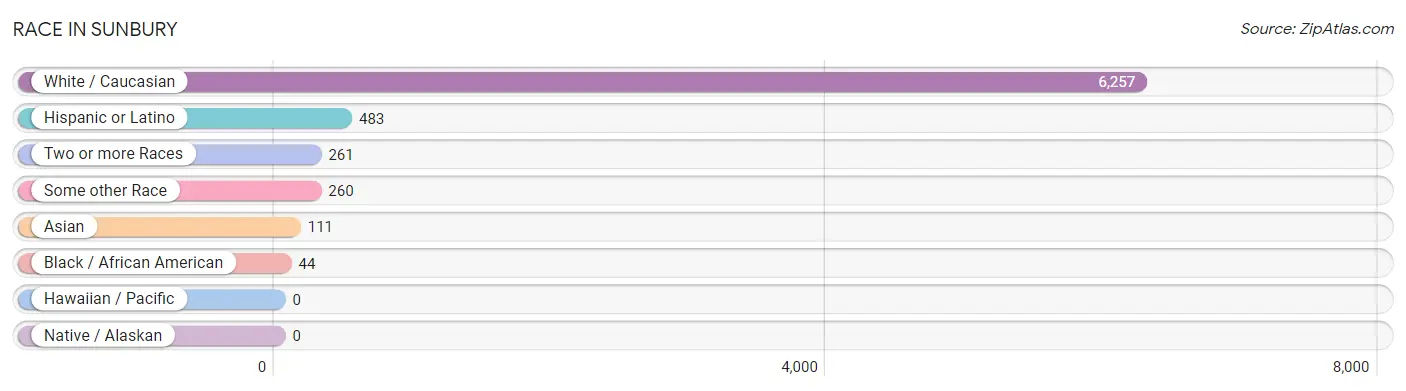
| Race | # Population | % Population |
| Asian | 111 | 1.6% |
| Black / African American | 44 | 0.6% |
| Hawaiian / Pacific | 0 | 0.0% |
| Hispanic or Latino | 483 | 7.0% |
| Native / Alaskan | 0 | 0.0% |
| White / Caucasian | 6,257 | 90.2% |
| Two or more Races | 261 | 3.8% |
| Some other Race | 260 | 3.7% |
| Total | 6,933 | 100.0% |
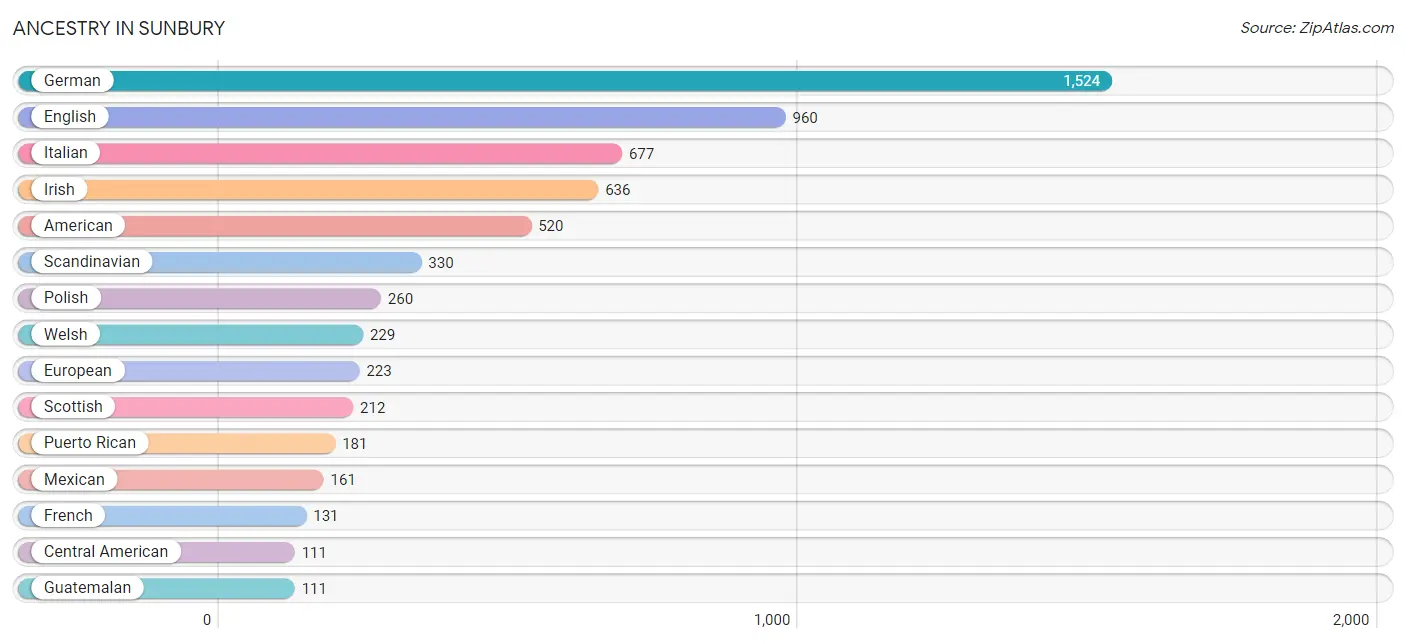
Ancestry in Sunbury
The most populous ancestries reported in Sunbury are German (1,524 | 22.0%), English (960 | 13.9%), Italian (677 | 9.8%), Irish (636 | 9.2%), and American (520 | 7.5%), together accounting for 62.3% of all Sunbury residents.
| Ancestry | # Population | % Population |
| American | 520 | 7.5% |
| Arab | 36 | 0.5% |
| Bhutanese | 44 | 0.6% |
| British | 14 | 0.2% |
| Bulgarian | 66 | 0.9% |
| Central American | 111 | 1.6% |
| Cherokee | 1 | 0.0% |
| Cuban | 30 | 0.4% |
| Czech | 32 | 0.5% |
| Dutch | 83 | 1.2% |
| Eastern European | 6 | 0.1% |
| English | 960 | 13.9% |
| European | 223 | 3.2% |
| French | 131 | 1.9% |
| French Canadian | 10 | 0.1% |
| German | 1,524 | 22.0% |
| Greek | 62 | 0.9% |
| Guatemalan | 111 | 1.6% |
| Hungarian | 64 | 0.9% |
| Indian (Asian) | 13 | 0.2% |
| Iranian | 30 | 0.4% |
| Irish | 636 | 9.2% |
| Italian | 677 | 9.8% |
| Lebanese | 8 | 0.1% |
| Lithuanian | 7 | 0.1% |
| Mexican | 161 | 2.3% |
| Northern European | 53 | 0.8% |
| Norwegian | 33 | 0.5% |
| Polish | 260 | 3.7% |
| Puerto Rican | 181 | 2.6% |
| Romanian | 69 | 1.0% |
| Russian | 16 | 0.2% |
| Scandinavian | 330 | 4.8% |
| Scotch-Irish | 39 | 0.6% |
| Scottish | 212 | 3.1% |
| Slovak | 12 | 0.2% |
| Swedish | 31 | 0.4% |
| Swiss | 11 | 0.2% |
| Thai | 89 | 1.3% |
| Welsh | 229 | 3.3% | View All 40 Rows |
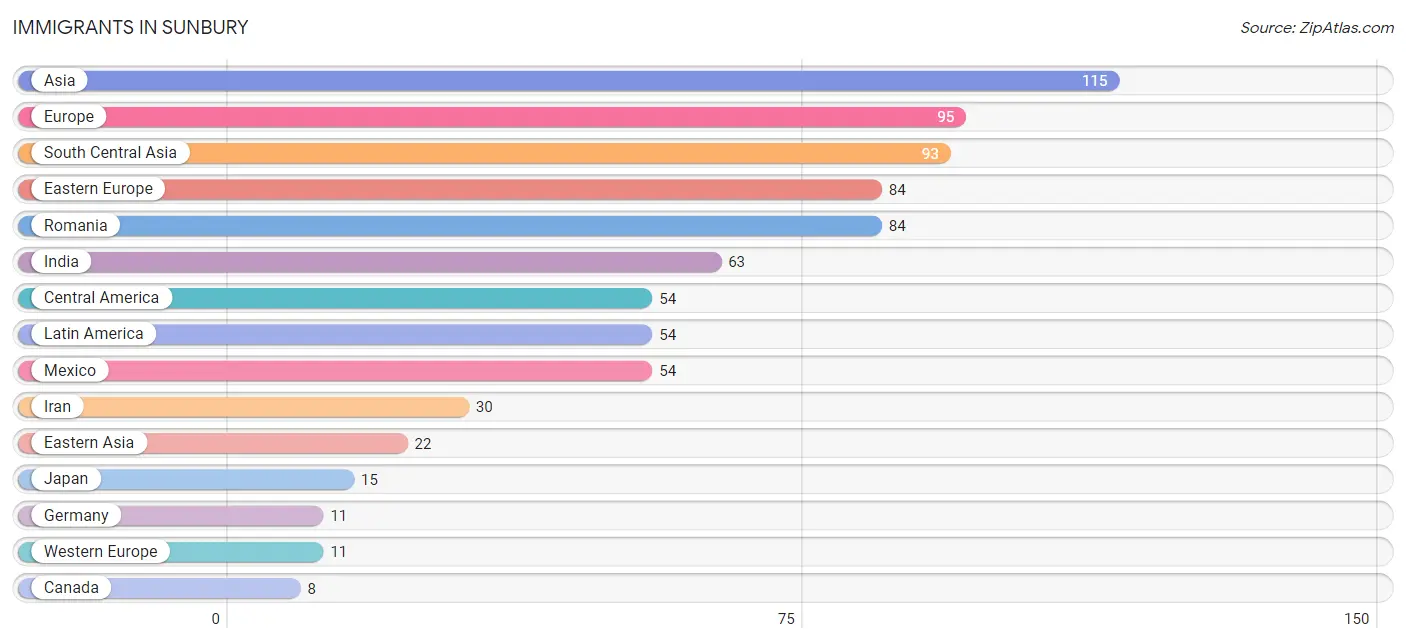
Immigrants in Sunbury
The most numerous immigrant groups reported in Sunbury came from Asia (115 | 1.7%), Europe (95 | 1.4%), South Central Asia (93 | 1.3%), Eastern Europe (84 | 1.2%), and Romania (84 | 1.2%), together accounting for 6.8% of all Sunbury residents.
| Immigration Origin | # Population | % Population |
| Asia | 115 | 1.7% |
| Canada | 8 | 0.1% |
| Central America | 54 | 0.8% |
| China | 7 | 0.1% |
| Eastern Asia | 22 | 0.3% |
| Eastern Europe | 84 | 1.2% |
| Europe | 95 | 1.4% |
| Germany | 11 | 0.2% |
| India | 63 | 0.9% |
| Iran | 30 | 0.4% |
| Japan | 15 | 0.2% |
| Latin America | 54 | 0.8% |
| Mexico | 54 | 0.8% |
| Romania | 84 | 1.2% |
| South Central Asia | 93 | 1.3% |
| Western Europe | 11 | 0.2% | View All 16 Rows |
Sex and Age in Sunbury
Sex and Age in Sunbury
The most populous age groups in Sunbury are 20 to 24 Years (385 | 11.8%) for men and 5 to 9 Years (375 | 10.2%) for women.
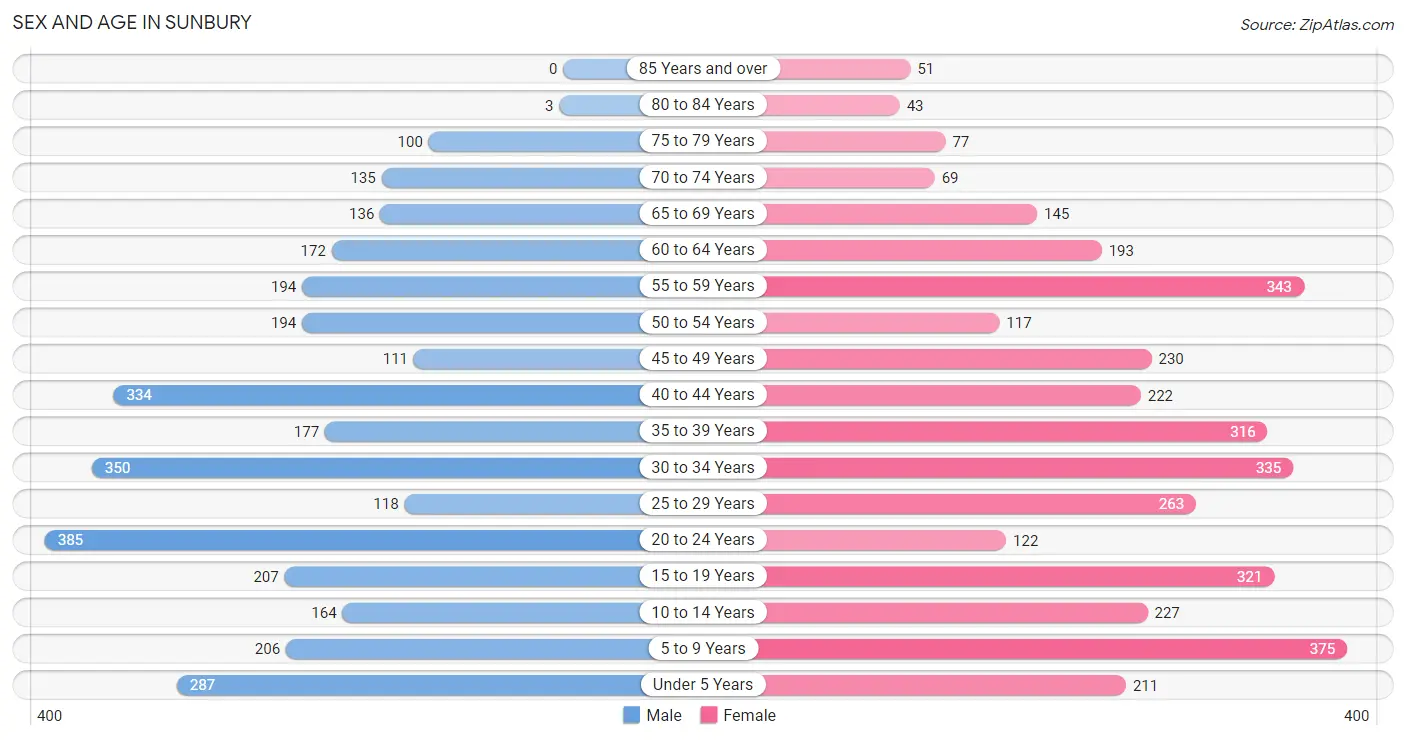
| Age Bracket | Male | Female |
| Under 5 Years | 287 (8.8%) | 211 (5.8%) |
| 5 to 9 Years | 206 (6.3%) | 375 (10.2%) |
| 10 to 14 Years | 164 (5.0%) | 227 (6.2%) |
| 15 to 19 Years | 207 (6.3%) | 321 (8.8%) |
| 20 to 24 Years | 385 (11.8%) | 122 (3.3%) |
| 25 to 29 Years | 118 (3.6%) | 263 (7.2%) |
| 30 to 34 Years | 350 (10.7%) | 335 (9.1%) |
| 35 to 39 Years | 177 (5.4%) | 316 (8.6%) |
| 40 to 44 Years | 334 (10.2%) | 222 (6.1%) |
| 45 to 49 Years | 111 (3.4%) | 230 (6.3%) |
| 50 to 54 Years | 194 (5.9%) | 117 (3.2%) |
| 55 to 59 Years | 194 (5.9%) | 343 (9.4%) |
| 60 to 64 Years | 172 (5.3%) | 193 (5.3%) |
| 65 to 69 Years | 136 (4.2%) | 145 (4.0%) |
| 70 to 74 Years | 135 (4.1%) | 69 (1.9%) |
| 75 to 79 Years | 100 (3.1%) | 77 (2.1%) |
| 80 to 84 Years | 3 (0.1%) | 43 (1.2%) |
| 85 Years and over | 0 (0.0%) | 51 (1.4%) |
| Total | 3,273 (100.0%) | 3,660 (100.0%) |
Families and Households in Sunbury
Median Family Size in Sunbury
The median family size in Sunbury is 3.12 persons per family, with married-couple families (1,317 | 71.4%) accounting for the largest median family size of 3.32 persons per family. On the other hand, single male/father families (105 | 5.7%) represent the smallest median family size with 2.35 persons per family.
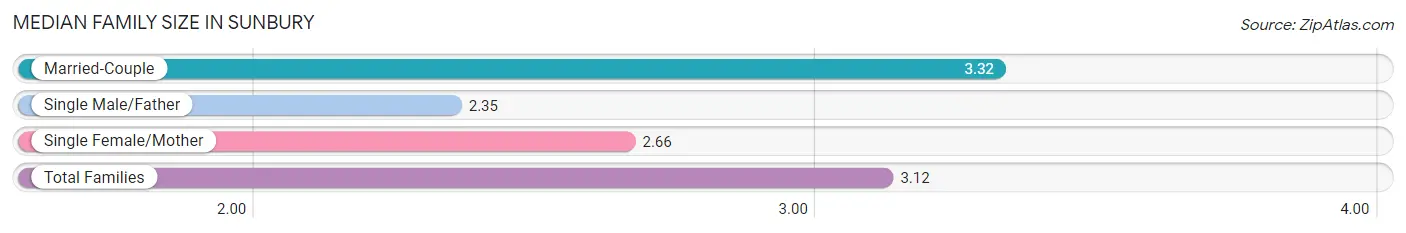
| Family Type | # Families | Family Size |
| Married-Couple | 1,317 (71.4%) | 3.32 |
| Single Male/Father | 105 (5.7%) | 2.35 |
| Single Female/Mother | 423 (22.9%) | 2.66 |
| Total Families | 1,845 (100.0%) | 3.12 |
Median Household Size in Sunbury
The median household size in Sunbury is 2.67 persons per household, with married-couple households (1,317 | 50.8%) accounting for the largest median household size of 3.34 persons per household. non-family households (749 | 28.9%) represent the smallest median household size with 1.22 persons per household.
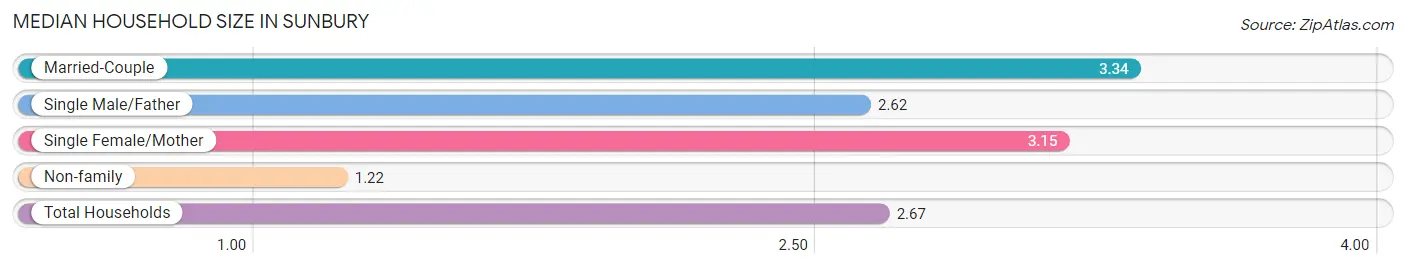
| Household Type | # Households | Household Size |
| Married-Couple | 1,317 (50.8%) | 3.34 |
| Single Male/Father | 105 (4.1%) | 2.62 |
| Single Female/Mother | 423 (16.3%) | 3.15 |
| Non-family | 749 (28.9%) | 1.22 |
| Total Households | 2,594 (100.0%) | 2.67 |
Household Size by Marriage Status in Sunbury
Out of a total of 2,594 households in Sunbury, 1,845 (71.1%) are family households, while 749 (28.9%) are nonfamily households. The most numerous type of family households are 2-person households, comprising 723, and the most common type of nonfamily households are 1-person households, comprising 637.
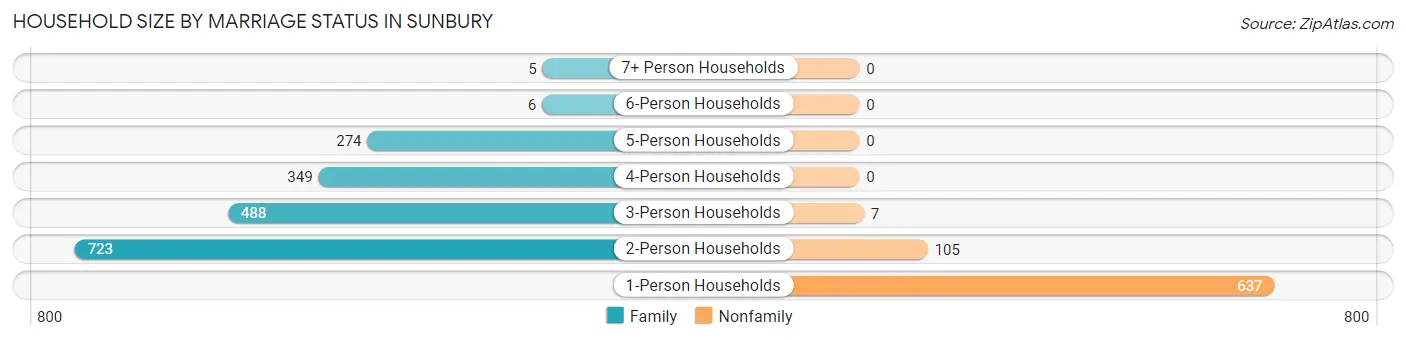
| Household Size | Family Households | Nonfamily Households |
| 1-Person Households | - | 637 (24.6%) |
| 2-Person Households | 723 (27.9%) | 105 (4.1%) |
| 3-Person Households | 488 (18.8%) | 7 (0.3%) |
| 4-Person Households | 349 (13.5%) | 0 (0.0%) |
| 5-Person Households | 274 (10.6%) | 0 (0.0%) |
| 6-Person Households | 6 (0.2%) | 0 (0.0%) |
| 7+ Person Households | 5 (0.2%) | 0 (0.0%) |
| Total | 1,845 (71.1%) | 749 (28.9%) |
Female Fertility in Sunbury
Fertility by Age in Sunbury
Average fertility rate in Sunbury is 82.0 births per 1,000 women. Women in the age bracket of 20 to 34 years have the highest fertility rate with 103.0 births per 1,000 women. Women in the age bracket of 35 to 50 years acount for 50.7% of all women with births.
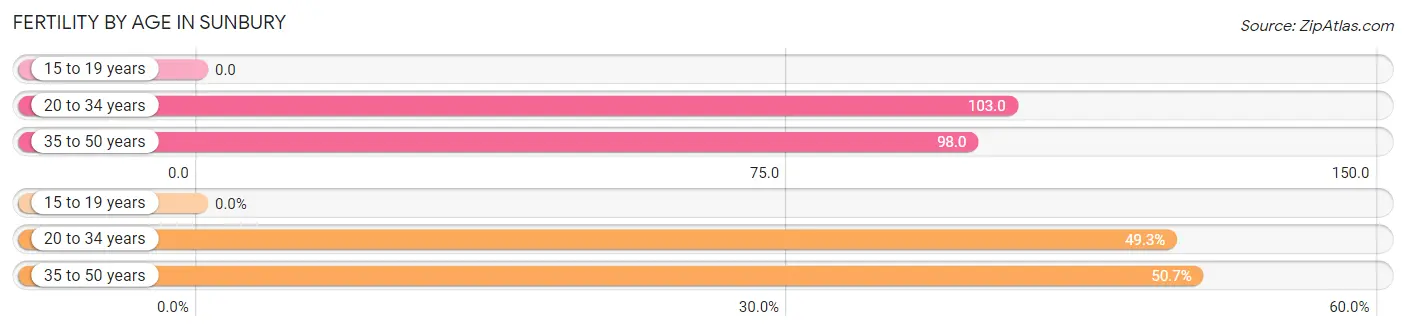
| Age Bracket | Women with Births | Births / 1,000 Women |
| 15 to 19 years | 0 (0.0%) | 0.0 |
| 20 to 34 years | 74 (49.3%) | 103.0 |
| 35 to 50 years | 76 (50.7%) | 98.0 |
| Total | 150 (100.0%) | 82.0 |
Fertility by Age by Marriage Status in Sunbury
93.3% of women with births (150) in Sunbury are married. The highest percentage of unmarried women with births falls into 20 to 34 years age bracket with 13.5% of them unmarried at the time of birth, while the lowest percentage of unmarried women with births belong to 35 to 50 years age bracket with 0.0% of them unmarried.
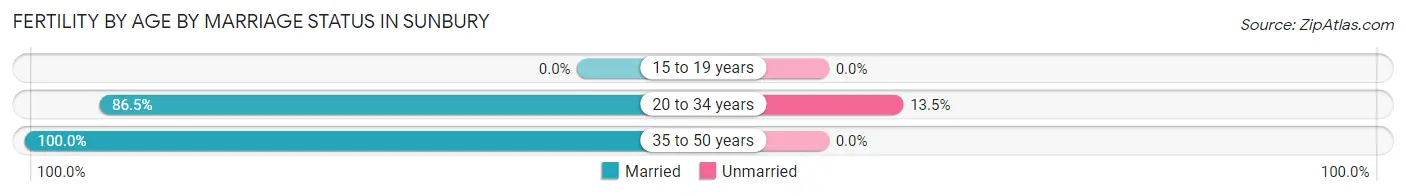
| Age Bracket | Married | Unmarried |
| 15 to 19 years | 0 (0.0%) | 0 (0.0%) |
| 20 to 34 years | 64 (86.5%) | 10 (13.5%) |
| 35 to 50 years | 76 (100.0%) | 0 (0.0%) |
| Total | 140 (93.3%) | 10 (6.7%) |
Fertility by Education in Sunbury
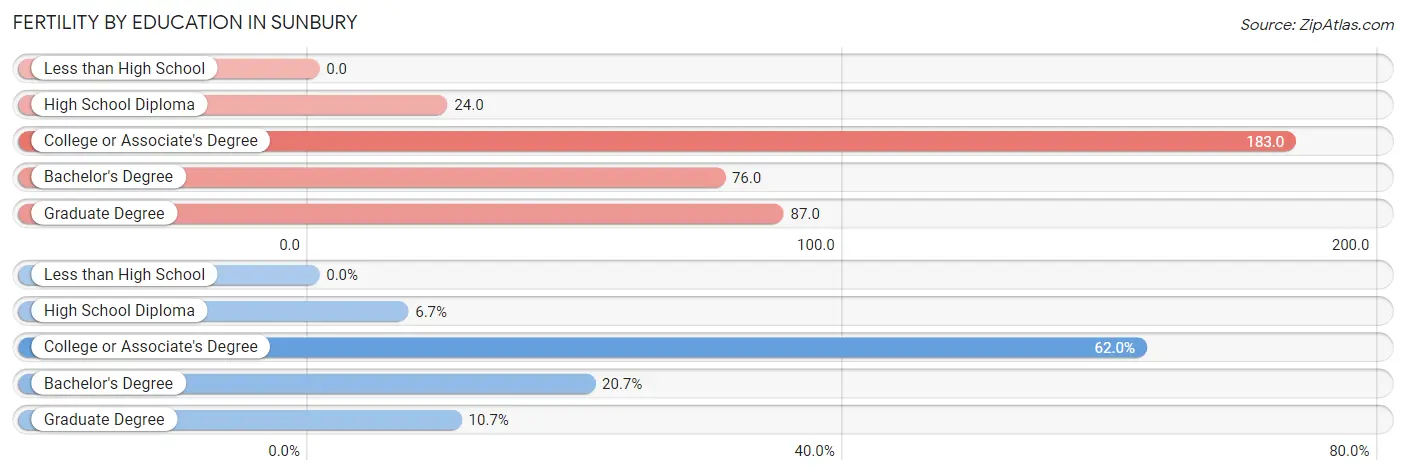
| Educational Attainment | Women with Births | Births / 1,000 Women |
| Less than High School | 0 (0.0%) | 0.0 |
| High School Diploma | 10 (6.7%) | 24.0 |
| College or Associate's Degree | 93 (62.0%) | 183.0 |
| Bachelor's Degree | 31 (20.7%) | 76.0 |
| Graduate Degree | 16 (10.7%) | 87.0 |
| Total | 150 (100.0%) | 82.0 |
Fertility by Education by Marriage Status in Sunbury
6.7% of women with births in Sunbury are unmarried. Women with the educational attainment of college or associate's degree are most likely to be married with 100.0% of them married at childbirth, while women with the educational attainment of high school diploma are least likely to be married with 100.0% of them unmarried at childbirth.
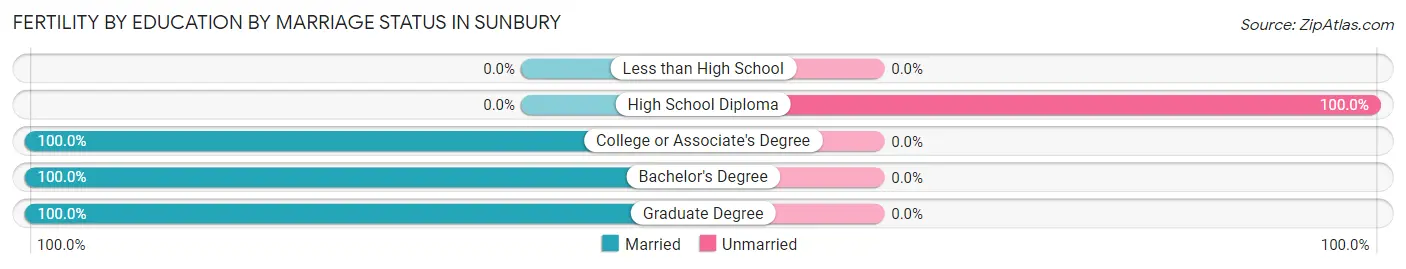
| Educational Attainment | Married | Unmarried |
| Less than High School | 0 (0.0%) | 0 (0.0%) |
| High School Diploma | 0 (0.0%) | 10 (100.0%) |
| College or Associate's Degree | 93 (100.0%) | 0 (0.0%) |
| Bachelor's Degree | 31 (100.0%) | 0 (0.0%) |
| Graduate Degree | 16 (100.0%) | 0 (0.0%) |
| Total | 140 (93.3%) | 10 (6.7%) |
Employment Characteristics in Sunbury
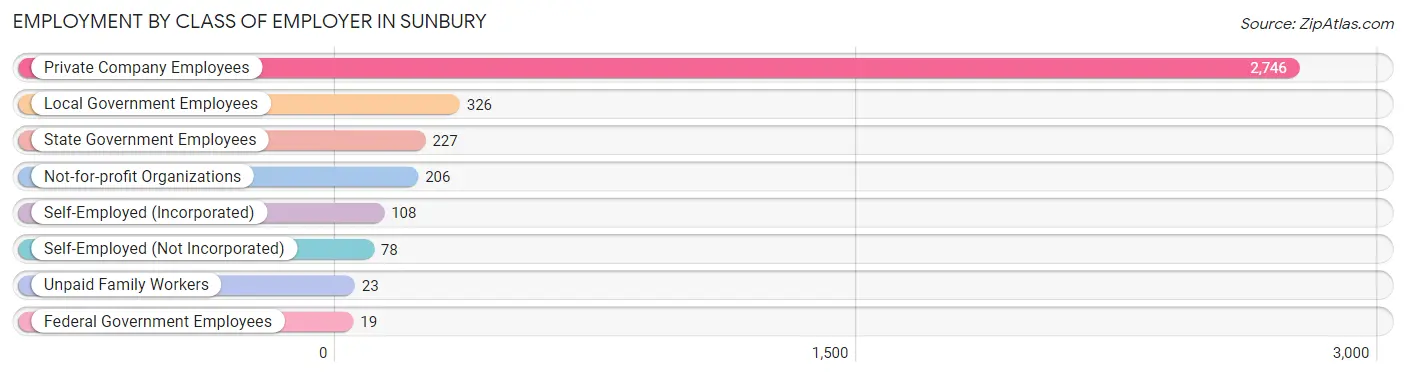
Employment by Class of Employer in Sunbury
Among the 3,733 employed individuals in Sunbury, private company employees (2,746 | 73.6%), local government employees (326 | 8.7%), and state government employees (227 | 6.1%) make up the most common classes of employment.
| Employer Class | # Employees | % Employees |
| Private Company Employees | 2,746 | 73.6% |
| Self-Employed (Incorporated) | 108 | 2.9% |
| Self-Employed (Not Incorporated) | 78 | 2.1% |
| Not-for-profit Organizations | 206 | 5.5% |
| Local Government Employees | 326 | 8.7% |
| State Government Employees | 227 | 6.1% |
| Federal Government Employees | 19 | 0.5% |
| Unpaid Family Workers | 23 | 0.6% |
| Total | 3,733 | 100.0% |
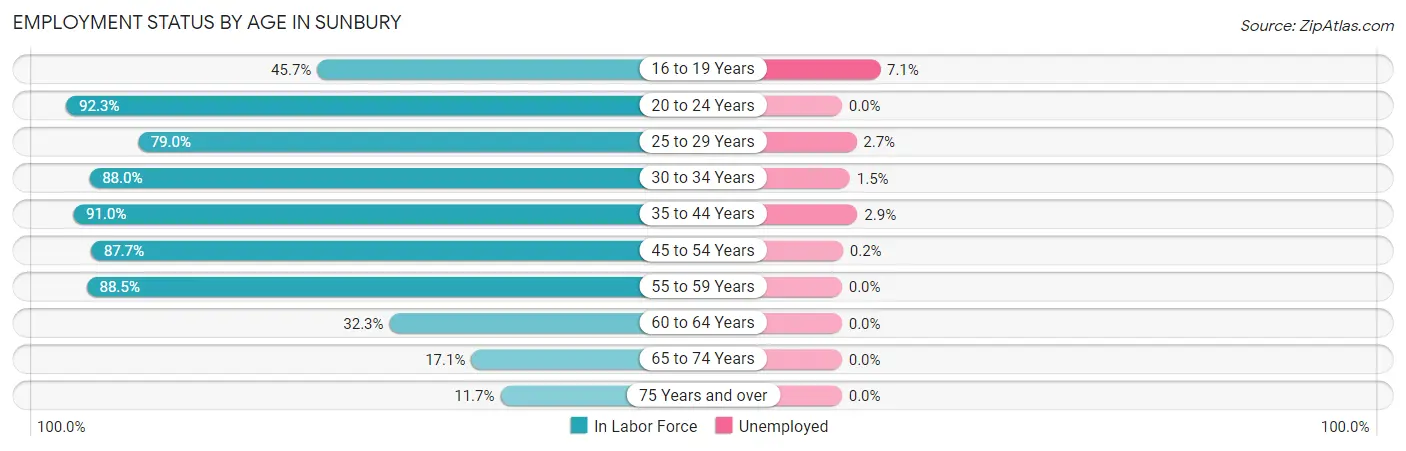
Employment Status by Age in Sunbury
According to the labor force statistics for Sunbury, out of the total population over 16 years of age (5,368), 70.9% or 3,806 individuals are in the labor force, with 1.6% or 61 of them unemployed. The age group with the highest labor force participation rate is 20 to 24 years, with 92.3% or 468 individuals in the labor force. Within the labor force, the 16 to 19 years age range has the highest percentage of unemployed individuals, with 7.1% or 14 of them being unemployed.
| Age Bracket | In Labor Force | Unemployed |
| 16 to 19 Years | 198 (45.7%) | 14 (7.1%) |
| 20 to 24 Years | 468 (92.3%) | 0 (0.0%) |
| 25 to 29 Years | 301 (79.0%) | 8 (2.7%) |
| 30 to 34 Years | 603 (88.0%) | 9 (1.5%) |
| 35 to 44 Years | 955 (91.0%) | 28 (2.9%) |
| 45 to 54 Years | 572 (87.7%) | 1 (0.2%) |
| 55 to 59 Years | 475 (88.5%) | 0 (0.0%) |
| 60 to 64 Years | 118 (32.3%) | 0 (0.0%) |
| 65 to 74 Years | 83 (17.1%) | 0 (0.0%) |
| 75 Years and over | 32 (11.7%) | 0 (0.0%) |
| Total | 3,806 (70.9%) | 61 (1.6%) |
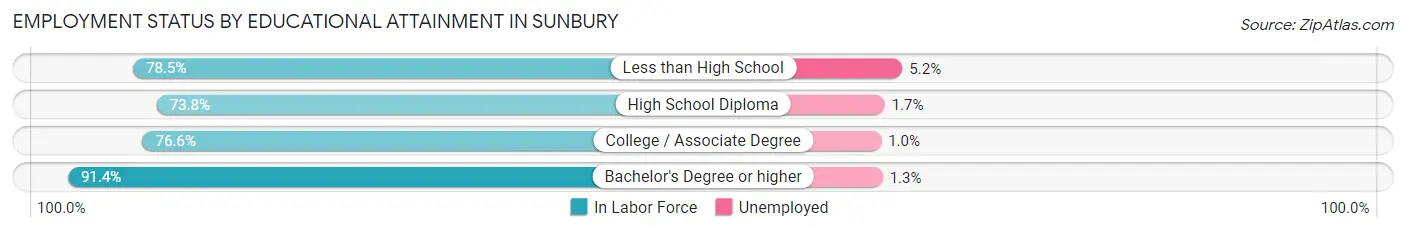
Employment Status by Educational Attainment in Sunbury
According to labor force statistics for Sunbury, 82.4% of individuals (3,023) out of the total population between 25 and 64 years of age (3,669) are in the labor force, with 1.5% or 45 of them being unemployed. The group with the highest labor force participation rate are those with the educational attainment of bachelor's degree or higher, with 91.4% or 1,433 individuals in the labor force. Within the labor force, individuals with less than high school education have the highest percentage of unemployment, with 5.2% or 8 of them being unemployed.
| Educational Attainment | In Labor Force | Unemployed |
| Less than High School | 153 (78.5%) | 10 (5.2%) |
| High School Diploma | 574 (73.8%) | 13 (1.7%) |
| College / Associate Degree | 864 (76.6%) | 11 (1.0%) |
| Bachelor's Degree or higher | 1,433 (91.4%) | 20 (1.3%) |
| Total | 3,023 (82.4%) | 55 (1.5%) |
Employment Occupations by Sex in Sunbury
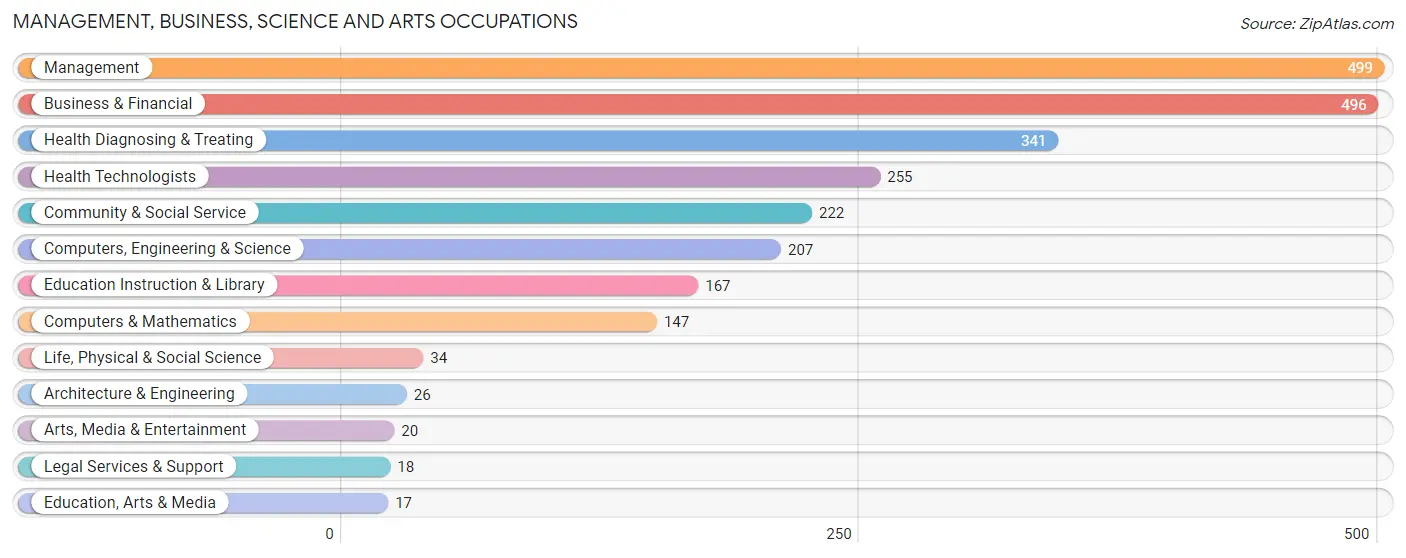
Management, Business, Science and Arts Occupations
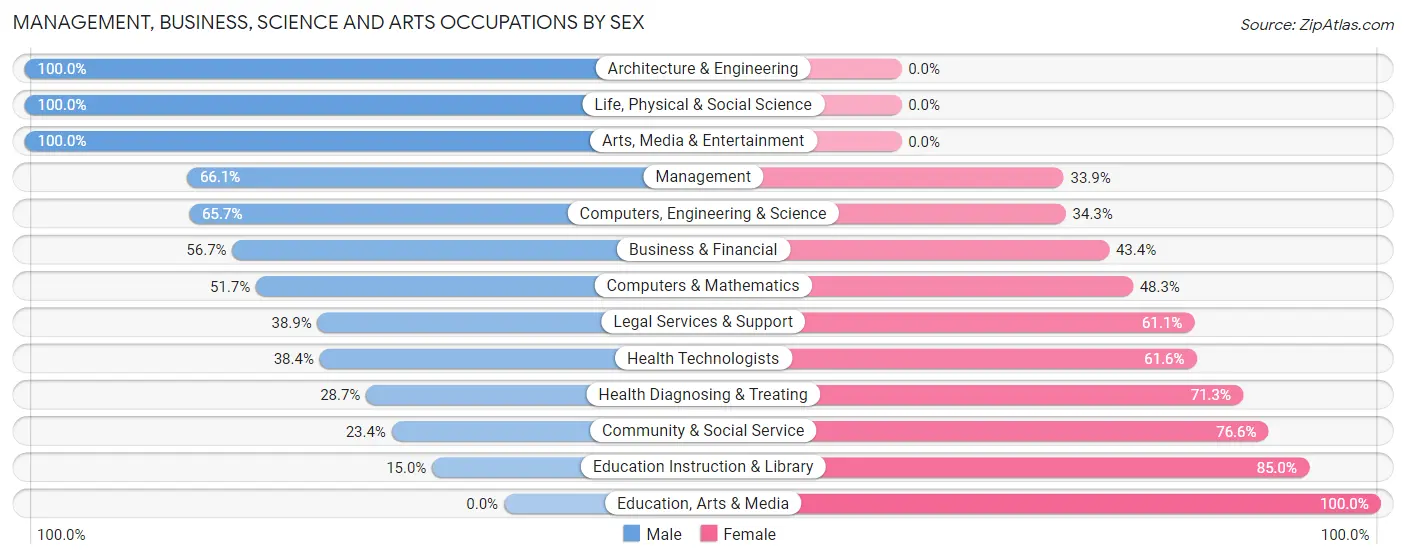
The most common Management, Business, Science and Arts occupations in Sunbury are Management (499 | 13.3%), Business & Financial (496 | 13.2%), Health Diagnosing & Treating (341 | 9.1%), Health Technologists (255 | 6.8%), and Community & Social Service (222 | 5.9%).
Management, Business, Science and Arts Occupations by Sex
Within the Management, Business, Science and Arts occupations in Sunbury, the most male-oriented occupations are Architecture & Engineering (100.0%), Life, Physical & Social Science (100.0%), and Arts, Media & Entertainment (100.0%), while the most female-oriented occupations are Education, Arts & Media (100.0%), Education Instruction & Library (85.0%), and Community & Social Service (76.6%).
| Occupation | Male | Female |
| Management | 330 (66.1%) | 169 (33.9%) |
| Business & Financial | 281 (56.7%) | 215 (43.3%) |
| Computers, Engineering & Science | 136 (65.7%) | 71 (34.3%) |
| Computers & Mathematics | 76 (51.7%) | 71 (48.3%) |
| Architecture & Engineering | 26 (100.0%) | 0 (0.0%) |
| Life, Physical & Social Science | 34 (100.0%) | 0 (0.0%) |
| Community & Social Service | 52 (23.4%) | 170 (76.6%) |
| Education, Arts & Media | 0 (0.0%) | 17 (100.0%) |
| Legal Services & Support | 7 (38.9%) | 11 (61.1%) |
| Education Instruction & Library | 25 (15.0%) | 142 (85.0%) |
| Arts, Media & Entertainment | 20 (100.0%) | 0 (0.0%) |
| Health Diagnosing & Treating | 98 (28.7%) | 243 (71.3%) |
| Health Technologists | 98 (38.4%) | 157 (61.6%) |
| Total (Category) | 897 (50.8%) | 868 (49.2%) |
| Total (Overall) | 2,012 (53.7%) | 1,733 (46.3%) |
Services Occupations
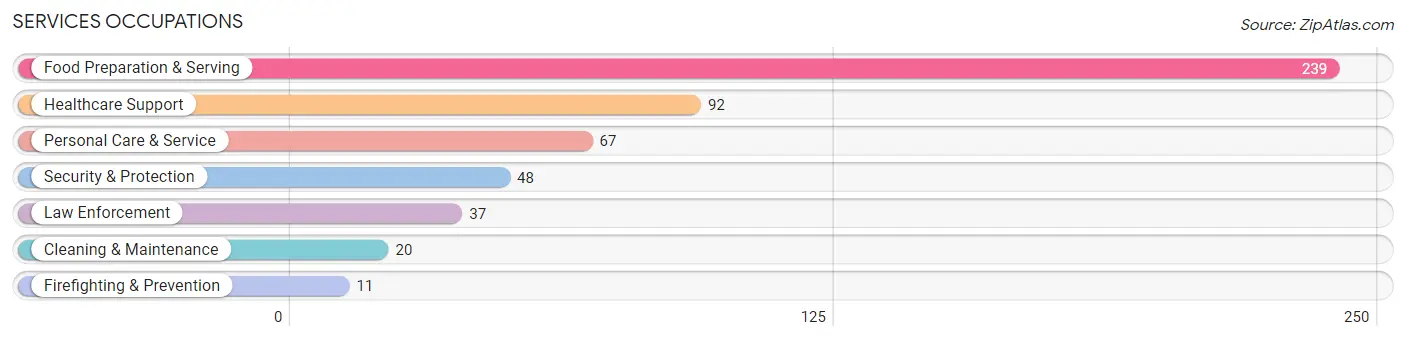
The most common Services occupations in Sunbury are Food Preparation & Serving (239 | 6.4%), Healthcare Support (92 | 2.5%), Personal Care & Service (67 | 1.8%), Security & Protection (48 | 1.3%), and Law Enforcement (37 | 1.0%).
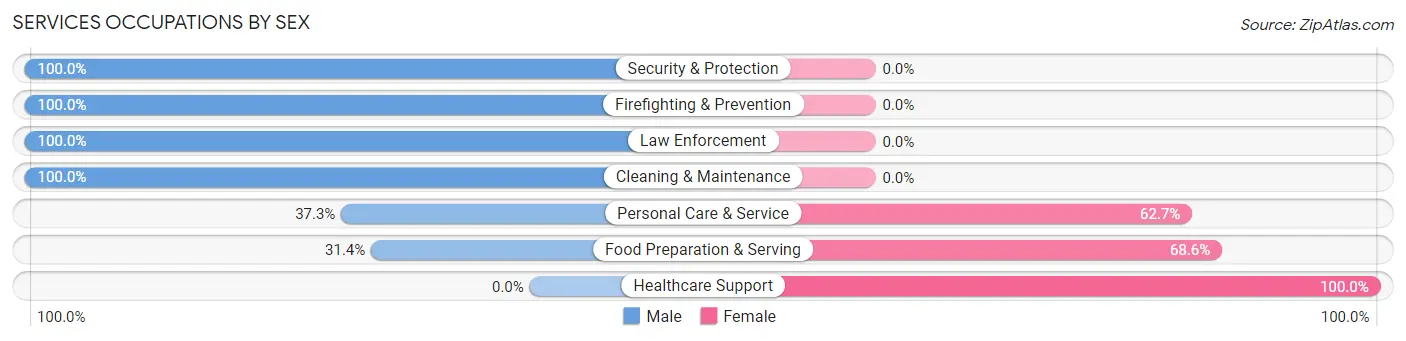
Services Occupations by Sex
Within the Services occupations in Sunbury, the most male-oriented occupations are Security & Protection (100.0%), Firefighting & Prevention (100.0%), and Law Enforcement (100.0%), while the most female-oriented occupations are Healthcare Support (100.0%), Food Preparation & Serving (68.6%), and Personal Care & Service (62.7%).
| Occupation | Male | Female |
| Healthcare Support | 0 (0.0%) | 92 (100.0%) |
| Security & Protection | 48 (100.0%) | 0 (0.0%) |
| Firefighting & Prevention | 11 (100.0%) | 0 (0.0%) |
| Law Enforcement | 37 (100.0%) | 0 (0.0%) |
| Food Preparation & Serving | 75 (31.4%) | 164 (68.6%) |
| Cleaning & Maintenance | 20 (100.0%) | 0 (0.0%) |
| Personal Care & Service | 25 (37.3%) | 42 (62.7%) |
| Total (Category) | 168 (36.0%) | 298 (63.9%) |
| Total (Overall) | 2,012 (53.7%) | 1,733 (46.3%) |
Sales and Office Occupations
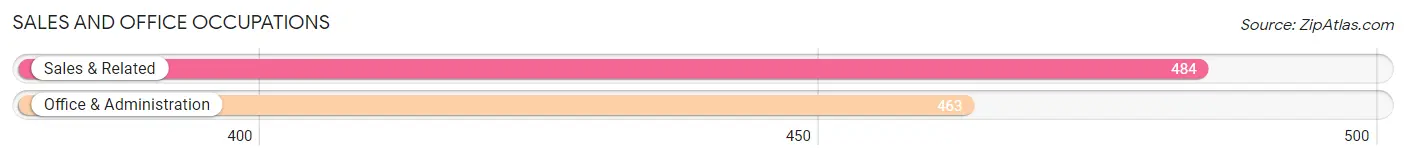
The most common Sales and Office occupations in Sunbury are Sales & Related (484 | 12.9%), and Office & Administration (463 | 12.4%).
Sales and Office Occupations by Sex
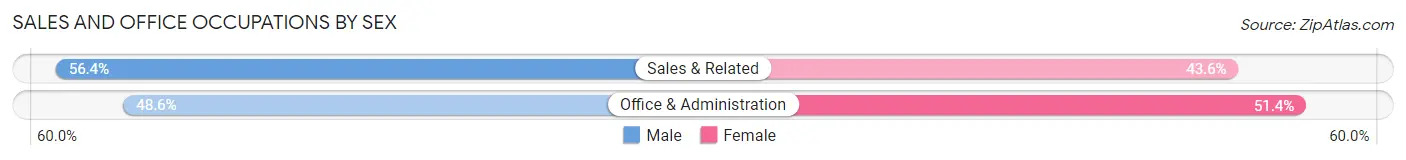
| Occupation | Male | Female |
| Sales & Related | 273 (56.4%) | 211 (43.6%) |
| Office & Administration | 225 (48.6%) | 238 (51.4%) |
| Total (Category) | 498 (52.6%) | 449 (47.4%) |
| Total (Overall) | 2,012 (53.7%) | 1,733 (46.3%) |
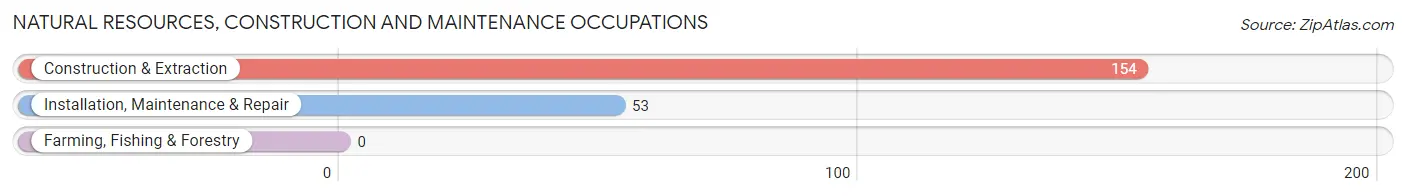
Natural Resources, Construction and Maintenance Occupations
The most common Natural Resources, Construction and Maintenance occupations in Sunbury are Construction & Extraction (154 | 4.1%), and Installation, Maintenance & Repair (53 | 1.4%).
Natural Resources, Construction and Maintenance Occupations by Sex
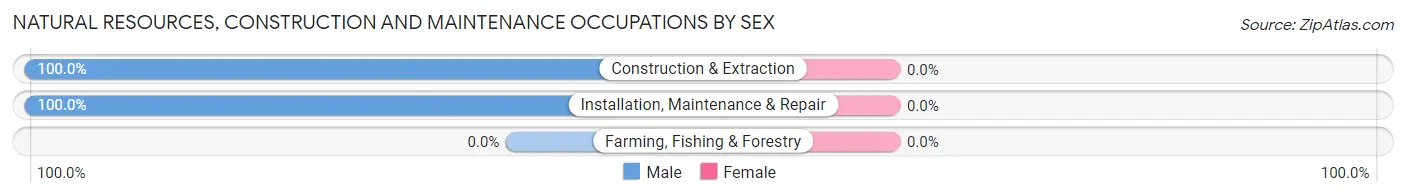
| Occupation | Male | Female |
| Farming, Fishing & Forestry | 0 (0.0%) | 0 (0.0%) |
| Construction & Extraction | 154 (100.0%) | 0 (0.0%) |
| Installation, Maintenance & Repair | 53 (100.0%) | 0 (0.0%) |
| Total (Category) | 207 (100.0%) | 0 (0.0%) |
| Total (Overall) | 2,012 (53.7%) | 1,733 (46.3%) |
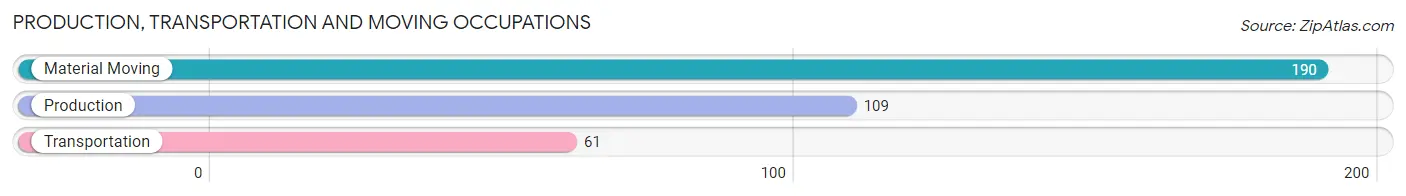
Production, Transportation and Moving Occupations
The most common Production, Transportation and Moving occupations in Sunbury are Material Moving (190 | 5.1%), Production (109 | 2.9%), and Transportation (61 | 1.6%).
Production, Transportation and Moving Occupations by Sex
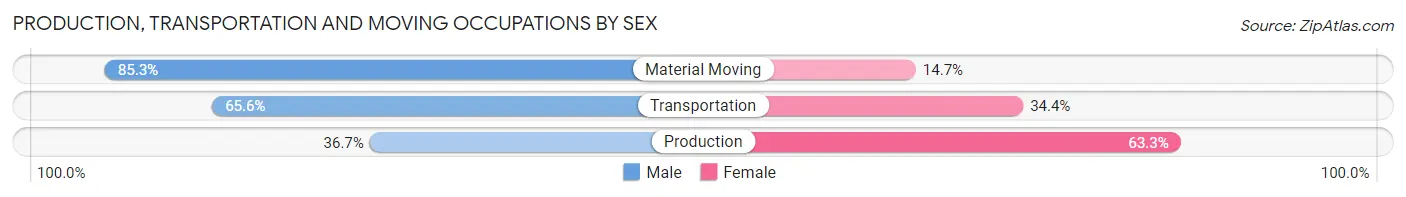
| Occupation | Male | Female |
| Production | 40 (36.7%) | 69 (63.3%) |
| Transportation | 40 (65.6%) | 21 (34.4%) |
| Material Moving | 162 (85.3%) | 28 (14.7%) |
| Total (Category) | 242 (67.2%) | 118 (32.8%) |
| Total (Overall) | 2,012 (53.7%) | 1,733 (46.3%) |
Employment Industries by Sex in Sunbury
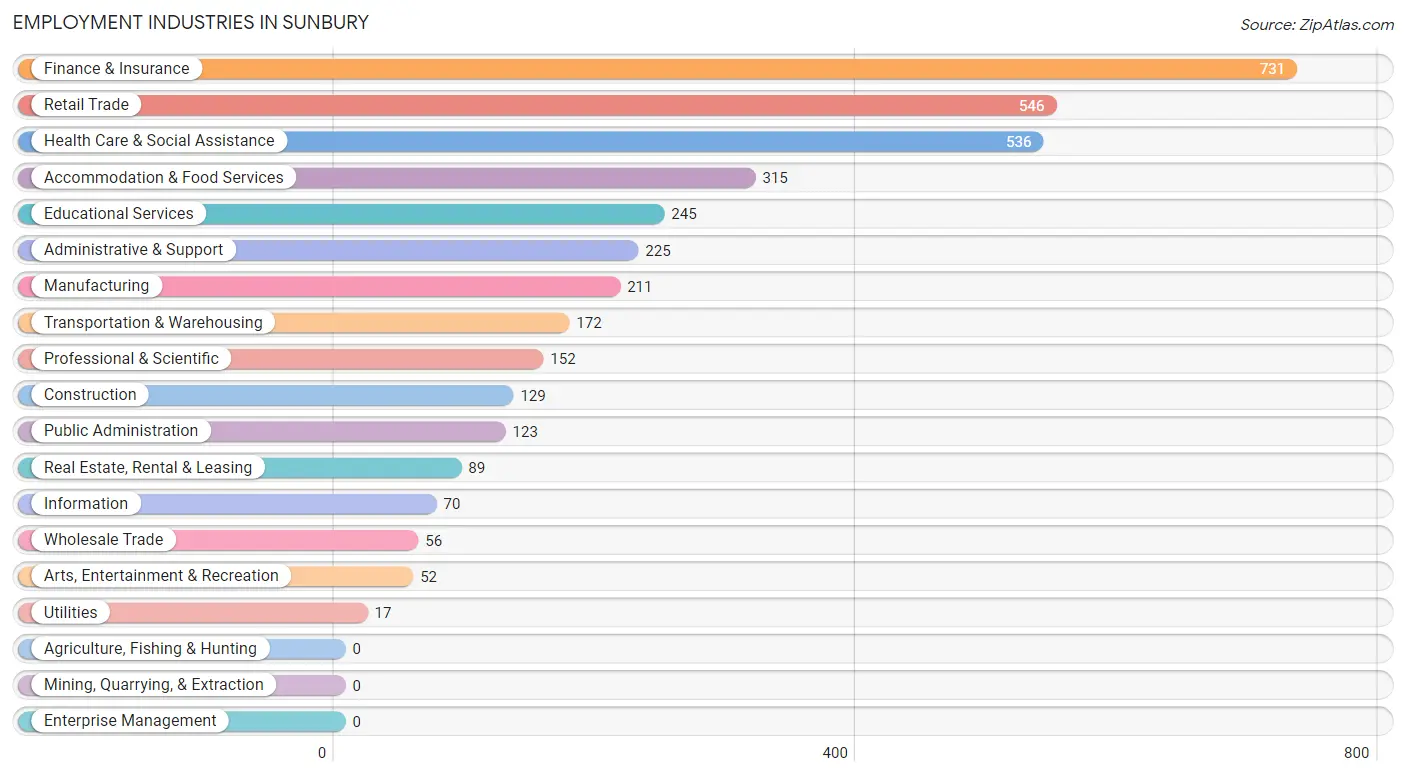
Employment Industries in Sunbury
The major employment industries in Sunbury include Finance & Insurance (731 | 19.5%), Retail Trade (546 | 14.6%), Health Care & Social Assistance (536 | 14.3%), Accommodation & Food Services (315 | 8.4%), and Educational Services (245 | 6.5%).
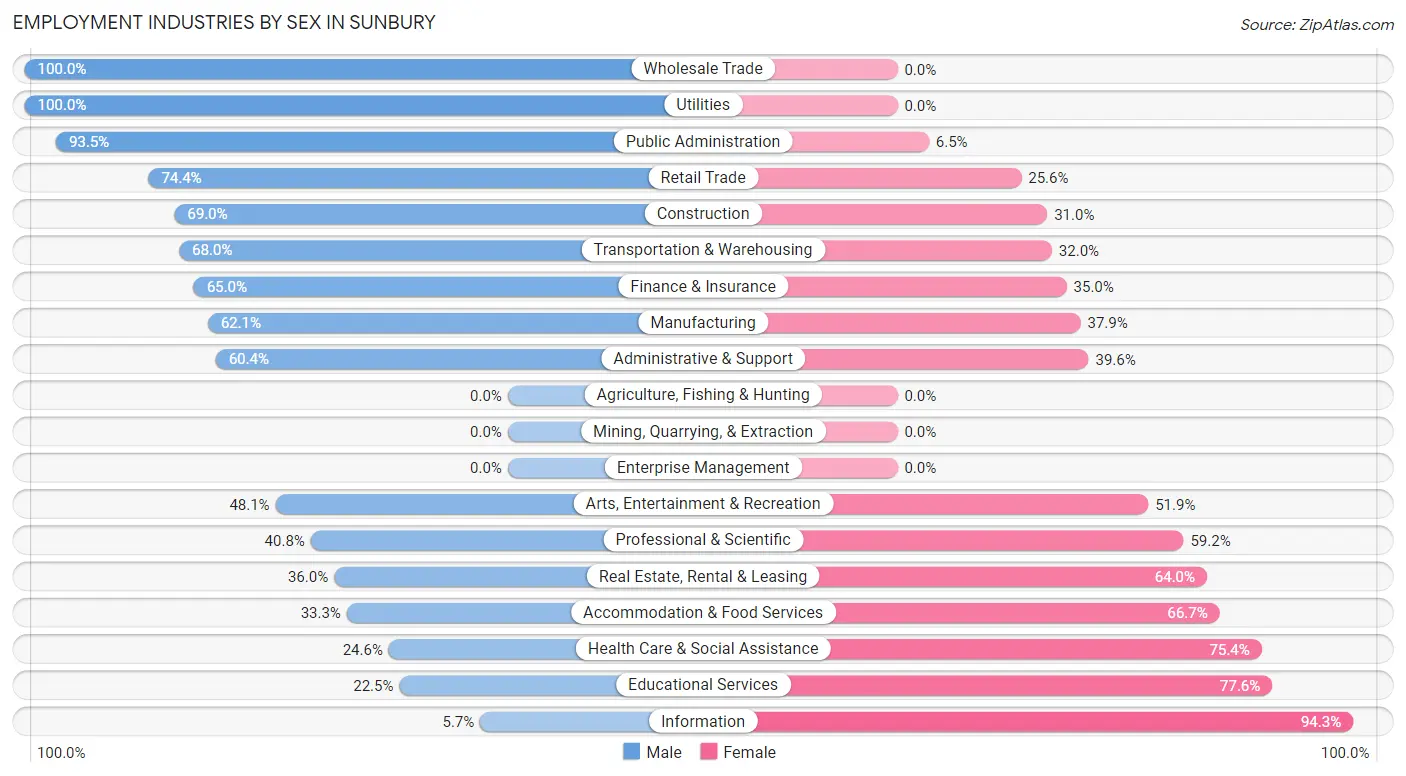
Employment Industries by Sex in Sunbury
The Sunbury industries that see more men than women are Wholesale Trade (100.0%), Utilities (100.0%), and Public Administration (93.5%), whereas the industries that tend to have a higher number of women are Information (94.3%), Educational Services (77.5%), and Health Care & Social Assistance (75.4%).
| Industry | Male | Female |
| Agriculture, Fishing & Hunting | 0 (0.0%) | 0 (0.0%) |
| Mining, Quarrying, & Extraction | 0 (0.0%) | 0 (0.0%) |
| Construction | 89 (69.0%) | 40 (31.0%) |
| Manufacturing | 131 (62.1%) | 80 (37.9%) |
| Wholesale Trade | 56 (100.0%) | 0 (0.0%) |
| Retail Trade | 406 (74.4%) | 140 (25.6%) |
| Transportation & Warehousing | 117 (68.0%) | 55 (32.0%) |
| Utilities | 17 (100.0%) | 0 (0.0%) |
| Information | 4 (5.7%) | 66 (94.3%) |
| Finance & Insurance | 475 (65.0%) | 256 (35.0%) |
| Real Estate, Rental & Leasing | 32 (36.0%) | 57 (64.0%) |
| Professional & Scientific | 62 (40.8%) | 90 (59.2%) |
| Enterprise Management | 0 (0.0%) | 0 (0.0%) |
| Administrative & Support | 136 (60.4%) | 89 (39.6%) |
| Educational Services | 55 (22.5%) | 190 (77.5%) |
| Health Care & Social Assistance | 132 (24.6%) | 404 (75.4%) |
| Arts, Entertainment & Recreation | 25 (48.1%) | 27 (51.9%) |
| Accommodation & Food Services | 105 (33.3%) | 210 (66.7%) |
| Public Administration | 115 (93.5%) | 8 (6.5%) |
| Total | 2,012 (53.7%) | 1,733 (46.3%) |
Education in Sunbury
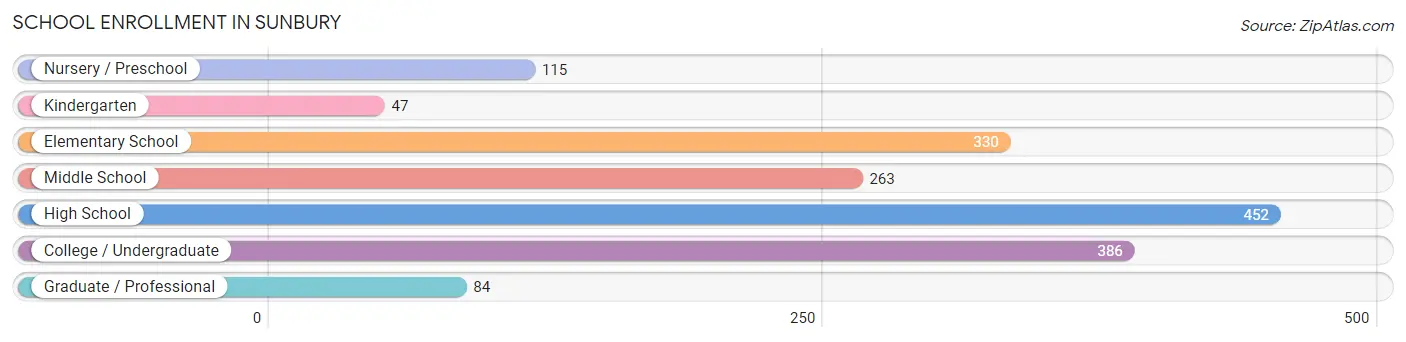
School Enrollment in Sunbury
The most common levels of schooling among the 1,677 students in Sunbury are high school (452 | 27.0%), college / undergraduate (386 | 23.0%), and elementary school (330 | 19.7%).
| School Level | # Students | % Students |
| Nursery / Preschool | 115 | 6.9% |
| Kindergarten | 47 | 2.8% |
| Elementary School | 330 | 19.7% |
| Middle School | 263 | 15.7% |
| High School | 452 | 27.0% |
| College / Undergraduate | 386 | 23.0% |
| Graduate / Professional | 84 | 5.0% |
| Total | 1,677 | 100.0% |
School Enrollment by Age by Funding Source in Sunbury
Out of a total of 1,677 students who are enrolled in schools in Sunbury, 168 (10.0%) attend a private institution, while the remaining 1,509 (90.0%) are enrolled in public schools. The age group of 35 years and over has the highest likelihood of being enrolled in private schools, with 55 (70.5% in the age bracket) enrolled. Conversely, the age group of 18 to 19 year olds has the lowest likelihood of being enrolled in a private school, with 80 (100.0% in the age bracket) attending a public institution.
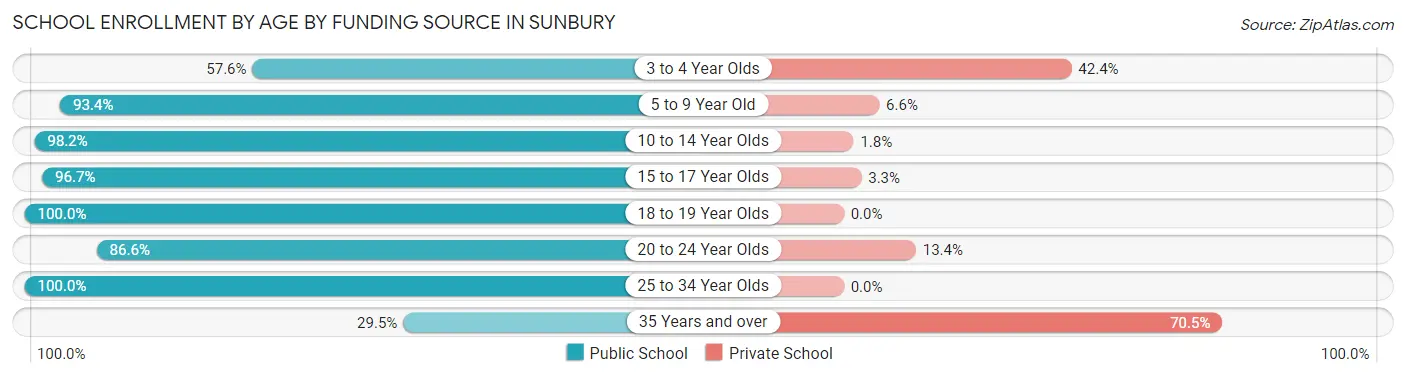
| Age Bracket | Public School | Private School |
| 3 to 4 Year Olds | 57 (57.6%) | 42 (42.4%) |
| 5 to 9 Year Old | 325 (93.4%) | 23 (6.6%) |
| 10 to 14 Year Olds | 378 (98.2%) | 7 (1.8%) |
| 15 to 17 Year Olds | 354 (96.7%) | 12 (3.3%) |
| 18 to 19 Year Olds | 80 (100.0%) | 0 (0.0%) |
| 20 to 24 Year Olds | 187 (86.6%) | 29 (13.4%) |
| 25 to 34 Year Olds | 105 (100.0%) | 0 (0.0%) |
| 35 Years and over | 23 (29.5%) | 55 (70.5%) |
| Total | 1,509 (90.0%) | 168 (10.0%) |
Educational Attainment by Field of Study in Sunbury
Business (490 | 25.9%), science & technology (245 | 12.9%), communications (206 | 10.9%), education (188 | 9.9%), and liberal arts & history (175 | 9.2%) are the most common fields of study among 1,894 individuals in Sunbury who have obtained a bachelor's degree or higher.
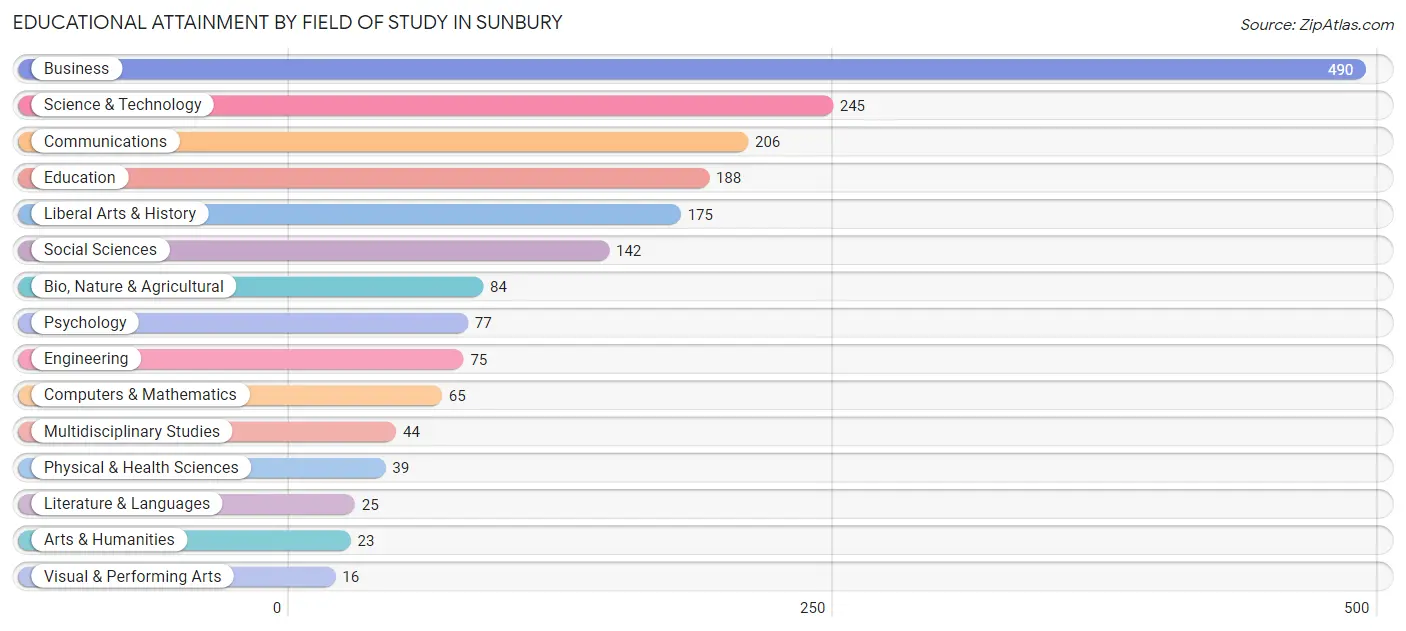
| Field of Study | # Graduates | % Graduates |
| Computers & Mathematics | 65 | 3.4% |
| Bio, Nature & Agricultural | 84 | 4.4% |
| Physical & Health Sciences | 39 | 2.1% |
| Psychology | 77 | 4.1% |
| Social Sciences | 142 | 7.5% |
| Engineering | 75 | 4.0% |
| Multidisciplinary Studies | 44 | 2.3% |
| Science & Technology | 245 | 12.9% |
| Business | 490 | 25.9% |
| Education | 188 | 9.9% |
| Literature & Languages | 25 | 1.3% |
| Liberal Arts & History | 175 | 9.2% |
| Visual & Performing Arts | 16 | 0.8% |
| Communications | 206 | 10.9% |
| Arts & Humanities | 23 | 1.2% |
| Total | 1,894 | 100.0% |
Transportation & Commute in Sunbury
Vehicle Availability by Sex in Sunbury
The most prevalent vehicle ownership categories in Sunbury are males with 2 vehicles (1,123, accounting for 55.9%) and females with 2 vehicles (795, making up 65.2%).
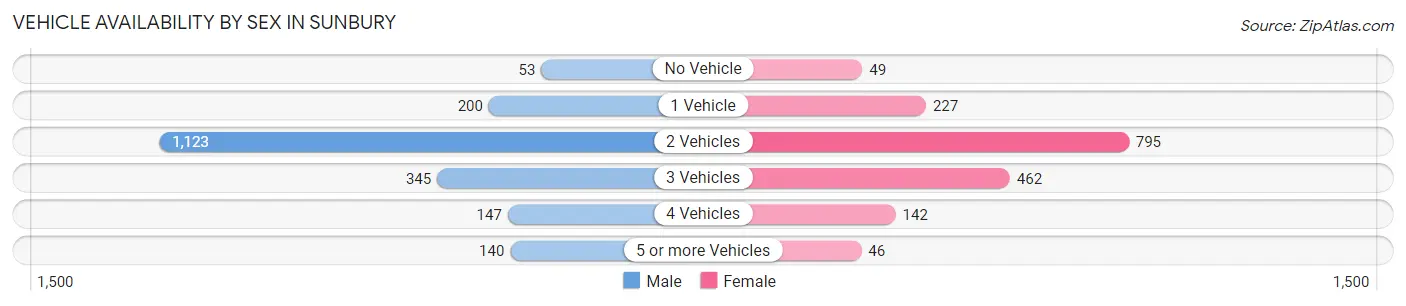
| Vehicles Available | Male | Female |
| No Vehicle | 53 (2.6%) | 49 (2.9%) |
| 1 Vehicle | 200 (10.0%) | 227 (13.2%) |
| 2 Vehicles | 1,123 (55.9%) | 795 (46.2%) |
| 3 Vehicles | 345 (17.2%) | 462 (26.8%) |
| 4 Vehicles | 147 (7.3%) | 142 (8.3%) |
| 5 or more Vehicles | 140 (7.0%) | 46 (2.7%) |
| Total | 2,008 (100.0%) | 1,721 (100.0%) |
Commute Time in Sunbury
The most frequently occuring commute durations in Sunbury are 30 to 34 minutes (683 commuters, 22.1%), 25 to 29 minutes (422 commuters, 13.7%), and 5 to 9 minutes (413 commuters, 13.4%).
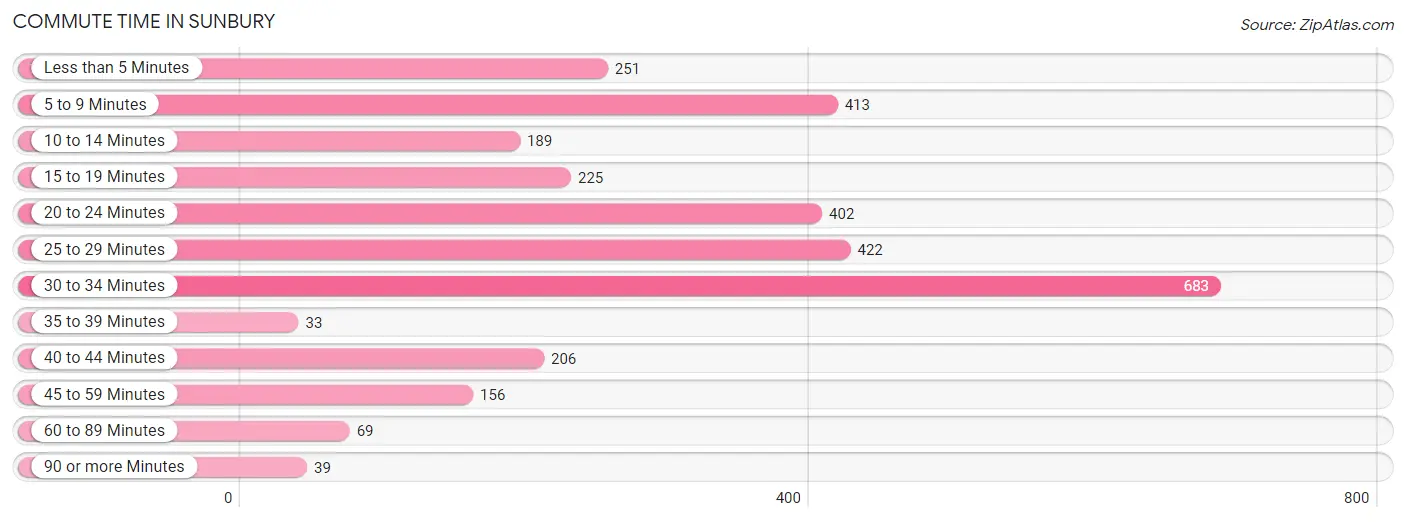
| Commute Time | # Commuters | % Commuters |
| Less than 5 Minutes | 251 | 8.1% |
| 5 to 9 Minutes | 413 | 13.4% |
| 10 to 14 Minutes | 189 | 6.1% |
| 15 to 19 Minutes | 225 | 7.3% |
| 20 to 24 Minutes | 402 | 13.0% |
| 25 to 29 Minutes | 422 | 13.7% |
| 30 to 34 Minutes | 683 | 22.1% |
| 35 to 39 Minutes | 33 | 1.1% |
| 40 to 44 Minutes | 206 | 6.7% |
| 45 to 59 Minutes | 156 | 5.1% |
| 60 to 89 Minutes | 69 | 2.2% |
| 90 or more Minutes | 39 | 1.3% |
Commute Time by Sex in Sunbury
The most common commute times in Sunbury are 20 to 24 minutes (261 commuters, 16.0%) for males and 30 to 34 minutes (425 commuters, 29.2%) for females.
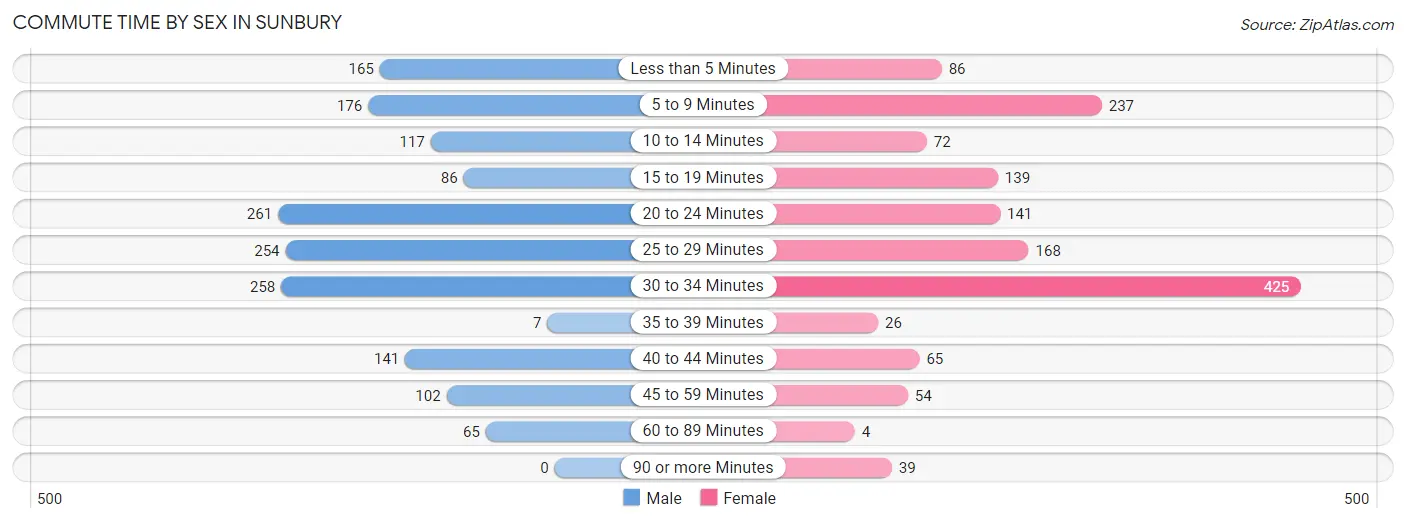
| Commute Time | Male | Female |
| Less than 5 Minutes | 165 (10.1%) | 86 (5.9%) |
| 5 to 9 Minutes | 176 (10.8%) | 237 (16.3%) |
| 10 to 14 Minutes | 117 (7.2%) | 72 (5.0%) |
| 15 to 19 Minutes | 86 (5.3%) | 139 (9.6%) |
| 20 to 24 Minutes | 261 (16.0%) | 141 (9.7%) |
| 25 to 29 Minutes | 254 (15.6%) | 168 (11.5%) |
| 30 to 34 Minutes | 258 (15.8%) | 425 (29.2%) |
| 35 to 39 Minutes | 7 (0.4%) | 26 (1.8%) |
| 40 to 44 Minutes | 141 (8.6%) | 65 (4.5%) |
| 45 to 59 Minutes | 102 (6.2%) | 54 (3.7%) |
| 60 to 89 Minutes | 65 (4.0%) | 4 (0.3%) |
| 90 or more Minutes | 0 (0.0%) | 39 (2.7%) |
Time of Departure to Work by Sex in Sunbury
The most frequent times of departure to work in Sunbury are 9:00 AM to 9:59 AM (260, 15.9%) for males and 7:00 AM to 7:29 AM (249, 17.1%) for females.
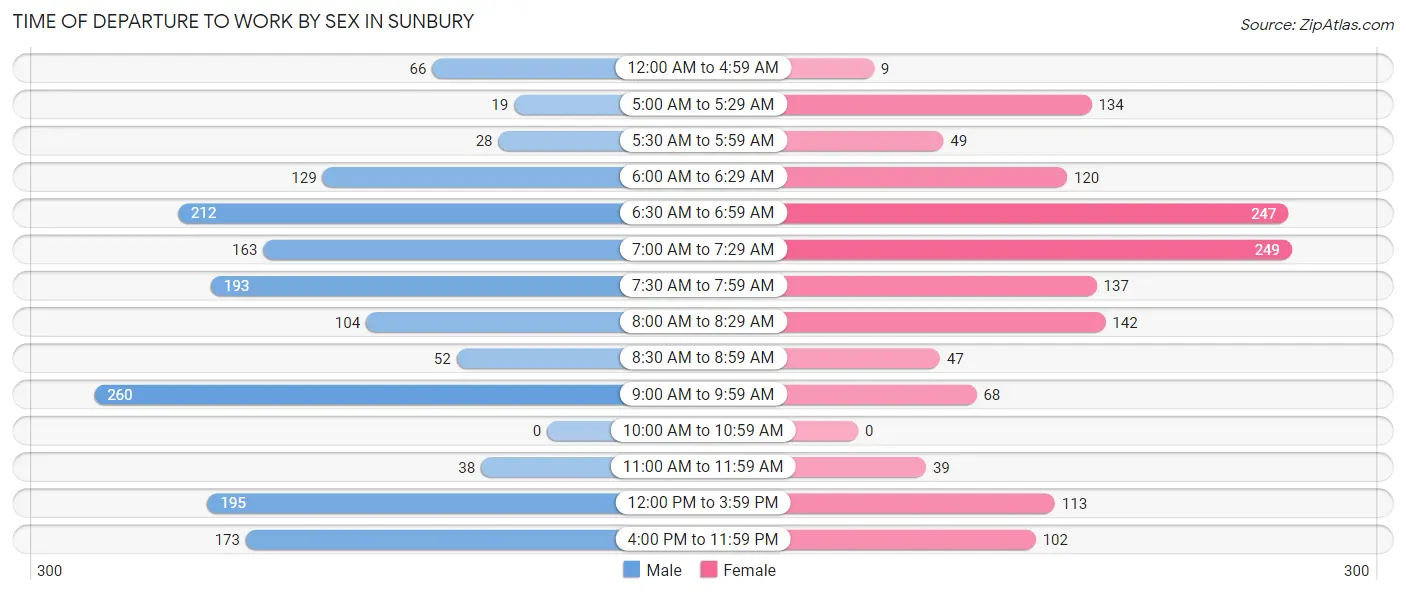
| Time of Departure | Male | Female |
| 12:00 AM to 4:59 AM | 66 (4.0%) | 9 (0.6%) |
| 5:00 AM to 5:29 AM | 19 (1.2%) | 134 (9.2%) |
| 5:30 AM to 5:59 AM | 28 (1.7%) | 49 (3.4%) |
| 6:00 AM to 6:29 AM | 129 (7.9%) | 120 (8.2%) |
| 6:30 AM to 6:59 AM | 212 (13.0%) | 247 (17.0%) |
| 7:00 AM to 7:29 AM | 163 (10.0%) | 249 (17.1%) |
| 7:30 AM to 7:59 AM | 193 (11.8%) | 137 (9.4%) |
| 8:00 AM to 8:29 AM | 104 (6.4%) | 142 (9.8%) |
| 8:30 AM to 8:59 AM | 52 (3.2%) | 47 (3.2%) |
| 9:00 AM to 9:59 AM | 260 (15.9%) | 68 (4.7%) |
| 10:00 AM to 10:59 AM | 0 (0.0%) | 0 (0.0%) |
| 11:00 AM to 11:59 AM | 38 (2.3%) | 39 (2.7%) |
| 12:00 PM to 3:59 PM | 195 (11.9%) | 113 (7.8%) |
| 4:00 PM to 11:59 PM | 173 (10.6%) | 102 (7.0%) |
| Total | 1,632 (100.0%) | 1,456 (100.0%) |
Housing Occupancy in Sunbury
Occupancy by Ownership in Sunbury
Of the total 2,594 dwellings in Sunbury, owner-occupied units account for 1,771 (68.3%), while renter-occupied units make up 823 (31.7%).
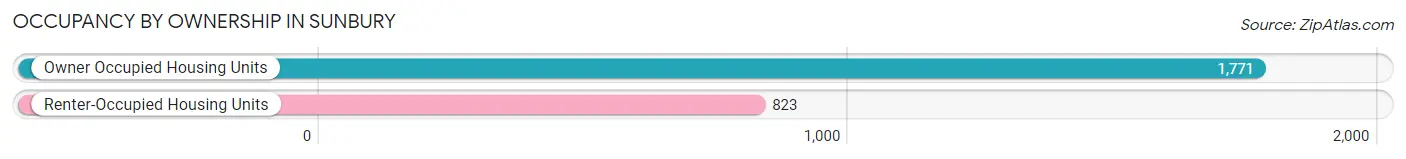
| Occupancy | # Housing Units | % Housing Units |
| Owner Occupied Housing Units | 1,771 | 68.3% |
| Renter-Occupied Housing Units | 823 | 31.7% |
| Total Occupied Housing Units | 2,594 | 100.0% |
Occupancy by Household Size in Sunbury
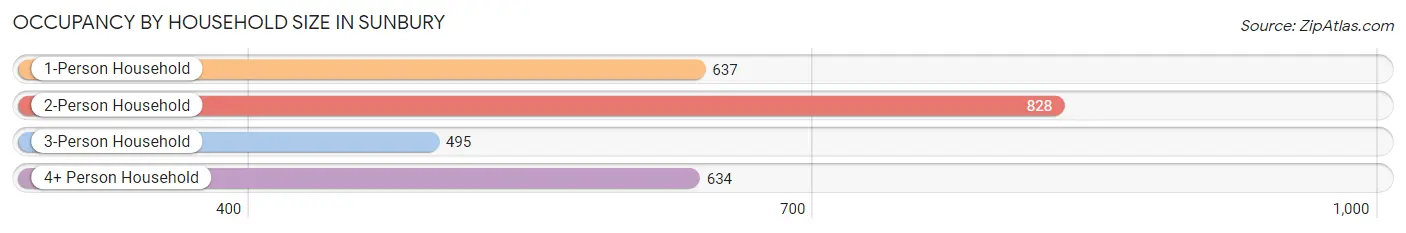
| Household Size | # Housing Units | % Housing Units |
| 1-Person Household | 637 | 24.6% |
| 2-Person Household | 828 | 31.9% |
| 3-Person Household | 495 | 19.1% |
| 4+ Person Household | 634 | 24.4% |
| Total Housing Units | 2,594 | 100.0% |
Occupancy by Ownership by Household Size in Sunbury
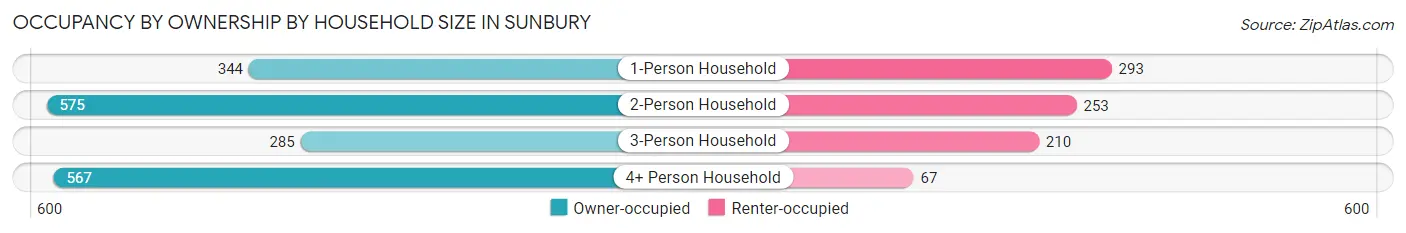
| Household Size | Owner-occupied | Renter-occupied |
| 1-Person Household | 344 (54.0%) | 293 (46.0%) |
| 2-Person Household | 575 (69.4%) | 253 (30.6%) |
| 3-Person Household | 285 (57.6%) | 210 (42.4%) |
| 4+ Person Household | 567 (89.4%) | 67 (10.6%) |
| Total Housing Units | 1,771 (68.3%) | 823 (31.7%) |
Occupancy by Educational Attainment in Sunbury
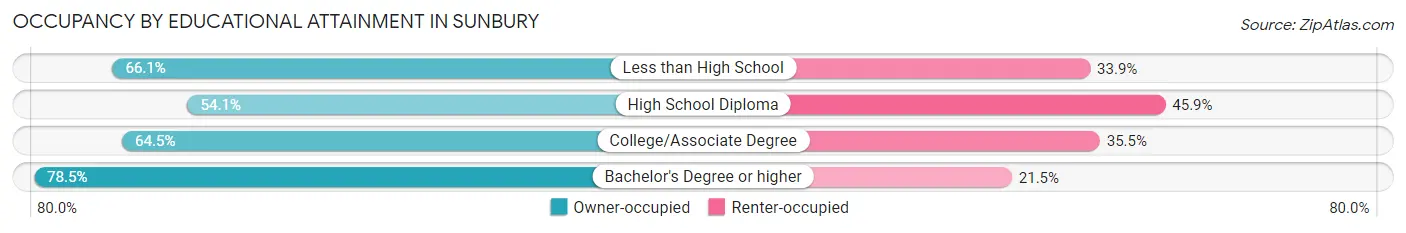
| Household Size | Owner-occupied | Renter-occupied |
| Less than High School | 109 (66.1%) | 56 (33.9%) |
| High School Diploma | 321 (54.1%) | 272 (45.9%) |
| College/Associate Degree | 462 (64.5%) | 254 (35.5%) |
| Bachelor's Degree or higher | 879 (78.5%) | 241 (21.5%) |
Occupancy by Age of Householder in Sunbury
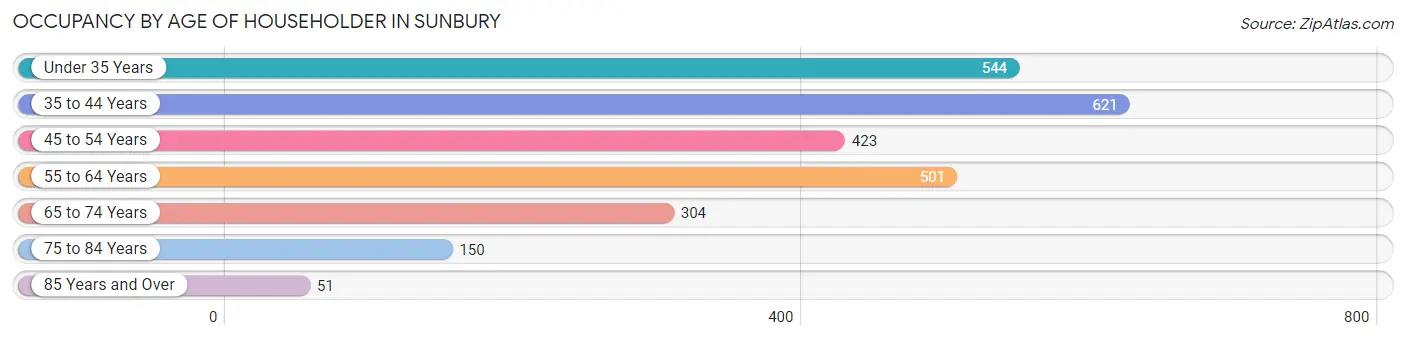
| Age Bracket | # Households | % Households |
| Under 35 Years | 544 | 21.0% |
| 35 to 44 Years | 621 | 23.9% |
| 45 to 54 Years | 423 | 16.3% |
| 55 to 64 Years | 501 | 19.3% |
| 65 to 74 Years | 304 | 11.7% |
| 75 to 84 Years | 150 | 5.8% |
| 85 Years and Over | 51 | 2.0% |
| Total | 2,594 | 100.0% |
Housing Finances in Sunbury
Median Income by Occupancy in Sunbury
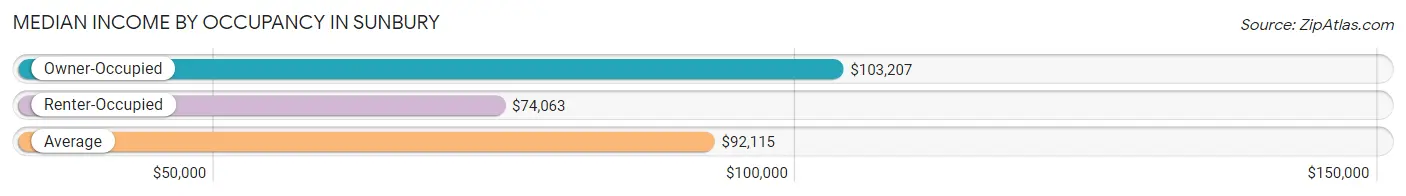
| Occupancy Type | # Households | Median Income |
| Owner-Occupied | 1,771 (68.3%) | $103,207 |
| Renter-Occupied | 823 (31.7%) | $74,063 |
| Average | 2,594 (100.0%) | $92,115 |
Occupancy by Householder Income Bracket in Sunbury
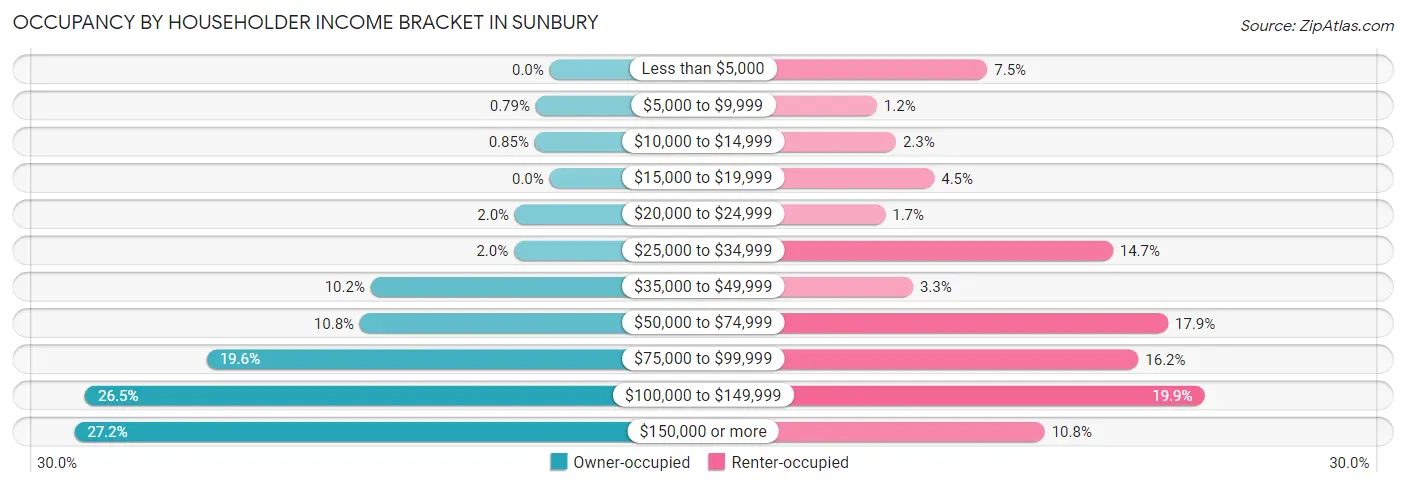
| Income Bracket | Owner-occupied | Renter-occupied |
| Less than $5,000 | 0 (0.0%) | 62 (7.5%) |
| $5,000 to $9,999 | 14 (0.8%) | 10 (1.2%) |
| $10,000 to $14,999 | 15 (0.9%) | 19 (2.3%) |
| $15,000 to $19,999 | 0 (0.0%) | 37 (4.5%) |
| $20,000 to $24,999 | 35 (2.0%) | 14 (1.7%) |
| $25,000 to $34,999 | 36 (2.0%) | 121 (14.7%) |
| $35,000 to $49,999 | 181 (10.2%) | 27 (3.3%) |
| $50,000 to $74,999 | 192 (10.8%) | 147 (17.9%) |
| $75,000 to $99,999 | 347 (19.6%) | 133 (16.2%) |
| $100,000 to $149,999 | 470 (26.5%) | 164 (19.9%) |
| $150,000 or more | 481 (27.2%) | 89 (10.8%) |
| Total | 1,771 (100.0%) | 823 (100.0%) |
Monthly Housing Cost Tiers in Sunbury
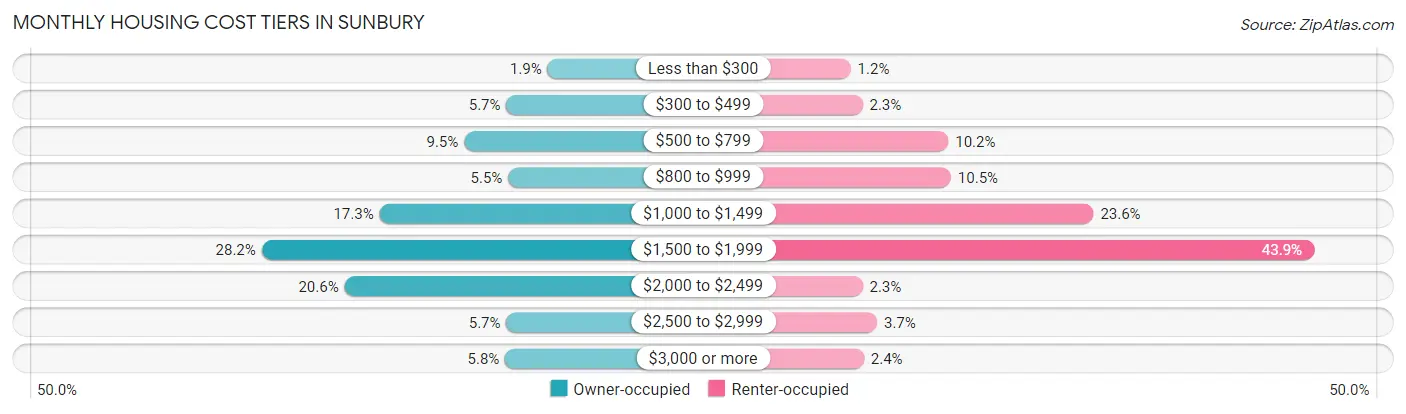
| Monthly Cost | Owner-occupied | Renter-occupied |
| Less than $300 | 33 (1.9%) | 10 (1.2%) |
| $300 to $499 | 100 (5.7%) | 19 (2.3%) |
| $500 to $799 | 169 (9.5%) | 84 (10.2%) |
| $800 to $999 | 97 (5.5%) | 86 (10.4%) |
| $1,000 to $1,499 | 307 (17.3%) | 194 (23.6%) |
| $1,500 to $1,999 | 499 (28.2%) | 361 (43.9%) |
| $2,000 to $2,499 | 364 (20.5%) | 19 (2.3%) |
| $2,500 to $2,999 | 100 (5.7%) | 30 (3.6%) |
| $3,000 or more | 102 (5.8%) | 20 (2.4%) |
| Total | 1,771 (100.0%) | 823 (100.0%) |
Physical Housing Characteristics in Sunbury
Housing Structures in Sunbury
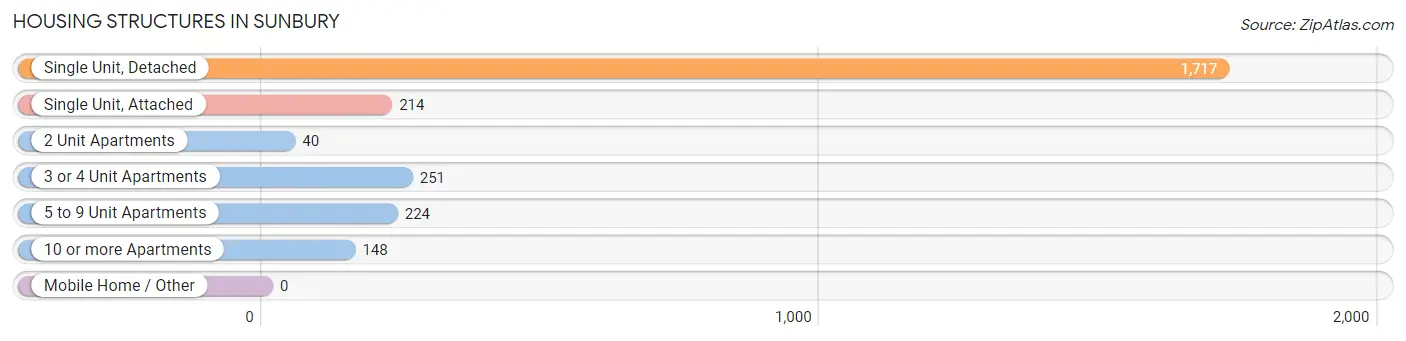
| Structure Type | # Housing Units | % Housing Units |
| Single Unit, Detached | 1,717 | 66.2% |
| Single Unit, Attached | 214 | 8.3% |
| 2 Unit Apartments | 40 | 1.5% |
| 3 or 4 Unit Apartments | 251 | 9.7% |
| 5 to 9 Unit Apartments | 224 | 8.6% |
| 10 or more Apartments | 148 | 5.7% |
| Mobile Home / Other | 0 | 0.0% |
| Total | 2,594 | 100.0% |
Housing Structures by Occupancy in Sunbury
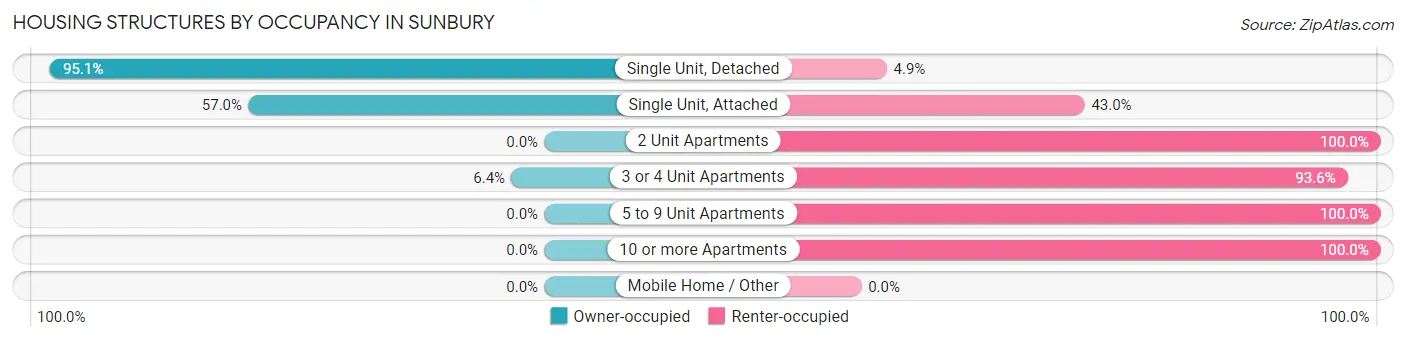
| Structure Type | Owner-occupied | Renter-occupied |
| Single Unit, Detached | 1,633 (95.1%) | 84 (4.9%) |
| Single Unit, Attached | 122 (57.0%) | 92 (43.0%) |
| 2 Unit Apartments | 0 (0.0%) | 40 (100.0%) |
| 3 or 4 Unit Apartments | 16 (6.4%) | 235 (93.6%) |
| 5 to 9 Unit Apartments | 0 (0.0%) | 224 (100.0%) |
| 10 or more Apartments | 0 (0.0%) | 148 (100.0%) |
| Mobile Home / Other | 0 (0.0%) | 0 (0.0%) |
| Total | 1,771 (68.3%) | 823 (31.7%) |
Housing Structures by Number of Rooms in Sunbury
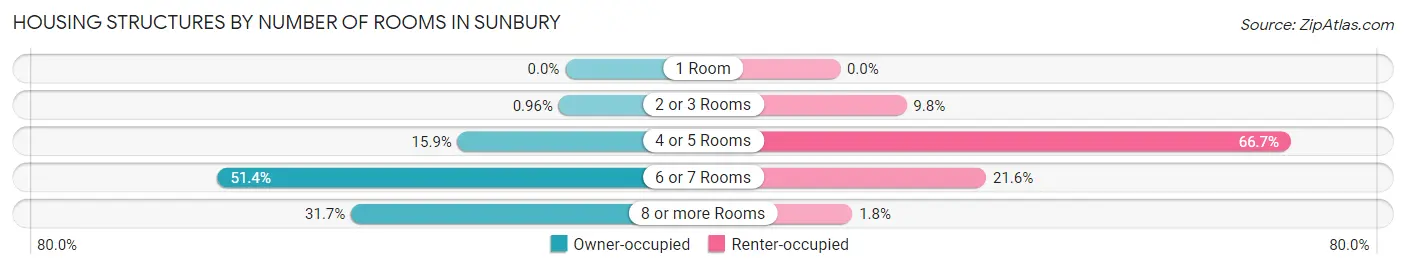
| Number of Rooms | Owner-occupied | Renter-occupied |
| 1 Room | 0 (0.0%) | 0 (0.0%) |
| 2 or 3 Rooms | 17 (1.0%) | 81 (9.8%) |
| 4 or 5 Rooms | 282 (15.9%) | 549 (66.7%) |
| 6 or 7 Rooms | 911 (51.4%) | 178 (21.6%) |
| 8 or more Rooms | 561 (31.7%) | 15 (1.8%) |
| Total | 1,771 (100.0%) | 823 (100.0%) |
Housing Structure by Heating Type in Sunbury
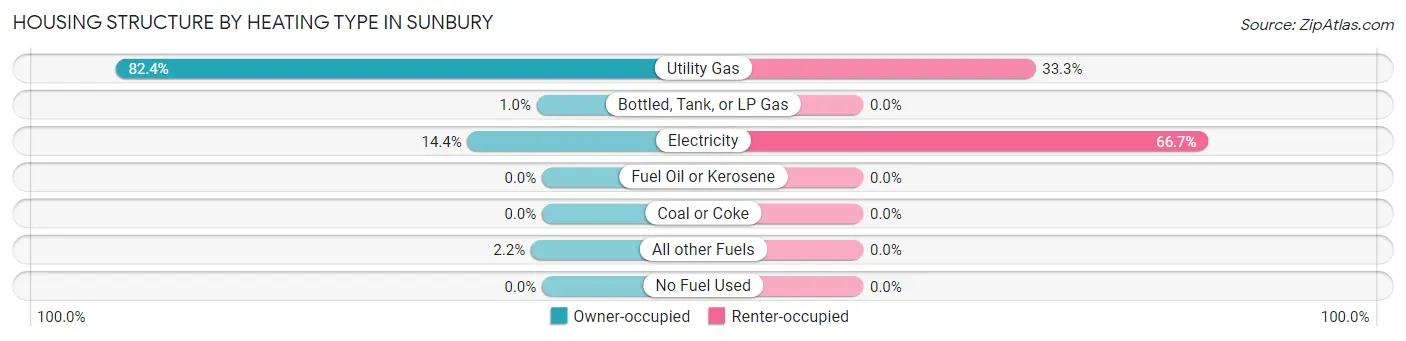
| Heating Type | Owner-occupied | Renter-occupied |
| Utility Gas | 1,460 (82.4%) | 274 (33.3%) |
| Bottled, Tank, or LP Gas | 18 (1.0%) | 0 (0.0%) |
| Electricity | 255 (14.4%) | 549 (66.7%) |
| Fuel Oil or Kerosene | 0 (0.0%) | 0 (0.0%) |
| Coal or Coke | 0 (0.0%) | 0 (0.0%) |
| All other Fuels | 38 (2.1%) | 0 (0.0%) |
| No Fuel Used | 0 (0.0%) | 0 (0.0%) |
| Total | 1,771 (100.0%) | 823 (100.0%) |
Household Vehicle Usage in Sunbury
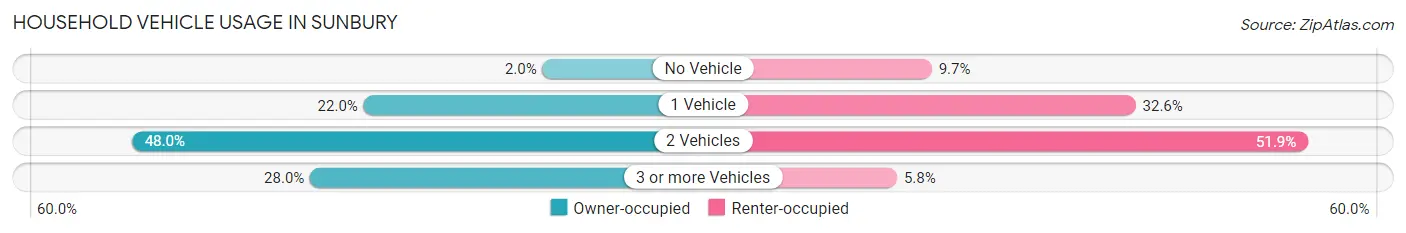
| Vehicles per Household | Owner-occupied | Renter-occupied |
| No Vehicle | 35 (2.0%) | 80 (9.7%) |
| 1 Vehicle | 390 (22.0%) | 268 (32.6%) |
| 2 Vehicles | 850 (48.0%) | 427 (51.9%) |
| 3 or more Vehicles | 496 (28.0%) | 48 (5.8%) |
| Total | 1,771 (100.0%) | 823 (100.0%) |
Real Estate & Mortgages in Sunbury
Real Estate and Mortgage Overview in Sunbury
| Characteristic | Without Mortgage | With Mortgage |
| Housing Units | 410 | 1,361 |
| Median Property Value | $262,700 | $308,400 |
| Median Household Income | $79,500 | $383 |
| Monthly Housing Costs | $648 | $102 |
| Real Estate Taxes | $2,925 | $0 |
Property Value by Mortgage Status in Sunbury
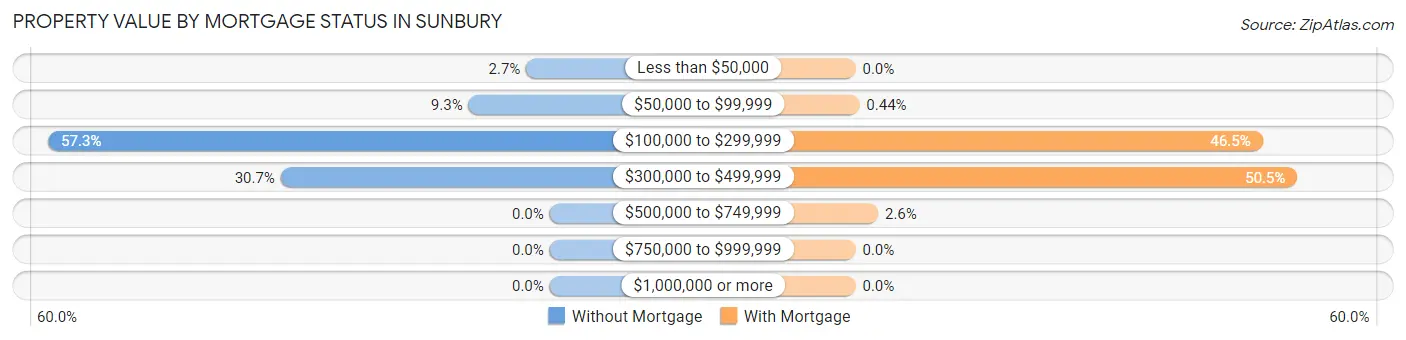
| Property Value | Without Mortgage | With Mortgage |
| Less than $50,000 | 11 (2.7%) | 0 (0.0%) |
| $50,000 to $99,999 | 38 (9.3%) | 6 (0.4%) |
| $100,000 to $299,999 | 235 (57.3%) | 633 (46.5%) |
| $300,000 to $499,999 | 126 (30.7%) | 687 (50.5%) |
| $500,000 to $749,999 | 0 (0.0%) | 35 (2.6%) |
| $750,000 to $999,999 | 0 (0.0%) | 0 (0.0%) |
| $1,000,000 or more | 0 (0.0%) | 0 (0.0%) |
| Total | 410 (100.0%) | 1,361 (100.0%) |
Household Income by Mortgage Status in Sunbury
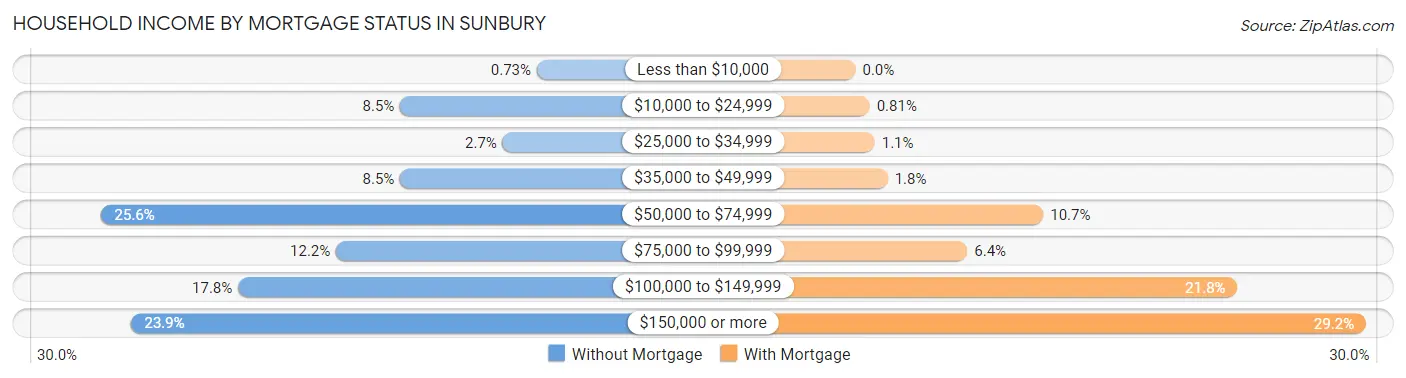
| Household Income | Without Mortgage | With Mortgage |
| Less than $10,000 | 3 (0.7%) | 0 (0.0%) |
| $10,000 to $24,999 | 35 (8.5%) | 11 (0.8%) |
| $25,000 to $34,999 | 11 (2.7%) | 15 (1.1%) |
| $35,000 to $49,999 | 35 (8.5%) | 25 (1.8%) |
| $50,000 to $74,999 | 105 (25.6%) | 146 (10.7%) |
| $75,000 to $99,999 | 50 (12.2%) | 87 (6.4%) |
| $100,000 to $149,999 | 73 (17.8%) | 297 (21.8%) |
| $150,000 or more | 98 (23.9%) | 397 (29.2%) |
| Total | 410 (100.0%) | 1,361 (100.0%) |
Property Value to Household Income Ratio in Sunbury
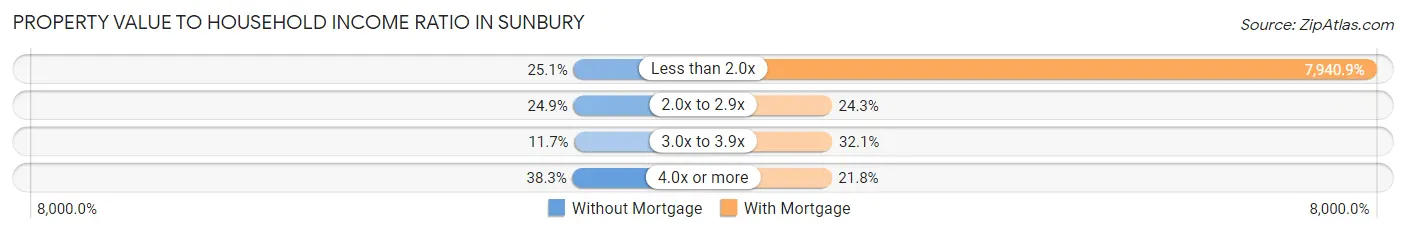
| Value-to-Income Ratio | Without Mortgage | With Mortgage |
| Less than 2.0x | 103 (25.1%) | 108,075 (7,940.9%) |
| 2.0x to 2.9x | 102 (24.9%) | 330 (24.2%) |
| 3.0x to 3.9x | 48 (11.7%) | 437 (32.1%) |
| 4.0x or more | 157 (38.3%) | 296 (21.7%) |
| Total | 410 (100.0%) | 1,361 (100.0%) |
Real Estate Taxes by Mortgage Status in Sunbury
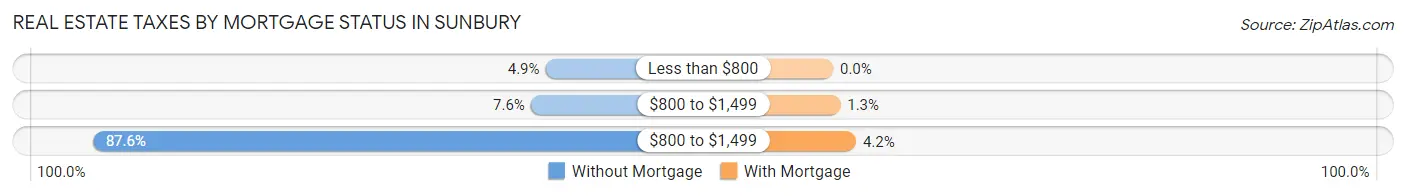
| Property Taxes | Without Mortgage | With Mortgage |
| Less than $800 | 20 (4.9%) | 0 (0.0%) |
| $800 to $1,499 | 31 (7.6%) | 18 (1.3%) |
| $800 to $1,499 | 359 (87.6%) | 57 (4.2%) |
| Total | 410 (100.0%) | 1,361 (100.0%) |
Health & Disability in Sunbury
Health Insurance Coverage by Age in Sunbury
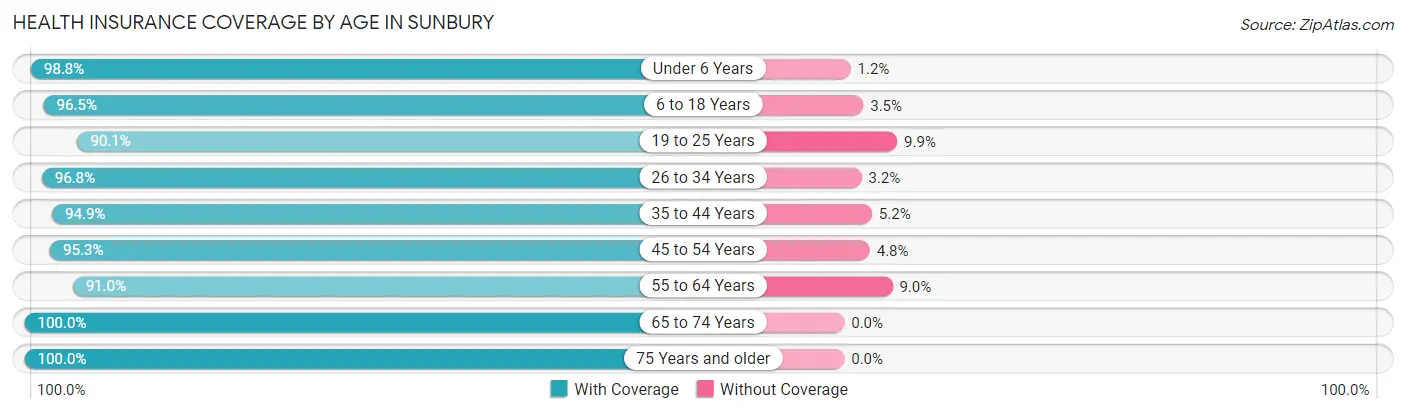
| Age Bracket | With Coverage | Without Coverage |
| Under 6 Years | 755 (98.8%) | 9 (1.2%) |
| 6 to 18 Years | 1,062 (96.5%) | 39 (3.5%) |
| 19 to 25 Years | 667 (90.1%) | 73 (9.9%) |
| 26 to 34 Years | 935 (96.8%) | 31 (3.2%) |
| 35 to 44 Years | 995 (94.9%) | 54 (5.1%) |
| 45 to 54 Years | 621 (95.3%) | 31 (4.8%) |
| 55 to 64 Years | 821 (91.0%) | 81 (9.0%) |
| 65 to 74 Years | 485 (100.0%) | 0 (0.0%) |
| 75 Years and older | 274 (100.0%) | 0 (0.0%) |
| Total | 6,615 (95.4%) | 318 (4.6%) |
Health Insurance Coverage by Citizenship Status in Sunbury
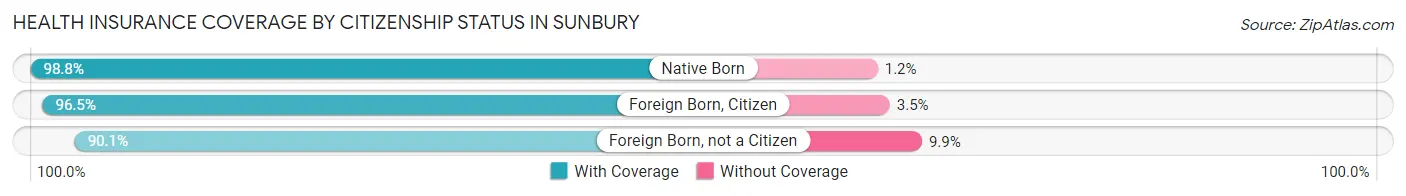
| Citizenship Status | With Coverage | Without Coverage |
| Native Born | 755 (98.8%) | 9 (1.2%) |
| Foreign Born, Citizen | 1,062 (96.5%) | 39 (3.5%) |
| Foreign Born, not a Citizen | 667 (90.1%) | 73 (9.9%) |
Health Insurance Coverage by Household Income in Sunbury
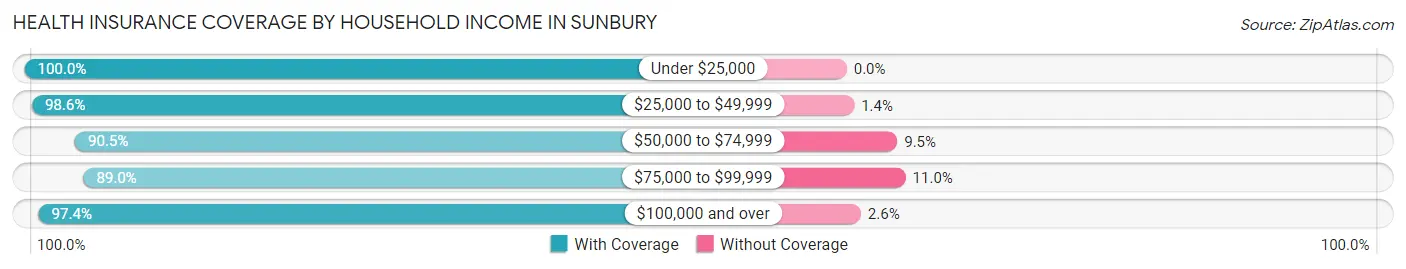
| Household Income | With Coverage | Without Coverage |
| Under $25,000 | 420 (100.0%) | 0 (0.0%) |
| $25,000 to $49,999 | 640 (98.6%) | 9 (1.4%) |
| $50,000 to $74,999 | 737 (90.5%) | 77 (9.5%) |
| $75,000 to $99,999 | 1,049 (89.0%) | 130 (11.0%) |
| $100,000 and over | 3,760 (97.4%) | 102 (2.6%) |
Public vs Private Health Insurance Coverage by Age in Sunbury
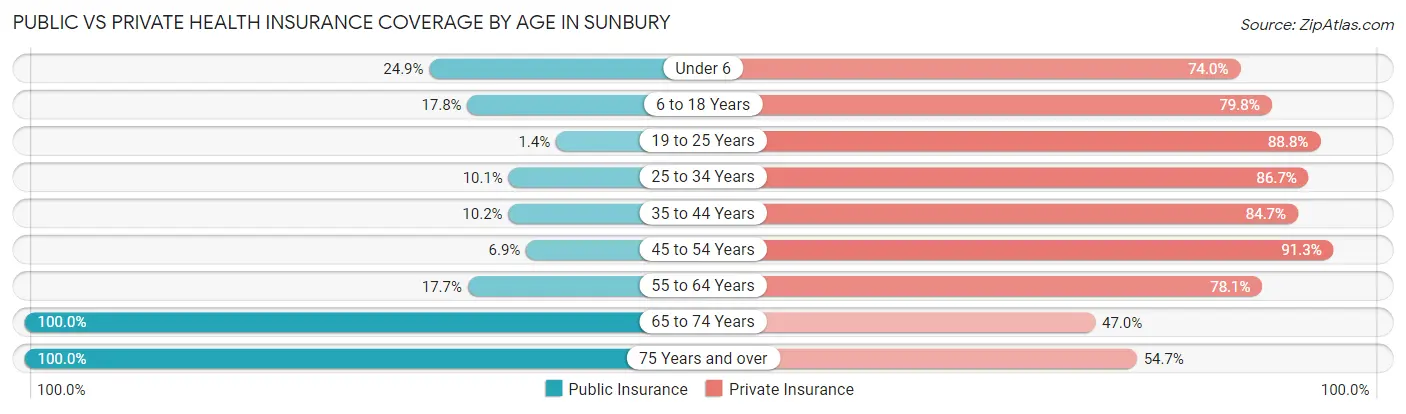
| Age Bracket | Public Insurance | Private Insurance |
| Under 6 | 190 (24.9%) | 565 (74.0%) |
| 6 to 18 Years | 196 (17.8%) | 878 (79.7%) |
| 19 to 25 Years | 10 (1.3%) | 657 (88.8%) |
| 25 to 34 Years | 98 (10.1%) | 837 (86.7%) |
| 35 to 44 Years | 107 (10.2%) | 888 (84.7%) |
| 45 to 54 Years | 45 (6.9%) | 595 (91.3%) |
| 55 to 64 Years | 160 (17.7%) | 704 (78.0%) |
| 65 to 74 Years | 485 (100.0%) | 228 (47.0%) |
| 75 Years and over | 274 (100.0%) | 150 (54.7%) |
| Total | 1,565 (22.6%) | 5,502 (79.4%) |
Disability Status by Sex by Age in Sunbury
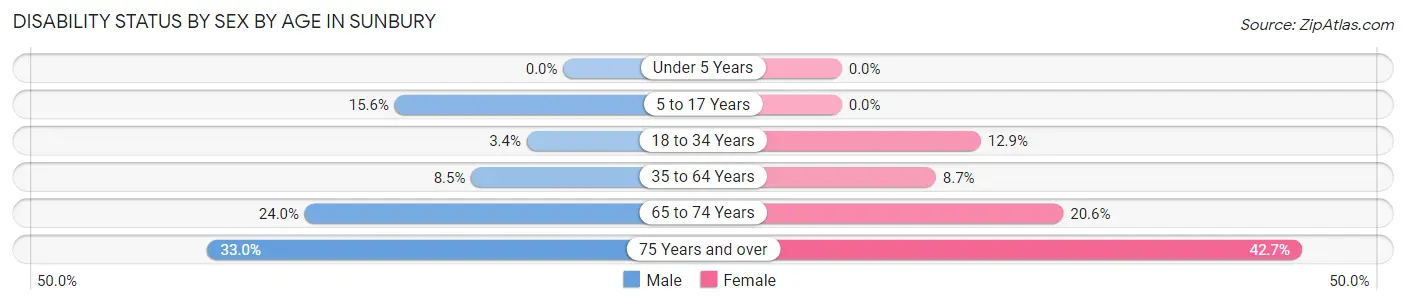
| Age Bracket | Male | Female |
| Under 5 Years | 0 (0.0%) | 0 (0.0%) |
| 5 to 17 Years | 76 (15.6%) | 0 (0.0%) |
| 18 to 34 Years | 32 (3.4%) | 102 (12.9%) |
| 35 to 64 Years | 101 (8.5%) | 124 (8.7%) |
| 65 to 74 Years | 65 (24.0%) | 44 (20.6%) |
| 75 Years and over | 34 (33.0%) | 73 (42.7%) |
Disability Class by Sex by Age in Sunbury
Disability Class: Hearing Difficulty
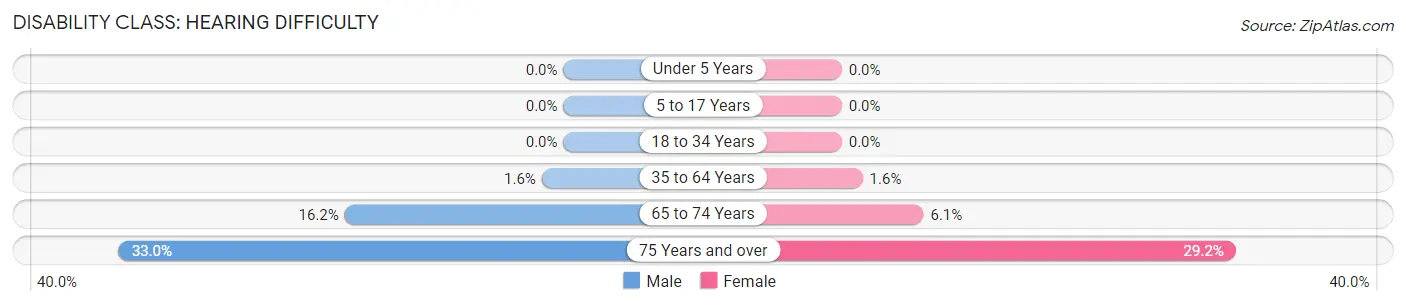
| Age Bracket | Male | Female |
| Under 5 Years | 0 (0.0%) | 0 (0.0%) |
| 5 to 17 Years | 0 (0.0%) | 0 (0.0%) |
| 18 to 34 Years | 0 (0.0%) | 0 (0.0%) |
| 35 to 64 Years | 19 (1.6%) | 22 (1.5%) |
| 65 to 74 Years | 44 (16.2%) | 13 (6.1%) |
| 75 Years and over | 34 (33.0%) | 50 (29.2%) |
Disability Class: Vision Difficulty
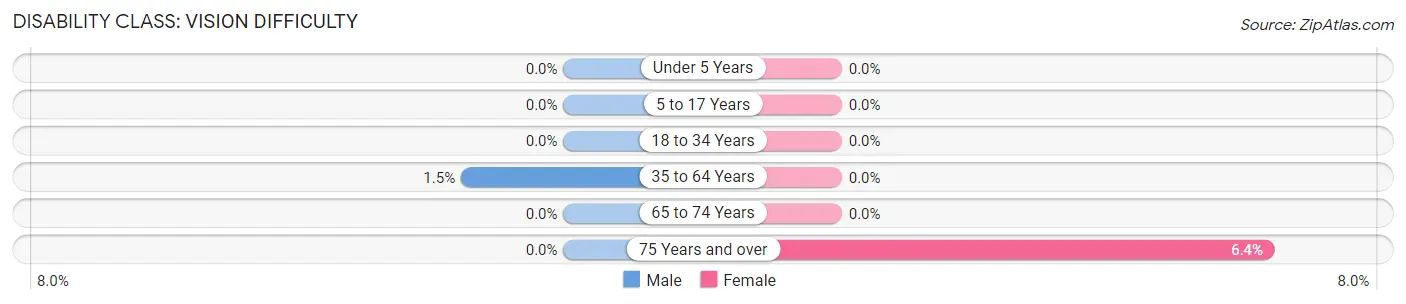
| Age Bracket | Male | Female |
| Under 5 Years | 0 (0.0%) | 0 (0.0%) |
| 5 to 17 Years | 0 (0.0%) | 0 (0.0%) |
| 18 to 34 Years | 0 (0.0%) | 0 (0.0%) |
| 35 to 64 Years | 18 (1.5%) | 0 (0.0%) |
| 65 to 74 Years | 0 (0.0%) | 0 (0.0%) |
| 75 Years and over | 0 (0.0%) | 11 (6.4%) |
Disability Class: Cognitive Difficulty
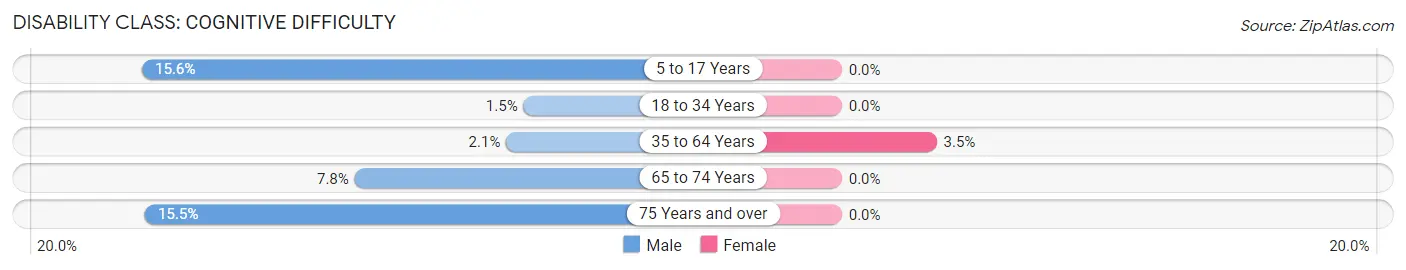
| Age Bracket | Male | Female |
| 5 to 17 Years | 76 (15.6%) | 0 (0.0%) |
| 18 to 34 Years | 14 (1.5%) | 0 (0.0%) |
| 35 to 64 Years | 25 (2.1%) | 50 (3.5%) |
| 65 to 74 Years | 21 (7.7%) | 0 (0.0%) |
| 75 Years and over | 16 (15.5%) | 0 (0.0%) |
Disability Class: Ambulatory Difficulty
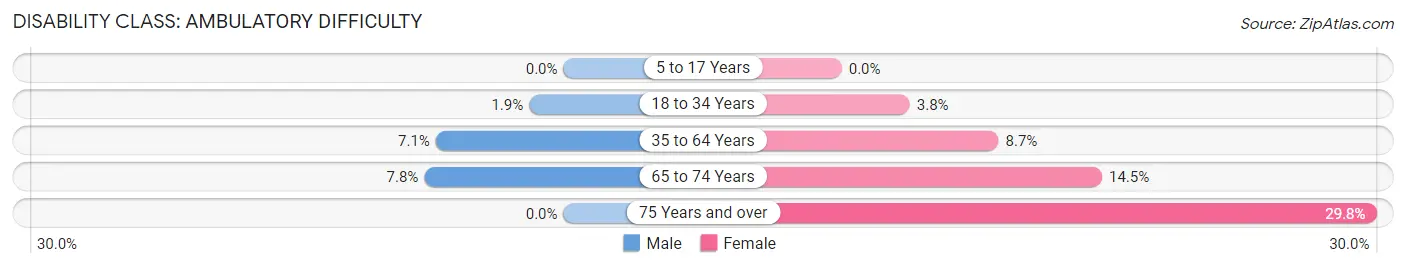
| Age Bracket | Male | Female |
| 5 to 17 Years | 0 (0.0%) | 0 (0.0%) |
| 18 to 34 Years | 18 (1.9%) | 30 (3.8%) |
| 35 to 64 Years | 84 (7.1%) | 124 (8.7%) |
| 65 to 74 Years | 21 (7.7%) | 31 (14.5%) |
| 75 Years and over | 0 (0.0%) | 51 (29.8%) |
Disability Class: Self-Care Difficulty
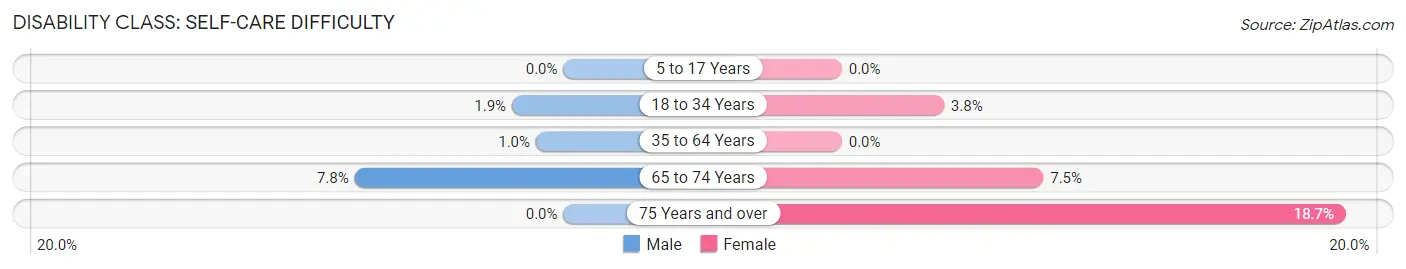
| Age Bracket | Male | Female |
| 5 to 17 Years | 0 (0.0%) | 0 (0.0%) |
| 18 to 34 Years | 18 (1.9%) | 30 (3.8%) |
| 35 to 64 Years | 12 (1.0%) | 0 (0.0%) |
| 65 to 74 Years | 21 (7.7%) | 16 (7.5%) |
| 75 Years and over | 0 (0.0%) | 32 (18.7%) |
Technology Access in Sunbury
Computing Device Access in Sunbury
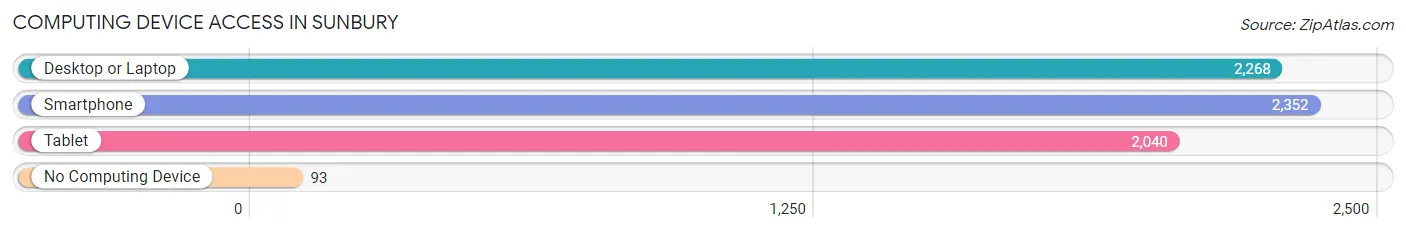
| Device Type | # Households | % Households |
| Desktop or Laptop | 2,268 | 87.4% |
| Smartphone | 2,352 | 90.7% |
| Tablet | 2,040 | 78.6% |
| No Computing Device | 93 | 3.6% |
| Total | 2,594 | 100.0% |
Internet Access in Sunbury
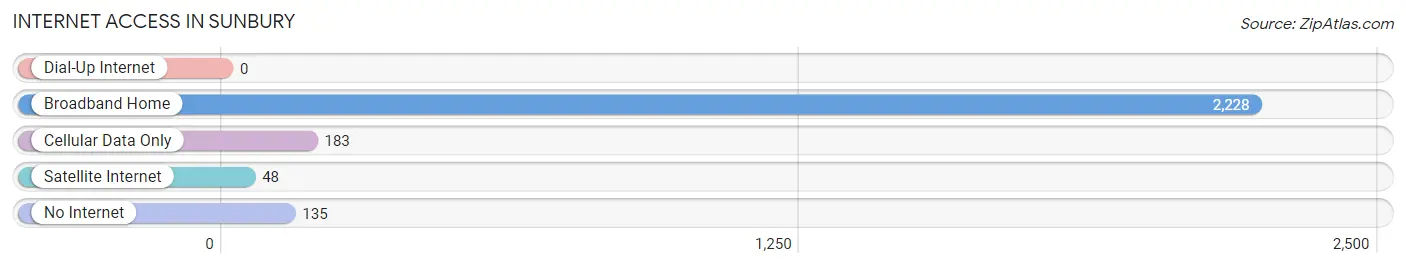
| Internet Type | # Households | % Households |
| Dial-Up Internet | 0 | 0.0% |
| Broadband Home | 2,228 | 85.9% |
| Cellular Data Only | 183 | 7.0% |
| Satellite Internet | 48 | 1.8% |
| No Internet | 135 | 5.2% |
| Total | 2,594 | 100.0% |
Sunbury Summary
History
The city of Sunbury, Ohio is located in Delaware County, approximately 25 miles north of Columbus. The city was founded in 1815 by a group of settlers from Connecticut, led by General James Kilbourne. The settlers named the city after Sunbury, Connecticut, the hometown of General Kilbourne. The city was officially incorporated in 1838.
Sunbury has a rich history of industry and agriculture. In the early 19th century, the city was a major producer of wool and other agricultural products. The city was also home to several mills, including a paper mill, a flour mill, and a sawmill. In the late 19th century, the city became a major center for the production of furniture and other wood products.
The city was also home to several major industries in the 20th century. The Sunbury Foundry and Machine Company was established in the early 1900s and produced a variety of products, including cast iron stoves, pumps, and other machinery. The Sunbury Glass Company was established in the 1920s and produced a variety of glass products, including bottles and jars. The city was also home to several other industries, including a brickyard, a canning factory, and a tannery.
Geography
Sunbury is located in central Ohio, approximately 25 miles north of Columbus. The city is situated in the Olentangy River Valley, which is part of the larger Scioto River Valley. The city is surrounded by rolling hills and is located in the foothills of the Appalachian Mountains.
The city has a total area of 4.2 square miles, all of which is land. The city is located at an elevation of 890 feet above sea level. The climate in Sunbury is classified as humid continental, with hot summers and cold winters. The average annual temperature is around 50 degrees Fahrenheit.
Economy
Sunbury’s economy is largely based on agriculture and manufacturing. The city is home to several major agricultural operations, including dairy farms, grain farms, and vegetable farms. The city is also home to several major manufacturing operations, including the Sunbury Foundry and Machine Company, the Sunbury Glass Company, and the Sunbury Brickyard.
The city is also home to several retail businesses, including grocery stores, restaurants, and clothing stores. The city is also home to several service businesses, including banks, insurance companies, and medical offices.
Demographics
As of the 2010 census, the population of Sunbury was 5,378. The population is predominantly white, with 92.3% of the population identifying as white. The median household income in Sunbury is $50,945, and the median home value is $164,400. The city has a poverty rate of 11.3%.
Sunbury is home to several churches, including the Sunbury United Methodist Church, the Sunbury Presbyterian Church, and the Sunbury Baptist Church. The city is also home to several schools, including Sunbury Elementary School, Sunbury Middle School, and Sunbury High School.
Common Questions
What is Per Capita Income in Sunbury?
Per Capita income in Sunbury is $41,708.
What is the Median Family Income in Sunbury?
Median Family Income in Sunbury is $91,776.
What is the Median Household income in Sunbury?
Median Household Income in Sunbury is $92,115.
What is Income or Wage Gap in Sunbury?
Income or Wage Gap in Sunbury is 9.8%.
Women in Sunbury earn 90.2 cents for every dollar earned by a man.
What is Inequality or Gini Index in Sunbury?
Inequality or Gini Index in Sunbury is 0.36.
What is the Total Population of Sunbury?
Total Population of Sunbury is 6,933.
What is the Total Male Population of Sunbury?
Total Male Population of Sunbury is 3,273.
What is the Total Female Population of Sunbury?
Total Female Population of Sunbury is 3,660.
What is the Ratio of Males per 100 Females in Sunbury?
There are 89.43 Males per 100 Females in Sunbury.
What is the Ratio of Females per 100 Males in Sunbury?
There are 111.82 Females per 100 Males in Sunbury.
What is the Median Population Age in Sunbury?
Median Population Age in Sunbury is 33.3 Years.
What is the Average Family Size in Sunbury
Average Family Size in Sunbury is 3.1 People.
What is the Average Household Size in Sunbury
Average Household Size in Sunbury is 2.7 People.
How Large is the Labor Force in Sunbury?
There are 3,806 People in the Labor Forcein in Sunbury.
What is the Percentage of People in the Labor Force in Sunbury?
70.9% of People are in the Labor Force in Sunbury.
What is the Unemployment Rate in Sunbury?
Unemployment Rate in Sunbury is 1.6%.