Van Wert, OH Map & Demographics
Van Wert Map
Van Wert Overview
$29,026
PER CAPITA INCOME
$59,022
AVG FAMILY INCOME
$51,412
AVG HOUSEHOLD INCOME
28.7%
WAGE / INCOME GAP [ % ]
71.3¢/ $1
WAGE / INCOME GAP [ $ ]
$10,123
FAMILY INCOME DEFICIT
0.42
INEQUALITY / GINI INDEX
10,828
TOTAL POPULATION
4,920
MALE POPULATION
5,908
FEMALE POPULATION
83.28
MALES / 100 FEMALES
120.08
FEMALES / 100 MALES
40.5
MEDIAN AGE
2.9
AVG FAMILY SIZE
2.4
AVG HOUSEHOLD SIZE
5,369
LABOR FORCE [ PEOPLE ]
62.1%
PERCENT IN LABOR FORCE
4.5%
UNEMPLOYMENT RATE
Van Wert Zip Codes
Income in Van Wert
Income Overview in Van Wert
Per Capita Income in Van Wert is $29,026, while median incomes of families and households are $59,022 and $51,412 respectively.
| Characteristic | Number | Measure |
| Per Capita Income | 10,828 | $29,026 |
| Median Family Income | 2,796 | $59,022 |
| Mean Family Income | 2,796 | $77,236 |
| Median Household Income | 4,485 | $51,412 |
| Mean Household Income | 4,485 | $66,877 |
| Income Deficit | 2,796 | $10,123 |
| Wage / Income Gap (%) | 10,828 | 28.74% |
| Wage / Income Gap ($) | 10,828 | 71.26¢ per $1 |
| Gini / Inequality Index | 10,828 | 0.42 |
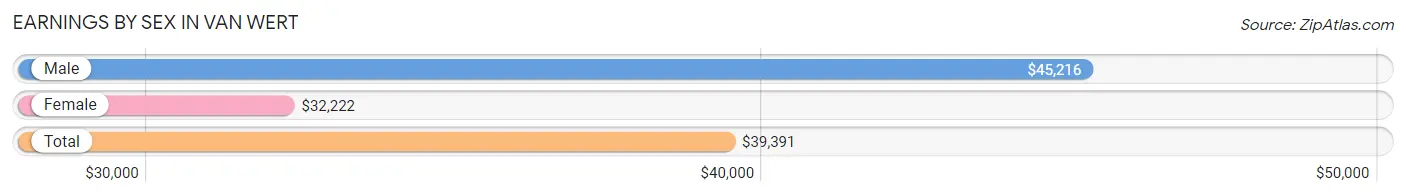
Earnings by Sex in Van Wert
Average Earnings in Van Wert are $39,391, $45,216 for men and $32,222 for women, a difference of 28.7%.
| Sex | Number | Average Earnings |
| Male | 2,705 (48.3%) | $45,216 |
| Female | 2,892 (51.7%) | $32,222 |
| Total | 5,597 (100.0%) | $39,391 |
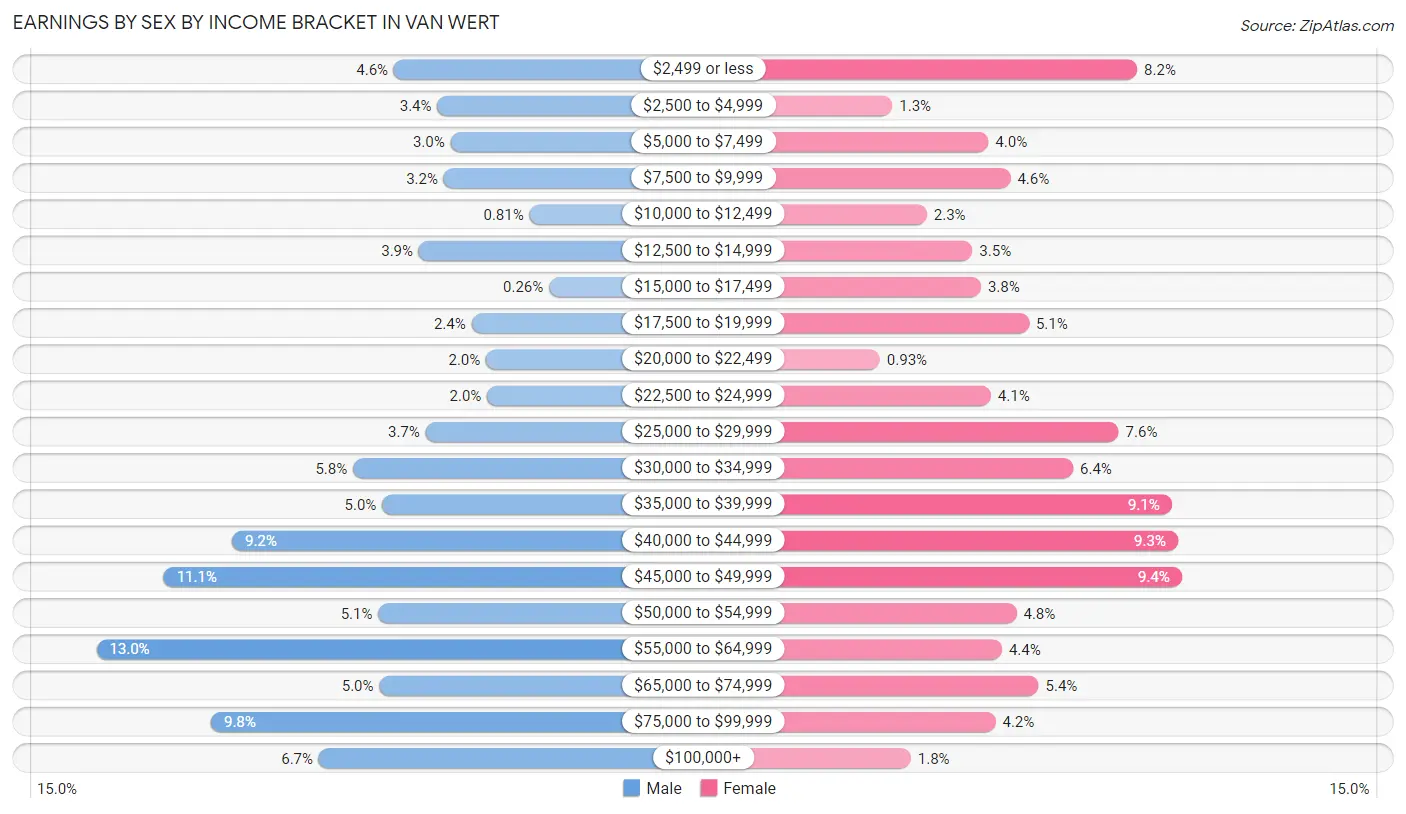
Earnings by Sex by Income Bracket in Van Wert
The most common earnings brackets in Van Wert are $55,000 to $64,999 for men (351 | 13.0%) and $45,000 to $49,999 for women (272 | 9.4%).
| Income | Male | Female |
| $2,499 or less | 125 (4.6%) | 236 (8.2%) |
| $2,500 to $4,999 | 92 (3.4%) | 37 (1.3%) |
| $5,000 to $7,499 | 82 (3.0%) | 115 (4.0%) |
| $7,500 to $9,999 | 87 (3.2%) | 133 (4.6%) |
| $10,000 to $12,499 | 22 (0.8%) | 65 (2.2%) |
| $12,500 to $14,999 | 106 (3.9%) | 102 (3.5%) |
| $15,000 to $17,499 | 7 (0.3%) | 109 (3.8%) |
| $17,500 to $19,999 | 66 (2.4%) | 148 (5.1%) |
| $20,000 to $22,499 | 55 (2.0%) | 27 (0.9%) |
| $22,500 to $24,999 | 54 (2.0%) | 117 (4.1%) |
| $25,000 to $29,999 | 101 (3.7%) | 221 (7.6%) |
| $30,000 to $34,999 | 156 (5.8%) | 184 (6.4%) |
| $35,000 to $39,999 | 134 (5.0%) | 264 (9.1%) |
| $40,000 to $44,999 | 248 (9.2%) | 269 (9.3%) |
| $45,000 to $49,999 | 300 (11.1%) | 272 (9.4%) |
| $50,000 to $54,999 | 137 (5.1%) | 138 (4.8%) |
| $55,000 to $64,999 | 351 (13.0%) | 126 (4.4%) |
| $65,000 to $74,999 | 136 (5.0%) | 156 (5.4%) |
| $75,000 to $99,999 | 264 (9.8%) | 121 (4.2%) |
| $100,000+ | 182 (6.7%) | 52 (1.8%) |
| Total | 2,705 (100.0%) | 2,892 (100.0%) |
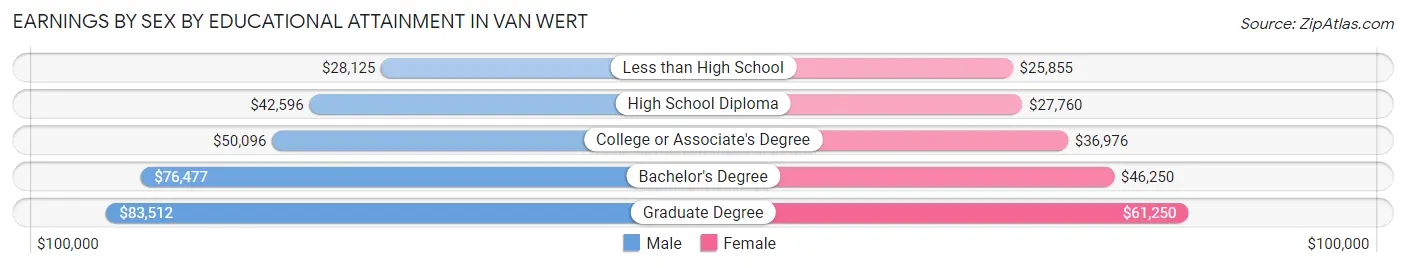
Earnings by Sex by Educational Attainment in Van Wert
Average earnings in Van Wert are $46,927 for men and $36,144 for women, a difference of 23.0%. Men with an educational attainment of graduate degree enjoy the highest average annual earnings of $83,512, while those with less than high school education earn the least with $28,125. Women with an educational attainment of graduate degree earn the most with the average annual earnings of $61,250, while those with less than high school education have the smallest earnings of $25,855.
| Educational Attainment | Male Income | Female Income |
| Less than High School | $28,125 | $25,855 |
| High School Diploma | $42,596 | $27,760 |
| College or Associate's Degree | $50,096 | $36,976 |
| Bachelor's Degree | $76,477 | $46,250 |
| Graduate Degree | $83,512 | $61,250 |
| Total | $46,927 | $36,144 |
Family Income in Van Wert
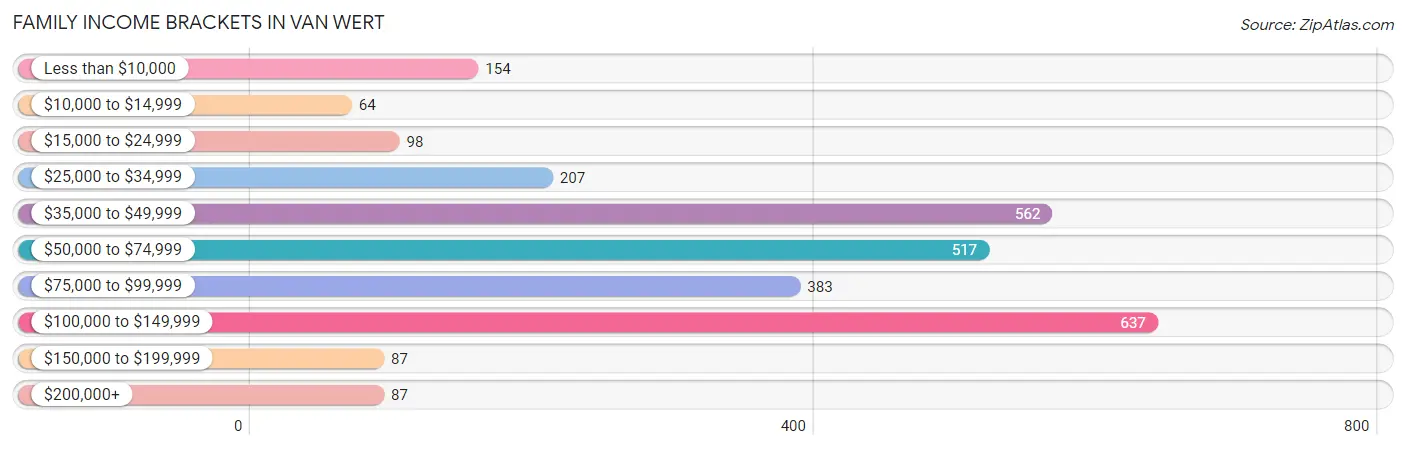
Family Income Brackets in Van Wert
According to the Van Wert family income data, there are 637 families falling into the $100,000 to $149,999 income range, which is the most common income bracket and makes up 22.8% of all families. Conversely, the $10,000 to $14,999 income bracket is the least frequent group with only 64 families (2.3%) belonging to this category.
| Income Bracket | # Families | % Families |
| Less than $10,000 | 154 | 5.5% |
| $10,000 to $14,999 | 64 | 2.3% |
| $15,000 to $24,999 | 98 | 3.5% |
| $25,000 to $34,999 | 207 | 7.4% |
| $35,000 to $49,999 | 562 | 20.1% |
| $50,000 to $74,999 | 517 | 18.5% |
| $75,000 to $99,999 | 383 | 13.7% |
| $100,000 to $149,999 | 637 | 22.8% |
| $150,000 to $199,999 | 87 | 3.1% |
| $200,000+ | 87 | 3.1% |
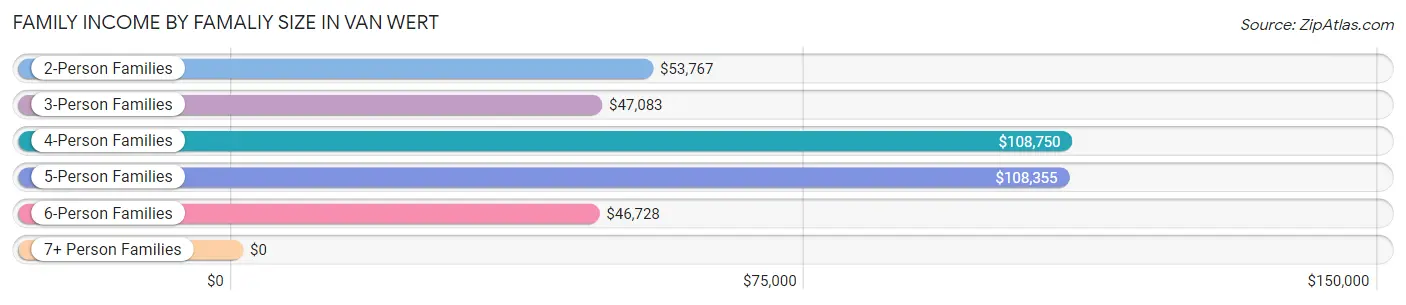
Family Income by Famaliy Size in Van Wert
4-person families (465 | 16.6%) account for the highest median family income in Van Wert with $108,750 per family, while 4-person families (465 | 16.6%) have the highest median income of $27,188 per family member.
| Income Bracket | # Families | Median Income |
| 2-Person Families | 1,398 (50.0%) | $53,767 |
| 3-Person Families | 677 (24.2%) | $47,083 |
| 4-Person Families | 465 (16.6%) | $108,750 |
| 5-Person Families | 157 (5.6%) | $108,355 |
| 6-Person Families | 83 (3.0%) | $46,728 |
| 7+ Person Families | 16 (0.6%) | $0 |
| Total | 2,796 (100.0%) | $59,022 |
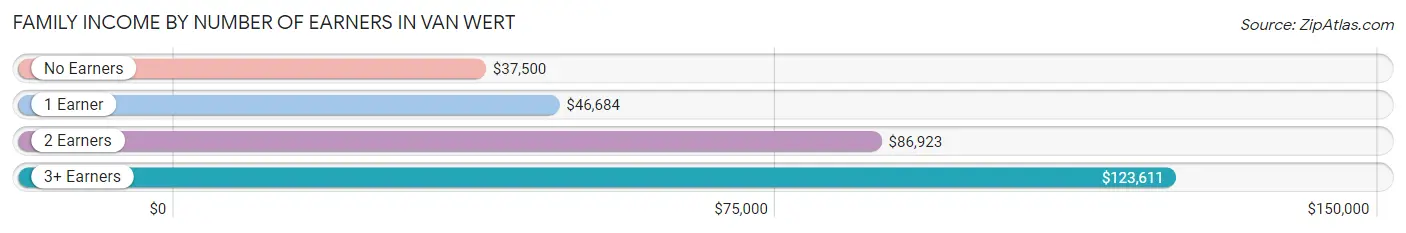
Family Income by Number of Earners in Van Wert
The median family income in Van Wert is $59,022, with families comprising 3+ earners (272) having the highest median family income of $123,611, while families with no earners (448) have the lowest median family income of $37,500, accounting for 9.7% and 16.0% of families, respectively.
| Number of Earners | # Families | Median Income |
| No Earners | 448 (16.0%) | $37,500 |
| 1 Earner | 994 (35.5%) | $46,684 |
| 2 Earners | 1,082 (38.7%) | $86,923 |
| 3+ Earners | 272 (9.7%) | $123,611 |
| Total | 2,796 (100.0%) | $59,022 |
Household Income in Van Wert
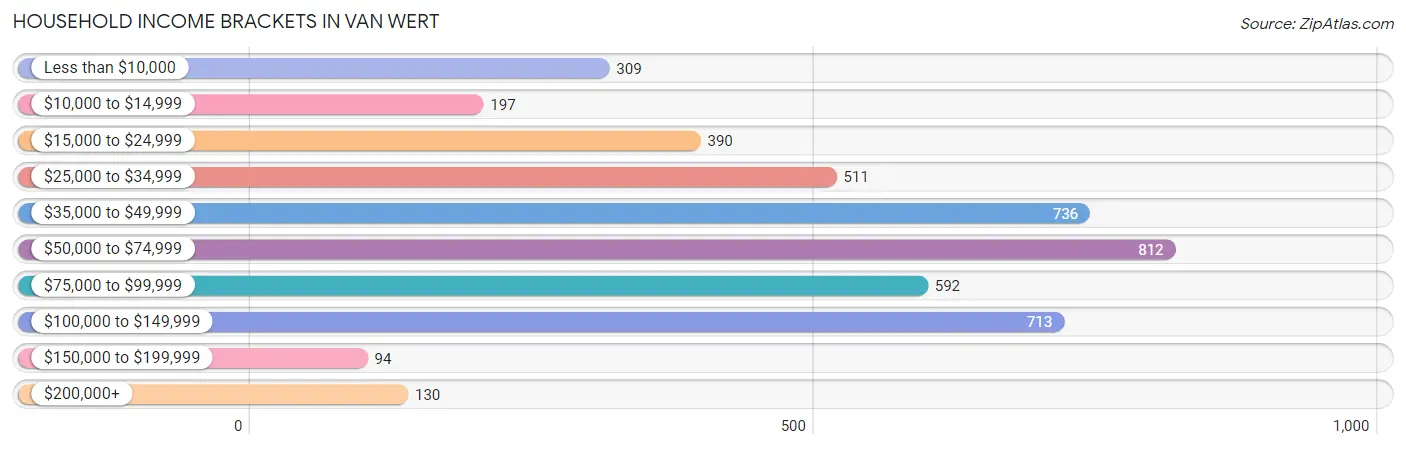
Household Income Brackets in Van Wert
With 812 households falling in the category, the $50,000 to $74,999 income range is the most frequent in Van Wert, accounting for 18.1% of all households. In contrast, only 94 households (2.1%) fall into the $150,000 to $199,999 income bracket, making it the least populous group.
| Income Bracket | # Households | % Households |
| Less than $10,000 | 309 | 6.9% |
| $10,000 to $14,999 | 197 | 4.4% |
| $15,000 to $24,999 | 390 | 8.7% |
| $25,000 to $34,999 | 511 | 11.4% |
| $35,000 to $49,999 | 736 | 16.4% |
| $50,000 to $74,999 | 812 | 18.1% |
| $75,000 to $99,999 | 592 | 13.2% |
| $100,000 to $149,999 | 713 | 15.9% |
| $150,000 to $199,999 | 94 | 2.1% |
| $200,000+ | 130 | 2.9% |
Household Income by Householder Age in Van Wert
The median household income in Van Wert is $51,412, with the highest median household income of $60,644 found in the 25 to 44 years age bracket for the primary householder. A total of 1,477 households (32.9%) fall into this category. Meanwhile, the 65+ years age bracket for the primary householder has the lowest median household income of $40,962, with 1,346 households (30.0%) in this group.
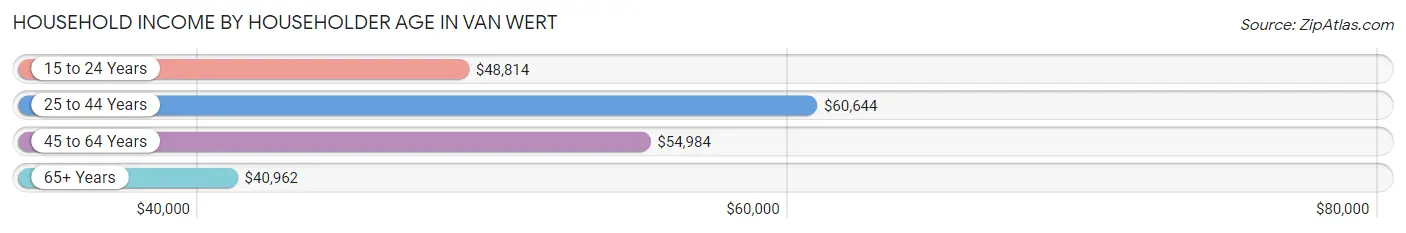
| Income Bracket | # Households | Median Income |
| 15 to 24 Years | 131 (2.9%) | $48,814 |
| 25 to 44 Years | 1,477 (32.9%) | $60,644 |
| 45 to 64 Years | 1,531 (34.1%) | $54,984 |
| 65+ Years | 1,346 (30.0%) | $40,962 |
| Total | 4,485 (100.0%) | $51,412 |
Poverty in Van Wert
Income Below Poverty by Sex and Age in Van Wert
With 11.9% poverty level for males and 15.0% for females among the residents of Van Wert, 6 to 11 year old males and 6 to 11 year old females are the most vulnerable to poverty, with 105 males (32.4%) and 110 females (30.8%) in their respective age groups living below the poverty level.
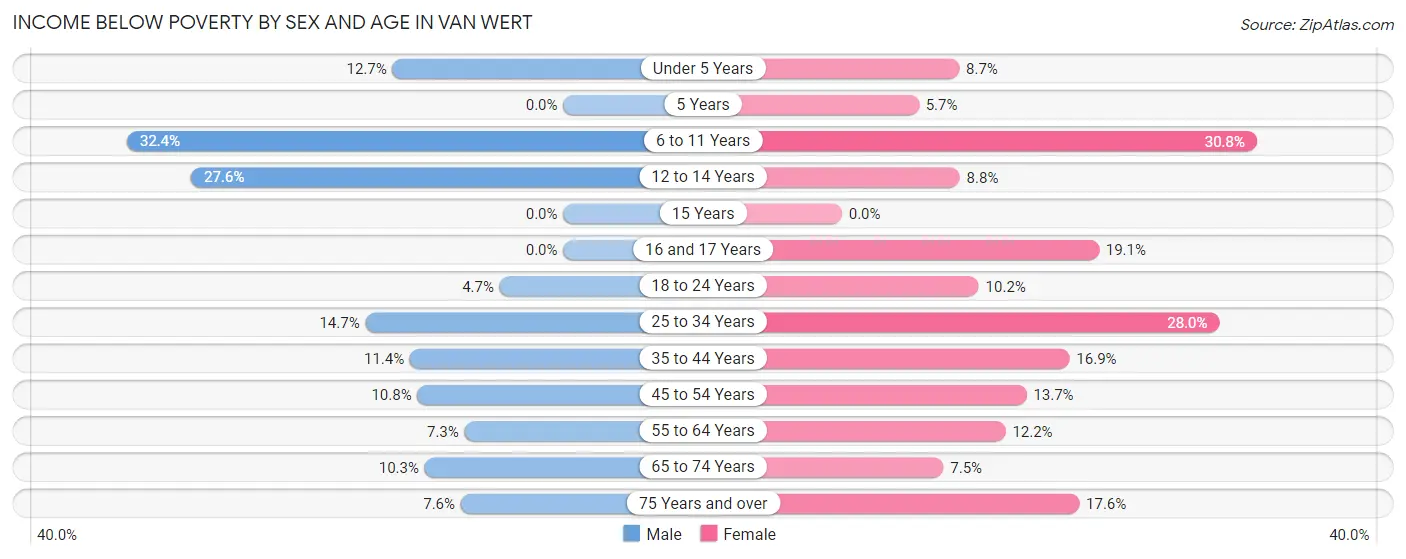
| Age Bracket | Male | Female |
| Under 5 Years | 45 (12.7%) | 35 (8.7%) |
| 5 Years | 0 (0.0%) | 4 (5.7%) |
| 6 to 11 Years | 105 (32.4%) | 110 (30.8%) |
| 12 to 14 Years | 55 (27.6%) | 21 (8.7%) |
| 15 Years | 0 (0.0%) | 0 (0.0%) |
| 16 and 17 Years | 0 (0.0%) | 33 (19.1%) |
| 18 to 24 Years | 17 (4.7%) | 57 (10.2%) |
| 25 to 34 Years | 94 (14.7%) | 162 (28.0%) |
| 35 to 44 Years | 70 (11.4%) | 132 (16.9%) |
| 45 to 54 Years | 78 (10.8%) | 82 (13.7%) |
| 55 to 64 Years | 41 (7.3%) | 91 (12.1%) |
| 65 to 74 Years | 49 (10.3%) | 49 (7.5%) |
| 75 Years and over | 21 (7.6%) | 89 (17.6%) |
| Total | 575 (11.9%) | 865 (15.0%) |
Income Above Poverty by Sex and Age in Van Wert
According to the poverty statistics in Van Wert, males aged 5 years and females aged 15 years are the age groups that are most secure financially, with 100.0% of males and 100.0% of females in these age groups living above the poverty line.
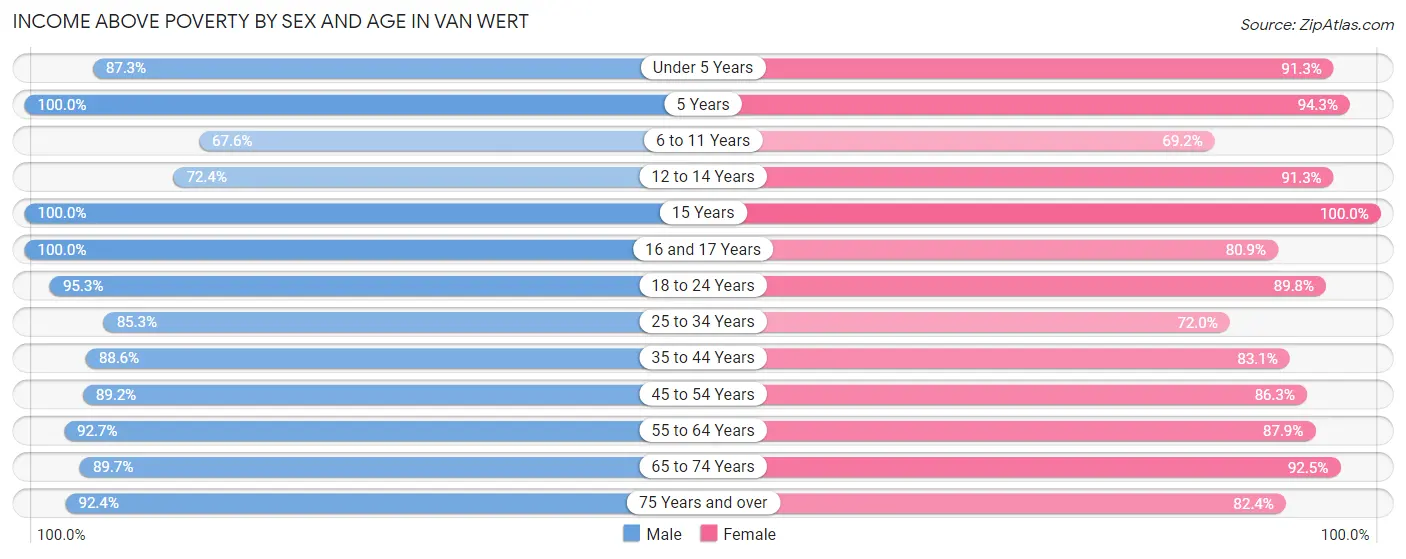
| Age Bracket | Male | Female |
| Under 5 Years | 310 (87.3%) | 367 (91.3%) |
| 5 Years | 92 (100.0%) | 66 (94.3%) |
| 6 to 11 Years | 219 (67.6%) | 247 (69.2%) |
| 12 to 14 Years | 144 (72.4%) | 219 (91.2%) |
| 15 Years | 27 (100.0%) | 82 (100.0%) |
| 16 and 17 Years | 198 (100.0%) | 140 (80.9%) |
| 18 to 24 Years | 343 (95.3%) | 504 (89.8%) |
| 25 to 34 Years | 546 (85.3%) | 416 (72.0%) |
| 35 to 44 Years | 545 (88.6%) | 649 (83.1%) |
| 45 to 54 Years | 642 (89.2%) | 516 (86.3%) |
| 55 to 64 Years | 518 (92.7%) | 658 (87.8%) |
| 65 to 74 Years | 427 (89.7%) | 601 (92.5%) |
| 75 Years and over | 255 (92.4%) | 416 (82.4%) |
| Total | 4,266 (88.1%) | 4,881 (85.0%) |
Income Below Poverty Among Married-Couple Families in Van Wert
The poverty statistics for married-couple families in Van Wert show that 4.2% or 76 of the total 1,802 families live below the poverty line. Families with 3 or 4 children have the highest poverty rate of 5.9%, comprising of 8 families. On the other hand, families with 5 or more children have the lowest poverty rate of 0.0%, which includes 0 families.
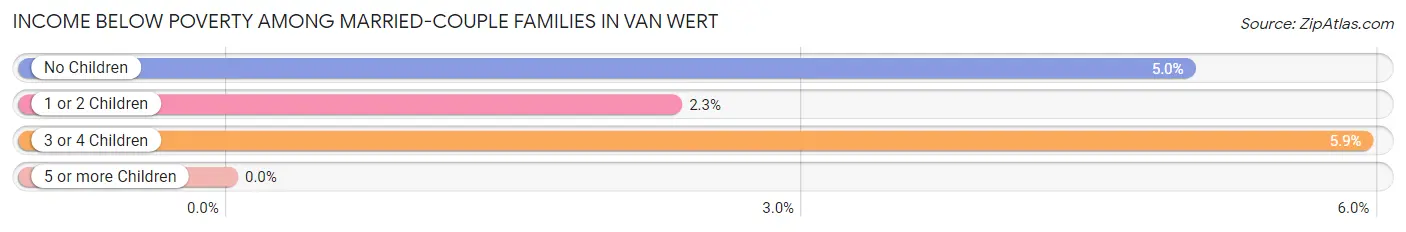
| Children | Above Poverty | Below Poverty |
| No Children | 1,044 (95.0%) | 55 (5.0%) |
| 1 or 2 Children | 547 (97.7%) | 13 (2.3%) |
| 3 or 4 Children | 127 (94.1%) | 8 (5.9%) |
| 5 or more Children | 8 (100.0%) | 0 (0.0%) |
| Total | 1,726 (95.8%) | 76 (4.2%) |
Income Below Poverty Among Single-Parent Households in Van Wert
According to the poverty data in Van Wert, 40.6% or 103 single-father households and 17.7% or 131 single-mother households are living below the poverty line. Among single-father households, those with 3 or 4 children have the highest poverty rate, with 24 households (85.7%) experiencing poverty. Likewise, among single-mother households, those with 3 or 4 children have the highest poverty rate, with 15 households (42.9%) falling below the poverty line.
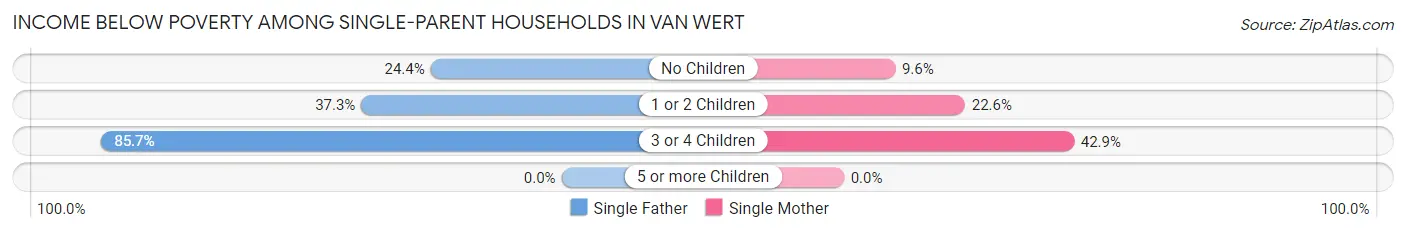
| Children | Single Father | Single Mother |
| No Children | 10 (24.4%) | 26 (9.6%) |
| 1 or 2 Children | 69 (37.3%) | 90 (22.6%) |
| 3 or 4 Children | 24 (85.7%) | 15 (42.9%) |
| 5 or more Children | 0 (0.0%) | 0 (0.0%) |
| Total | 103 (40.6%) | 131 (17.7%) |
Income Below Poverty Among Married-Couple vs Single-Parent Households in Van Wert
The poverty data for Van Wert shows that 76 of the married-couple family households (4.2%) and 234 of the single-parent households (23.5%) are living below the poverty level. Within the married-couple family households, those with 3 or 4 children have the highest poverty rate, with 8 households (5.9%) falling below the poverty line. Among the single-parent households, those with 3 or 4 children have the highest poverty rate, with 39 household (61.9%) living below poverty.
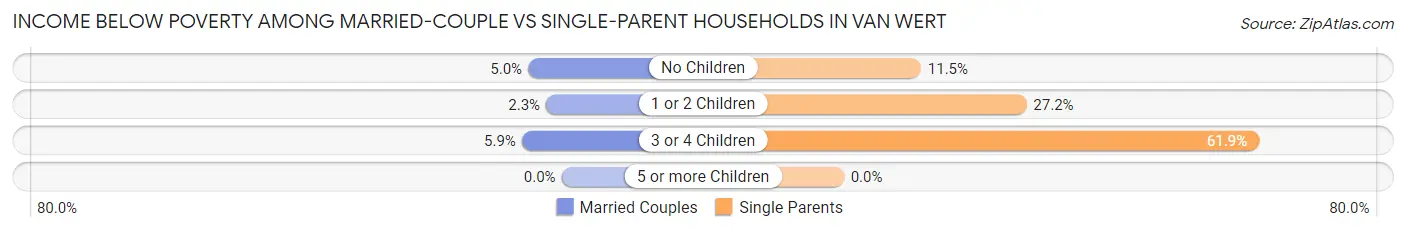
| Children | Married-Couple Families | Single-Parent Households |
| No Children | 55 (5.0%) | 36 (11.5%) |
| 1 or 2 Children | 13 (2.3%) | 159 (27.2%) |
| 3 or 4 Children | 8 (5.9%) | 39 (61.9%) |
| 5 or more Children | 0 (0.0%) | 0 (0.0%) |
| Total | 76 (4.2%) | 234 (23.5%) |
Race in Van Wert
The most populous races in Van Wert are White / Caucasian (9,843 | 90.9%), Two or more Races (642 | 5.9%), and Hispanic or Latino (582 | 5.4%).
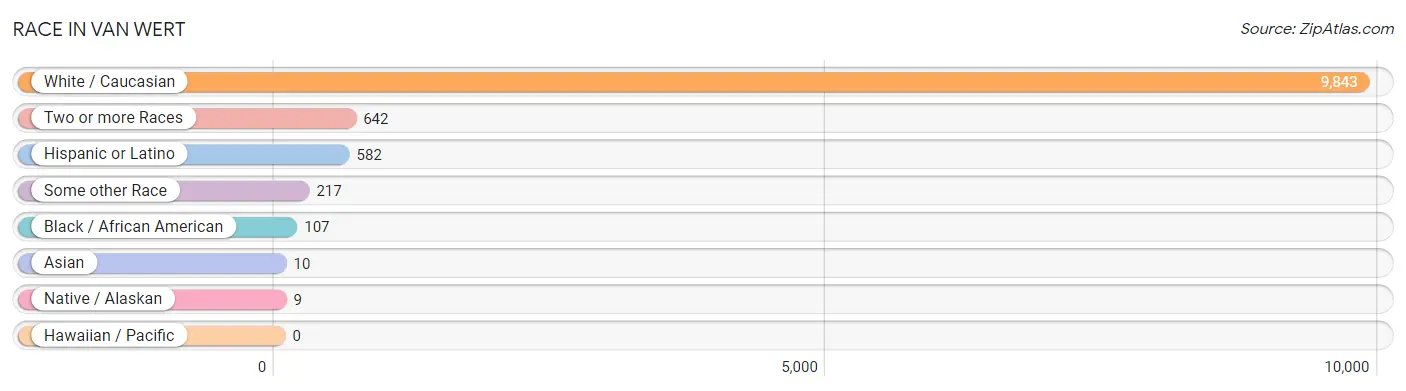
| Race | # Population | % Population |
| Asian | 10 | 0.1% |
| Black / African American | 107 | 1.0% |
| Hawaiian / Pacific | 0 | 0.0% |
| Hispanic or Latino | 582 | 5.4% |
| Native / Alaskan | 9 | 0.1% |
| White / Caucasian | 9,843 | 90.9% |
| Two or more Races | 642 | 5.9% |
| Some other Race | 217 | 2.0% |
| Total | 10,828 | 100.0% |
Ancestry in Van Wert
The most populous ancestries reported in Van Wert are German (3,575 | 33.0%), English (1,198 | 11.1%), Irish (1,093 | 10.1%), American (726 | 6.7%), and Mexican (485 | 4.5%), together accounting for 65.3% of all Van Wert residents.
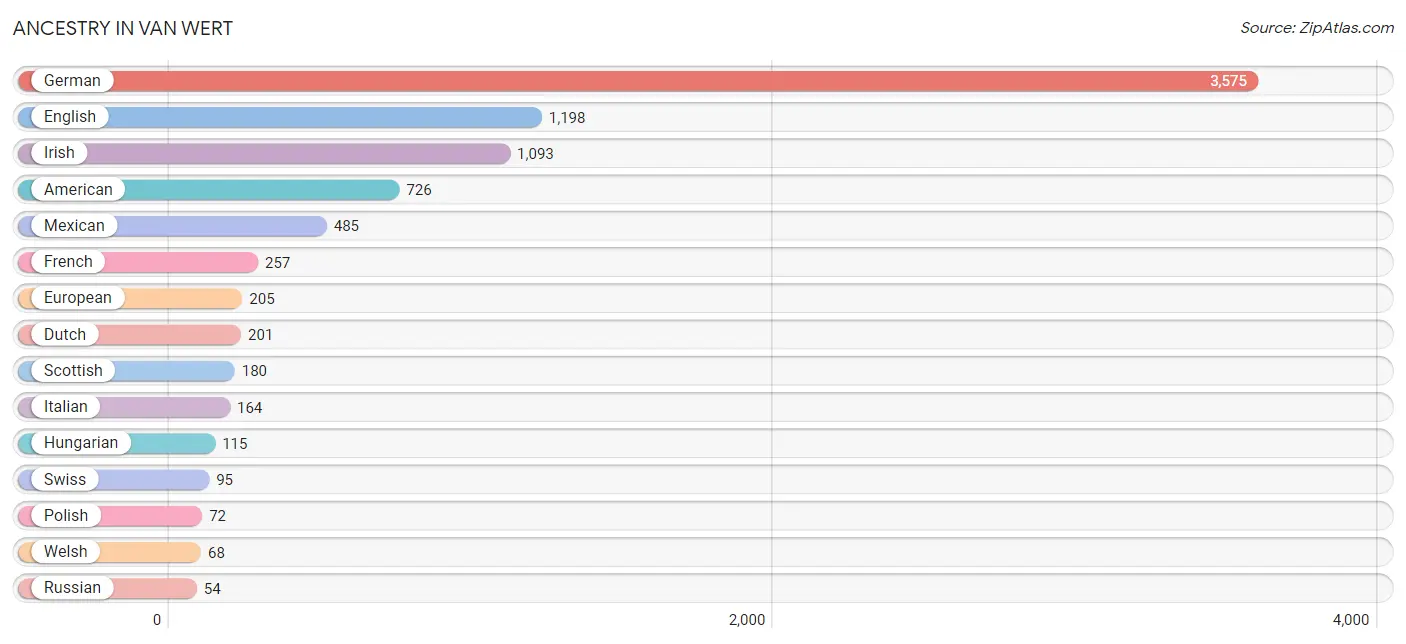
| Ancestry | # Population | % Population |
| African | 12 | 0.1% |
| American | 726 | 6.7% |
| Austrian | 9 | 0.1% |
| Barbadian | 9 | 0.1% |
| Belgian | 8 | 0.1% |
| Blackfeet | 3 | 0.0% |
| British | 24 | 0.2% |
| British West Indian | 9 | 0.1% |
| Burmese | 5 | 0.1% |
| Celtic | 4 | 0.0% |
| Central American | 11 | 0.1% |
| Cherokee | 4 | 0.0% |
| Colombian | 8 | 0.1% |
| Costa Rican | 11 | 0.1% |
| Dutch | 201 | 1.9% |
| English | 1,198 | 11.1% |
| European | 205 | 1.9% |
| French | 257 | 2.4% |
| French Canadian | 18 | 0.2% |
| German | 3,575 | 33.0% |
| Ghanaian | 7 | 0.1% |
| Hungarian | 115 | 1.1% |
| Irish | 1,093 | 10.1% |
| Iroquois | 9 | 0.1% |
| Italian | 164 | 1.5% |
| Korean | 10 | 0.1% |
| Mexican | 485 | 4.5% |
| Norwegian | 23 | 0.2% |
| Polish | 72 | 0.7% |
| Puerto Rican | 49 | 0.4% |
| Russian | 54 | 0.5% |
| Scotch-Irish | 23 | 0.2% |
| Scottish | 180 | 1.7% |
| South African | 3 | 0.0% |
| South American | 8 | 0.1% |
| Spaniard | 29 | 0.3% |
| Subsaharan African | 22 | 0.2% |
| Swedish | 47 | 0.4% |
| Swiss | 95 | 0.9% |
| Welsh | 68 | 0.6% |
| Yup'ik | 4 | 0.0% | View All 41 Rows |
Immigrants in Van Wert
The most numerous immigrant groups reported in Van Wert came from Latin America (99 | 0.9%), Central America (71 | 0.7%), Mexico (60 | 0.5%), South America (28 | 0.3%), and Colombia (21 | 0.2%), together accounting for 2.6% of all Van Wert residents.
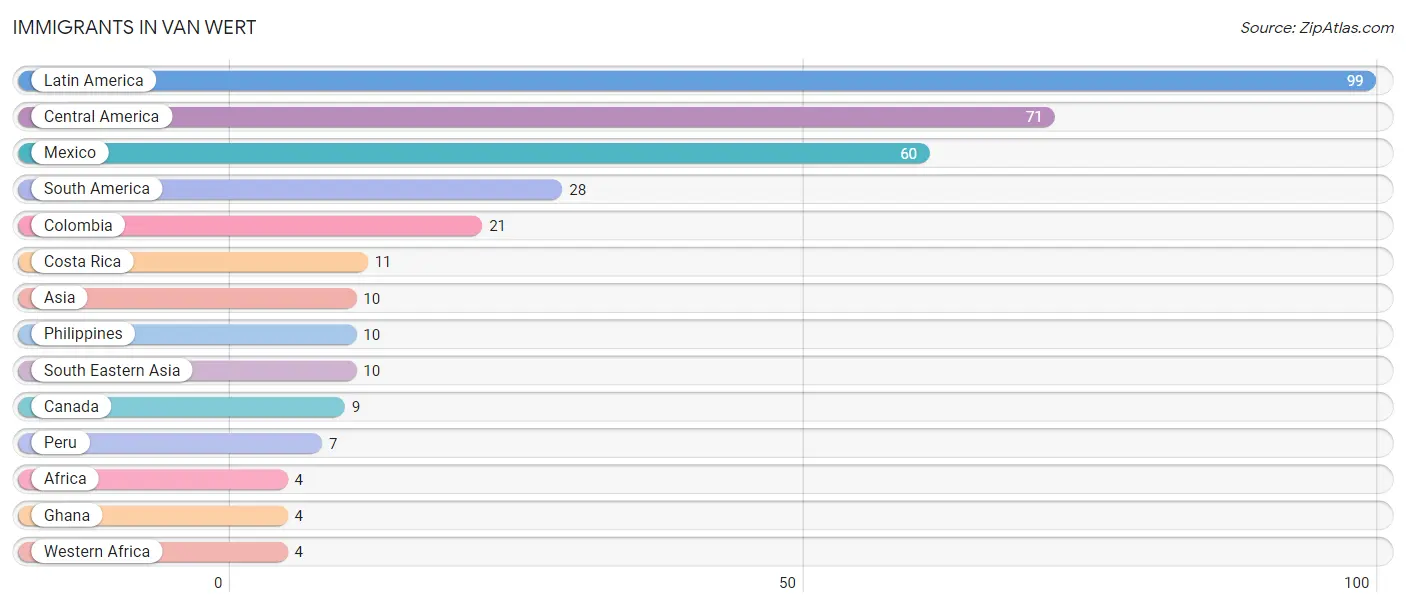
| Immigration Origin | # Population | % Population |
| Africa | 4 | 0.0% |
| Asia | 10 | 0.1% |
| Canada | 9 | 0.1% |
| Central America | 71 | 0.7% |
| Colombia | 21 | 0.2% |
| Costa Rica | 11 | 0.1% |
| Ghana | 4 | 0.0% |
| Latin America | 99 | 0.9% |
| Mexico | 60 | 0.5% |
| Peru | 7 | 0.1% |
| Philippines | 10 | 0.1% |
| South America | 28 | 0.3% |
| South Eastern Asia | 10 | 0.1% |
| Western Africa | 4 | 0.0% | View All 14 Rows |
Sex and Age in Van Wert
Sex and Age in Van Wert
The most populous age groups in Van Wert are 45 to 49 Years (388 | 7.9%) for men and 40 to 44 Years (448 | 7.6%) for women.
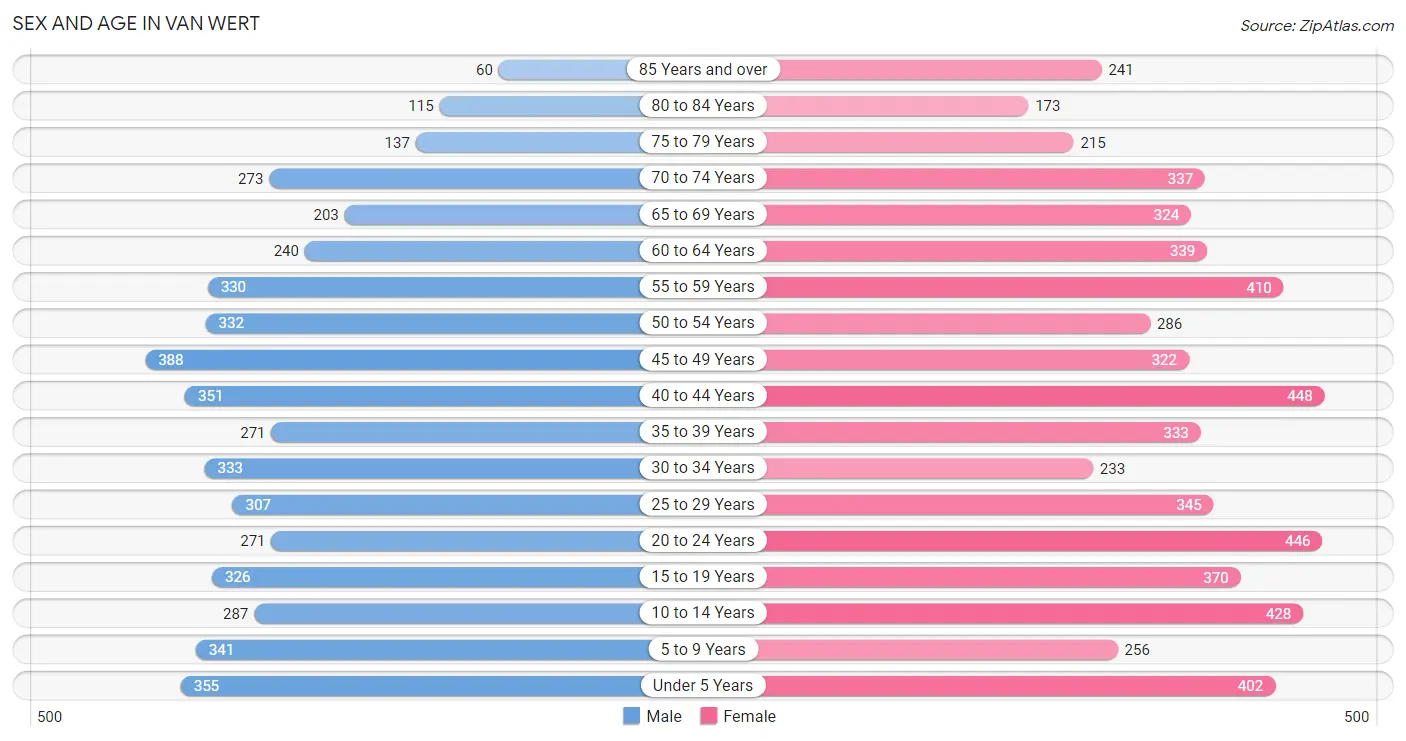
| Age Bracket | Male | Female |
| Under 5 Years | 355 (7.2%) | 402 (6.8%) |
| 5 to 9 Years | 341 (6.9%) | 256 (4.3%) |
| 10 to 14 Years | 287 (5.8%) | 428 (7.2%) |
| 15 to 19 Years | 326 (6.6%) | 370 (6.3%) |
| 20 to 24 Years | 271 (5.5%) | 446 (7.5%) |
| 25 to 29 Years | 307 (6.2%) | 345 (5.8%) |
| 30 to 34 Years | 333 (6.8%) | 233 (3.9%) |
| 35 to 39 Years | 271 (5.5%) | 333 (5.6%) |
| 40 to 44 Years | 351 (7.1%) | 448 (7.6%) |
| 45 to 49 Years | 388 (7.9%) | 322 (5.4%) |
| 50 to 54 Years | 332 (6.8%) | 286 (4.8%) |
| 55 to 59 Years | 330 (6.7%) | 410 (6.9%) |
| 60 to 64 Years | 240 (4.9%) | 339 (5.7%) |
| 65 to 69 Years | 203 (4.1%) | 324 (5.5%) |
| 70 to 74 Years | 273 (5.6%) | 337 (5.7%) |
| 75 to 79 Years | 137 (2.8%) | 215 (3.6%) |
| 80 to 84 Years | 115 (2.3%) | 173 (2.9%) |
| 85 Years and over | 60 (1.2%) | 241 (4.1%) |
| Total | 4,920 (100.0%) | 5,908 (100.0%) |
Families and Households in Van Wert
Median Family Size in Van Wert
The median family size in Van Wert is 2.91 persons per family, with married-couple families (1,802 | 64.4%) accounting for the largest median family size of 2.99 persons per family. On the other hand, single male/father families (254 | 9.1%) represent the smallest median family size with 2.42 persons per family.
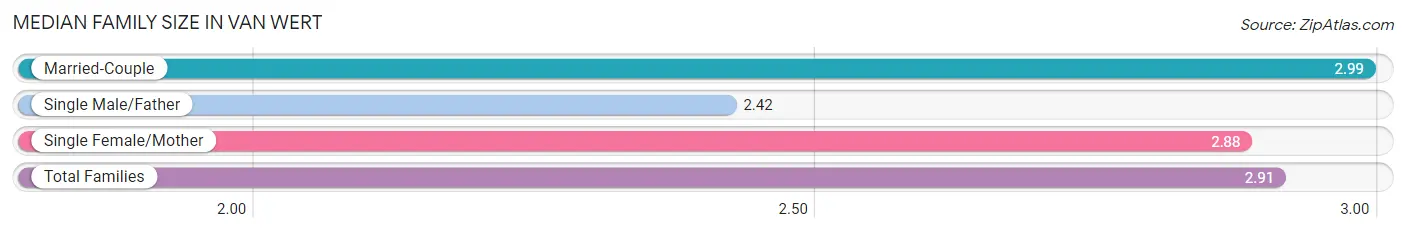
| Family Type | # Families | Family Size |
| Married-Couple | 1,802 (64.4%) | 2.99 |
| Single Male/Father | 254 (9.1%) | 2.42 |
| Single Female/Mother | 740 (26.5%) | 2.88 |
| Total Families | 2,796 (100.0%) | 2.91 |
Median Household Size in Van Wert
The median household size in Van Wert is 2.36 persons per household, with single female/mother households (740 | 16.5%) accounting for the largest median household size of 3.19 persons per household. non-family households (1,689 | 37.7%) represent the smallest median household size with 1.18 persons per household.
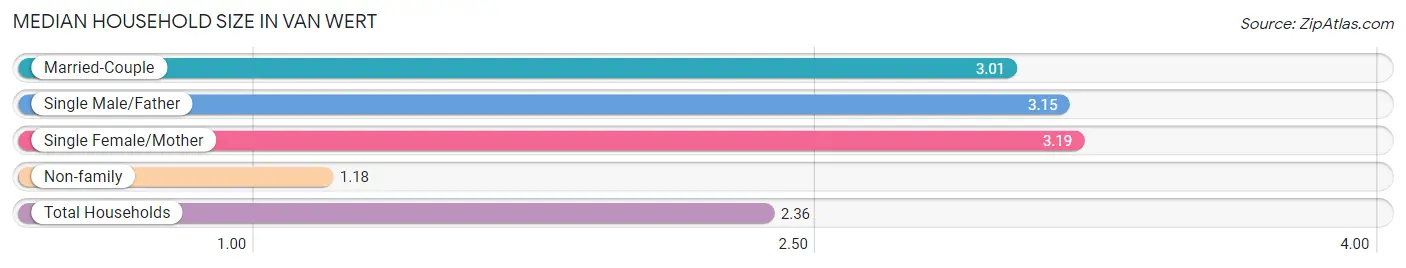
| Household Type | # Households | Household Size |
| Married-Couple | 1,802 (40.2%) | 3.01 |
| Single Male/Father | 254 (5.7%) | 3.15 |
| Single Female/Mother | 740 (16.5%) | 3.19 |
| Non-family | 1,689 (37.7%) | 1.18 |
| Total Households | 4,485 (100.0%) | 2.36 |
Household Size by Marriage Status in Van Wert
Out of a total of 4,485 households in Van Wert, 2,796 (62.3%) are family households, while 1,689 (37.7%) are nonfamily households. The most numerous type of family households are 2-person households, comprising 1,203, and the most common type of nonfamily households are 1-person households, comprising 1,465.
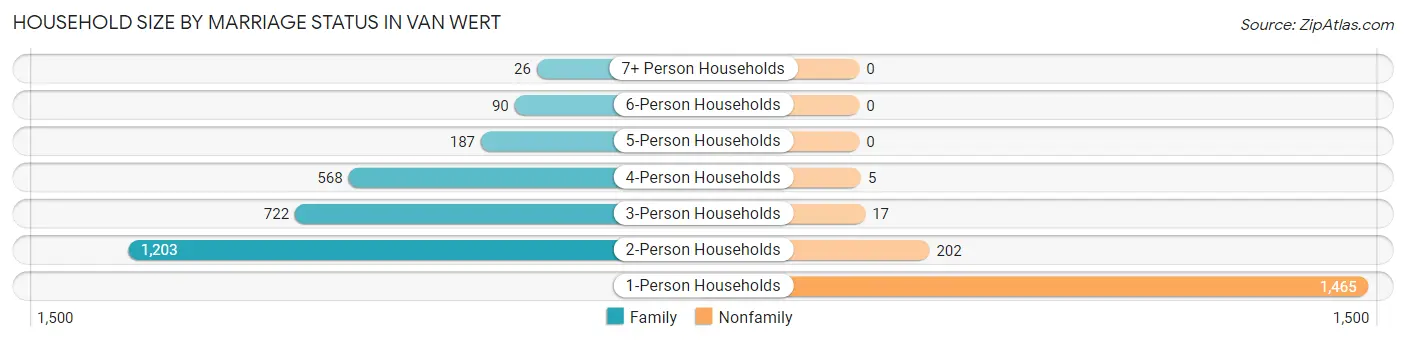
| Household Size | Family Households | Nonfamily Households |
| 1-Person Households | - | 1,465 (32.7%) |
| 2-Person Households | 1,203 (26.8%) | 202 (4.5%) |
| 3-Person Households | 722 (16.1%) | 17 (0.4%) |
| 4-Person Households | 568 (12.7%) | 5 (0.1%) |
| 5-Person Households | 187 (4.2%) | 0 (0.0%) |
| 6-Person Households | 90 (2.0%) | 0 (0.0%) |
| 7+ Person Households | 26 (0.6%) | 0 (0.0%) |
| Total | 2,796 (62.3%) | 1,689 (37.7%) |
Female Fertility in Van Wert
Fertility by Age in Van Wert
Average fertility rate in Van Wert is 69.0 births per 1,000 women. Women in the age bracket of 20 to 34 years have the highest fertility rate with 113.0 births per 1,000 women. Women in the age bracket of 20 to 34 years acount for 67.4% of all women with births.
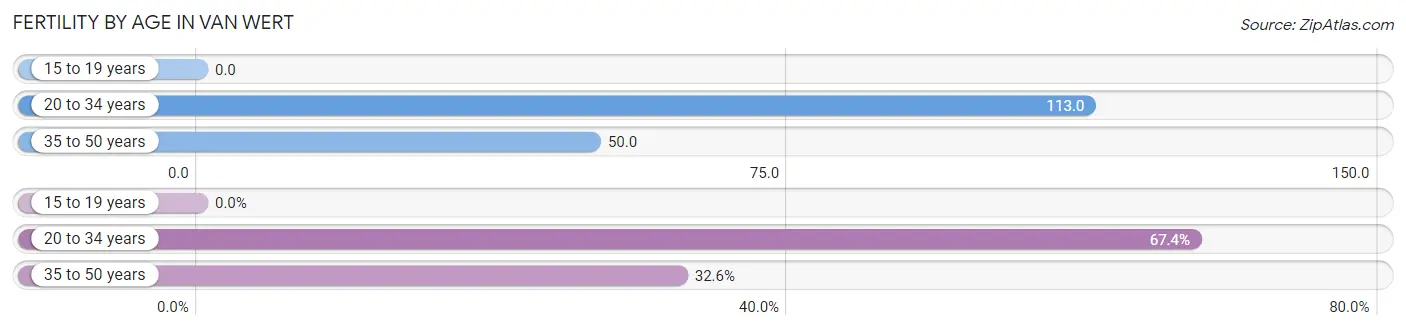
| Age Bracket | Women with Births | Births / 1,000 Women |
| 15 to 19 years | 0 (0.0%) | 0.0 |
| 20 to 34 years | 116 (67.4%) | 113.0 |
| 35 to 50 years | 56 (32.6%) | 50.0 |
| Total | 172 (100.0%) | 69.0 |
Fertility by Age by Marriage Status in Van Wert
57.0% of women with births (172) in Van Wert are married. The highest percentage of unmarried women with births falls into 20 to 34 years age bracket with 43.1% of them unmarried at the time of birth, while the lowest percentage of unmarried women with births belong to 35 to 50 years age bracket with 42.9% of them unmarried.
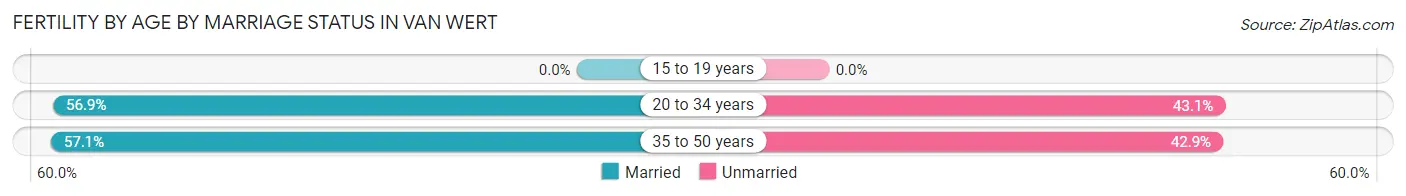
| Age Bracket | Married | Unmarried |
| 15 to 19 years | 0 (0.0%) | 0 (0.0%) |
| 20 to 34 years | 66 (56.9%) | 50 (43.1%) |
| 35 to 50 years | 32 (57.1%) | 24 (42.9%) |
| Total | 98 (57.0%) | 74 (43.0%) |
Fertility by Education in Van Wert
Average fertility rate in Van Wert is 69.0 births per 1,000 women. Women with the education attainment of graduate degree have the highest fertility rate of 282.0 births per 1,000 women, while women with the education attainment of college or associate's degree have the lowest fertility at 39.0 births per 1,000 women. Women with the education attainment of graduate degree represent 28.5% of all women with births.
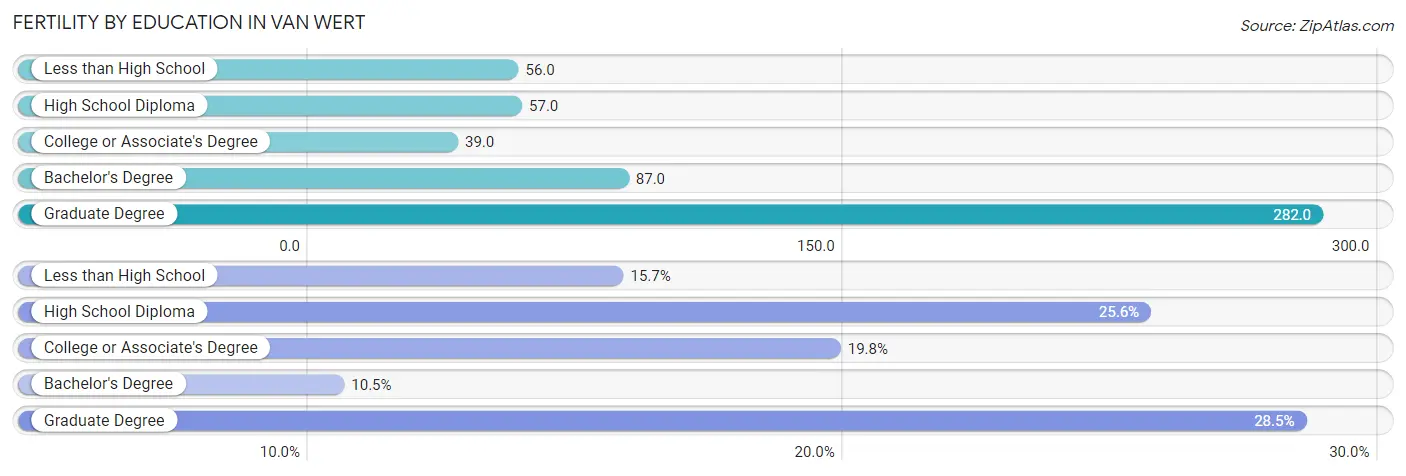
| Educational Attainment | Women with Births | Births / 1,000 Women |
| Less than High School | 27 (15.7%) | 56.0 |
| High School Diploma | 44 (25.6%) | 57.0 |
| College or Associate's Degree | 34 (19.8%) | 39.0 |
| Bachelor's Degree | 18 (10.5%) | 87.0 |
| Graduate Degree | 49 (28.5%) | 282.0 |
| Total | 172 (100.0%) | 69.0 |
Fertility by Education by Marriage Status in Van Wert
43.0% of women with births in Van Wert are unmarried. Women with the educational attainment of bachelor's degree are most likely to be married with 100.0% of them married at childbirth, while women with the educational attainment of less than high school are least likely to be married with 100.0% of them unmarried at childbirth.
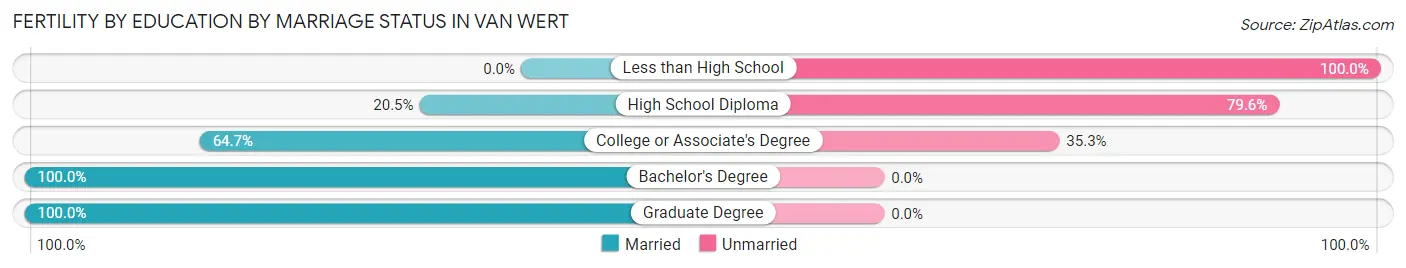
| Educational Attainment | Married | Unmarried |
| Less than High School | 0 (0.0%) | 27 (100.0%) |
| High School Diploma | 9 (20.4%) | 35 (79.5%) |
| College or Associate's Degree | 22 (64.7%) | 12 (35.3%) |
| Bachelor's Degree | 18 (100.0%) | 0 (0.0%) |
| Graduate Degree | 49 (100.0%) | 0 (0.0%) |
| Total | 98 (57.0%) | 74 (43.0%) |
Employment Characteristics in Van Wert
Employment by Class of Employer in Van Wert
Among the 5,041 employed individuals in Van Wert, private company employees (4,042 | 80.2%), local government employees (340 | 6.7%), and not-for-profit organizations (331 | 6.6%) make up the most common classes of employment.
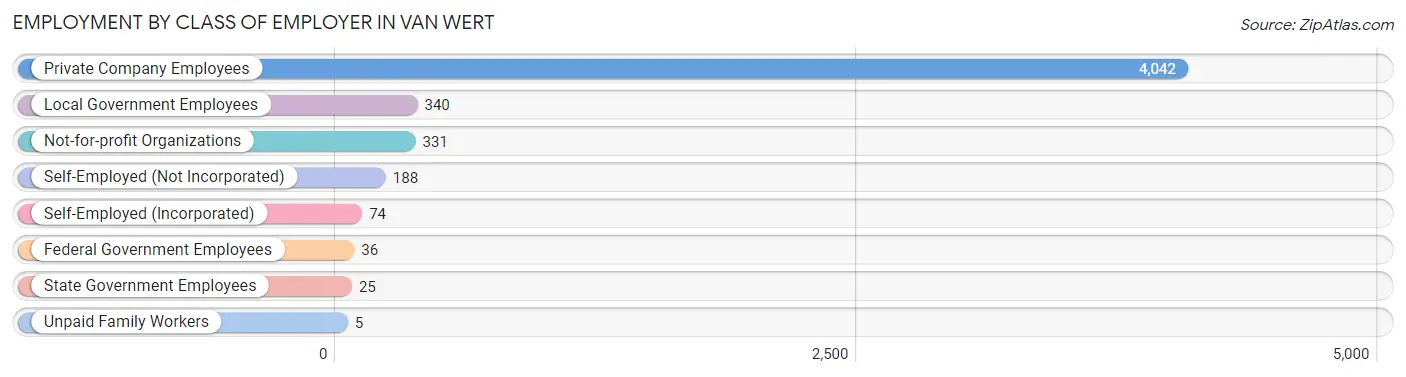
| Employer Class | # Employees | % Employees |
| Private Company Employees | 4,042 | 80.2% |
| Self-Employed (Incorporated) | 74 | 1.5% |
| Self-Employed (Not Incorporated) | 188 | 3.7% |
| Not-for-profit Organizations | 331 | 6.6% |
| Local Government Employees | 340 | 6.7% |
| State Government Employees | 25 | 0.5% |
| Federal Government Employees | 36 | 0.7% |
| Unpaid Family Workers | 5 | 0.1% |
| Total | 5,041 | 100.0% |
Employment Status by Age in Van Wert
According to the labor force statistics for Van Wert, out of the total population over 16 years of age (8,646), 62.1% or 5,369 individuals are in the labor force, with 4.5% or 242 of them unemployed. The age group with the highest labor force participation rate is 25 to 29 years, with 93.4% or 609 individuals in the labor force. Within the labor force, the 55 to 59 years age range has the highest percentage of unemployed individuals, with 22.1% or 129 of them being unemployed.
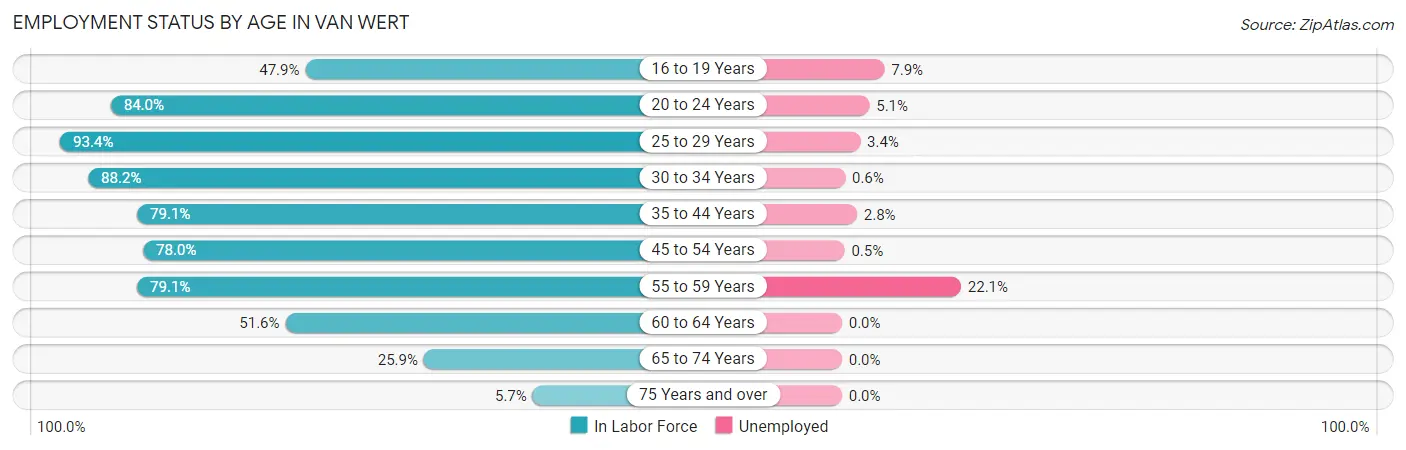
| Age Bracket | In Labor Force | Unemployed |
| 16 to 19 Years | 279 (47.9%) | 22 (7.9%) |
| 20 to 24 Years | 602 (84.0%) | 31 (5.1%) |
| 25 to 29 Years | 609 (93.4%) | 21 (3.4%) |
| 30 to 34 Years | 499 (88.2%) | 3 (0.6%) |
| 35 to 44 Years | 1,110 (79.1%) | 31 (2.8%) |
| 45 to 54 Years | 1,036 (78.0%) | 5 (0.5%) |
| 55 to 59 Years | 585 (79.1%) | 129 (22.1%) |
| 60 to 64 Years | 299 (51.6%) | 0 (0.0%) |
| 65 to 74 Years | 294 (25.9%) | 0 (0.0%) |
| 75 Years and over | 54 (5.7%) | 0 (0.0%) |
| Total | 5,369 (62.1%) | 242 (4.5%) |
Employment Status by Educational Attainment in Van Wert
According to labor force statistics for Van Wert, 78.5% of individuals (4,135) out of the total population between 25 and 64 years of age (5,268) are in the labor force, with 4.6% or 190 of them being unemployed. The group with the highest labor force participation rate are those with the educational attainment of bachelor's degree or higher, with 86.5% or 884 individuals in the labor force. Within the labor force, individuals with high school diploma education have the highest percentage of unemployment, with 6.8% or 106 of them being unemployed.
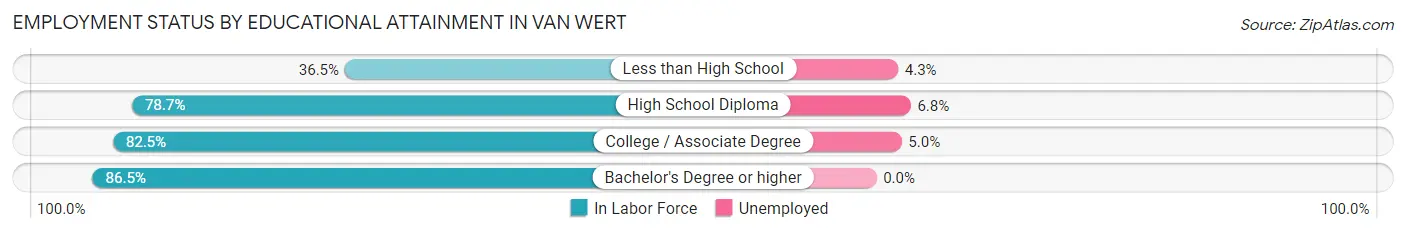
| Educational Attainment | In Labor Force | Unemployed |
| Less than High School | 138 (36.5%) | 16 (4.3%) |
| High School Diploma | 1,554 (78.7%) | 134 (6.8%) |
| College / Associate Degree | 1,562 (82.5%) | 95 (5.0%) |
| Bachelor's Degree or higher | 884 (86.5%) | 0 (0.0%) |
| Total | 4,135 (78.5%) | 242 (4.6%) |
Employment Occupations by Sex in Van Wert
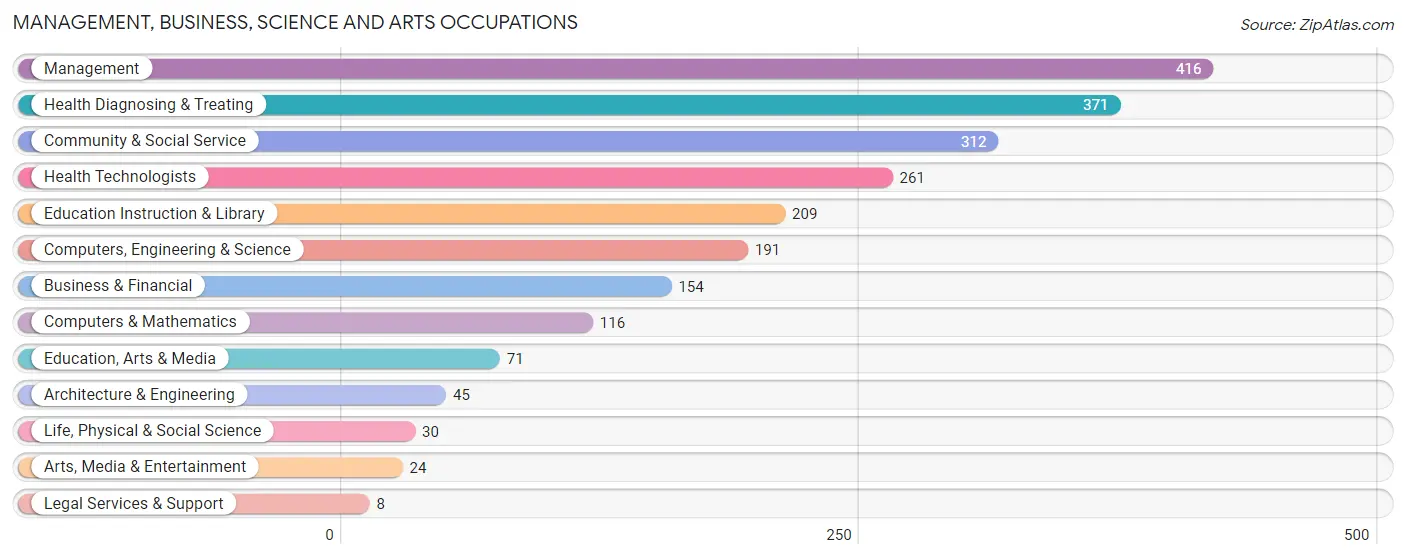
Management, Business, Science and Arts Occupations
The most common Management, Business, Science and Arts occupations in Van Wert are Management (416 | 8.2%), Health Diagnosing & Treating (371 | 7.3%), Community & Social Service (312 | 6.1%), Health Technologists (261 | 5.1%), and Education Instruction & Library (209 | 4.1%).
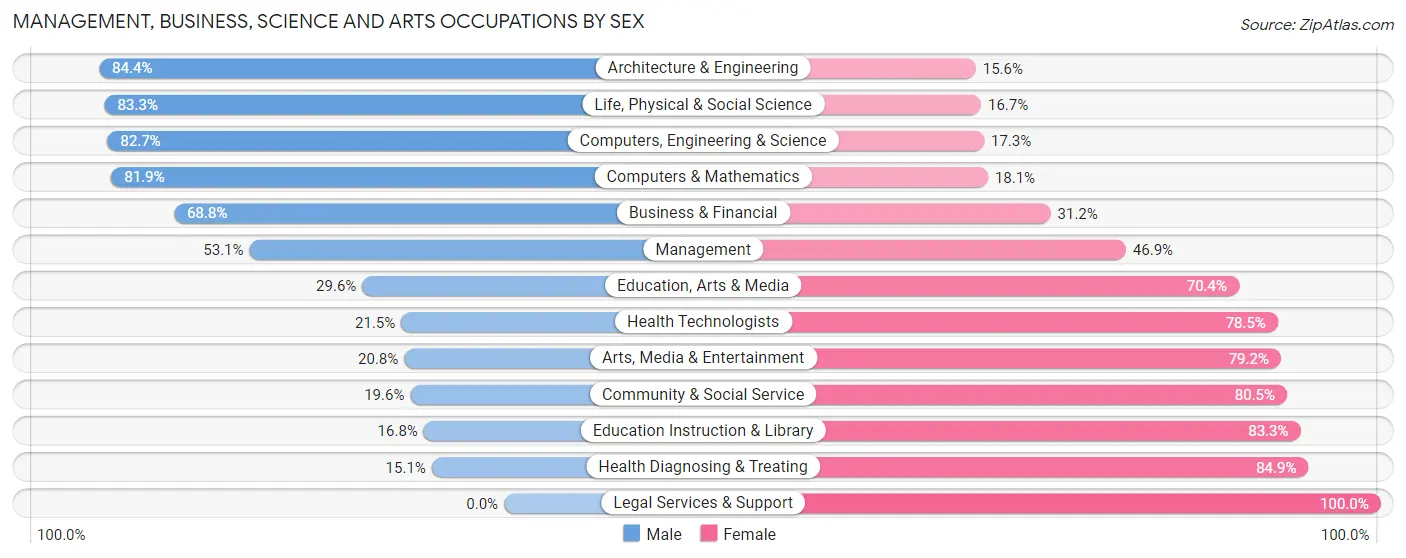
Management, Business, Science and Arts Occupations by Sex
Within the Management, Business, Science and Arts occupations in Van Wert, the most male-oriented occupations are Architecture & Engineering (84.4%), Life, Physical & Social Science (83.3%), and Computers, Engineering & Science (82.7%), while the most female-oriented occupations are Legal Services & Support (100.0%), Health Diagnosing & Treating (84.9%), and Education Instruction & Library (83.3%).
| Occupation | Male | Female |
| Management | 221 (53.1%) | 195 (46.9%) |
| Business & Financial | 106 (68.8%) | 48 (31.2%) |
| Computers, Engineering & Science | 158 (82.7%) | 33 (17.3%) |
| Computers & Mathematics | 95 (81.9%) | 21 (18.1%) |
| Architecture & Engineering | 38 (84.4%) | 7 (15.6%) |
| Life, Physical & Social Science | 25 (83.3%) | 5 (16.7%) |
| Community & Social Service | 61 (19.6%) | 251 (80.4%) |
| Education, Arts & Media | 21 (29.6%) | 50 (70.4%) |
| Legal Services & Support | 0 (0.0%) | 8 (100.0%) |
| Education Instruction & Library | 35 (16.8%) | 174 (83.3%) |
| Arts, Media & Entertainment | 5 (20.8%) | 19 (79.2%) |
| Health Diagnosing & Treating | 56 (15.1%) | 315 (84.9%) |
| Health Technologists | 56 (21.5%) | 205 (78.5%) |
| Total (Category) | 602 (41.7%) | 842 (58.3%) |
| Total (Overall) | 2,478 (48.5%) | 2,626 (51.4%) |
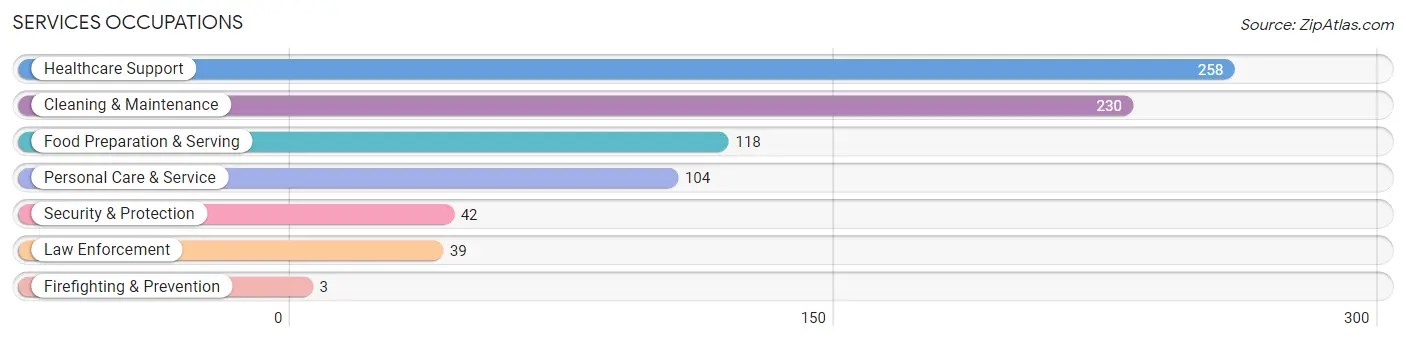
Services Occupations
The most common Services occupations in Van Wert are Healthcare Support (258 | 5.1%), Cleaning & Maintenance (230 | 4.5%), Food Preparation & Serving (118 | 2.3%), Personal Care & Service (104 | 2.0%), and Security & Protection (42 | 0.8%).
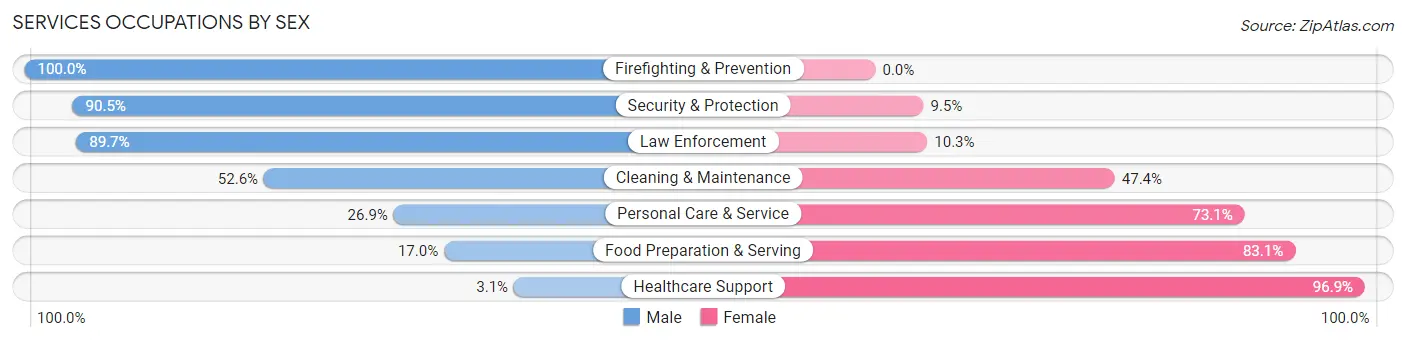
Services Occupations by Sex
Within the Services occupations in Van Wert, the most male-oriented occupations are Firefighting & Prevention (100.0%), Security & Protection (90.5%), and Law Enforcement (89.7%), while the most female-oriented occupations are Healthcare Support (96.9%), Food Preparation & Serving (83.1%), and Personal Care & Service (73.1%).
| Occupation | Male | Female |
| Healthcare Support | 8 (3.1%) | 250 (96.9%) |
| Security & Protection | 38 (90.5%) | 4 (9.5%) |
| Firefighting & Prevention | 3 (100.0%) | 0 (0.0%) |
| Law Enforcement | 35 (89.7%) | 4 (10.3%) |
| Food Preparation & Serving | 20 (17.0%) | 98 (83.1%) |
| Cleaning & Maintenance | 121 (52.6%) | 109 (47.4%) |
| Personal Care & Service | 28 (26.9%) | 76 (73.1%) |
| Total (Category) | 215 (28.6%) | 537 (71.4%) |
| Total (Overall) | 2,478 (48.5%) | 2,626 (51.4%) |
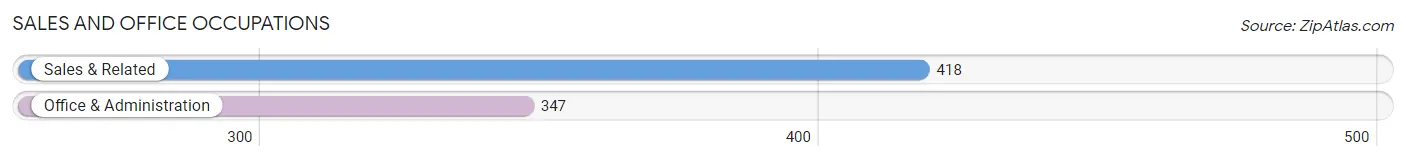
Sales and Office Occupations
The most common Sales and Office occupations in Van Wert are Sales & Related (418 | 8.2%), and Office & Administration (347 | 6.8%).
Sales and Office Occupations by Sex

| Occupation | Male | Female |
| Sales & Related | 158 (37.8%) | 260 (62.2%) |
| Office & Administration | 56 (16.1%) | 291 (83.9%) |
| Total (Category) | 214 (28.0%) | 551 (72.0%) |
| Total (Overall) | 2,478 (48.5%) | 2,626 (51.4%) |
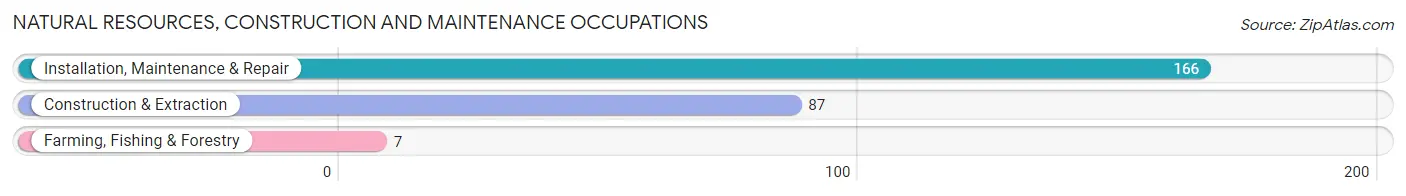
Natural Resources, Construction and Maintenance Occupations
The most common Natural Resources, Construction and Maintenance occupations in Van Wert are Installation, Maintenance & Repair (166 | 3.3%), Construction & Extraction (87 | 1.7%), and Farming, Fishing & Forestry (7 | 0.1%).
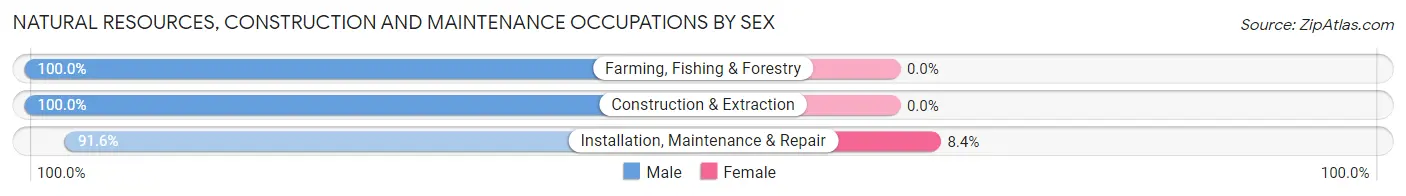
Natural Resources, Construction and Maintenance Occupations by Sex
| Occupation | Male | Female |
| Farming, Fishing & Forestry | 7 (100.0%) | 0 (0.0%) |
| Construction & Extraction | 87 (100.0%) | 0 (0.0%) |
| Installation, Maintenance & Repair | 152 (91.6%) | 14 (8.4%) |
| Total (Category) | 246 (94.6%) | 14 (5.4%) |
| Total (Overall) | 2,478 (48.5%) | 2,626 (51.4%) |
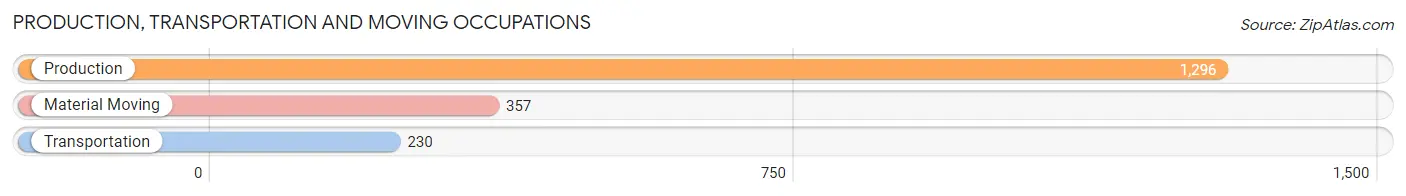
Production, Transportation and Moving Occupations
The most common Production, Transportation and Moving occupations in Van Wert are Production (1,296 | 25.4%), Material Moving (357 | 7.0%), and Transportation (230 | 4.5%).
Production, Transportation and Moving Occupations by Sex
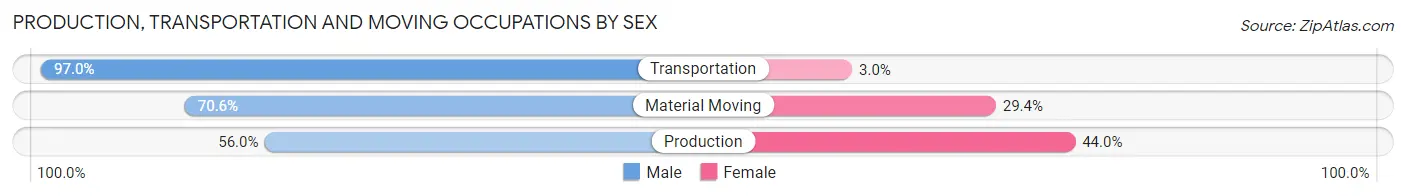
| Occupation | Male | Female |
| Production | 726 (56.0%) | 570 (44.0%) |
| Transportation | 223 (97.0%) | 7 (3.0%) |
| Material Moving | 252 (70.6%) | 105 (29.4%) |
| Total (Category) | 1,201 (63.8%) | 682 (36.2%) |
| Total (Overall) | 2,478 (48.5%) | 2,626 (51.4%) |
Employment Industries by Sex in Van Wert
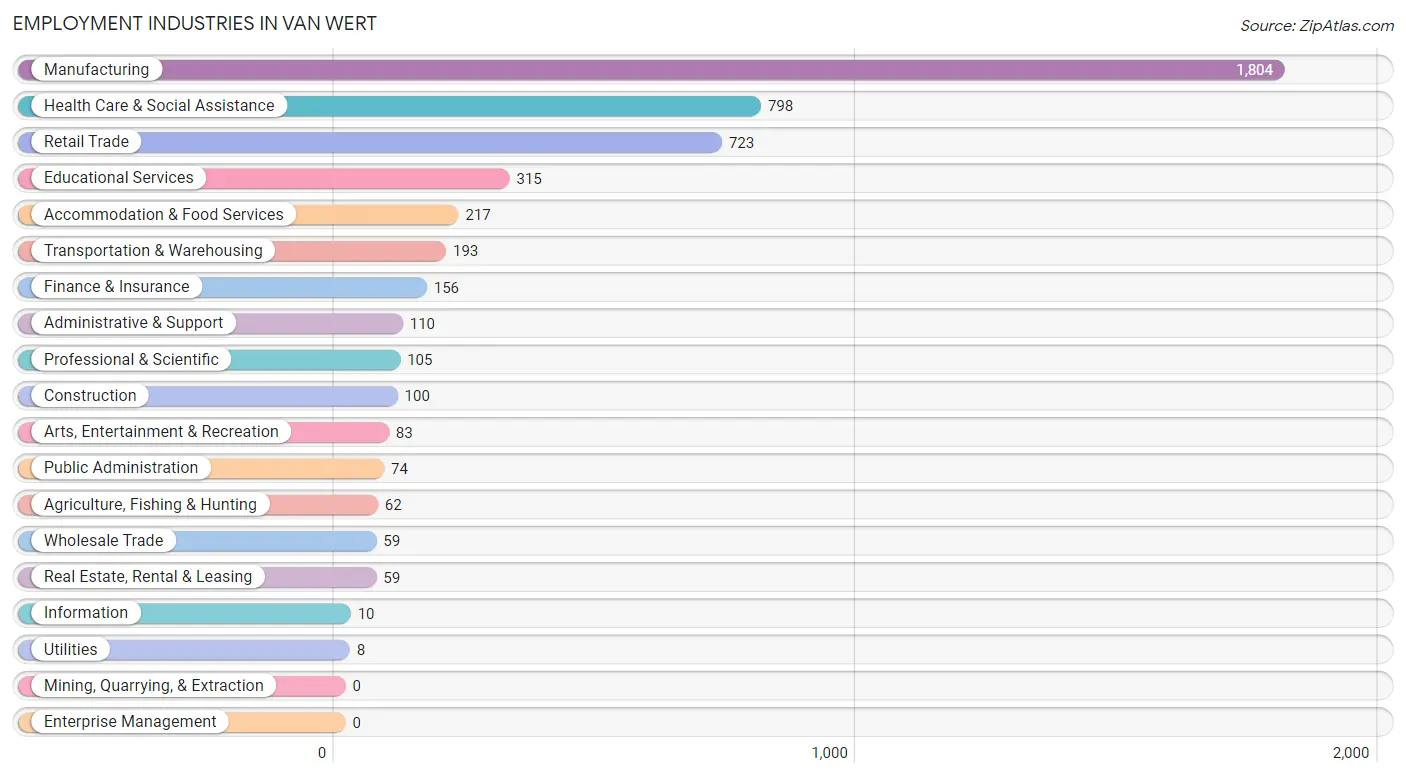
Employment Industries in Van Wert
The major employment industries in Van Wert include Manufacturing (1,804 | 35.3%), Health Care & Social Assistance (798 | 15.6%), Retail Trade (723 | 14.2%), Educational Services (315 | 6.2%), and Accommodation & Food Services (217 | 4.3%).
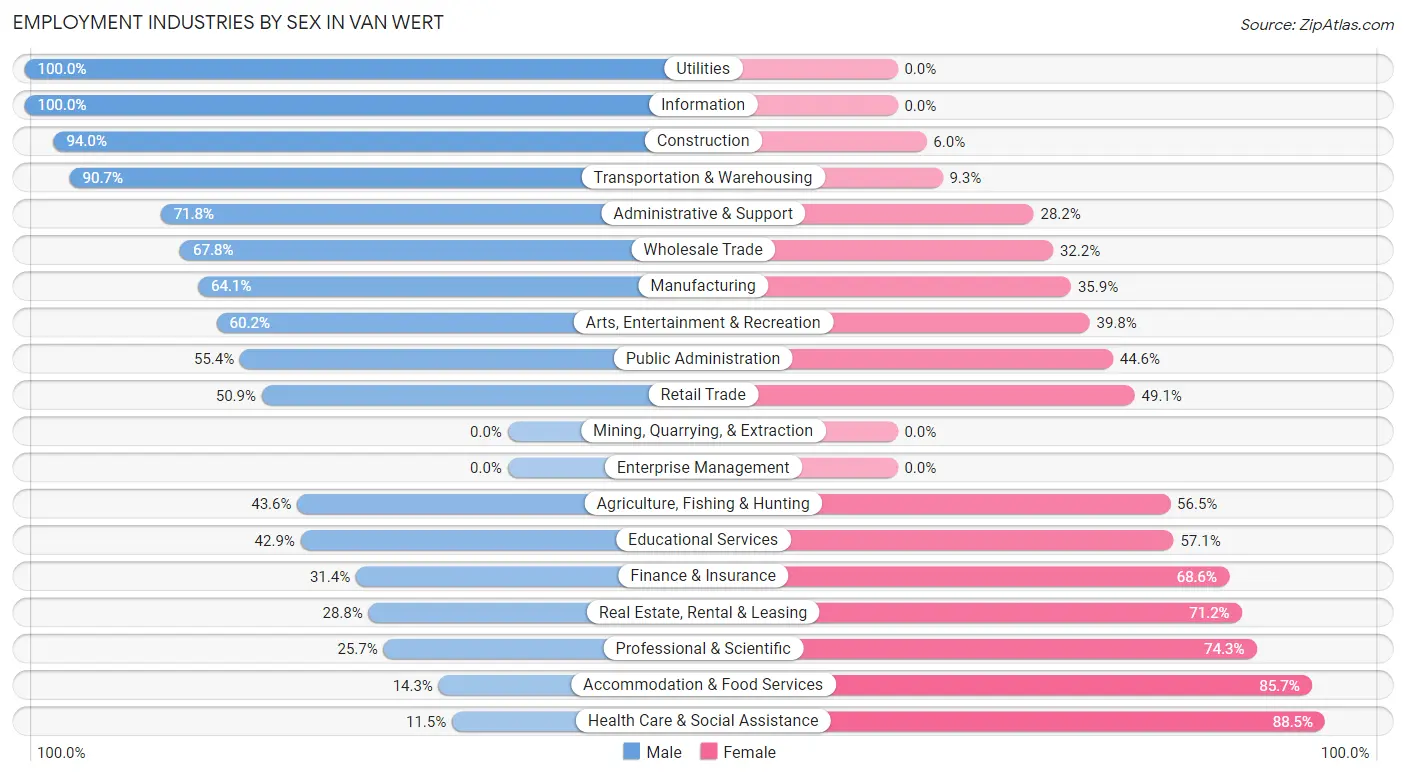
Employment Industries by Sex in Van Wert
The Van Wert industries that see more men than women are Utilities (100.0%), Information (100.0%), and Construction (94.0%), whereas the industries that tend to have a higher number of women are Health Care & Social Assistance (88.5%), Accommodation & Food Services (85.7%), and Professional & Scientific (74.3%).
| Industry | Male | Female |
| Agriculture, Fishing & Hunting | 27 (43.5%) | 35 (56.5%) |
| Mining, Quarrying, & Extraction | 0 (0.0%) | 0 (0.0%) |
| Construction | 94 (94.0%) | 6 (6.0%) |
| Manufacturing | 1,156 (64.1%) | 648 (35.9%) |
| Wholesale Trade | 40 (67.8%) | 19 (32.2%) |
| Retail Trade | 368 (50.9%) | 355 (49.1%) |
| Transportation & Warehousing | 175 (90.7%) | 18 (9.3%) |
| Utilities | 8 (100.0%) | 0 (0.0%) |
| Information | 10 (100.0%) | 0 (0.0%) |
| Finance & Insurance | 49 (31.4%) | 107 (68.6%) |
| Real Estate, Rental & Leasing | 17 (28.8%) | 42 (71.2%) |
| Professional & Scientific | 27 (25.7%) | 78 (74.3%) |
| Enterprise Management | 0 (0.0%) | 0 (0.0%) |
| Administrative & Support | 79 (71.8%) | 31 (28.2%) |
| Educational Services | 135 (42.9%) | 180 (57.1%) |
| Health Care & Social Assistance | 92 (11.5%) | 706 (88.5%) |
| Arts, Entertainment & Recreation | 50 (60.2%) | 33 (39.8%) |
| Accommodation & Food Services | 31 (14.3%) | 186 (85.7%) |
| Public Administration | 41 (55.4%) | 33 (44.6%) |
| Total | 2,478 (48.5%) | 2,626 (51.4%) |
Education in Van Wert
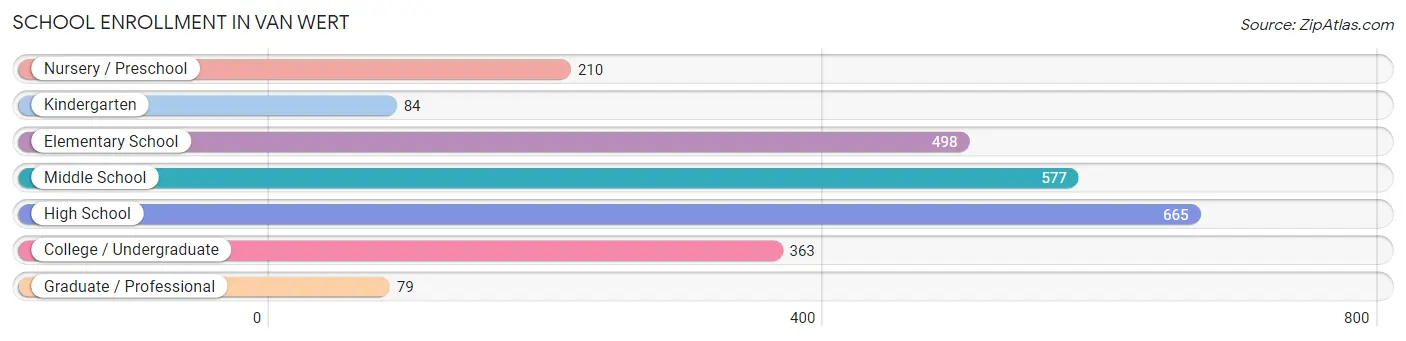
School Enrollment in Van Wert
The most common levels of schooling among the 2,476 students in Van Wert are high school (665 | 26.9%), middle school (577 | 23.3%), and elementary school (498 | 20.1%).
| School Level | # Students | % Students |
| Nursery / Preschool | 210 | 8.5% |
| Kindergarten | 84 | 3.4% |
| Elementary School | 498 | 20.1% |
| Middle School | 577 | 23.3% |
| High School | 665 | 26.9% |
| College / Undergraduate | 363 | 14.7% |
| Graduate / Professional | 79 | 3.2% |
| Total | 2,476 | 100.0% |
School Enrollment by Age by Funding Source in Van Wert
Out of a total of 2,476 students who are enrolled in schools in Van Wert, 163 (6.6%) attend a private institution, while the remaining 2,313 (93.4%) are enrolled in public schools. The age group of 25 to 34 year olds has the highest likelihood of being enrolled in private schools, with 33 (22.0% in the age bracket) enrolled. Conversely, the age group of 15 to 17 year olds has the lowest likelihood of being enrolled in a private school, with 473 (96.1% in the age bracket) attending a public institution.
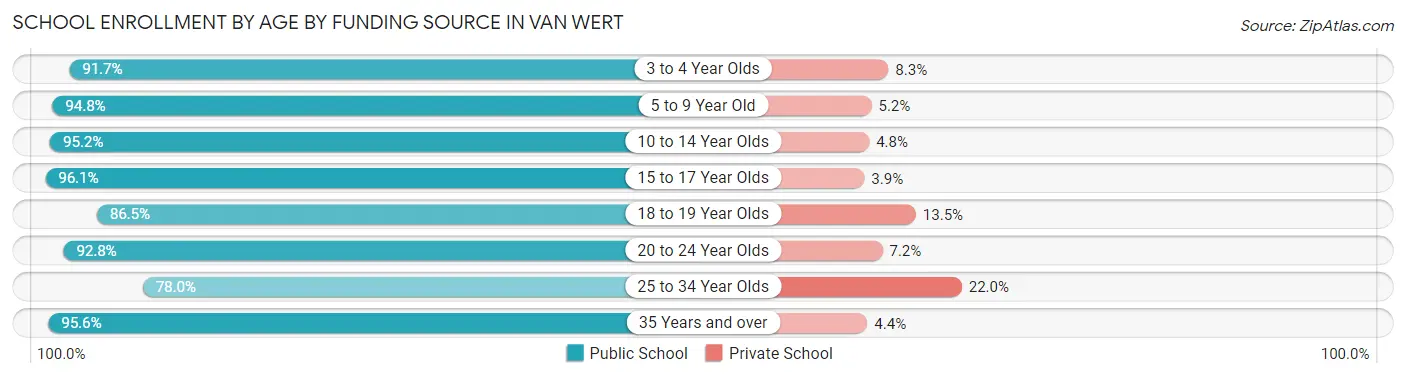
| Age Bracket | Public School | Private School |
| 3 to 4 Year Olds | 110 (91.7%) | 10 (8.3%) |
| 5 to 9 Year Old | 548 (94.8%) | 30 (5.2%) |
| 10 to 14 Year Olds | 681 (95.2%) | 34 (4.8%) |
| 15 to 17 Year Olds | 473 (96.1%) | 19 (3.9%) |
| 18 to 19 Year Olds | 135 (86.5%) | 21 (13.5%) |
| 20 to 24 Year Olds | 141 (92.8%) | 11 (7.2%) |
| 25 to 34 Year Olds | 117 (78.0%) | 33 (22.0%) |
| 35 Years and over | 108 (95.6%) | 5 (4.4%) |
| Total | 2,313 (93.4%) | 163 (6.6%) |
Educational Attainment by Field of Study in Van Wert
Education (368 | 26.6%), business (228 | 16.5%), science & technology (194 | 14.0%), engineering (98 | 7.1%), and bio, nature & agricultural (95 | 6.9%) are the most common fields of study among 1,386 individuals in Van Wert who have obtained a bachelor's degree or higher.
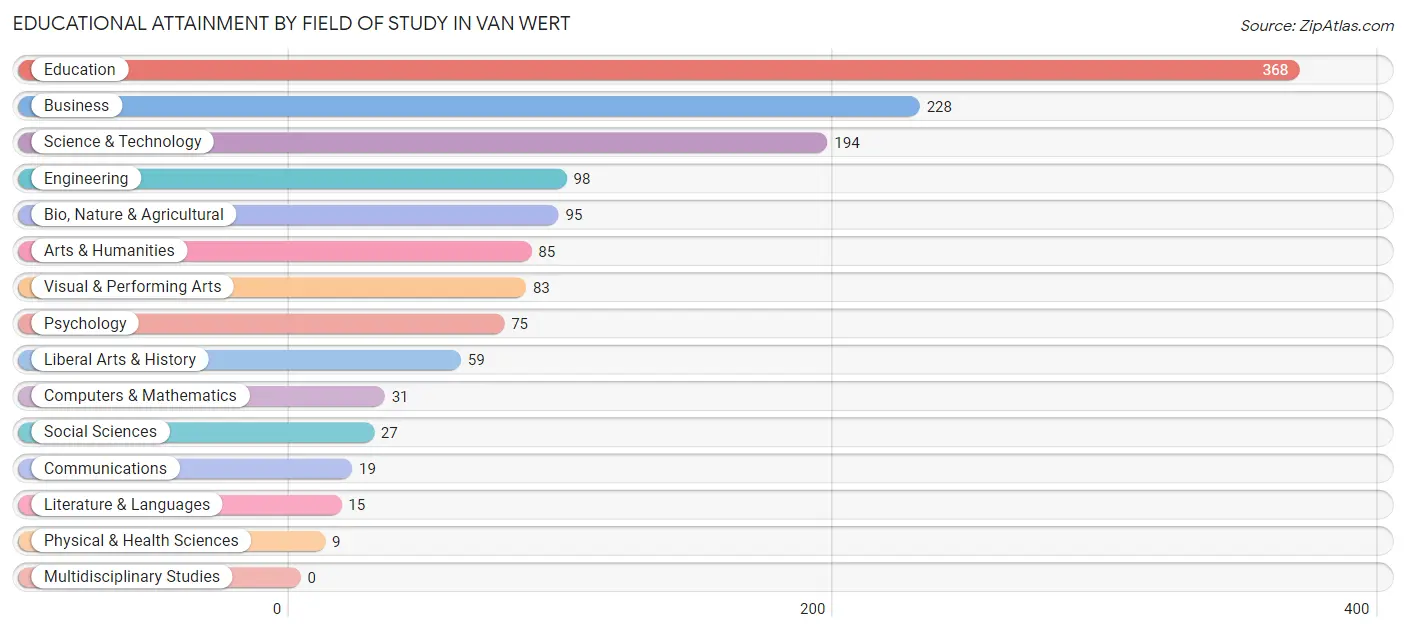
| Field of Study | # Graduates | % Graduates |
| Computers & Mathematics | 31 | 2.2% |
| Bio, Nature & Agricultural | 95 | 6.9% |
| Physical & Health Sciences | 9 | 0.6% |
| Psychology | 75 | 5.4% |
| Social Sciences | 27 | 1.9% |
| Engineering | 98 | 7.1% |
| Multidisciplinary Studies | 0 | 0.0% |
| Science & Technology | 194 | 14.0% |
| Business | 228 | 16.5% |
| Education | 368 | 26.6% |
| Literature & Languages | 15 | 1.1% |
| Liberal Arts & History | 59 | 4.3% |
| Visual & Performing Arts | 83 | 6.0% |
| Communications | 19 | 1.4% |
| Arts & Humanities | 85 | 6.1% |
| Total | 1,386 | 100.0% |
Transportation & Commute in Van Wert
Vehicle Availability by Sex in Van Wert
The most prevalent vehicle ownership categories in Van Wert are males with 2 vehicles (991, accounting for 40.4%) and females with 2 vehicles (786, making up 38.3%).
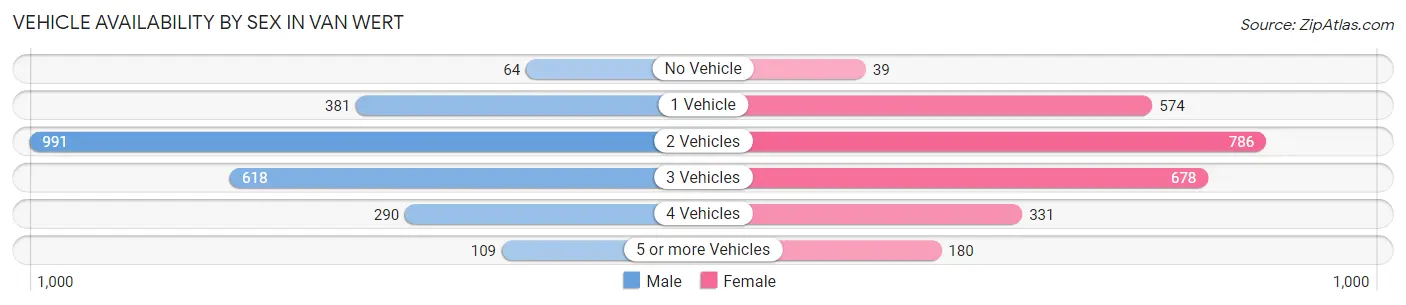
| Vehicles Available | Male | Female |
| No Vehicle | 64 (2.6%) | 39 (1.5%) |
| 1 Vehicle | 381 (15.5%) | 574 (22.2%) |
| 2 Vehicles | 991 (40.4%) | 786 (30.4%) |
| 3 Vehicles | 618 (25.2%) | 678 (26.2%) |
| 4 Vehicles | 290 (11.8%) | 331 (12.8%) |
| 5 or more Vehicles | 109 (4.4%) | 180 (7.0%) |
| Total | 2,453 (100.0%) | 2,588 (100.0%) |
Commute Time in Van Wert
The most frequently occuring commute durations in Van Wert are 5 to 9 minutes (1,757 commuters, 35.8%), 10 to 14 minutes (1,019 commuters, 20.7%), and less than 5 minutes (557 commuters, 11.3%).
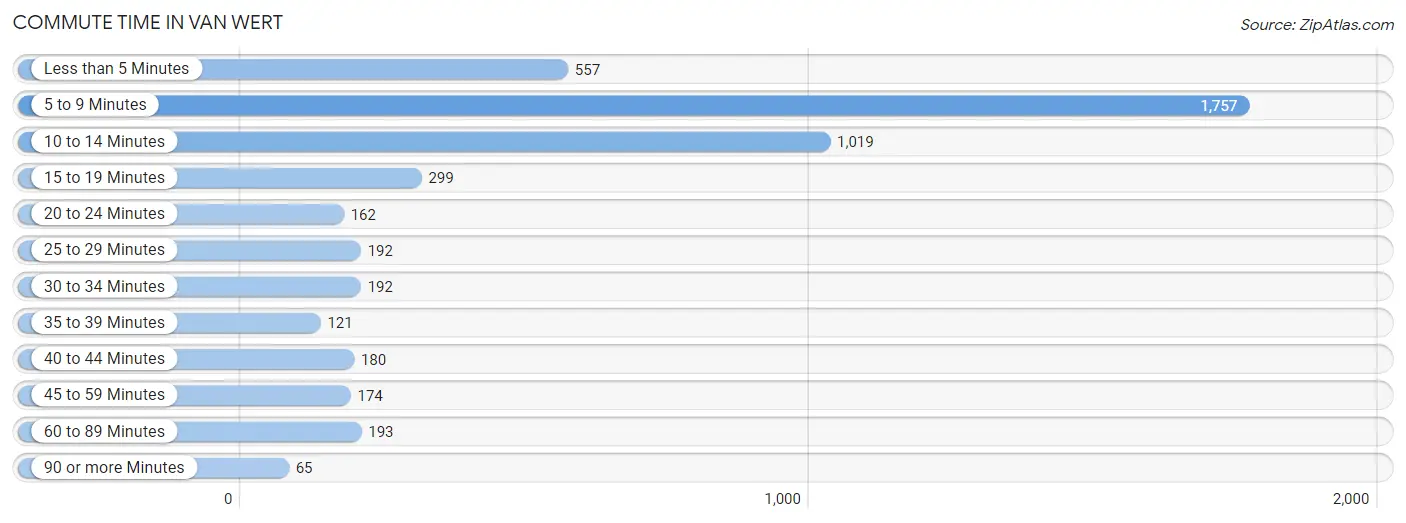
| Commute Time | # Commuters | % Commuters |
| Less than 5 Minutes | 557 | 11.3% |
| 5 to 9 Minutes | 1,757 | 35.8% |
| 10 to 14 Minutes | 1,019 | 20.7% |
| 15 to 19 Minutes | 299 | 6.1% |
| 20 to 24 Minutes | 162 | 3.3% |
| 25 to 29 Minutes | 192 | 3.9% |
| 30 to 34 Minutes | 192 | 3.9% |
| 35 to 39 Minutes | 121 | 2.5% |
| 40 to 44 Minutes | 180 | 3.7% |
| 45 to 59 Minutes | 174 | 3.5% |
| 60 to 89 Minutes | 193 | 3.9% |
| 90 or more Minutes | 65 | 1.3% |
Commute Time by Sex in Van Wert
The most common commute times in Van Wert are 5 to 9 minutes (820 commuters, 34.7%) for males and 5 to 9 minutes (937 commuters, 36.8%) for females.
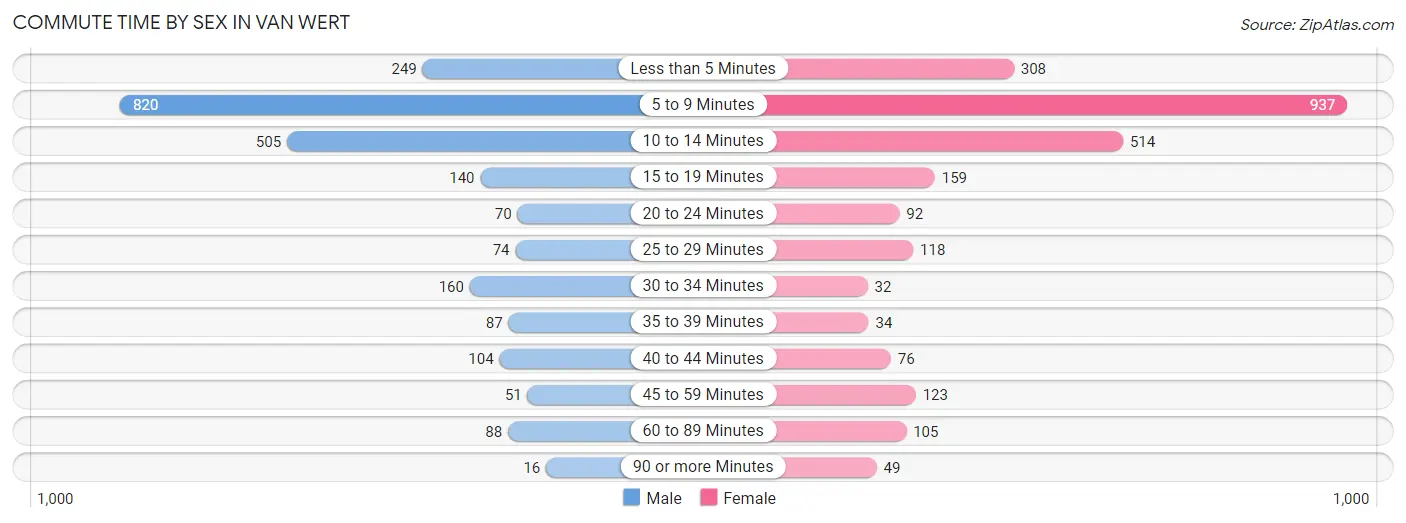
| Commute Time | Male | Female |
| Less than 5 Minutes | 249 (10.5%) | 308 (12.1%) |
| 5 to 9 Minutes | 820 (34.7%) | 937 (36.8%) |
| 10 to 14 Minutes | 505 (21.4%) | 514 (20.2%) |
| 15 to 19 Minutes | 140 (5.9%) | 159 (6.2%) |
| 20 to 24 Minutes | 70 (3.0%) | 92 (3.6%) |
| 25 to 29 Minutes | 74 (3.1%) | 118 (4.6%) |
| 30 to 34 Minutes | 160 (6.8%) | 32 (1.3%) |
| 35 to 39 Minutes | 87 (3.7%) | 34 (1.3%) |
| 40 to 44 Minutes | 104 (4.4%) | 76 (3.0%) |
| 45 to 59 Minutes | 51 (2.2%) | 123 (4.8%) |
| 60 to 89 Minutes | 88 (3.7%) | 105 (4.1%) |
| 90 or more Minutes | 16 (0.7%) | 49 (1.9%) |
Time of Departure to Work by Sex in Van Wert
The most frequent times of departure to work in Van Wert are 12:00 PM to 3:59 PM (355, 15.0%) for males and 12:00 PM to 3:59 PM (385, 15.1%) for females.
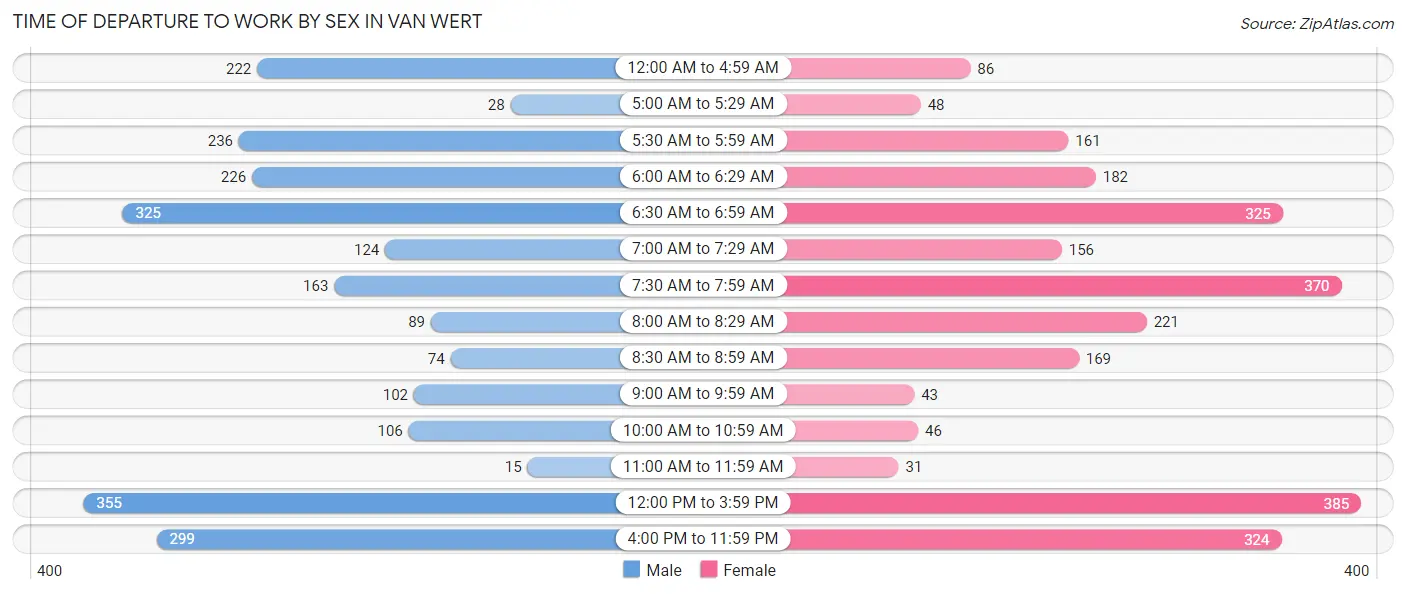
| Time of Departure | Male | Female |
| 12:00 AM to 4:59 AM | 222 (9.4%) | 86 (3.4%) |
| 5:00 AM to 5:29 AM | 28 (1.2%) | 48 (1.9%) |
| 5:30 AM to 5:59 AM | 236 (10.0%) | 161 (6.3%) |
| 6:00 AM to 6:29 AM | 226 (9.6%) | 182 (7.1%) |
| 6:30 AM to 6:59 AM | 325 (13.8%) | 325 (12.8%) |
| 7:00 AM to 7:29 AM | 124 (5.2%) | 156 (6.1%) |
| 7:30 AM to 7:59 AM | 163 (6.9%) | 370 (14.5%) |
| 8:00 AM to 8:29 AM | 89 (3.8%) | 221 (8.7%) |
| 8:30 AM to 8:59 AM | 74 (3.1%) | 169 (6.6%) |
| 9:00 AM to 9:59 AM | 102 (4.3%) | 43 (1.7%) |
| 10:00 AM to 10:59 AM | 106 (4.5%) | 46 (1.8%) |
| 11:00 AM to 11:59 AM | 15 (0.6%) | 31 (1.2%) |
| 12:00 PM to 3:59 PM | 355 (15.0%) | 385 (15.1%) |
| 4:00 PM to 11:59 PM | 299 (12.7%) | 324 (12.7%) |
| Total | 2,364 (100.0%) | 2,547 (100.0%) |
Housing Occupancy in Van Wert
Occupancy by Ownership in Van Wert
Of the total 4,485 dwellings in Van Wert, owner-occupied units account for 3,016 (67.2%), while renter-occupied units make up 1,469 (32.8%).
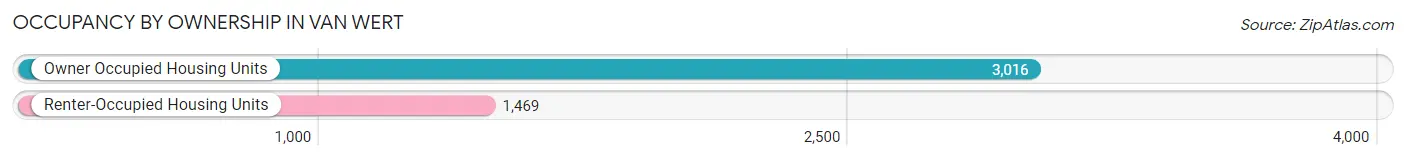
| Occupancy | # Housing Units | % Housing Units |
| Owner Occupied Housing Units | 3,016 | 67.2% |
| Renter-Occupied Housing Units | 1,469 | 32.8% |
| Total Occupied Housing Units | 4,485 | 100.0% |
Occupancy by Household Size in Van Wert
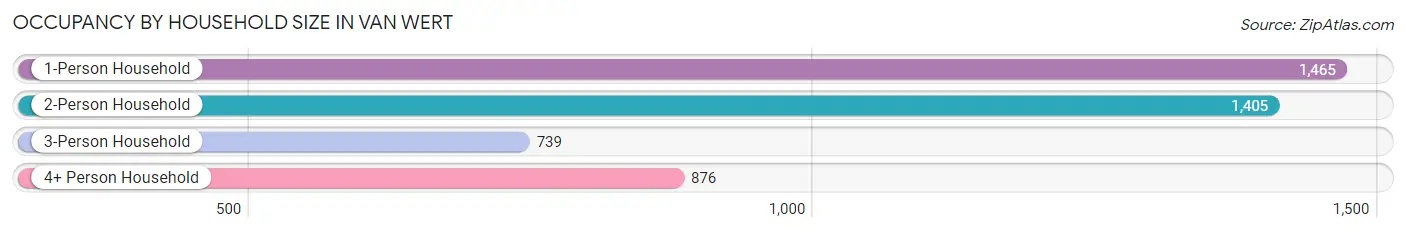
| Household Size | # Housing Units | % Housing Units |
| 1-Person Household | 1,465 | 32.7% |
| 2-Person Household | 1,405 | 31.3% |
| 3-Person Household | 739 | 16.5% |
| 4+ Person Household | 876 | 19.5% |
| Total Housing Units | 4,485 | 100.0% |
Occupancy by Ownership by Household Size in Van Wert
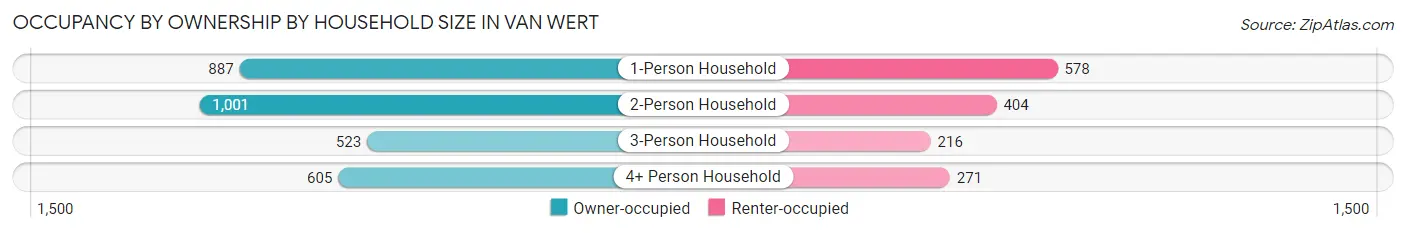
| Household Size | Owner-occupied | Renter-occupied |
| 1-Person Household | 887 (60.6%) | 578 (39.5%) |
| 2-Person Household | 1,001 (71.3%) | 404 (28.7%) |
| 3-Person Household | 523 (70.8%) | 216 (29.2%) |
| 4+ Person Household | 605 (69.1%) | 271 (30.9%) |
| Total Housing Units | 3,016 (67.2%) | 1,469 (32.8%) |
Occupancy by Educational Attainment in Van Wert
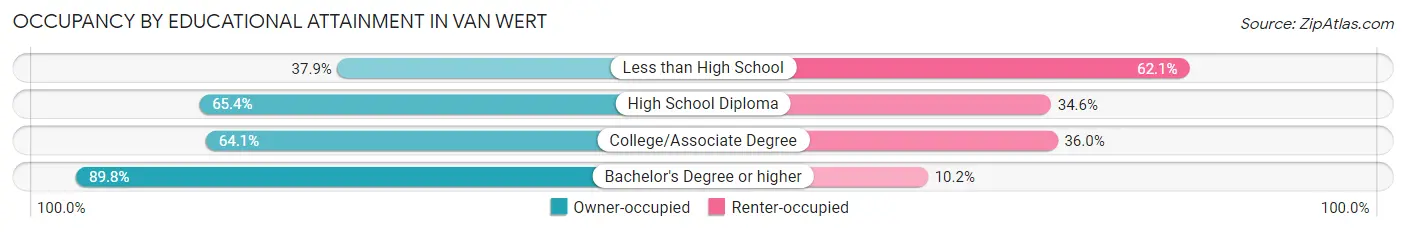
| Household Size | Owner-occupied | Renter-occupied |
| Less than High School | 99 (37.9%) | 162 (62.1%) |
| High School Diploma | 1,248 (65.4%) | 661 (34.6%) |
| College/Associate Degree | 1,019 (64.0%) | 572 (35.9%) |
| Bachelor's Degree or higher | 650 (89.8%) | 74 (10.2%) |
Occupancy by Age of Householder in Van Wert
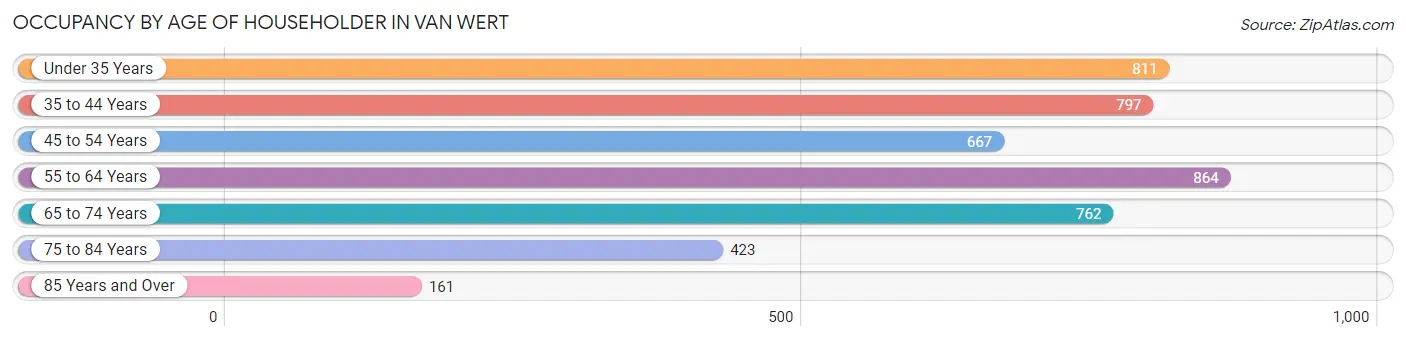
| Age Bracket | # Households | % Households |
| Under 35 Years | 811 | 18.1% |
| 35 to 44 Years | 797 | 17.8% |
| 45 to 54 Years | 667 | 14.9% |
| 55 to 64 Years | 864 | 19.3% |
| 65 to 74 Years | 762 | 17.0% |
| 75 to 84 Years | 423 | 9.4% |
| 85 Years and Over | 161 | 3.6% |
| Total | 4,485 | 100.0% |
Housing Finances in Van Wert
Median Income by Occupancy in Van Wert
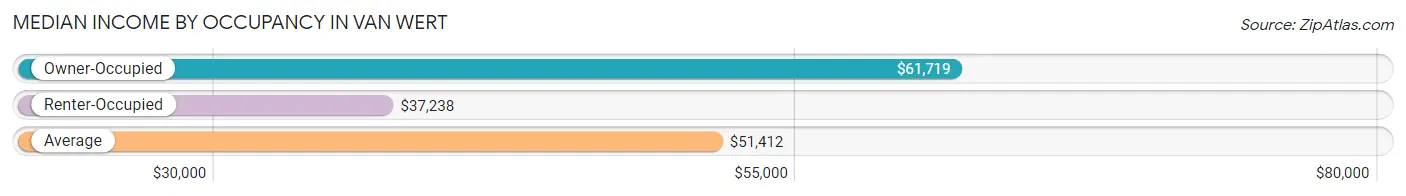
| Occupancy Type | # Households | Median Income |
| Owner-Occupied | 3,016 (67.2%) | $61,719 |
| Renter-Occupied | 1,469 (32.8%) | $37,238 |
| Average | 4,485 (100.0%) | $51,412 |
Occupancy by Householder Income Bracket in Van Wert
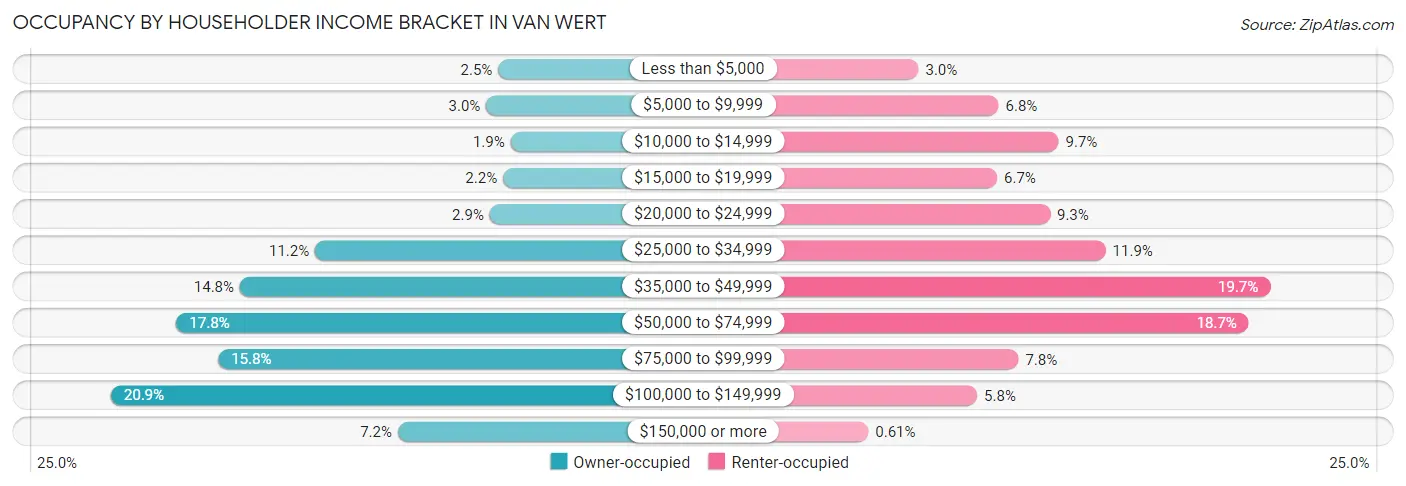
| Income Bracket | Owner-occupied | Renter-occupied |
| Less than $5,000 | 74 (2.5%) | 44 (3.0%) |
| $5,000 to $9,999 | 91 (3.0%) | 100 (6.8%) |
| $10,000 to $14,999 | 56 (1.9%) | 142 (9.7%) |
| $15,000 to $19,999 | 67 (2.2%) | 99 (6.7%) |
| $20,000 to $24,999 | 86 (2.9%) | 136 (9.3%) |
| $25,000 to $34,999 | 337 (11.2%) | 175 (11.9%) |
| $35,000 to $49,999 | 445 (14.7%) | 290 (19.7%) |
| $50,000 to $74,999 | 536 (17.8%) | 275 (18.7%) |
| $75,000 to $99,999 | 476 (15.8%) | 114 (7.8%) |
| $100,000 to $149,999 | 630 (20.9%) | 85 (5.8%) |
| $150,000 or more | 218 (7.2%) | 9 (0.6%) |
| Total | 3,016 (100.0%) | 1,469 (100.0%) |
Monthly Housing Cost Tiers in Van Wert
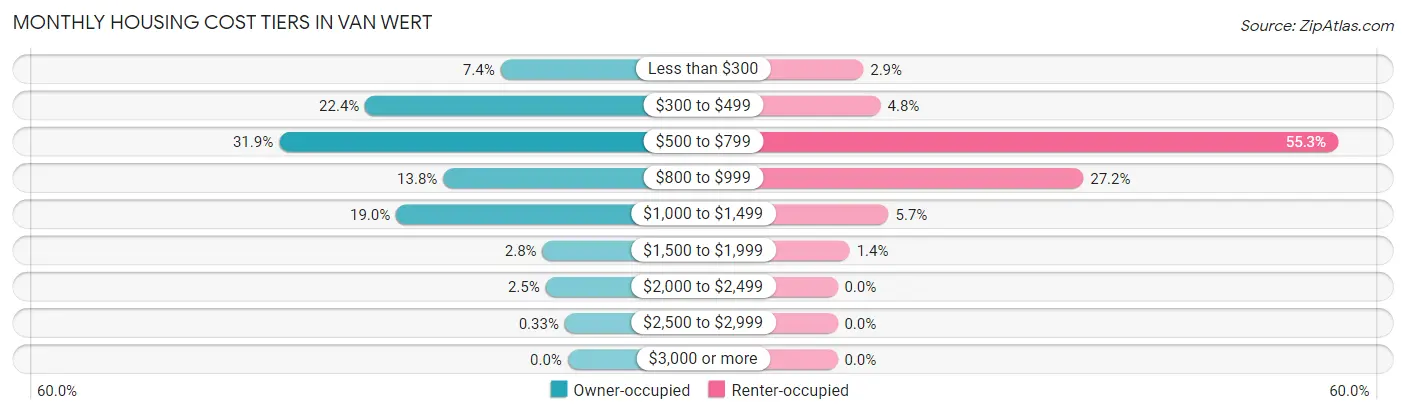
| Monthly Cost | Owner-occupied | Renter-occupied |
| Less than $300 | 224 (7.4%) | 42 (2.9%) |
| $300 to $499 | 675 (22.4%) | 70 (4.8%) |
| $500 to $799 | 962 (31.9%) | 812 (55.3%) |
| $800 to $999 | 415 (13.8%) | 399 (27.2%) |
| $1,000 to $1,499 | 572 (19.0%) | 83 (5.7%) |
| $1,500 to $1,999 | 84 (2.8%) | 20 (1.4%) |
| $2,000 to $2,499 | 74 (2.5%) | 0 (0.0%) |
| $2,500 to $2,999 | 10 (0.3%) | 0 (0.0%) |
| $3,000 or more | 0 (0.0%) | 0 (0.0%) |
| Total | 3,016 (100.0%) | 1,469 (100.0%) |
Physical Housing Characteristics in Van Wert
Housing Structures in Van Wert
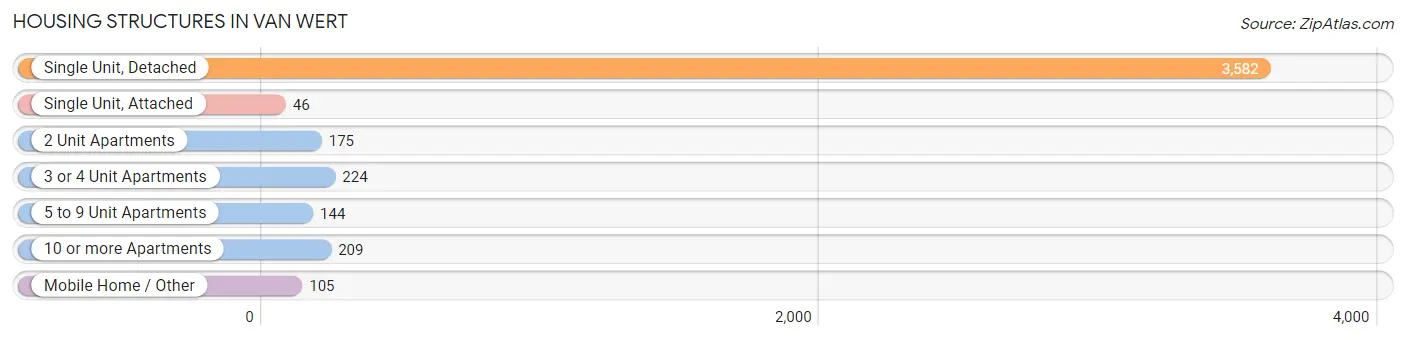
| Structure Type | # Housing Units | % Housing Units |
| Single Unit, Detached | 3,582 | 79.9% |
| Single Unit, Attached | 46 | 1.0% |
| 2 Unit Apartments | 175 | 3.9% |
| 3 or 4 Unit Apartments | 224 | 5.0% |
| 5 to 9 Unit Apartments | 144 | 3.2% |
| 10 or more Apartments | 209 | 4.7% |
| Mobile Home / Other | 105 | 2.3% |
| Total | 4,485 | 100.0% |
Housing Structures by Occupancy in Van Wert
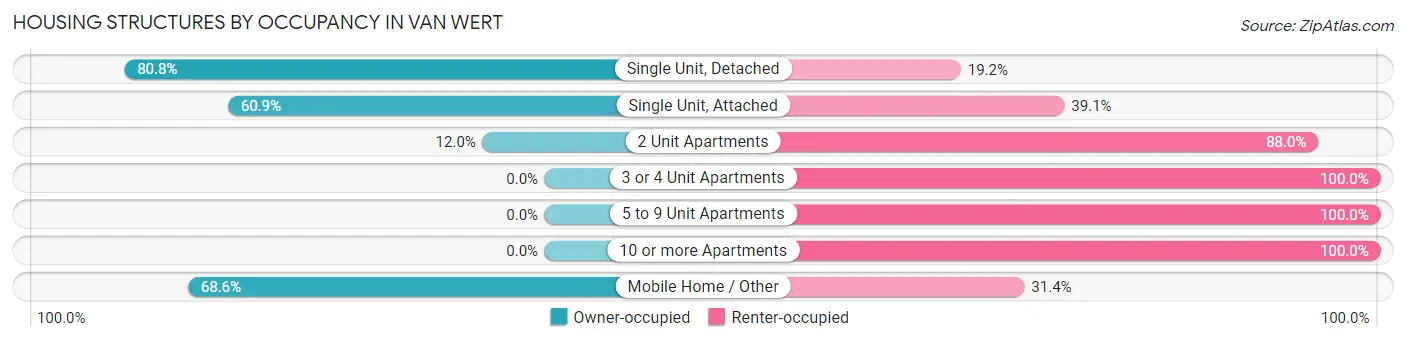
| Structure Type | Owner-occupied | Renter-occupied |
| Single Unit, Detached | 2,895 (80.8%) | 687 (19.2%) |
| Single Unit, Attached | 28 (60.9%) | 18 (39.1%) |
| 2 Unit Apartments | 21 (12.0%) | 154 (88.0%) |
| 3 or 4 Unit Apartments | 0 (0.0%) | 224 (100.0%) |
| 5 to 9 Unit Apartments | 0 (0.0%) | 144 (100.0%) |
| 10 or more Apartments | 0 (0.0%) | 209 (100.0%) |
| Mobile Home / Other | 72 (68.6%) | 33 (31.4%) |
| Total | 3,016 (67.2%) | 1,469 (32.8%) |
Housing Structures by Number of Rooms in Van Wert
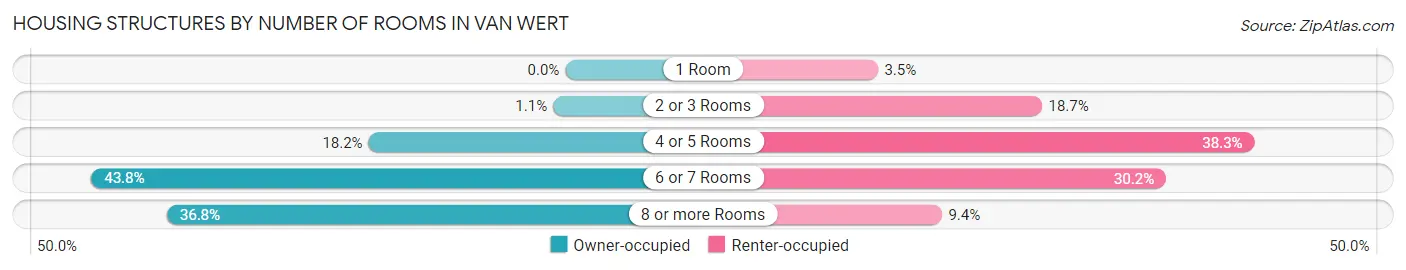
| Number of Rooms | Owner-occupied | Renter-occupied |
| 1 Room | 0 (0.0%) | 51 (3.5%) |
| 2 or 3 Rooms | 34 (1.1%) | 274 (18.6%) |
| 4 or 5 Rooms | 549 (18.2%) | 563 (38.3%) |
| 6 or 7 Rooms | 1,322 (43.8%) | 443 (30.2%) |
| 8 or more Rooms | 1,111 (36.8%) | 138 (9.4%) |
| Total | 3,016 (100.0%) | 1,469 (100.0%) |
Housing Structure by Heating Type in Van Wert
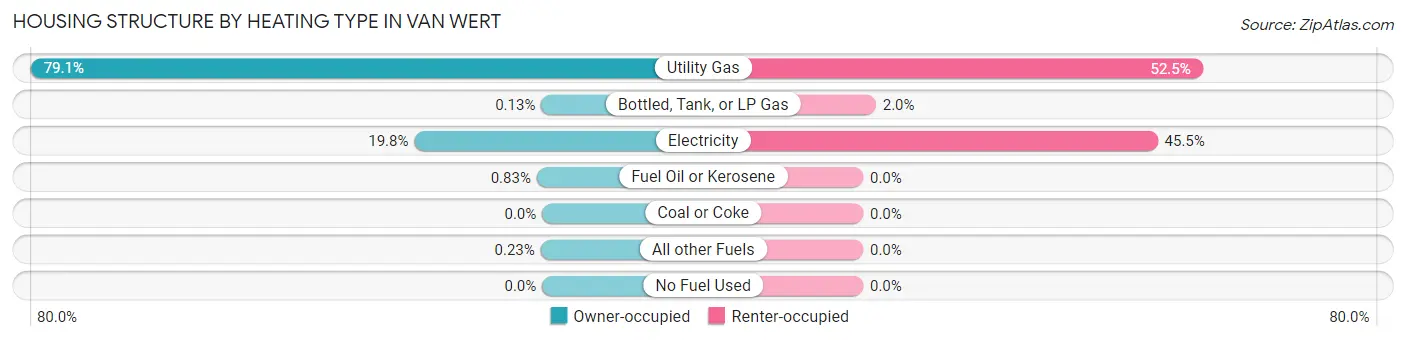
| Heating Type | Owner-occupied | Renter-occupied |
| Utility Gas | 2,384 (79.0%) | 771 (52.5%) |
| Bottled, Tank, or LP Gas | 4 (0.1%) | 29 (2.0%) |
| Electricity | 596 (19.8%) | 669 (45.5%) |
| Fuel Oil or Kerosene | 25 (0.8%) | 0 (0.0%) |
| Coal or Coke | 0 (0.0%) | 0 (0.0%) |
| All other Fuels | 7 (0.2%) | 0 (0.0%) |
| No Fuel Used | 0 (0.0%) | 0 (0.0%) |
| Total | 3,016 (100.0%) | 1,469 (100.0%) |
Household Vehicle Usage in Van Wert
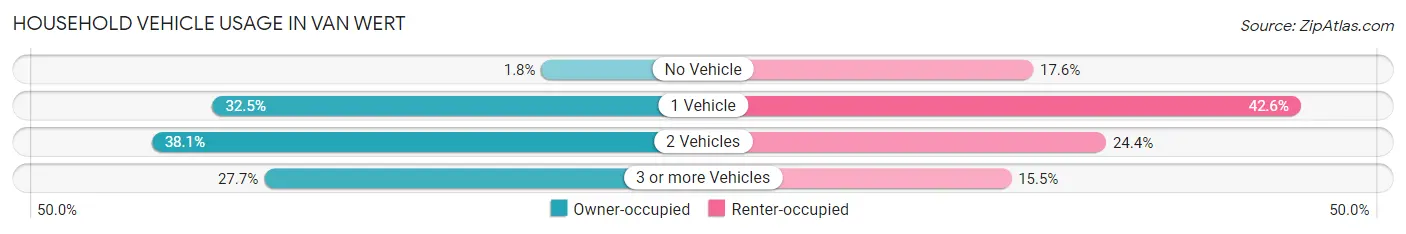
| Vehicles per Household | Owner-occupied | Renter-occupied |
| No Vehicle | 53 (1.8%) | 258 (17.6%) |
| 1 Vehicle | 979 (32.5%) | 625 (42.5%) |
| 2 Vehicles | 1,150 (38.1%) | 358 (24.4%) |
| 3 or more Vehicles | 834 (27.7%) | 228 (15.5%) |
| Total | 3,016 (100.0%) | 1,469 (100.0%) |
Real Estate & Mortgages in Van Wert
Real Estate and Mortgage Overview in Van Wert
| Characteristic | Without Mortgage | With Mortgage |
| Housing Units | 1,220 | 1,796 |
| Median Property Value | $125,900 | $96,900 |
| Median Household Income | $55,833 | $83 |
| Monthly Housing Costs | $433 | $0 |
| Real Estate Taxes | $1,344 | $46 |
Property Value by Mortgage Status in Van Wert
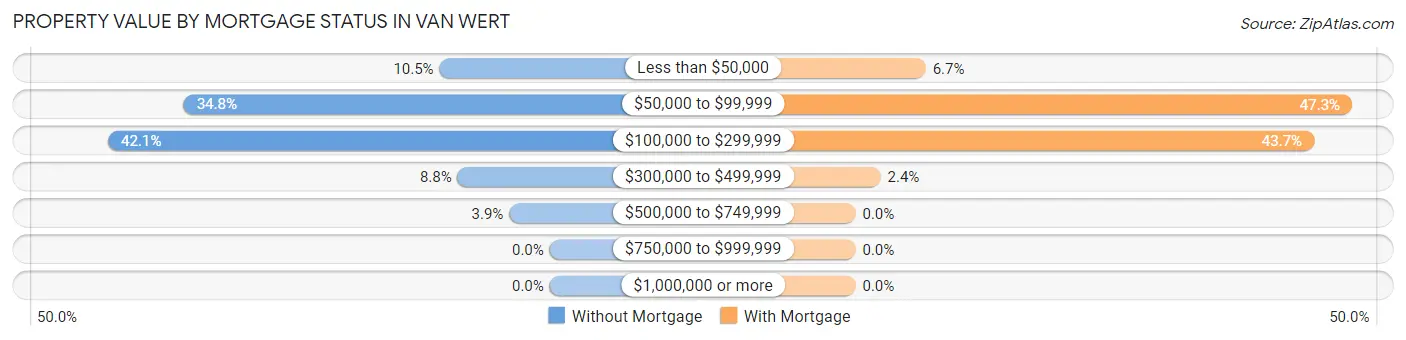
| Property Value | Without Mortgage | With Mortgage |
| Less than $50,000 | 128 (10.5%) | 120 (6.7%) |
| $50,000 to $99,999 | 425 (34.8%) | 849 (47.3%) |
| $100,000 to $299,999 | 513 (42.0%) | 784 (43.6%) |
| $300,000 to $499,999 | 107 (8.8%) | 43 (2.4%) |
| $500,000 to $749,999 | 47 (3.8%) | 0 (0.0%) |
| $750,000 to $999,999 | 0 (0.0%) | 0 (0.0%) |
| $1,000,000 or more | 0 (0.0%) | 0 (0.0%) |
| Total | 1,220 (100.0%) | 1,796 (100.0%) |
Household Income by Mortgage Status in Van Wert
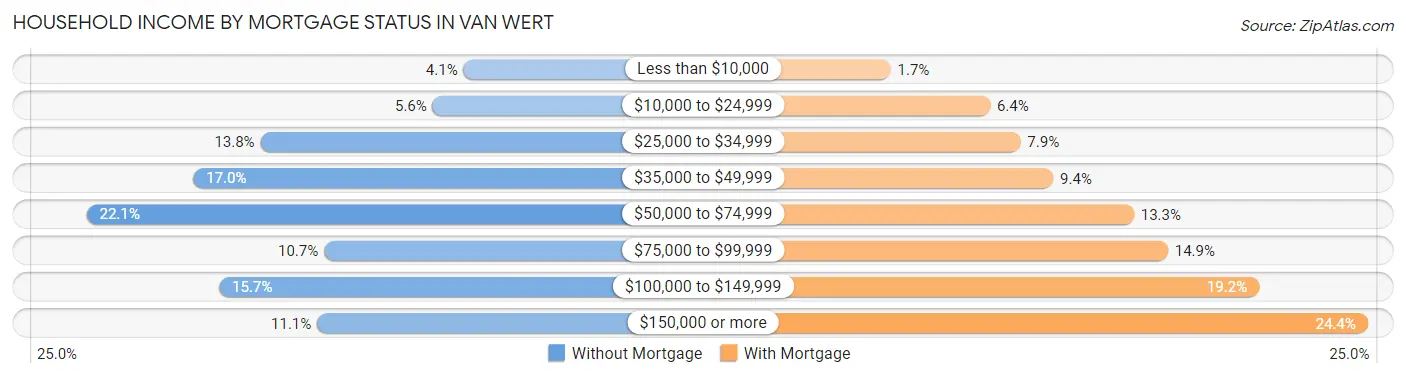
| Household Income | Without Mortgage | With Mortgage |
| Less than $10,000 | 50 (4.1%) | 30 (1.7%) |
| $10,000 to $24,999 | 68 (5.6%) | 115 (6.4%) |
| $25,000 to $34,999 | 168 (13.8%) | 141 (7.9%) |
| $35,000 to $49,999 | 207 (17.0%) | 169 (9.4%) |
| $50,000 to $74,999 | 269 (22.1%) | 238 (13.3%) |
| $75,000 to $99,999 | 131 (10.7%) | 267 (14.9%) |
| $100,000 to $149,999 | 192 (15.7%) | 345 (19.2%) |
| $150,000 or more | 135 (11.1%) | 438 (24.4%) |
| Total | 1,220 (100.0%) | 1,796 (100.0%) |
Property Value to Household Income Ratio in Van Wert
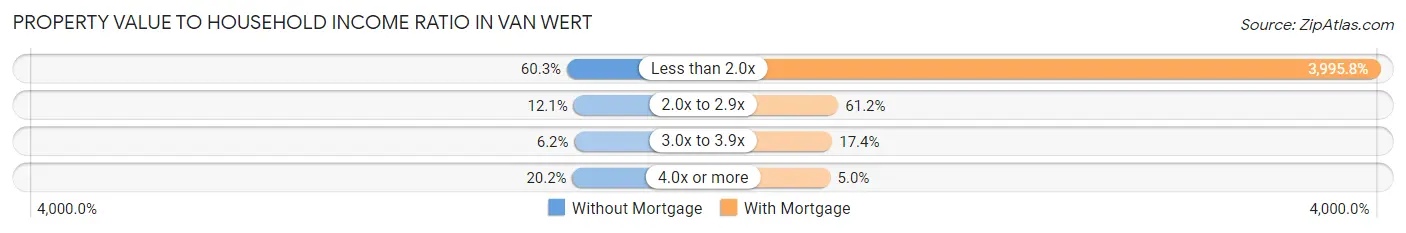
| Value-to-Income Ratio | Without Mortgage | With Mortgage |
| Less than 2.0x | 736 (60.3%) | 71,765 (3,995.8%) |
| 2.0x to 2.9x | 148 (12.1%) | 1,099 (61.2%) |
| 3.0x to 3.9x | 75 (6.1%) | 313 (17.4%) |
| 4.0x or more | 246 (20.2%) | 89 (5.0%) |
| Total | 1,220 (100.0%) | 1,796 (100.0%) |
Real Estate Taxes by Mortgage Status in Van Wert
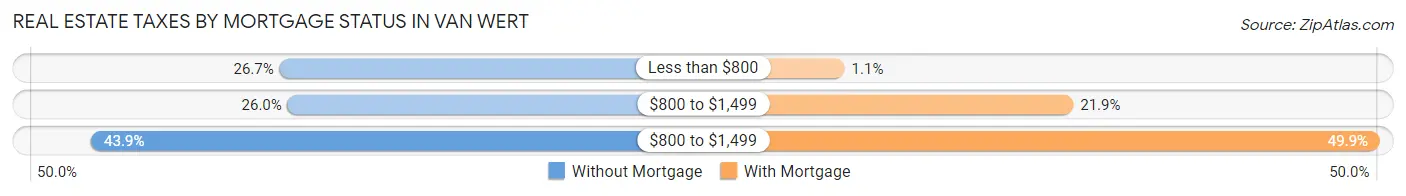
| Property Taxes | Without Mortgage | With Mortgage |
| Less than $800 | 326 (26.7%) | 19 (1.1%) |
| $800 to $1,499 | 317 (26.0%) | 394 (21.9%) |
| $800 to $1,499 | 536 (43.9%) | 897 (49.9%) |
| Total | 1,220 (100.0%) | 1,796 (100.0%) |
Health & Disability in Van Wert
Health Insurance Coverage by Age in Van Wert
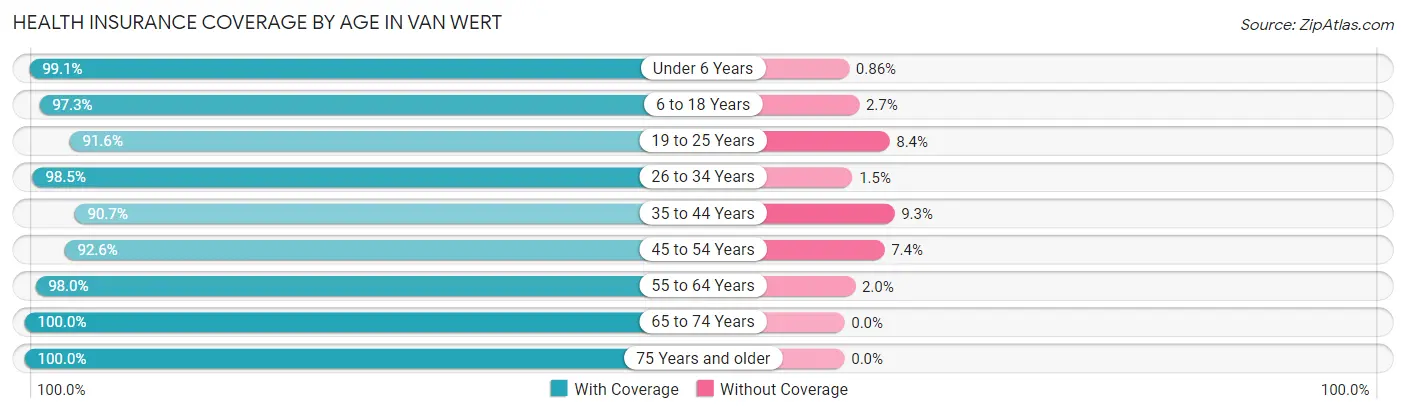
| Age Bracket | With Coverage | Without Coverage |
| Under 6 Years | 920 (99.1%) | 8 (0.9%) |
| 6 to 18 Years | 1,712 (97.3%) | 48 (2.7%) |
| 19 to 25 Years | 874 (91.6%) | 80 (8.4%) |
| 26 to 34 Years | 1,001 (98.5%) | 15 (1.5%) |
| 35 to 44 Years | 1,266 (90.7%) | 130 (9.3%) |
| 45 to 54 Years | 1,220 (92.6%) | 98 (7.4%) |
| 55 to 64 Years | 1,282 (98.0%) | 26 (2.0%) |
| 65 to 74 Years | 1,126 (100.0%) | 0 (0.0%) |
| 75 Years and older | 781 (100.0%) | 0 (0.0%) |
| Total | 10,182 (96.2%) | 405 (3.8%) |
Health Insurance Coverage by Citizenship Status in Van Wert
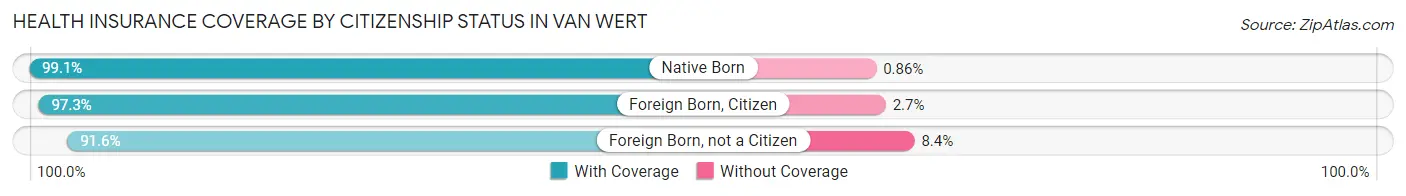
| Citizenship Status | With Coverage | Without Coverage |
| Native Born | 920 (99.1%) | 8 (0.9%) |
| Foreign Born, Citizen | 1,712 (97.3%) | 48 (2.7%) |
| Foreign Born, not a Citizen | 874 (91.6%) | 80 (8.4%) |
Health Insurance Coverage by Household Income in Van Wert
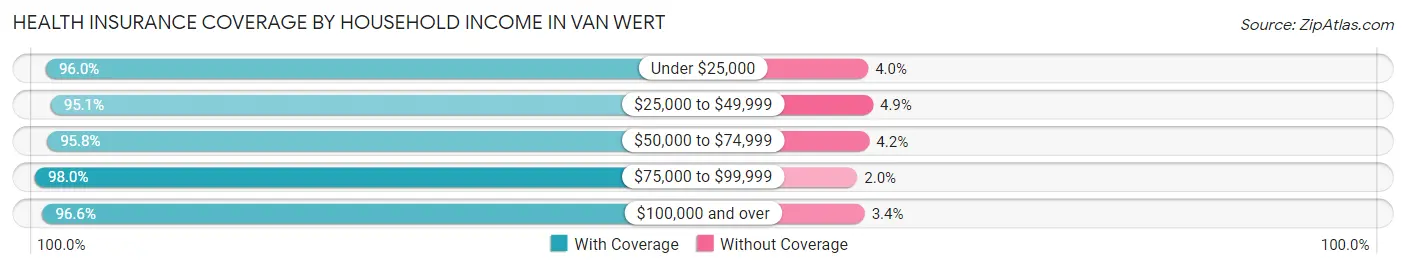
| Household Income | With Coverage | Without Coverage |
| Under $25,000 | 1,221 (96.0%) | 51 (4.0%) |
| $25,000 to $49,999 | 2,452 (95.1%) | 127 (4.9%) |
| $50,000 to $74,999 | 1,740 (95.8%) | 77 (4.2%) |
| $75,000 to $99,999 | 1,689 (98.0%) | 34 (2.0%) |
| $100,000 and over | 3,050 (96.6%) | 106 (3.4%) |
Public vs Private Health Insurance Coverage by Age in Van Wert
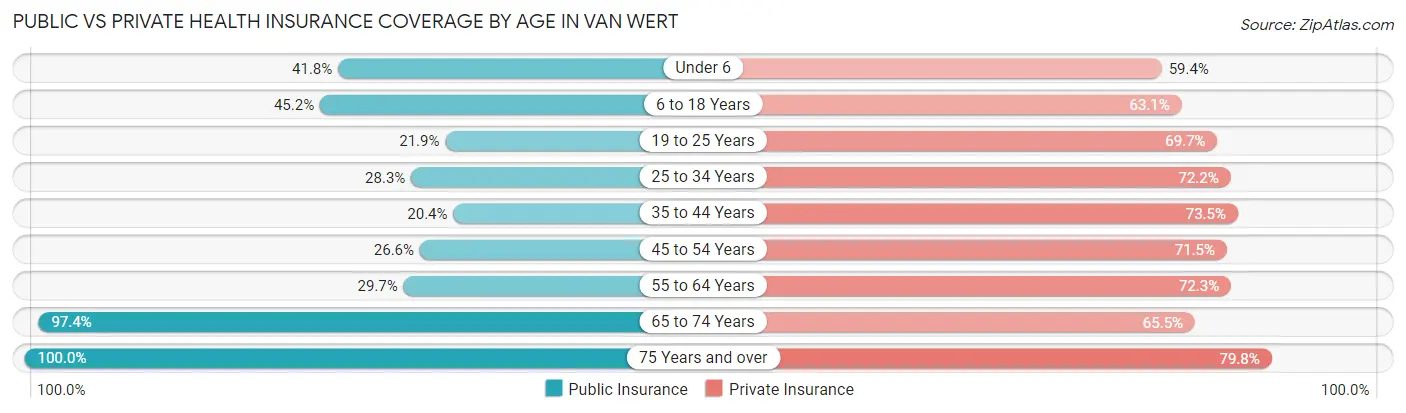
| Age Bracket | Public Insurance | Private Insurance |
| Under 6 | 388 (41.8%) | 551 (59.4%) |
| 6 to 18 Years | 795 (45.2%) | 1,110 (63.1%) |
| 19 to 25 Years | 209 (21.9%) | 665 (69.7%) |
| 25 to 34 Years | 287 (28.2%) | 733 (72.2%) |
| 35 to 44 Years | 285 (20.4%) | 1,026 (73.5%) |
| 45 to 54 Years | 351 (26.6%) | 942 (71.5%) |
| 55 to 64 Years | 388 (29.7%) | 945 (72.3%) |
| 65 to 74 Years | 1,097 (97.4%) | 738 (65.5%) |
| 75 Years and over | 781 (100.0%) | 623 (79.8%) |
| Total | 4,581 (43.3%) | 7,333 (69.3%) |
Disability Status by Sex by Age in Van Wert
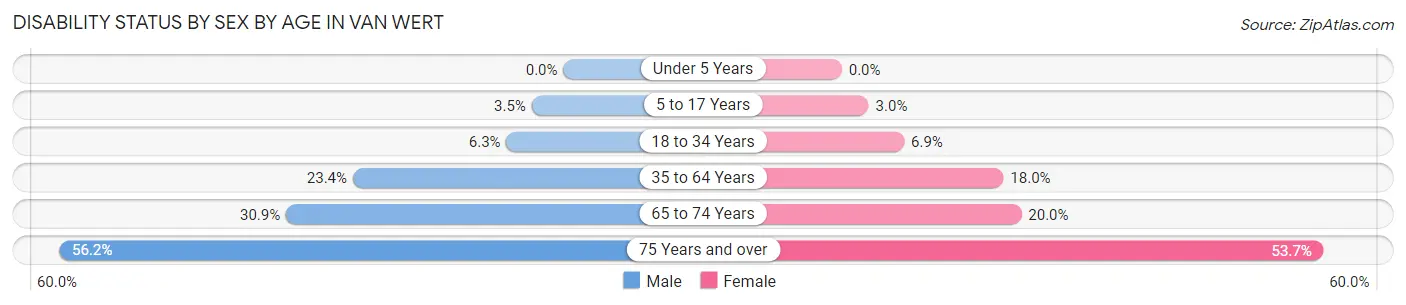
| Age Bracket | Male | Female |
| Under 5 Years | 0 (0.0%) | 0 (0.0%) |
| 5 to 17 Years | 30 (3.5%) | 28 (3.0%) |
| 18 to 34 Years | 63 (6.3%) | 78 (6.9%) |
| 35 to 64 Years | 444 (23.4%) | 383 (18.0%) |
| 65 to 74 Years | 147 (30.9%) | 130 (20.0%) |
| 75 Years and over | 155 (56.2%) | 271 (53.7%) |
Disability Class by Sex by Age in Van Wert
Disability Class: Hearing Difficulty
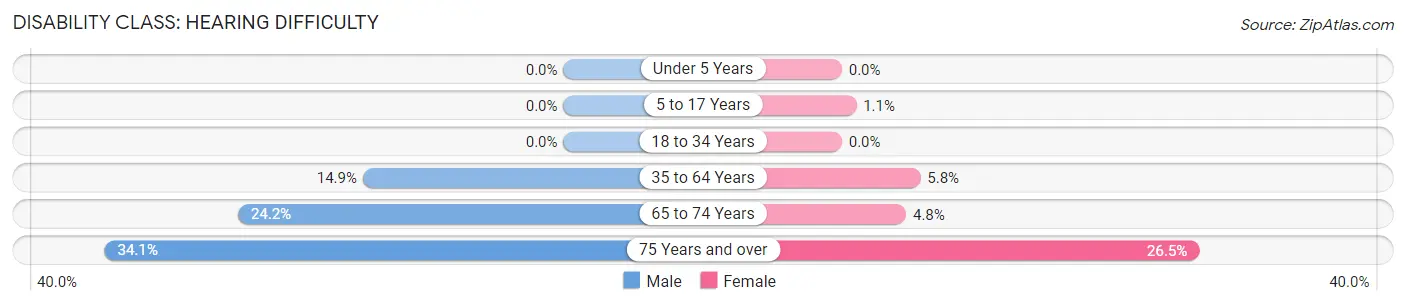
| Age Bracket | Male | Female |
| Under 5 Years | 0 (0.0%) | 0 (0.0%) |
| 5 to 17 Years | 0 (0.0%) | 10 (1.1%) |
| 18 to 34 Years | 0 (0.0%) | 0 (0.0%) |
| 35 to 64 Years | 282 (14.9%) | 124 (5.8%) |
| 65 to 74 Years | 115 (24.2%) | 31 (4.8%) |
| 75 Years and over | 94 (34.1%) | 134 (26.5%) |
Disability Class: Vision Difficulty
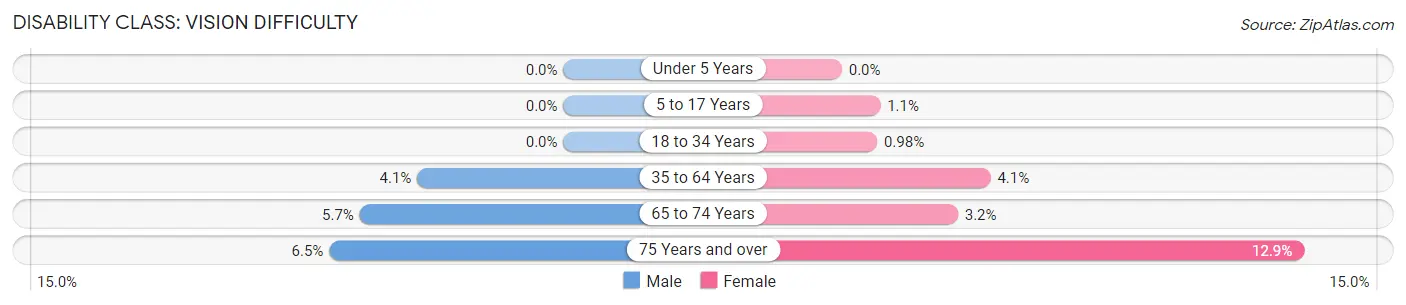
| Age Bracket | Male | Female |
| Under 5 Years | 0 (0.0%) | 0 (0.0%) |
| 5 to 17 Years | 0 (0.0%) | 10 (1.1%) |
| 18 to 34 Years | 0 (0.0%) | 11 (1.0%) |
| 35 to 64 Years | 77 (4.1%) | 88 (4.1%) |
| 65 to 74 Years | 27 (5.7%) | 21 (3.2%) |
| 75 Years and over | 18 (6.5%) | 65 (12.9%) |
Disability Class: Cognitive Difficulty
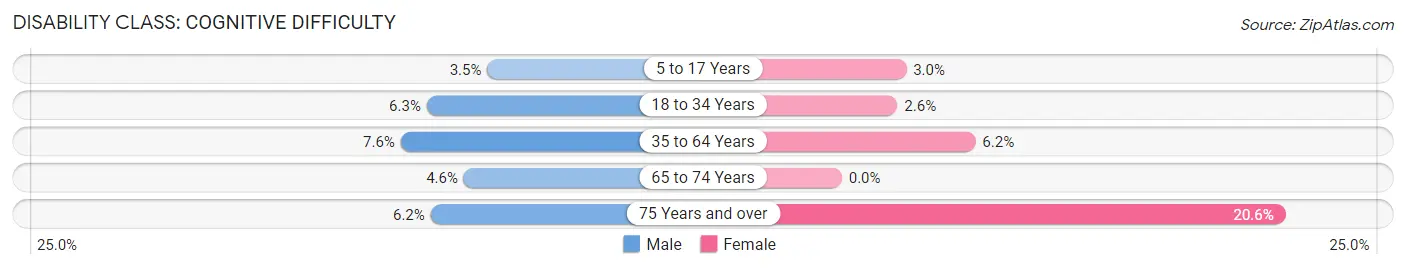
| Age Bracket | Male | Female |
| 5 to 17 Years | 30 (3.5%) | 28 (3.0%) |
| 18 to 34 Years | 63 (6.3%) | 29 (2.6%) |
| 35 to 64 Years | 143 (7.5%) | 132 (6.2%) |
| 65 to 74 Years | 22 (4.6%) | 0 (0.0%) |
| 75 Years and over | 17 (6.2%) | 104 (20.6%) |
Disability Class: Ambulatory Difficulty
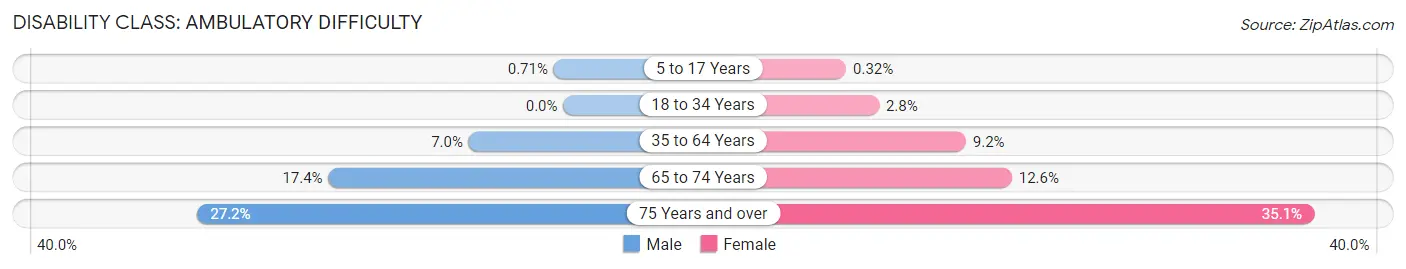
| Age Bracket | Male | Female |
| 5 to 17 Years | 6 (0.7%) | 3 (0.3%) |
| 18 to 34 Years | 0 (0.0%) | 31 (2.8%) |
| 35 to 64 Years | 133 (7.0%) | 196 (9.2%) |
| 65 to 74 Years | 83 (17.4%) | 82 (12.6%) |
| 75 Years and over | 75 (27.2%) | 177 (35.0%) |
Disability Class: Self-Care Difficulty
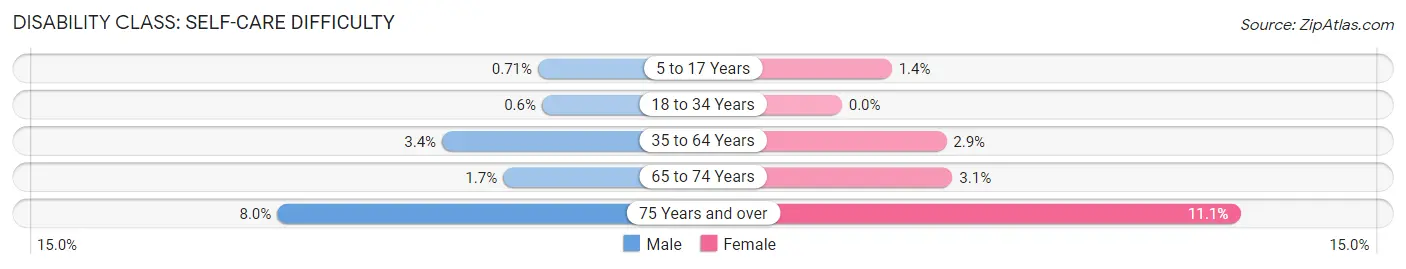
| Age Bracket | Male | Female |
| 5 to 17 Years | 6 (0.7%) | 13 (1.4%) |
| 18 to 34 Years | 6 (0.6%) | 0 (0.0%) |
| 35 to 64 Years | 64 (3.4%) | 62 (2.9%) |
| 65 to 74 Years | 8 (1.7%) | 20 (3.1%) |
| 75 Years and over | 22 (8.0%) | 56 (11.1%) |
Technology Access in Van Wert
Computing Device Access in Van Wert
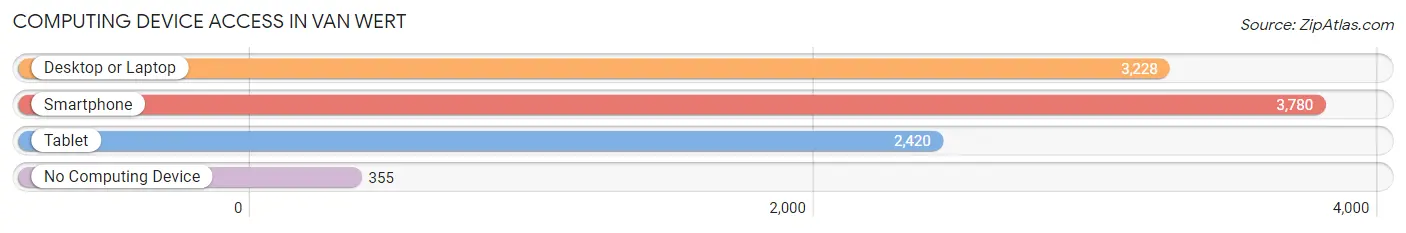
| Device Type | # Households | % Households |
| Desktop or Laptop | 3,228 | 72.0% |
| Smartphone | 3,780 | 84.3% |
| Tablet | 2,420 | 54.0% |
| No Computing Device | 355 | 7.9% |
| Total | 4,485 | 100.0% |
Internet Access in Van Wert
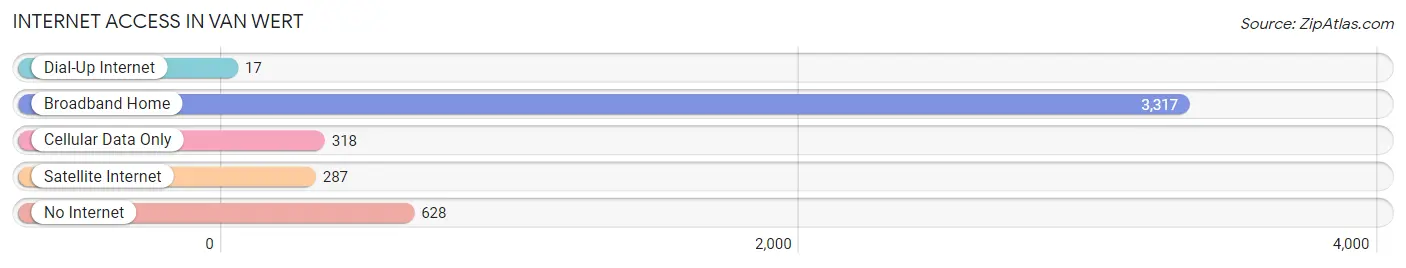
| Internet Type | # Households | % Households |
| Dial-Up Internet | 17 | 0.4% |
| Broadband Home | 3,317 | 74.0% |
| Cellular Data Only | 318 | 7.1% |
| Satellite Internet | 287 | 6.4% |
| No Internet | 628 | 14.0% |
| Total | 4,485 | 100.0% |
Van Wert Summary
Van Wert is a city located in the northwestern part of the state of Ohio, United States. It is the county seat of Van Wert County and is located along the St. Marys River. The city has a population of 10,846 as of the 2010 census.
History
Van Wert was founded in 1820 by William G. Van Wert, a Revolutionary War veteran. The city was named after him and was incorporated in 1837. The city was originally a farming community, but it soon developed into a manufacturing center. The first railroad line in the city was built in 1851, and the city was connected to the rest of the state by the Ohio and Indiana Railroad in 1871.
The city experienced a period of growth in the late 19th and early 20th centuries, with the population increasing from 1,845 in 1880 to 5,845 in 1910. During this period, the city was home to several factories, including a furniture factory, a cigar factory, and a canning factory.
In the mid-20th century, the city experienced a period of decline as the manufacturing industry moved away from the city. The population decreased from 8,845 in 1950 to 7,846 in 2000.
Geography
Van Wert is located at 40°51'N 84°35'W (40.851, -84.584). The city is situated in the northwestern part of the state, about 50 miles south of Toledo and about 70 miles west of Columbus.
The city is located in the St. Marys River Valley, which is part of the Great Black Swamp region. The city is surrounded by farmland and is located near the junction of Interstate 75 and U.S. Route 30.
Economy
Van Wert's economy is largely based on agriculture and manufacturing. The city is home to several factories, including a furniture factory, a cigar factory, and a canning factory. The city is also home to several retail stores, restaurants, and other businesses.
The city is also home to several educational institutions, including Van Wert High School, Van Wert Middle School, and Van Wert Elementary School. The city is also home to the Van Wert County Fairgrounds, which hosts the annual Van Wert County Fair.
Demographics
As of the 2010 census, the city had a population of 10,846. The racial makeup of the city was 94.2% White, 0.7% African American, 0.3% Native American, 0.5% Asian, 0.1% Pacific Islander, 2.3% from other races, and 1.9% from two or more races. Hispanic or Latino of any race were 4.2% of the population.
The median income for a household in the city was $37,945, and the median income for a family was $45,945. The per capita income for the city was $19,845. About 11.2% of families and 14.2% of the population were below the poverty line, including 19.2% of those under age 18 and 8.2% of those age 65 or over.
Van Wert is served by the Van Wert City School District. The district has four elementary schools, one middle school, and one high school. The city is also home to the Van Wert County Public Library.
Common Questions
What is Per Capita Income in Van Wert?
Per Capita income in Van Wert is $29,026.
What is the Median Family Income in Van Wert?
Median Family Income in Van Wert is $59,022.
What is the Median Household income in Van Wert?
Median Household Income in Van Wert is $51,412.
What is Income or Wage Gap in Van Wert?
Income or Wage Gap in Van Wert is 28.7%.
Women in Van Wert earn 71.3 cents for every dollar earned by a man.
What is Family Income Deficit in Van Wert?
Family Income Deficit in Van Wert is $10,123.
Families that are below poverty line in Van Wert earn $10,123 less on average than the poverty threshold level.
What is Inequality or Gini Index in Van Wert?
Inequality or Gini Index in Van Wert is 0.42.
What is the Total Population of Van Wert?
Total Population of Van Wert is 10,828.
What is the Total Male Population of Van Wert?
Total Male Population of Van Wert is 4,920.
What is the Total Female Population of Van Wert?
Total Female Population of Van Wert is 5,908.
What is the Ratio of Males per 100 Females in Van Wert?
There are 83.28 Males per 100 Females in Van Wert.
What is the Ratio of Females per 100 Males in Van Wert?
There are 120.08 Females per 100 Males in Van Wert.
What is the Median Population Age in Van Wert?
Median Population Age in Van Wert is 40.5 Years.
What is the Average Family Size in Van Wert
Average Family Size in Van Wert is 2.9 People.
What is the Average Household Size in Van Wert
Average Household Size in Van Wert is 2.4 People.
How Large is the Labor Force in Van Wert?
There are 5,369 People in the Labor Forcein in Van Wert.
What is the Percentage of People in the Labor Force in Van Wert?
62.1% of People are in the Labor Force in Van Wert.
What is the Unemployment Rate in Van Wert?
Unemployment Rate in Van Wert is 4.5%.