Celina, OH Map & Demographics
Celina Map
Celina Overview
$30,927
PER CAPITA INCOME
$74,823
AVG FAMILY INCOME
$60,060
AVG HOUSEHOLD INCOME
29.3%
WAGE / INCOME GAP [ % ]
70.7¢/ $1
WAGE / INCOME GAP [ $ ]
0.39
INEQUALITY / GINI INDEX
10,974
TOTAL POPULATION
5,316
MALE POPULATION
5,658
FEMALE POPULATION
93.96
MALES / 100 FEMALES
106.43
FEMALES / 100 MALES
37.8
MEDIAN AGE
3.0
AVG FAMILY SIZE
2.4
AVG HOUSEHOLD SIZE
5,801
LABOR FORCE [ PEOPLE ]
68.1%
PERCENT IN LABOR FORCE
2.0%
UNEMPLOYMENT RATE
Celina Zip Codes
Income in Celina
Income Overview in Celina
Per Capita Income in Celina is $30,927, while median incomes of families and households are $74,823 and $60,060 respectively.
| Characteristic | Number | Measure |
| Per Capita Income | 10,974 | $30,927 |
| Median Family Income | 2,620 | $74,823 |
| Mean Family Income | 2,620 | $88,465 |
| Median Household Income | 4,453 | $60,060 |
| Mean Household Income | 4,453 | $73,759 |
| Income Deficit | 2,620 | $0 |
| Wage / Income Gap (%) | 10,974 | 29.34% |
| Wage / Income Gap ($) | 10,974 | 70.66¢ per $1 |
| Gini / Inequality Index | 10,974 | 0.39 |
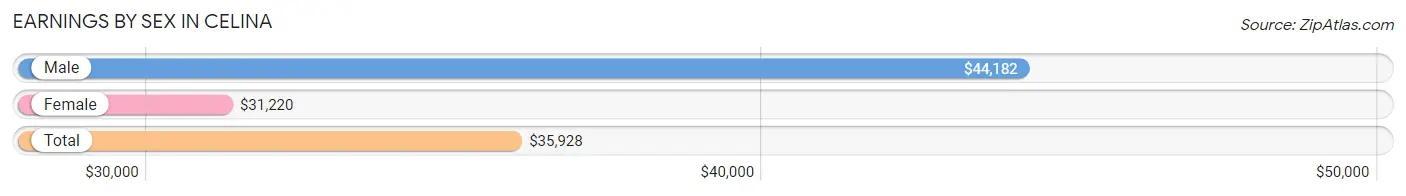
Earnings by Sex in Celina
Average Earnings in Celina are $35,928, $44,182 for men and $31,220 for women, a difference of 29.3%.
| Sex | Number | Average Earnings |
| Male | 2,971 (49.0%) | $44,182 |
| Female | 3,088 (51.0%) | $31,220 |
| Total | 6,059 (100.0%) | $35,928 |
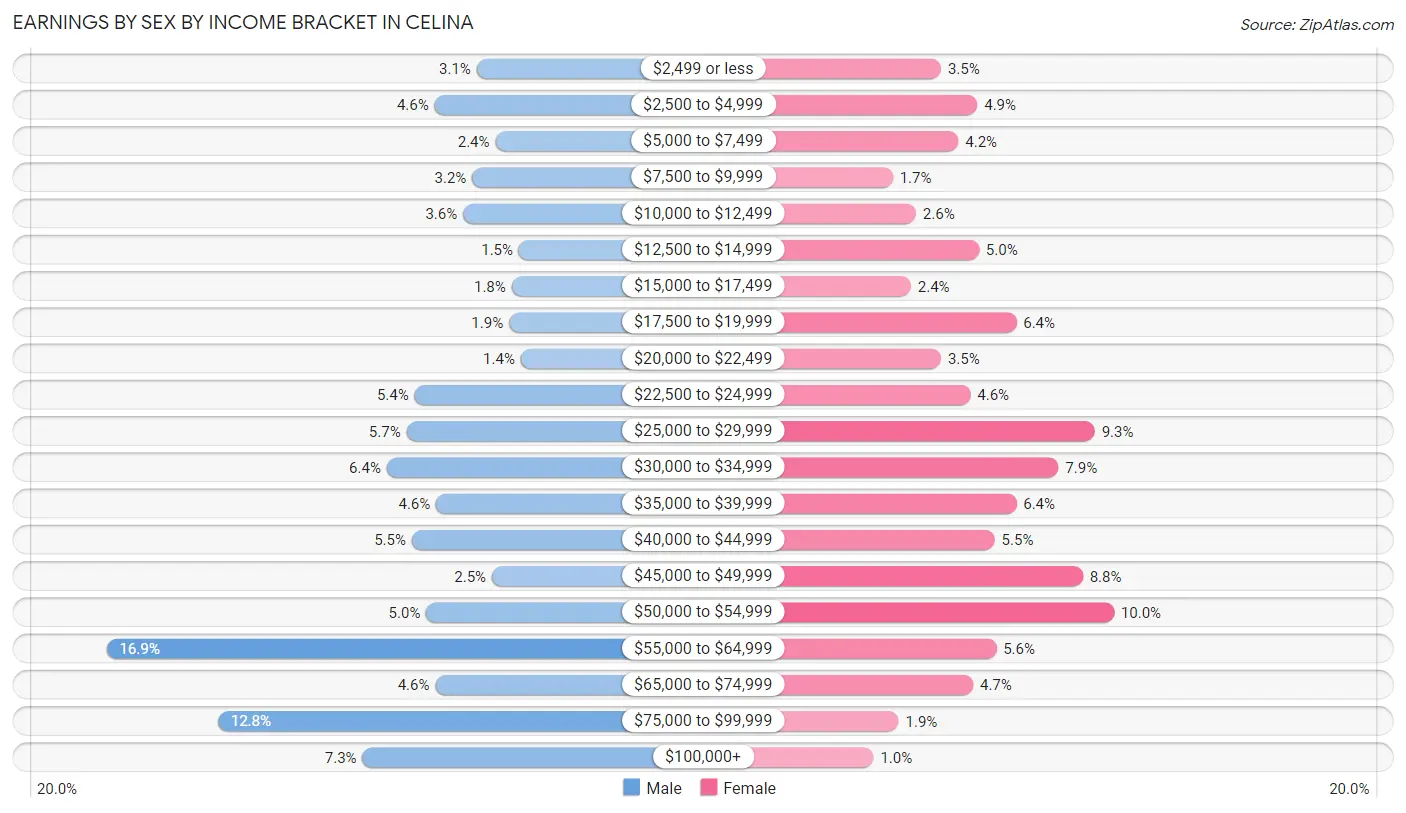
Earnings by Sex by Income Bracket in Celina
The most common earnings brackets in Celina are $55,000 to $64,999 for men (503 | 16.9%) and $50,000 to $54,999 for women (309 | 10.0%).
| Income | Male | Female |
| $2,499 or less | 91 (3.1%) | 109 (3.5%) |
| $2,500 to $4,999 | 138 (4.6%) | 151 (4.9%) |
| $5,000 to $7,499 | 70 (2.4%) | 129 (4.2%) |
| $7,500 to $9,999 | 96 (3.2%) | 53 (1.7%) |
| $10,000 to $12,499 | 106 (3.6%) | 80 (2.6%) |
| $12,500 to $14,999 | 44 (1.5%) | 153 (5.0%) |
| $15,000 to $17,499 | 52 (1.8%) | 74 (2.4%) |
| $17,500 to $19,999 | 55 (1.8%) | 196 (6.4%) |
| $20,000 to $22,499 | 42 (1.4%) | 109 (3.5%) |
| $22,500 to $24,999 | 160 (5.4%) | 143 (4.6%) |
| $25,000 to $29,999 | 169 (5.7%) | 287 (9.3%) |
| $30,000 to $34,999 | 191 (6.4%) | 245 (7.9%) |
| $35,000 to $39,999 | 136 (4.6%) | 196 (6.4%) |
| $40,000 to $44,999 | 163 (5.5%) | 171 (5.5%) |
| $45,000 to $49,999 | 74 (2.5%) | 273 (8.8%) |
| $50,000 to $54,999 | 147 (5.0%) | 309 (10.0%) |
| $55,000 to $64,999 | 503 (16.9%) | 173 (5.6%) |
| $65,000 to $74,999 | 137 (4.6%) | 146 (4.7%) |
| $75,000 to $99,999 | 379 (12.8%) | 60 (1.9%) |
| $100,000+ | 218 (7.3%) | 31 (1.0%) |
| Total | 2,971 (100.0%) | 3,088 (100.0%) |
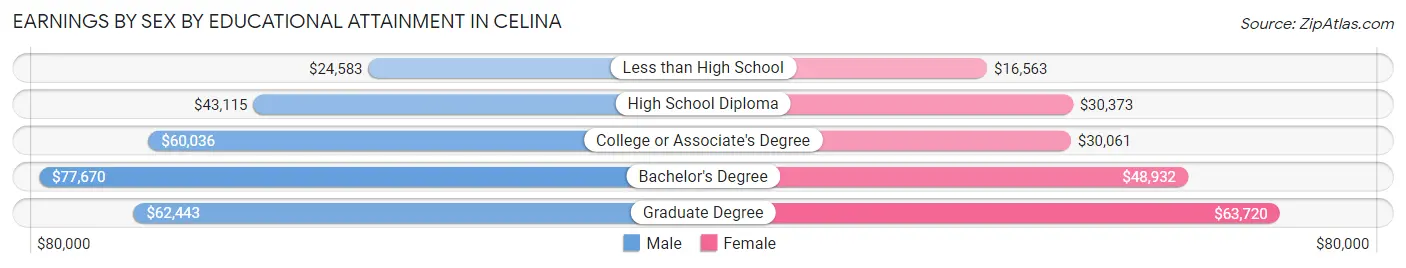
Earnings by Sex by Educational Attainment in Celina
Average earnings in Celina are $53,237 for men and $35,606 for women, a difference of 33.1%. Men with an educational attainment of bachelor's degree enjoy the highest average annual earnings of $77,670, while those with less than high school education earn the least with $24,583. Women with an educational attainment of graduate degree earn the most with the average annual earnings of $63,720, while those with less than high school education have the smallest earnings of $16,563.
| Educational Attainment | Male Income | Female Income |
| Less than High School | $24,583 | $16,563 |
| High School Diploma | $43,115 | $30,373 |
| College or Associate's Degree | $60,036 | $30,061 |
| Bachelor's Degree | $77,670 | $48,932 |
| Graduate Degree | $62,443 | $63,720 |
| Total | $53,237 | $35,606 |
Family Income in Celina
Family Income Brackets in Celina
According to the Celina family income data, there are 610 families falling into the $100,000 to $149,999 income range, which is the most common income bracket and makes up 23.3% of all families. Conversely, the less than $10,000 income bracket is the least frequent group with only 34 families (1.3%) belonging to this category.
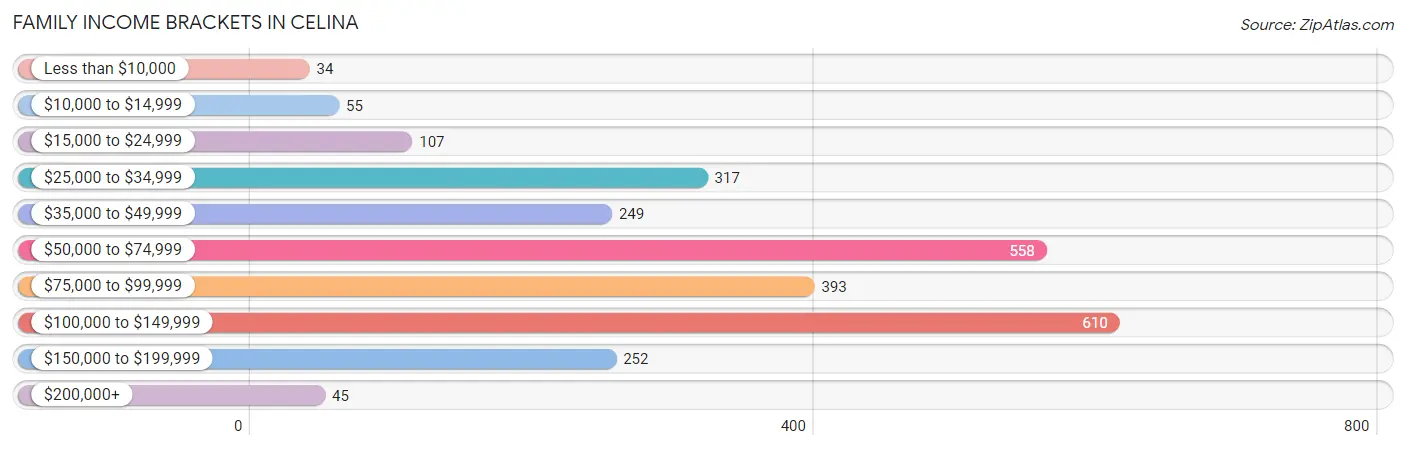
| Income Bracket | # Families | % Families |
| Less than $10,000 | 34 | 1.3% |
| $10,000 to $14,999 | 55 | 2.1% |
| $15,000 to $24,999 | 107 | 4.1% |
| $25,000 to $34,999 | 317 | 12.1% |
| $35,000 to $49,999 | 249 | 9.5% |
| $50,000 to $74,999 | 558 | 21.3% |
| $75,000 to $99,999 | 393 | 15.0% |
| $100,000 to $149,999 | 610 | 23.3% |
| $150,000 to $199,999 | 252 | 9.6% |
| $200,000+ | 45 | 1.7% |
Family Income by Famaliy Size in Celina
4-person families (508 | 19.4%) account for the highest median family income in Celina with $126,757 per family, while 2-person families (1,244 | 47.5%) have the highest median income of $36,288 per family member.
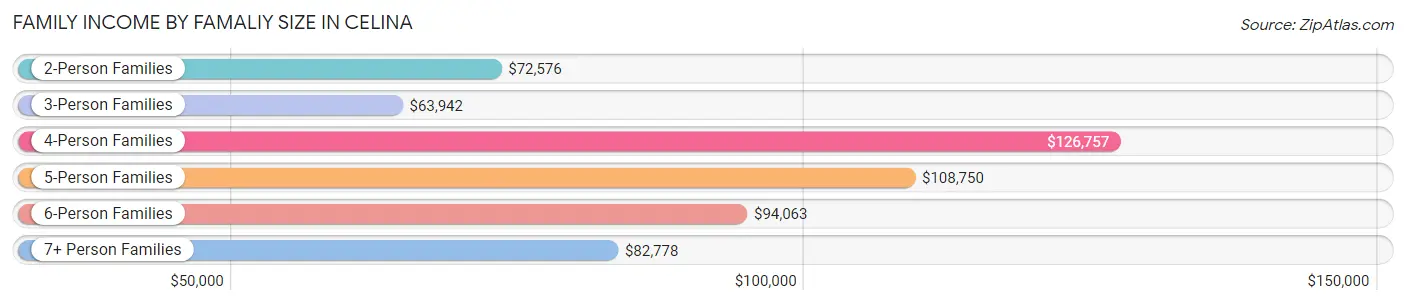
| Income Bracket | # Families | Median Income |
| 2-Person Families | 1,244 (47.5%) | $72,576 |
| 3-Person Families | 678 (25.9%) | $63,942 |
| 4-Person Families | 508 (19.4%) | $126,757 |
| 5-Person Families | 72 (2.8%) | $108,750 |
| 6-Person Families | 58 (2.2%) | $94,063 |
| 7+ Person Families | 60 (2.3%) | $82,778 |
| Total | 2,620 (100.0%) | $74,823 |
Family Income by Number of Earners in Celina
The median family income in Celina is $74,823, with families comprising 3+ earners (371) having the highest median family income of $142,936, while families with no earners (387) have the lowest median family income of $43,702, accounting for 14.2% and 14.8% of families, respectively.
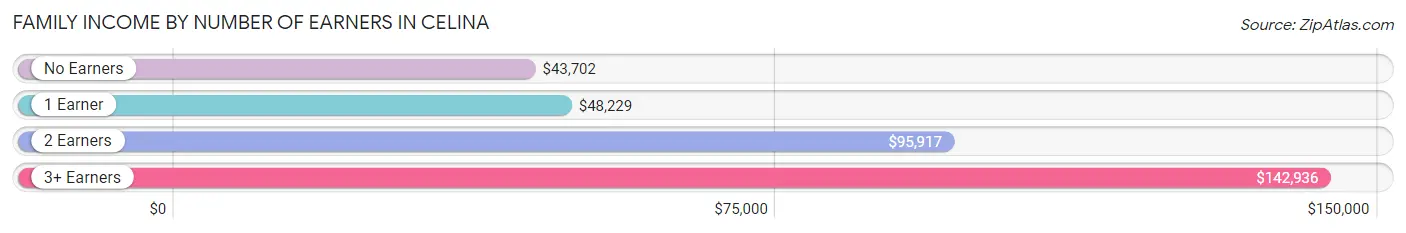
| Number of Earners | # Families | Median Income |
| No Earners | 387 (14.8%) | $43,702 |
| 1 Earner | 829 (31.6%) | $48,229 |
| 2 Earners | 1,033 (39.4%) | $95,917 |
| 3+ Earners | 371 (14.2%) | $142,936 |
| Total | 2,620 (100.0%) | $74,823 |
Household Income in Celina
Household Income Brackets in Celina
With 953 households falling in the category, the $50,000 to $74,999 income range is the most frequent in Celina, accounting for 21.4% of all households. In contrast, only 45 households (1.0%) fall into the $200,000+ income bracket, making it the least populous group.
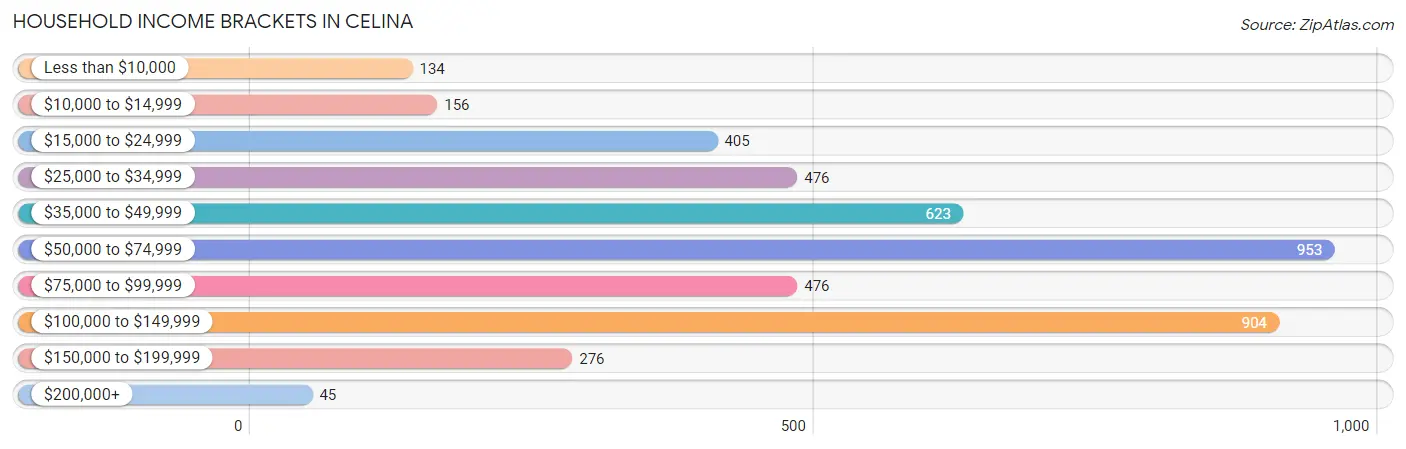
| Income Bracket | # Households | % Households |
| Less than $10,000 | 134 | 3.0% |
| $10,000 to $14,999 | 156 | 3.5% |
| $15,000 to $24,999 | 405 | 9.1% |
| $25,000 to $34,999 | 476 | 10.7% |
| $35,000 to $49,999 | 623 | 14.0% |
| $50,000 to $74,999 | 953 | 21.4% |
| $75,000 to $99,999 | 476 | 10.7% |
| $100,000 to $149,999 | 904 | 20.3% |
| $150,000 to $199,999 | 276 | 6.2% |
| $200,000+ | 45 | 1.0% |
Household Income by Householder Age in Celina
The median household income in Celina is $60,060, with the highest median household income of $76,631 found in the 25 to 44 years age bracket for the primary householder. A total of 1,383 households (31.1%) fall into this category. Meanwhile, the 65+ years age bracket for the primary householder has the lowest median household income of $45,156, with 1,260 households (28.3%) in this group.
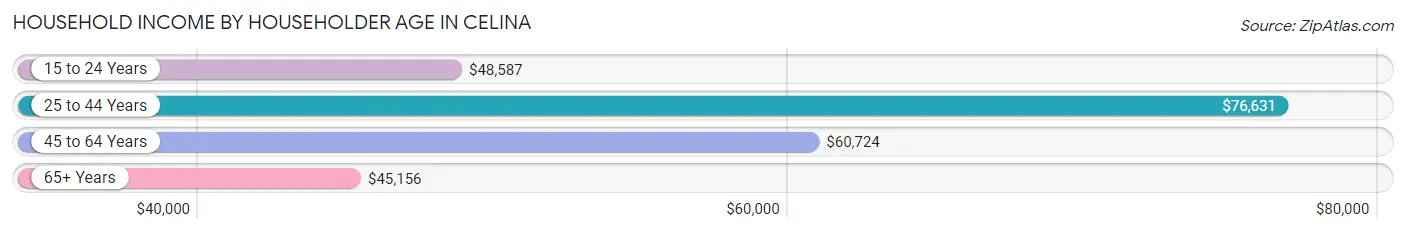
| Income Bracket | # Households | Median Income |
| 15 to 24 Years | 180 (4.0%) | $48,587 |
| 25 to 44 Years | 1,383 (31.1%) | $76,631 |
| 45 to 64 Years | 1,630 (36.6%) | $60,724 |
| 65+ Years | 1,260 (28.3%) | $45,156 |
| Total | 4,453 (100.0%) | $60,060 |
Poverty in Celina
Income Below Poverty by Sex and Age in Celina
With 9.4% poverty level for males and 12.0% for females among the residents of Celina, 6 to 11 year old males and 12 to 14 year old females are the most vulnerable to poverty, with 97 males (34.9%) and 69 females (34.8%) in their respective age groups living below the poverty level.
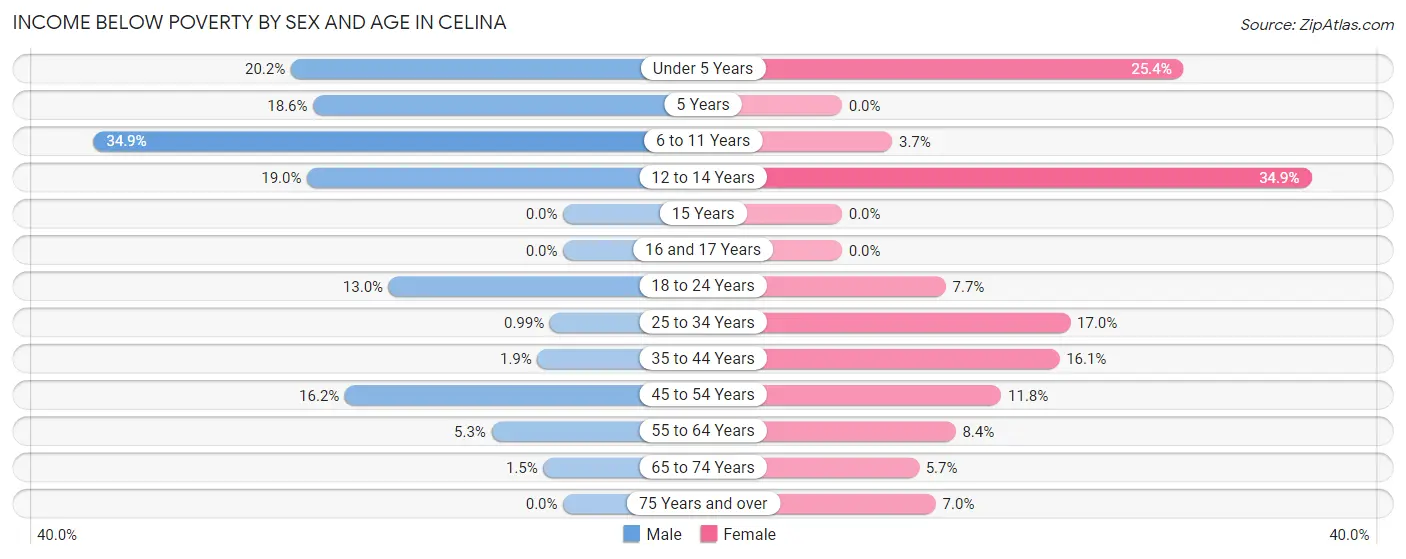
| Age Bracket | Male | Female |
| Under 5 Years | 75 (20.2%) | 121 (25.4%) |
| 5 Years | 18 (18.6%) | 0 (0.0%) |
| 6 to 11 Years | 97 (34.9%) | 15 (3.7%) |
| 12 to 14 Years | 69 (19.0%) | 69 (34.8%) |
| 15 Years | 0 (0.0%) | 0 (0.0%) |
| 16 and 17 Years | 0 (0.0%) | 0 (0.0%) |
| 18 to 24 Years | 76 (13.0%) | 33 (7.7%) |
| 25 to 34 Years | 7 (1.0%) | 120 (17.0%) |
| 35 to 44 Years | 12 (1.9%) | 97 (16.1%) |
| 45 to 54 Years | 86 (16.2%) | 82 (11.8%) |
| 55 to 64 Years | 37 (5.3%) | 58 (8.4%) |
| 65 to 74 Years | 8 (1.5%) | 40 (5.7%) |
| 75 Years and over | 0 (0.0%) | 32 (7.0%) |
| Total | 485 (9.4%) | 667 (12.0%) |
Income Above Poverty by Sex and Age in Celina
According to the poverty statistics in Celina, males aged 15 years and females aged 5 years are the age groups that are most secure financially, with 100.0% of males and 100.0% of females in these age groups living above the poverty line.
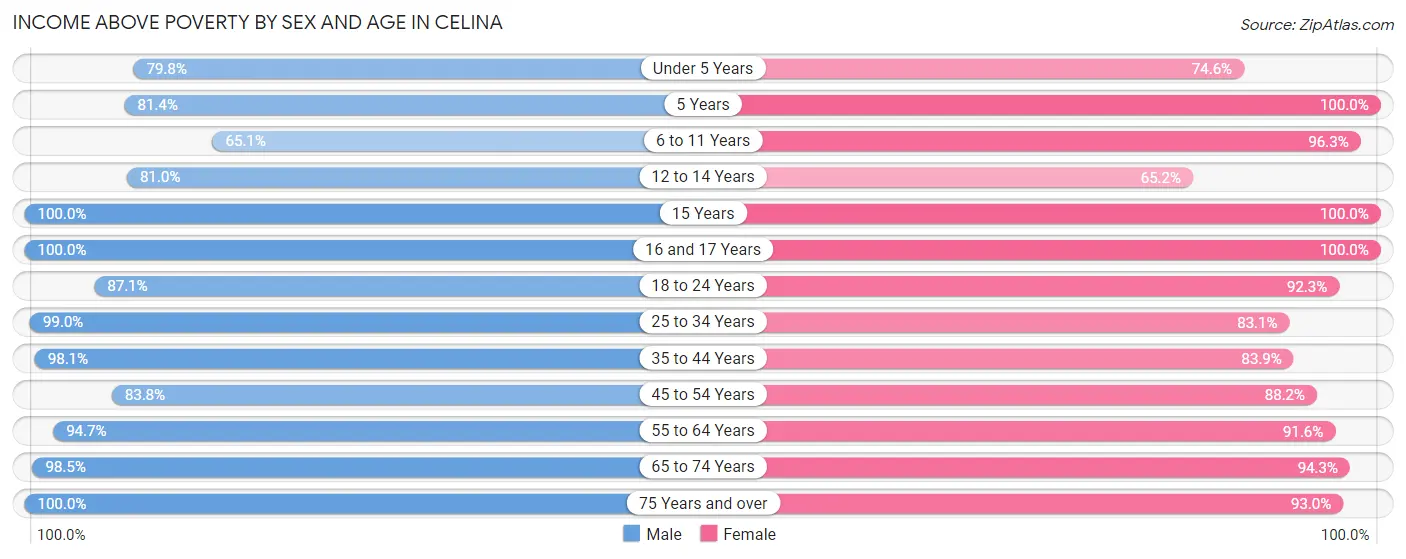
| Age Bracket | Male | Female |
| Under 5 Years | 296 (79.8%) | 356 (74.6%) |
| 5 Years | 79 (81.4%) | 46 (100.0%) |
| 6 to 11 Years | 181 (65.1%) | 387 (96.3%) |
| 12 to 14 Years | 294 (81.0%) | 129 (65.1%) |
| 15 Years | 48 (100.0%) | 10 (100.0%) |
| 16 and 17 Years | 78 (100.0%) | 136 (100.0%) |
| 18 to 24 Years | 511 (87.1%) | 395 (92.3%) |
| 25 to 34 Years | 698 (99.0%) | 588 (83.1%) |
| 35 to 44 Years | 617 (98.1%) | 504 (83.9%) |
| 45 to 54 Years | 445 (83.8%) | 611 (88.2%) |
| 55 to 64 Years | 659 (94.7%) | 629 (91.6%) |
| 65 to 74 Years | 536 (98.5%) | 661 (94.3%) |
| 75 Years and over | 243 (100.0%) | 427 (93.0%) |
| Total | 4,685 (90.6%) | 4,879 (88.0%) |
Income Below Poverty Among Married-Couple Families in Celina
The poverty statistics for married-couple families in Celina show that 1.5% or 29 of the total 1,969 families live below the poverty line. Families with 5 or more children have the highest poverty rate of 25.0%, comprising of 7 families. On the other hand, families with 3 or 4 children have the lowest poverty rate of 0.0%, which includes 0 families.
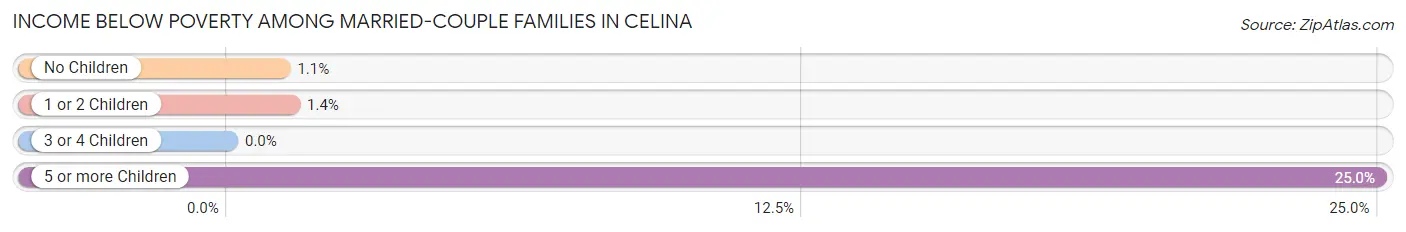
| Children | Above Poverty | Below Poverty |
| No Children | 1,211 (98.9%) | 14 (1.1%) |
| 1 or 2 Children | 584 (98.7%) | 8 (1.3%) |
| 3 or 4 Children | 124 (100.0%) | 0 (0.0%) |
| 5 or more Children | 21 (75.0%) | 7 (25.0%) |
| Total | 1,940 (98.5%) | 29 (1.5%) |
Income Below Poverty Among Single-Parent Households in Celina
According to the poverty data in Celina, 4.0% or 8 single-father households and 34.3% or 154 single-mother households are living below the poverty line. Among single-father households, those with 1 or 2 children have the highest poverty rate, with 8 households (9.3%) experiencing poverty. Likewise, among single-mother households, those with 1 or 2 children have the highest poverty rate, with 136 households (44.4%) falling below the poverty line.
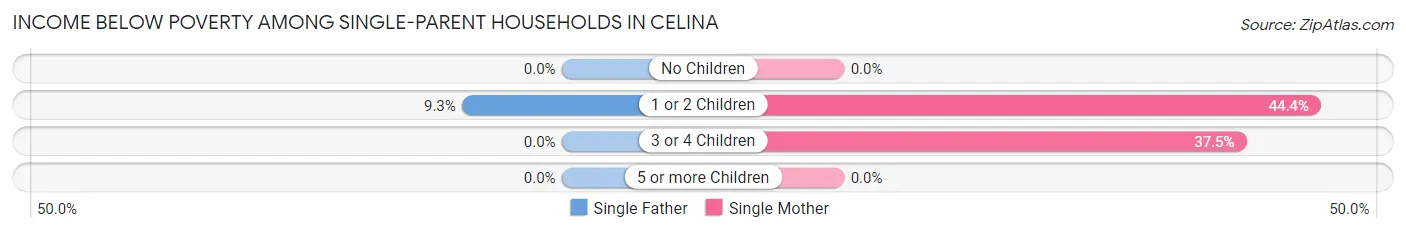
| Children | Single Father | Single Mother |
| No Children | 0 (0.0%) | 0 (0.0%) |
| 1 or 2 Children | 8 (9.3%) | 136 (44.4%) |
| 3 or 4 Children | 0 (0.0%) | 18 (37.5%) |
| 5 or more Children | 0 (0.0%) | 0 (0.0%) |
| Total | 8 (4.0%) | 154 (34.3%) |
Income Below Poverty Among Married-Couple vs Single-Parent Households in Celina
The poverty data for Celina shows that 29 of the married-couple family households (1.5%) and 162 of the single-parent households (24.9%) are living below the poverty level. Within the married-couple family households, those with 5 or more children have the highest poverty rate, with 7 households (25.0%) falling below the poverty line. Among the single-parent households, those with 1 or 2 children have the highest poverty rate, with 144 household (36.7%) living below poverty.
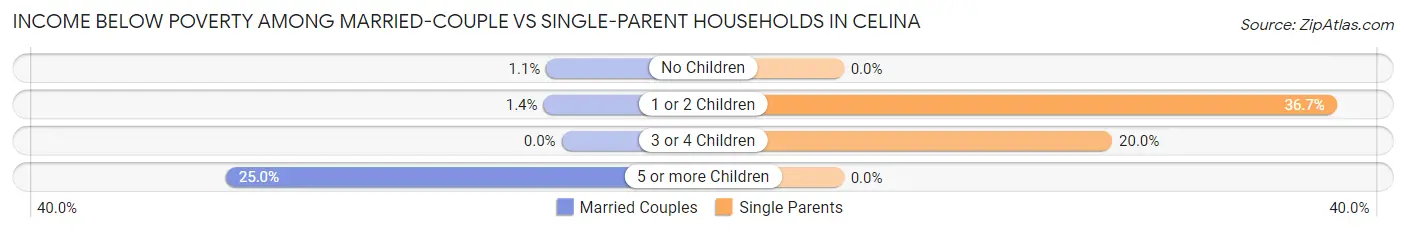
| Children | Married-Couple Families | Single-Parent Households |
| No Children | 14 (1.1%) | 0 (0.0%) |
| 1 or 2 Children | 8 (1.3%) | 144 (36.7%) |
| 3 or 4 Children | 0 (0.0%) | 18 (20.0%) |
| 5 or more Children | 7 (25.0%) | 0 (0.0%) |
| Total | 29 (1.5%) | 162 (24.9%) |
Race in Celina
The most populous races in Celina are White / Caucasian (9,985 | 91.0%), Two or more Races (534 | 4.9%), and Hispanic or Latino (348 | 3.2%).
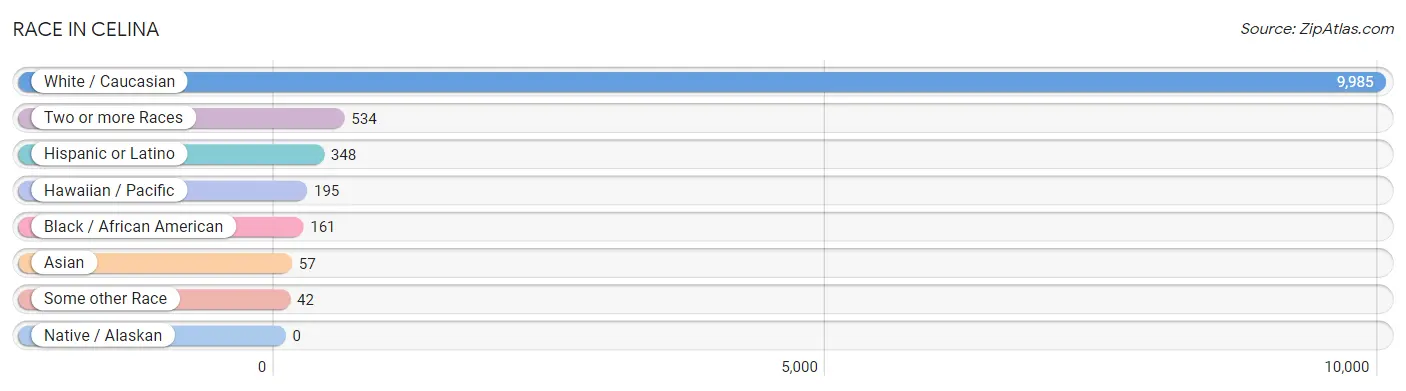
| Race | # Population | % Population |
| Asian | 57 | 0.5% |
| Black / African American | 161 | 1.5% |
| Hawaiian / Pacific | 195 | 1.8% |
| Hispanic or Latino | 348 | 3.2% |
| Native / Alaskan | 0 | 0.0% |
| White / Caucasian | 9,985 | 91.0% |
| Two or more Races | 534 | 4.9% |
| Some other Race | 42 | 0.4% |
| Total | 10,974 | 100.0% |
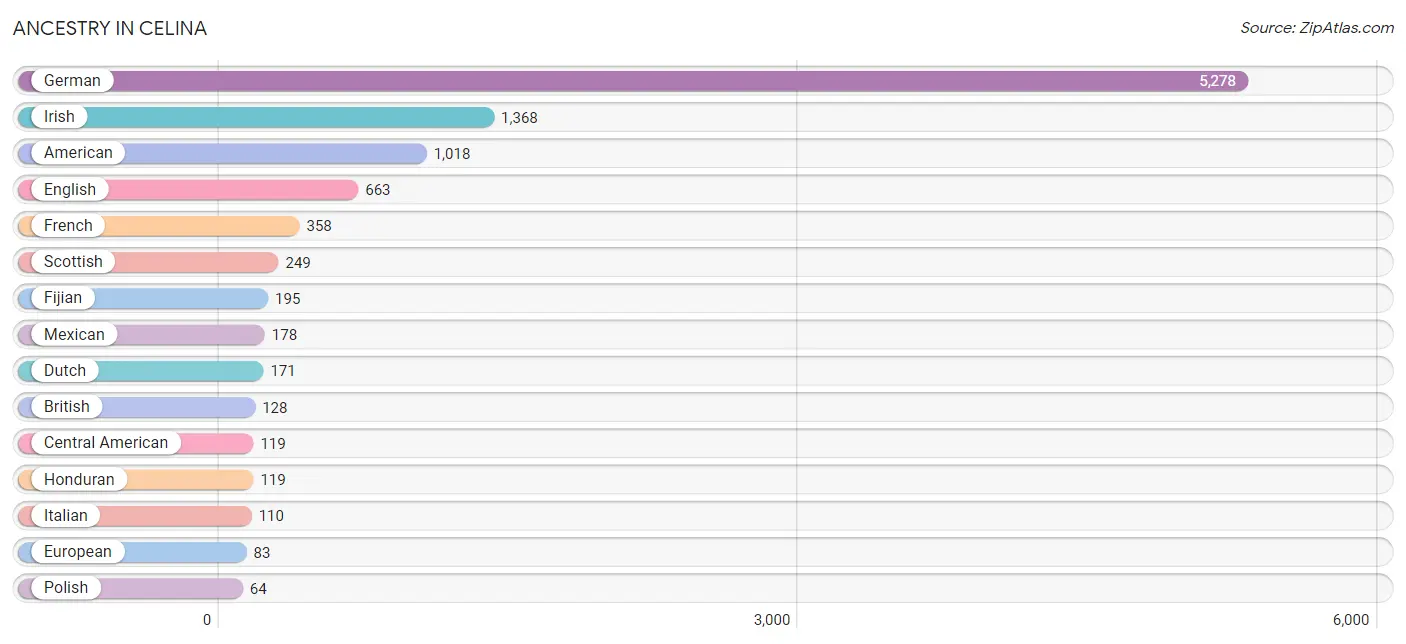
Ancestry in Celina
The most populous ancestries reported in Celina are German (5,278 | 48.1%), Irish (1,368 | 12.5%), American (1,018 | 9.3%), English (663 | 6.0%), and French (358 | 3.3%), together accounting for 79.1% of all Celina residents.
| Ancestry | # Population | % Population |
| Alsatian | 26 | 0.2% |
| American | 1,018 | 9.3% |
| Austrian | 12 | 0.1% |
| Blackfeet | 15 | 0.1% |
| British | 128 | 1.2% |
| Central American | 119 | 1.1% |
| Cherokee | 32 | 0.3% |
| Comanche | 5 | 0.1% |
| Cuban | 23 | 0.2% |
| Czech | 27 | 0.3% |
| Dutch | 171 | 1.6% |
| Eastern European | 22 | 0.2% |
| English | 663 | 6.0% |
| European | 83 | 0.8% |
| Fijian | 195 | 1.8% |
| French | 358 | 3.3% |
| French Canadian | 14 | 0.1% |
| German | 5,278 | 48.1% |
| Honduran | 119 | 1.1% |
| Hungarian | 31 | 0.3% |
| Irish | 1,368 | 12.5% |
| Italian | 110 | 1.0% |
| Korean | 20 | 0.2% |
| Mexican | 178 | 1.6% |
| Northern European | 29 | 0.3% |
| Norwegian | 22 | 0.2% |
| Pennsylvania German | 10 | 0.1% |
| Polish | 64 | 0.6% |
| Portuguese | 8 | 0.1% |
| Scotch-Irish | 61 | 0.6% |
| Scottish | 249 | 2.3% |
| Swedish | 1 | 0.0% |
| Swiss | 29 | 0.3% |
| Welsh | 48 | 0.4% | View All 34 Rows |
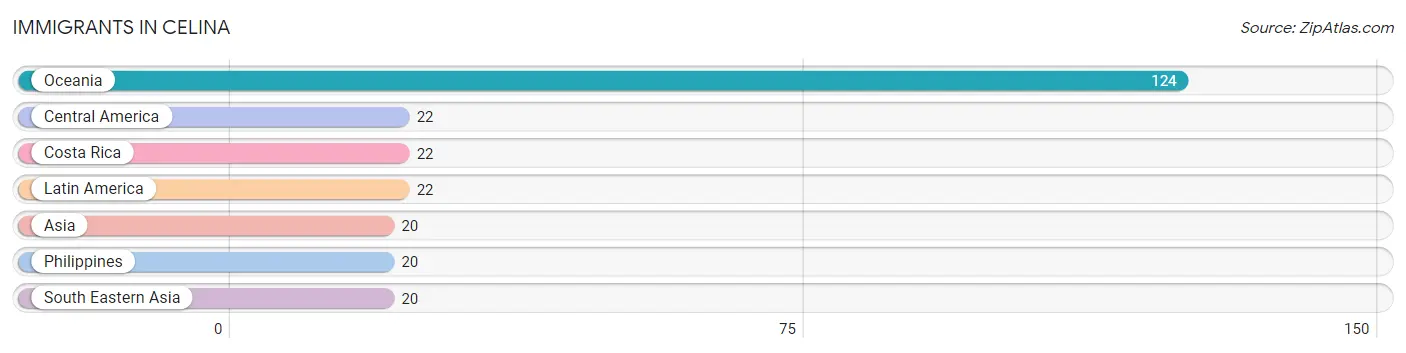
Immigrants in Celina
The most numerous immigrant groups reported in Celina came from Oceania (124 | 1.1%), Central America (22 | 0.2%), Costa Rica (22 | 0.2%), Latin America (22 | 0.2%), and Asia (20 | 0.2%), together accounting for 1.9% of all Celina residents.
| Immigration Origin | # Population | % Population |
| Asia | 20 | 0.2% |
| Central America | 22 | 0.2% |
| Costa Rica | 22 | 0.2% |
| Latin America | 22 | 0.2% |
| Oceania | 124 | 1.1% |
| Philippines | 20 | 0.2% |
| South Eastern Asia | 20 | 0.2% | View All 7 Rows |
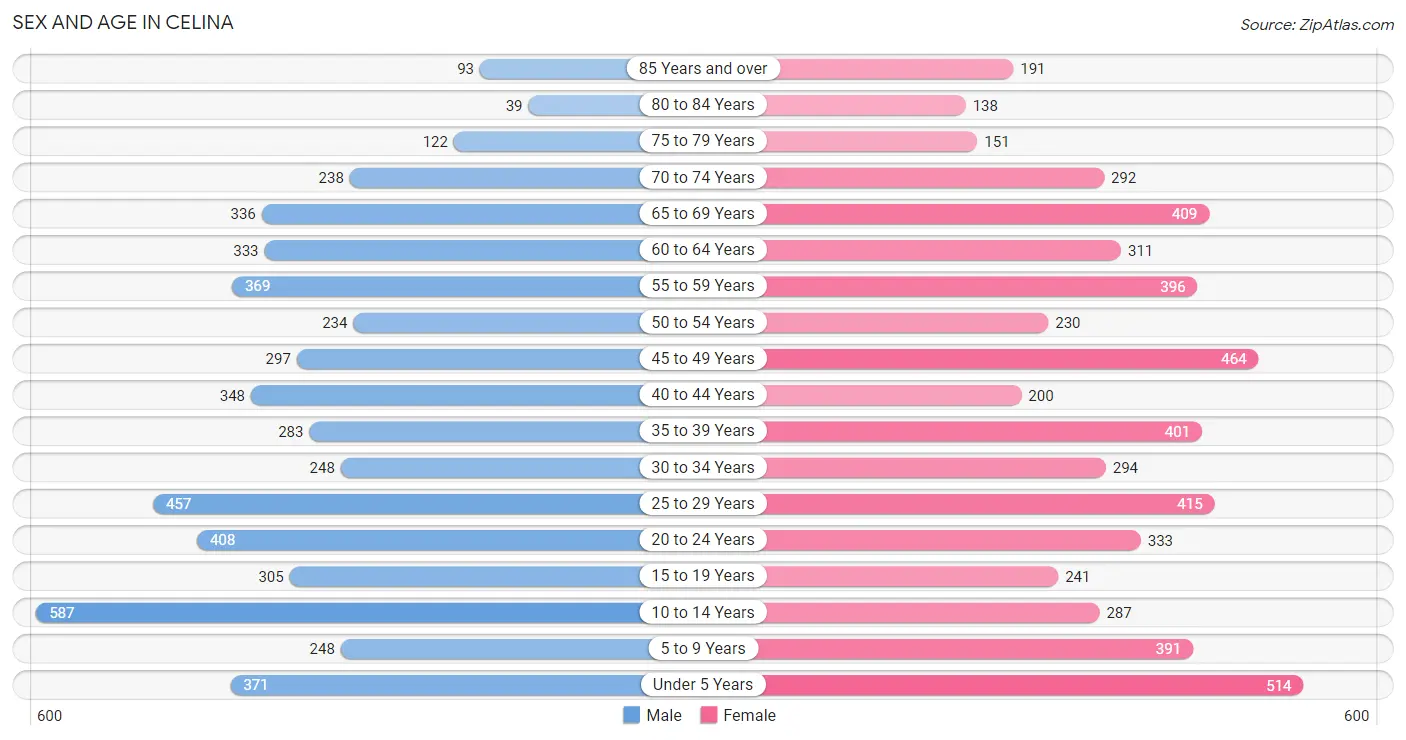
Sex and Age in Celina
Sex and Age in Celina
The most populous age groups in Celina are 10 to 14 Years (587 | 11.0%) for men and Under 5 Years (514 | 9.1%) for women.
| Age Bracket | Male | Female |
| Under 5 Years | 371 (7.0%) | 514 (9.1%) |
| 5 to 9 Years | 248 (4.7%) | 391 (6.9%) |
| 10 to 14 Years | 587 (11.0%) | 287 (5.1%) |
| 15 to 19 Years | 305 (5.7%) | 241 (4.3%) |
| 20 to 24 Years | 408 (7.7%) | 333 (5.9%) |
| 25 to 29 Years | 457 (8.6%) | 415 (7.3%) |
| 30 to 34 Years | 248 (4.7%) | 294 (5.2%) |
| 35 to 39 Years | 283 (5.3%) | 401 (7.1%) |
| 40 to 44 Years | 348 (6.6%) | 200 (3.5%) |
| 45 to 49 Years | 297 (5.6%) | 464 (8.2%) |
| 50 to 54 Years | 234 (4.4%) | 230 (4.1%) |
| 55 to 59 Years | 369 (6.9%) | 396 (7.0%) |
| 60 to 64 Years | 333 (6.3%) | 311 (5.5%) |
| 65 to 69 Years | 336 (6.3%) | 409 (7.2%) |
| 70 to 74 Years | 238 (4.5%) | 292 (5.2%) |
| 75 to 79 Years | 122 (2.3%) | 151 (2.7%) |
| 80 to 84 Years | 39 (0.7%) | 138 (2.4%) |
| 85 Years and over | 93 (1.8%) | 191 (3.4%) |
| Total | 5,316 (100.0%) | 5,658 (100.0%) |
Families and Households in Celina
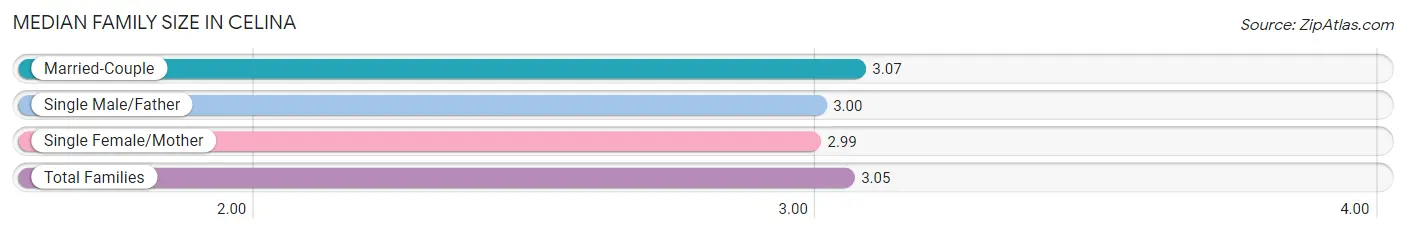
Median Family Size in Celina
The median family size in Celina is 3.05 persons per family, with married-couple families (1,969 | 75.1%) accounting for the largest median family size of 3.07 persons per family. On the other hand, single female/mother families (449 | 17.1%) represent the smallest median family size with 2.99 persons per family.
| Family Type | # Families | Family Size |
| Married-Couple | 1,969 (75.1%) | 3.07 |
| Single Male/Father | 202 (7.7%) | 3.00 |
| Single Female/Mother | 449 (17.1%) | 2.99 |
| Total Families | 2,620 (100.0%) | 3.05 |
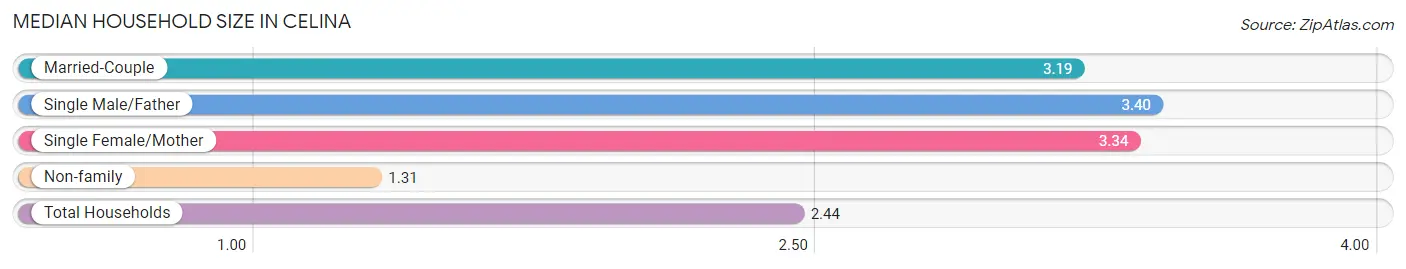
Median Household Size in Celina
The median household size in Celina is 2.44 persons per household, with single male/father households (202 | 4.5%) accounting for the largest median household size of 3.4 persons per household. non-family households (1,833 | 41.2%) represent the smallest median household size with 1.31 persons per household.
| Household Type | # Households | Household Size |
| Married-Couple | 1,969 (44.2%) | 3.19 |
| Single Male/Father | 202 (4.5%) | 3.40 |
| Single Female/Mother | 449 (10.1%) | 3.34 |
| Non-family | 1,833 (41.2%) | 1.31 |
| Total Households | 4,453 (100.0%) | 2.44 |
Household Size by Marriage Status in Celina
Out of a total of 4,453 households in Celina, 2,620 (58.8%) are family households, while 1,833 (41.2%) are nonfamily households. The most numerous type of family households are 2-person households, comprising 1,150, and the most common type of nonfamily households are 1-person households, comprising 1,426.
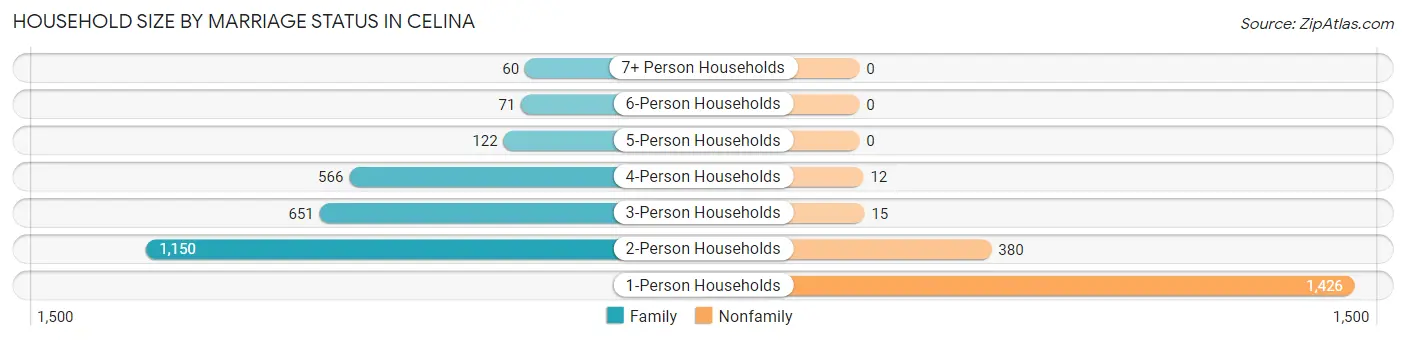
| Household Size | Family Households | Nonfamily Households |
| 1-Person Households | - | 1,426 (32.0%) |
| 2-Person Households | 1,150 (25.8%) | 380 (8.5%) |
| 3-Person Households | 651 (14.6%) | 15 (0.3%) |
| 4-Person Households | 566 (12.7%) | 12 (0.3%) |
| 5-Person Households | 122 (2.7%) | 0 (0.0%) |
| 6-Person Households | 71 (1.6%) | 0 (0.0%) |
| 7+ Person Households | 60 (1.3%) | 0 (0.0%) |
| Total | 2,620 (58.8%) | 1,833 (41.2%) |
Female Fertility in Celina
Fertility by Age in Celina
Average fertility rate in Celina is 71.0 births per 1,000 women. Women in the age bracket of 15 to 19 years have the highest fertility rate with 154.0 births per 1,000 women. Women in the age bracket of 20 to 34 years acount for 43.9% of all women with births.
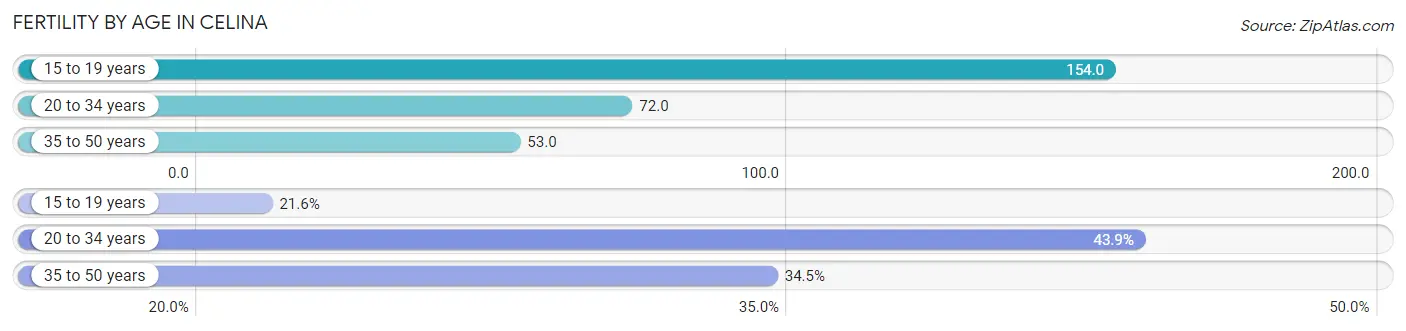
| Age Bracket | Women with Births | Births / 1,000 Women |
| 15 to 19 years | 37 (21.6%) | 154.0 |
| 20 to 34 years | 75 (43.9%) | 72.0 |
| 35 to 50 years | 59 (34.5%) | 53.0 |
| Total | 171 (100.0%) | 71.0 |
Fertility by Age by Marriage Status in Celina
57.9% of women with births (171) in Celina are married. The highest percentage of unmarried women with births falls into 15 to 19 years age bracket with 78.4% of them unmarried at the time of birth, while the lowest percentage of unmarried women with births belong to 20 to 34 years age bracket with 22.7% of them unmarried.
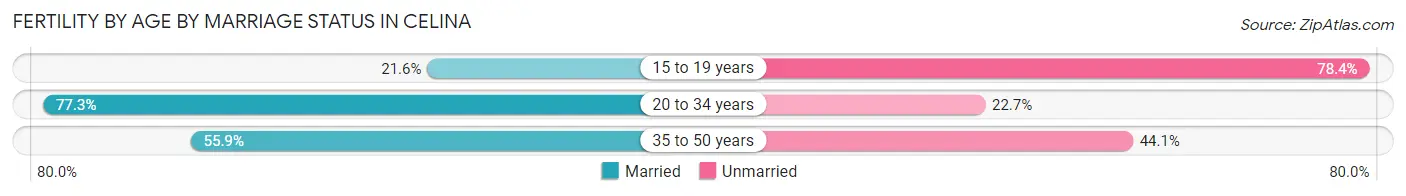
| Age Bracket | Married | Unmarried |
| 15 to 19 years | 8 (21.6%) | 29 (78.4%) |
| 20 to 34 years | 58 (77.3%) | 17 (22.7%) |
| 35 to 50 years | 33 (55.9%) | 26 (44.1%) |
| Total | 99 (57.9%) | 72 (42.1%) |
Fertility by Education in Celina
Average fertility rate in Celina is 71.0 births per 1,000 women. Women with the education attainment of college or associate's degree have the highest fertility rate of 118.0 births per 1,000 women, while women with the education attainment of less than high school have the lowest fertility at 30.0 births per 1,000 women. Women with the education attainment of college or associate's degree represent 42.7% of all women with births.
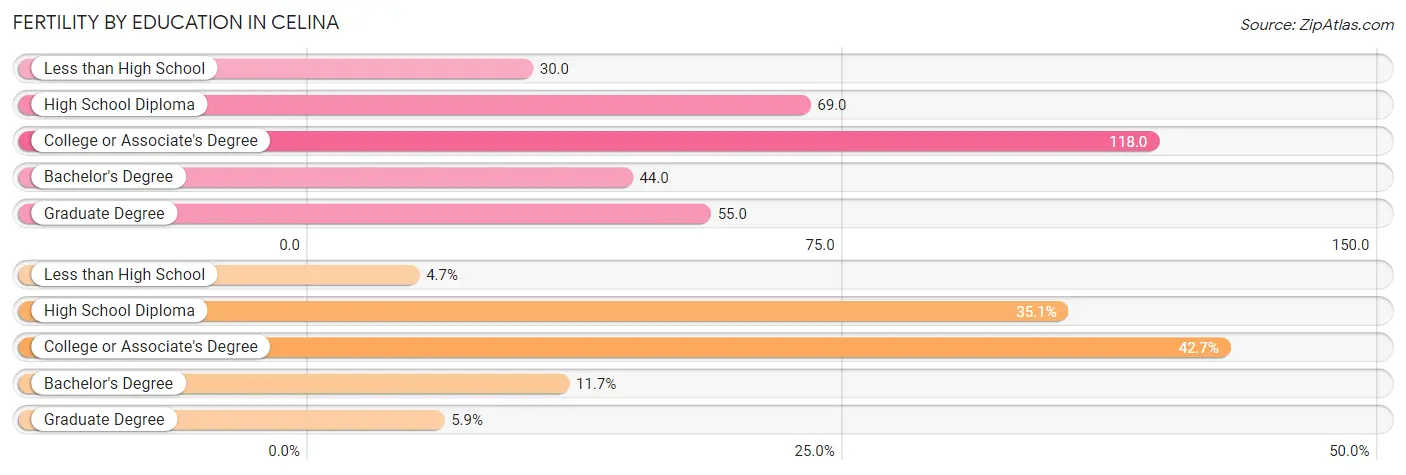
| Educational Attainment | Women with Births | Births / 1,000 Women |
| Less than High School | 8 (4.7%) | 30.0 |
| High School Diploma | 60 (35.1%) | 69.0 |
| College or Associate's Degree | 73 (42.7%) | 118.0 |
| Bachelor's Degree | 20 (11.7%) | 44.0 |
| Graduate Degree | 10 (5.9%) | 55.0 |
| Total | 171 (100.0%) | 71.0 |
Fertility by Education by Marriage Status in Celina
42.1% of women with births in Celina are unmarried. Women with the educational attainment of less than high school are most likely to be married with 100.0% of them married at childbirth, while women with the educational attainment of high school diploma are least likely to be married with 60.0% of them unmarried at childbirth.
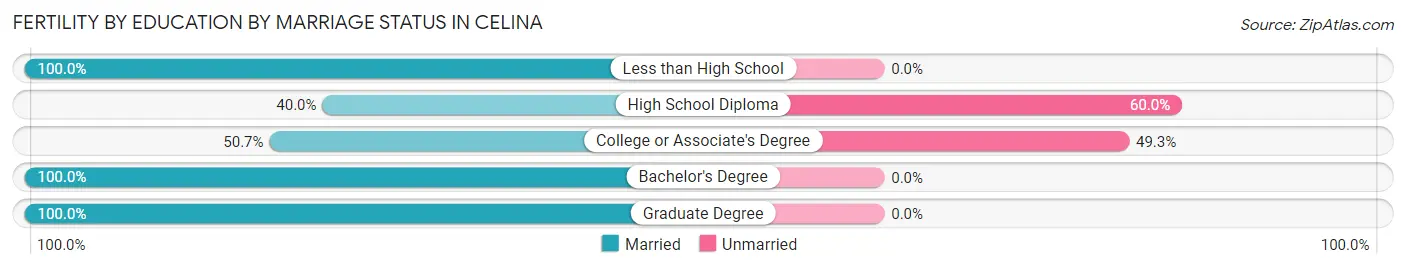
| Educational Attainment | Married | Unmarried |
| Less than High School | 8 (100.0%) | 0 (0.0%) |
| High School Diploma | 24 (40.0%) | 36 (60.0%) |
| College or Associate's Degree | 37 (50.7%) | 36 (49.3%) |
| Bachelor's Degree | 20 (100.0%) | 0 (0.0%) |
| Graduate Degree | 10 (100.0%) | 0 (0.0%) |
| Total | 99 (57.9%) | 72 (42.1%) |
Employment Characteristics in Celina
Employment by Class of Employer in Celina
Among the 5,566 employed individuals in Celina, private company employees (3,870 | 69.5%), local government employees (651 | 11.7%), and not-for-profit organizations (453 | 8.1%) make up the most common classes of employment.
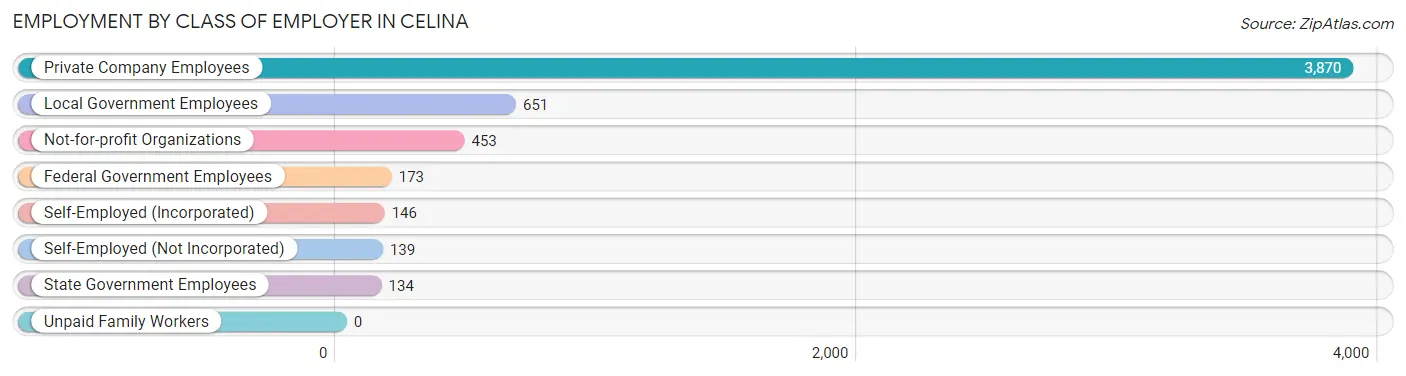
| Employer Class | # Employees | % Employees |
| Private Company Employees | 3,870 | 69.5% |
| Self-Employed (Incorporated) | 146 | 2.6% |
| Self-Employed (Not Incorporated) | 139 | 2.5% |
| Not-for-profit Organizations | 453 | 8.1% |
| Local Government Employees | 651 | 11.7% |
| State Government Employees | 134 | 2.4% |
| Federal Government Employees | 173 | 3.1% |
| Unpaid Family Workers | 0 | 0.0% |
| Total | 5,566 | 100.0% |
Employment Status by Age in Celina
According to the labor force statistics for Celina, out of the total population over 16 years of age (8,518), 68.1% or 5,801 individuals are in the labor force, with 2.0% or 116 of them unemployed. The age group with the highest labor force participation rate is 30 to 34 years, with 91.7% or 497 individuals in the labor force. Within the labor force, the 20 to 24 years age range has the highest percentage of unemployed individuals, with 6.8% or 45 of them being unemployed.
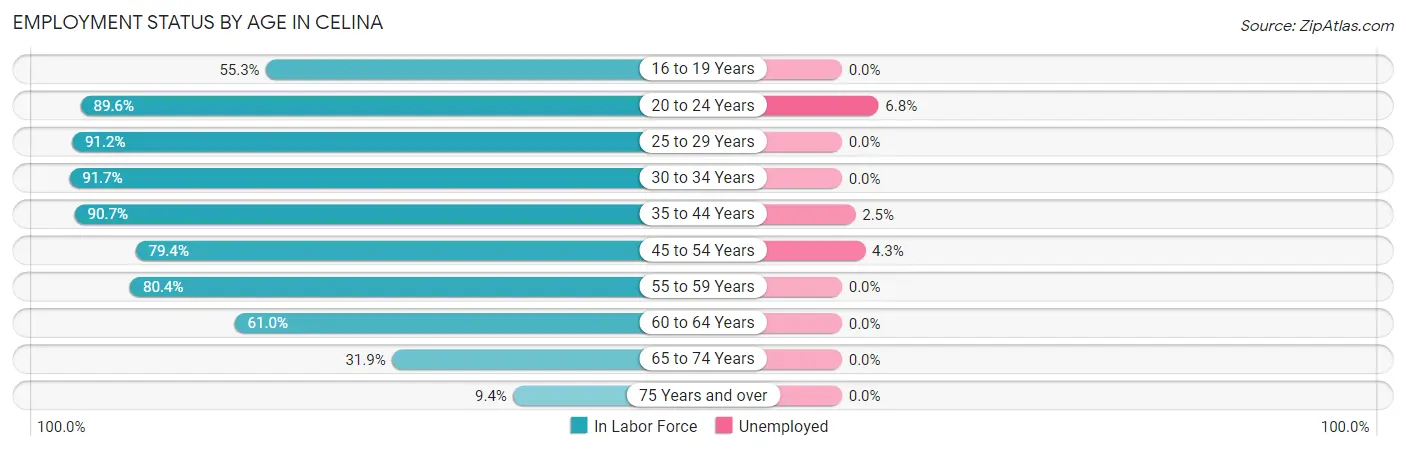
| Age Bracket | In Labor Force | Unemployed |
| 16 to 19 Years | 270 (55.3%) | 0 (0.0%) |
| 20 to 24 Years | 664 (89.6%) | 45 (6.8%) |
| 25 to 29 Years | 795 (91.2%) | 0 (0.0%) |
| 30 to 34 Years | 497 (91.7%) | 0 (0.0%) |
| 35 to 44 Years | 1,117 (90.7%) | 28 (2.5%) |
| 45 to 54 Years | 973 (79.4%) | 42 (4.3%) |
| 55 to 59 Years | 615 (80.4%) | 0 (0.0%) |
| 60 to 64 Years | 393 (61.0%) | 0 (0.0%) |
| 65 to 74 Years | 407 (31.9%) | 0 (0.0%) |
| 75 Years and over | 69 (9.4%) | 0 (0.0%) |
| Total | 5,801 (68.1%) | 116 (2.0%) |
Employment Status by Educational Attainment in Celina
According to labor force statistics for Celina, 83.1% of individuals (4,388) out of the total population between 25 and 64 years of age (5,280) are in the labor force, with 1.6% or 70 of them being unemployed. The group with the highest labor force participation rate are those with the educational attainment of bachelor's degree or higher, with 94.1% or 1,156 individuals in the labor force. Within the labor force, individuals with less than high school education have the highest percentage of unemployment, with 4.1% or 10 of them being unemployed.
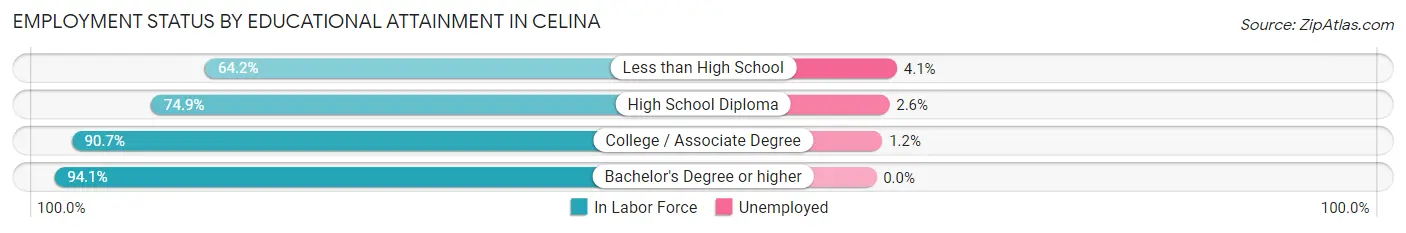
| Educational Attainment | In Labor Force | Unemployed |
| Less than High School | 242 (64.2%) | 15 (4.1%) |
| High School Diploma | 1,614 (74.9%) | 56 (2.6%) |
| College / Associate Degree | 1,379 (90.7%) | 18 (1.2%) |
| Bachelor's Degree or higher | 1,156 (94.1%) | 0 (0.0%) |
| Total | 4,388 (83.1%) | 84 (1.6%) |
Employment Occupations by Sex in Celina
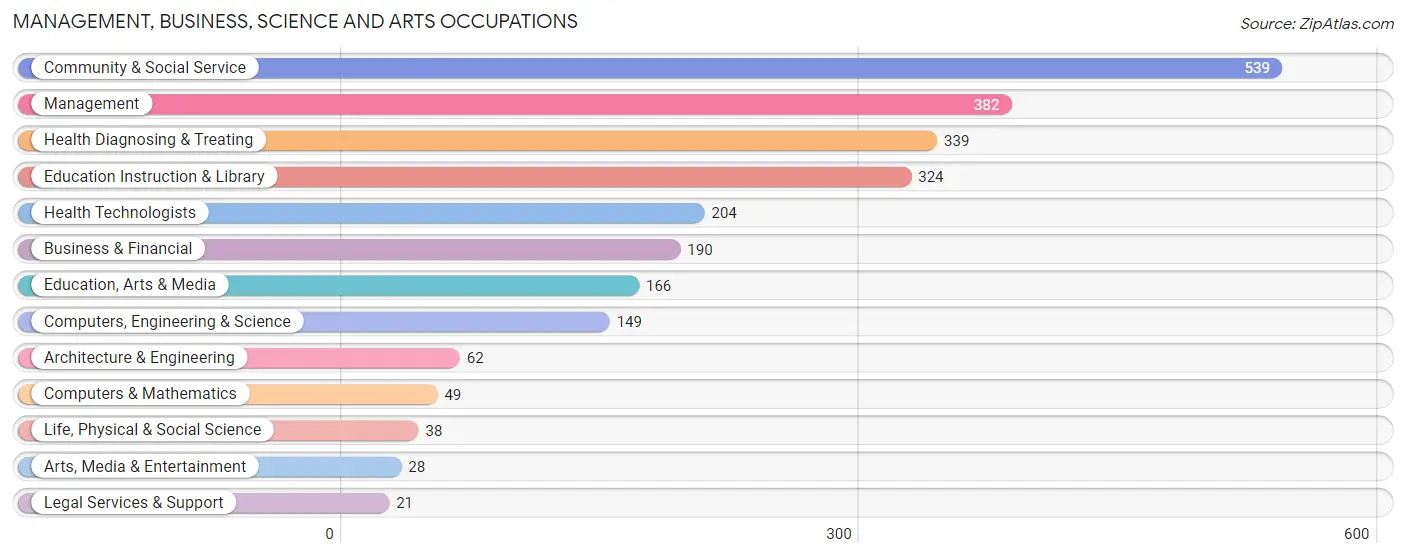
Management, Business, Science and Arts Occupations
The most common Management, Business, Science and Arts occupations in Celina are Community & Social Service (539 | 9.5%), Management (382 | 6.8%), Health Diagnosing & Treating (339 | 6.0%), Education Instruction & Library (324 | 5.7%), and Health Technologists (204 | 3.6%).
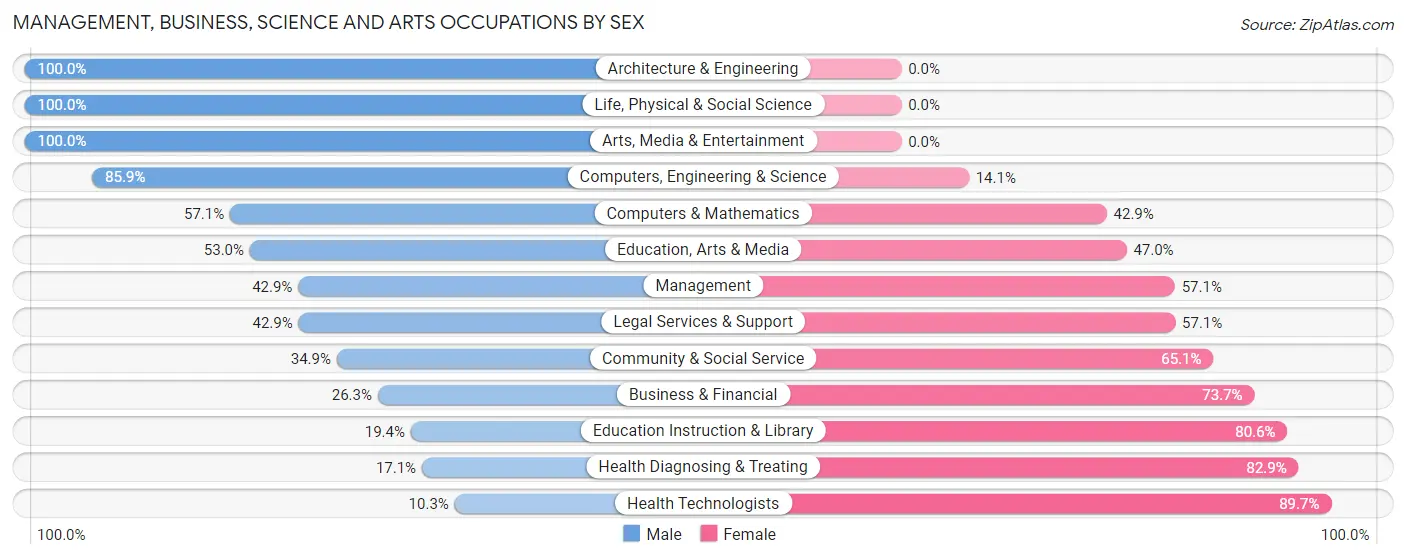
Management, Business, Science and Arts Occupations by Sex
Within the Management, Business, Science and Arts occupations in Celina, the most male-oriented occupations are Architecture & Engineering (100.0%), Life, Physical & Social Science (100.0%), and Arts, Media & Entertainment (100.0%), while the most female-oriented occupations are Health Technologists (89.7%), Health Diagnosing & Treating (82.9%), and Education Instruction & Library (80.6%).
| Occupation | Male | Female |
| Management | 164 (42.9%) | 218 (57.1%) |
| Business & Financial | 50 (26.3%) | 140 (73.7%) |
| Computers, Engineering & Science | 128 (85.9%) | 21 (14.1%) |
| Computers & Mathematics | 28 (57.1%) | 21 (42.9%) |
| Architecture & Engineering | 62 (100.0%) | 0 (0.0%) |
| Life, Physical & Social Science | 38 (100.0%) | 0 (0.0%) |
| Community & Social Service | 188 (34.9%) | 351 (65.1%) |
| Education, Arts & Media | 88 (53.0%) | 78 (47.0%) |
| Legal Services & Support | 9 (42.9%) | 12 (57.1%) |
| Education Instruction & Library | 63 (19.4%) | 261 (80.6%) |
| Arts, Media & Entertainment | 28 (100.0%) | 0 (0.0%) |
| Health Diagnosing & Treating | 58 (17.1%) | 281 (82.9%) |
| Health Technologists | 21 (10.3%) | 183 (89.7%) |
| Total (Category) | 588 (36.8%) | 1,011 (63.2%) |
| Total (Overall) | 2,800 (49.4%) | 2,863 (50.6%) |
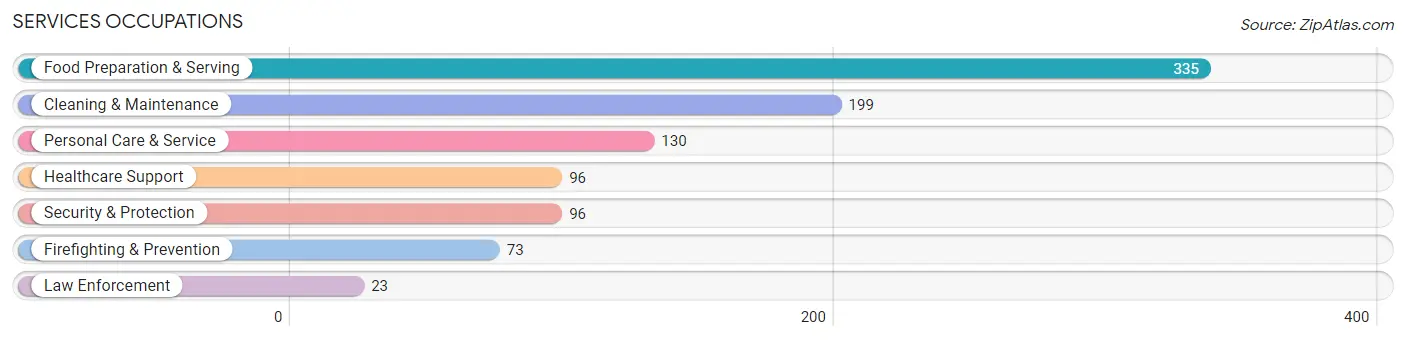
Services Occupations
The most common Services occupations in Celina are Food Preparation & Serving (335 | 5.9%), Cleaning & Maintenance (199 | 3.5%), Personal Care & Service (130 | 2.3%), Healthcare Support (96 | 1.7%), and Security & Protection (96 | 1.7%).
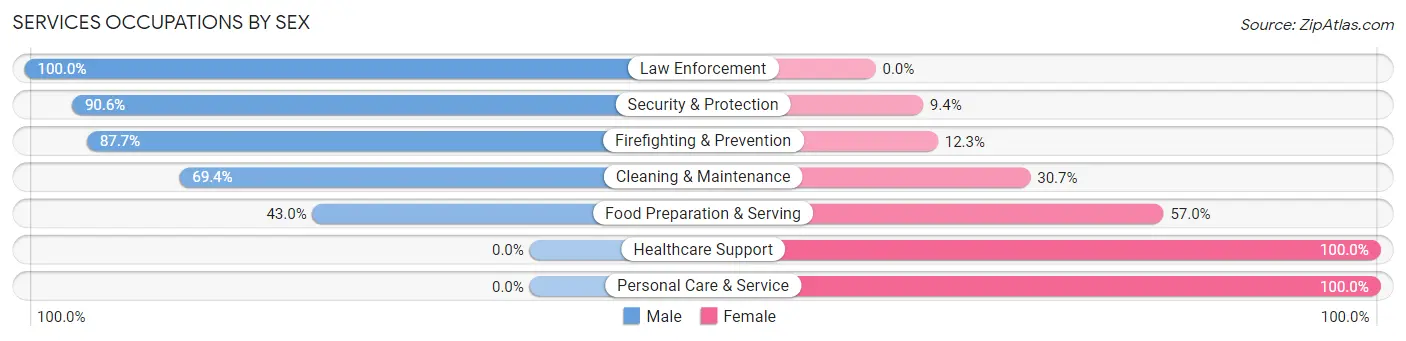
Services Occupations by Sex
Within the Services occupations in Celina, the most male-oriented occupations are Law Enforcement (100.0%), Security & Protection (90.6%), and Firefighting & Prevention (87.7%), while the most female-oriented occupations are Healthcare Support (100.0%), Personal Care & Service (100.0%), and Food Preparation & Serving (57.0%).
| Occupation | Male | Female |
| Healthcare Support | 0 (0.0%) | 96 (100.0%) |
| Security & Protection | 87 (90.6%) | 9 (9.4%) |
| Firefighting & Prevention | 64 (87.7%) | 9 (12.3%) |
| Law Enforcement | 23 (100.0%) | 0 (0.0%) |
| Food Preparation & Serving | 144 (43.0%) | 191 (57.0%) |
| Cleaning & Maintenance | 138 (69.4%) | 61 (30.6%) |
| Personal Care & Service | 0 (0.0%) | 130 (100.0%) |
| Total (Category) | 369 (43.1%) | 487 (56.9%) |
| Total (Overall) | 2,800 (49.4%) | 2,863 (50.6%) |
Sales and Office Occupations
The most common Sales and Office occupations in Celina are Office & Administration (664 | 11.7%), and Sales & Related (382 | 6.8%).

Sales and Office Occupations by Sex
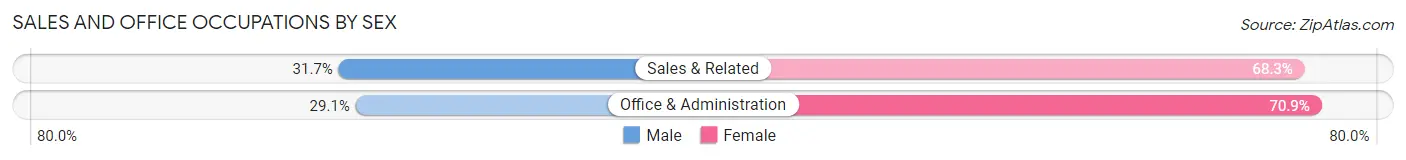
| Occupation | Male | Female |
| Sales & Related | 121 (31.7%) | 261 (68.3%) |
| Office & Administration | 193 (29.1%) | 471 (70.9%) |
| Total (Category) | 314 (30.0%) | 732 (70.0%) |
| Total (Overall) | 2,800 (49.4%) | 2,863 (50.6%) |
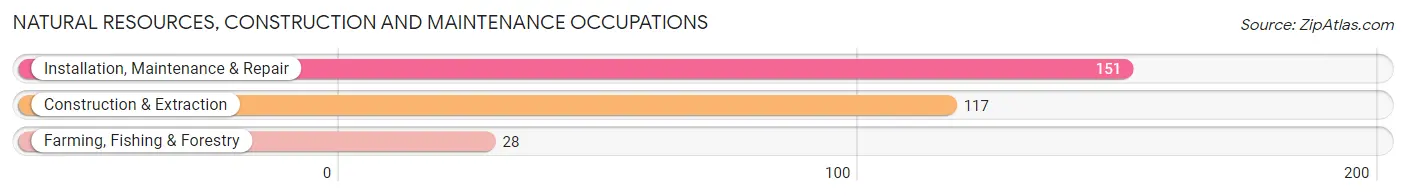
Natural Resources, Construction and Maintenance Occupations
The most common Natural Resources, Construction and Maintenance occupations in Celina are Installation, Maintenance & Repair (151 | 2.7%), Construction & Extraction (117 | 2.1%), and Farming, Fishing & Forestry (28 | 0.5%).
Natural Resources, Construction and Maintenance Occupations by Sex
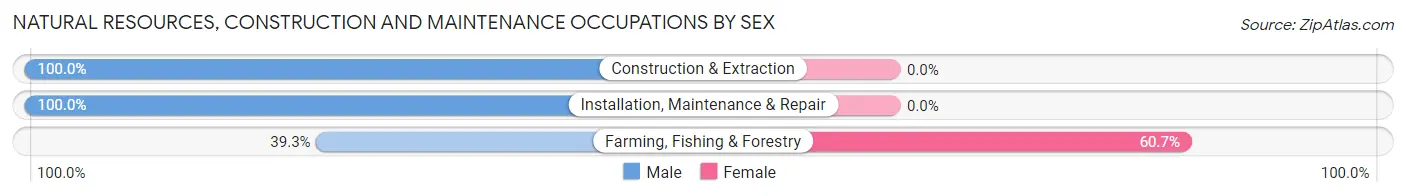
| Occupation | Male | Female |
| Farming, Fishing & Forestry | 11 (39.3%) | 17 (60.7%) |
| Construction & Extraction | 117 (100.0%) | 0 (0.0%) |
| Installation, Maintenance & Repair | 151 (100.0%) | 0 (0.0%) |
| Total (Category) | 279 (94.3%) | 17 (5.7%) |
| Total (Overall) | 2,800 (49.4%) | 2,863 (50.6%) |
Production, Transportation and Moving Occupations
The most common Production, Transportation and Moving occupations in Celina are Production (1,352 | 23.9%), Material Moving (354 | 6.2%), and Transportation (160 | 2.8%).
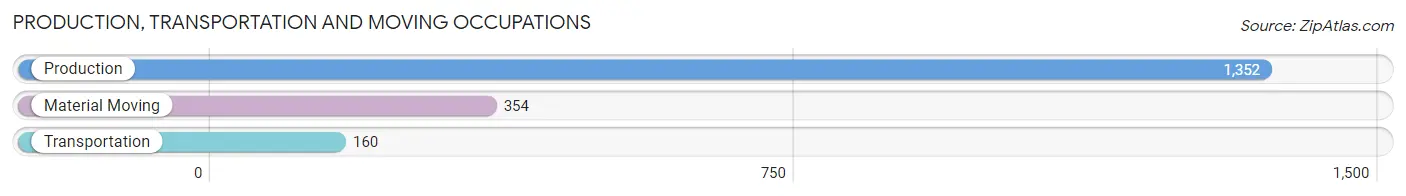
Production, Transportation and Moving Occupations by Sex
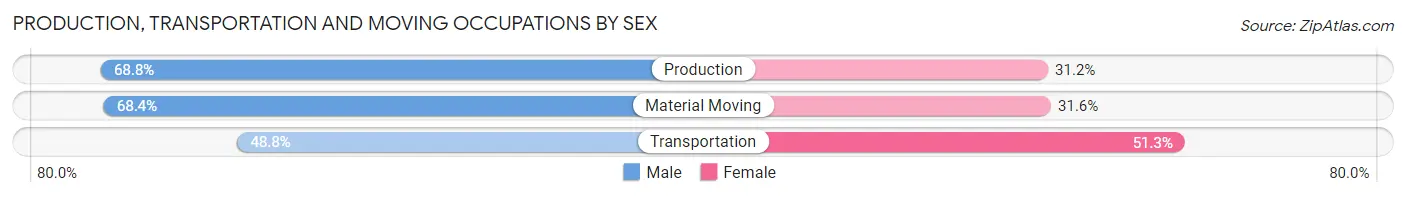
| Occupation | Male | Female |
| Production | 930 (68.8%) | 422 (31.2%) |
| Transportation | 78 (48.7%) | 82 (51.2%) |
| Material Moving | 242 (68.4%) | 112 (31.6%) |
| Total (Category) | 1,250 (67.0%) | 616 (33.0%) |
| Total (Overall) | 2,800 (49.4%) | 2,863 (50.6%) |
Employment Industries by Sex in Celina
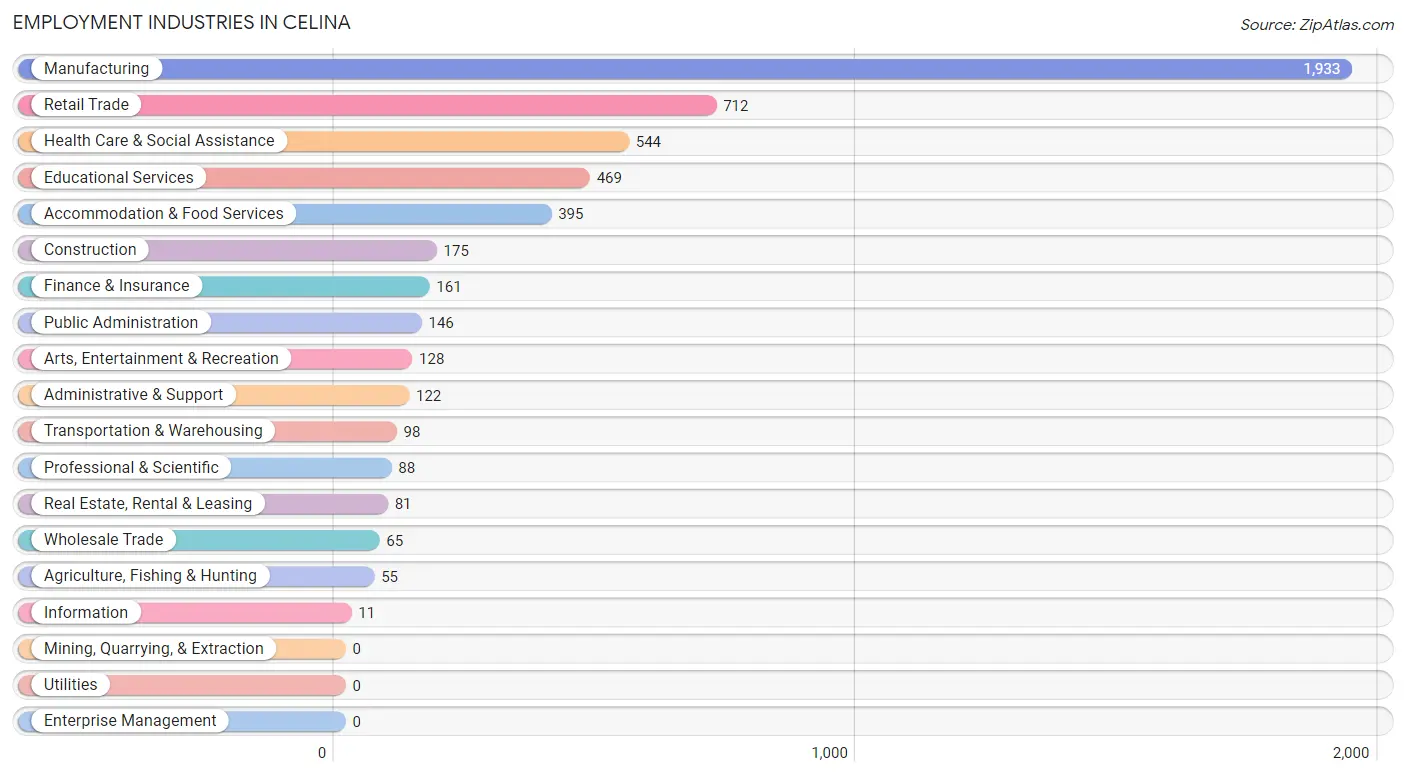
Employment Industries in Celina
The major employment industries in Celina include Manufacturing (1,933 | 34.1%), Retail Trade (712 | 12.6%), Health Care & Social Assistance (544 | 9.6%), Educational Services (469 | 8.3%), and Accommodation & Food Services (395 | 7.0%).
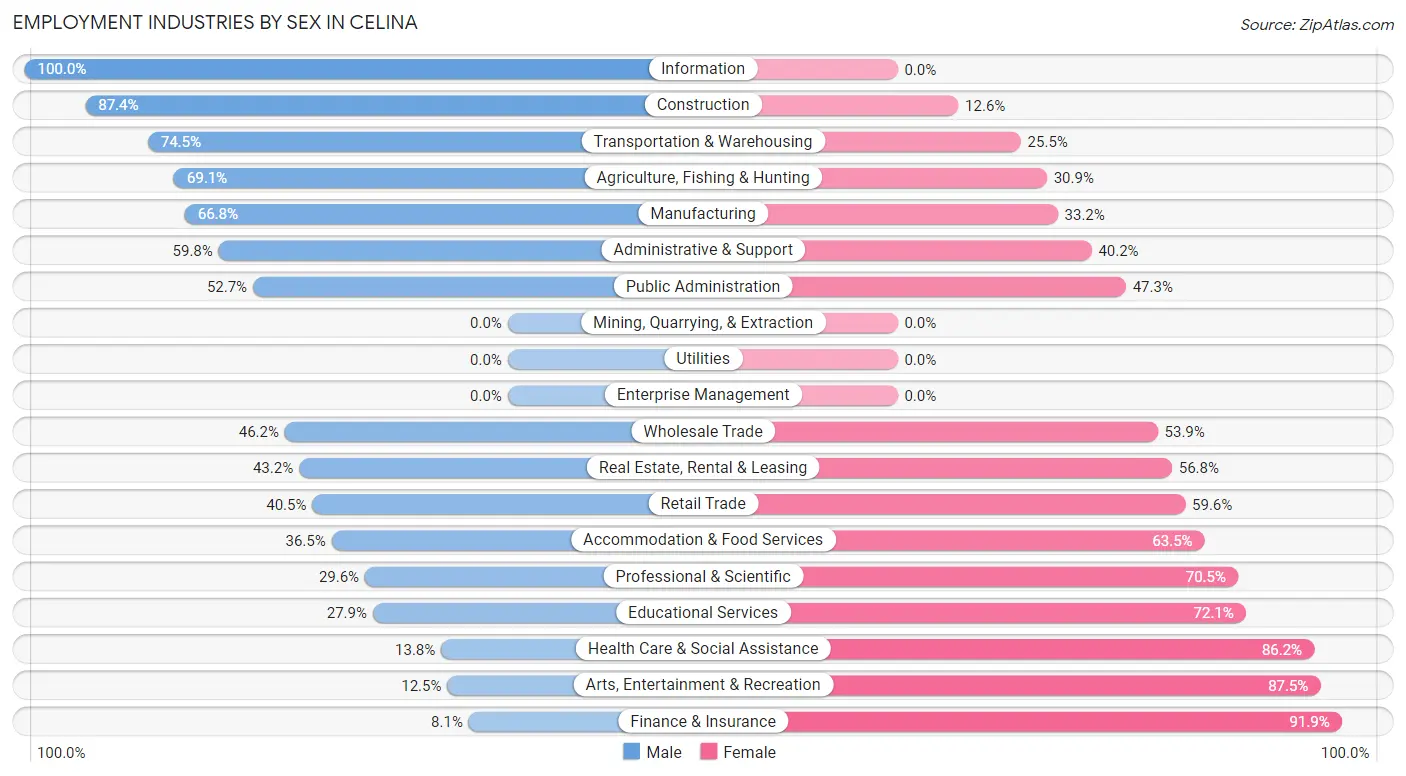
Employment Industries by Sex in Celina
The Celina industries that see more men than women are Information (100.0%), Construction (87.4%), and Transportation & Warehousing (74.5%), whereas the industries that tend to have a higher number of women are Finance & Insurance (91.9%), Arts, Entertainment & Recreation (87.5%), and Health Care & Social Assistance (86.2%).
| Industry | Male | Female |
| Agriculture, Fishing & Hunting | 38 (69.1%) | 17 (30.9%) |
| Mining, Quarrying, & Extraction | 0 (0.0%) | 0 (0.0%) |
| Construction | 153 (87.4%) | 22 (12.6%) |
| Manufacturing | 1,292 (66.8%) | 641 (33.2%) |
| Wholesale Trade | 30 (46.2%) | 35 (53.8%) |
| Retail Trade | 288 (40.5%) | 424 (59.6%) |
| Transportation & Warehousing | 73 (74.5%) | 25 (25.5%) |
| Utilities | 0 (0.0%) | 0 (0.0%) |
| Information | 11 (100.0%) | 0 (0.0%) |
| Finance & Insurance | 13 (8.1%) | 148 (91.9%) |
| Real Estate, Rental & Leasing | 35 (43.2%) | 46 (56.8%) |
| Professional & Scientific | 26 (29.5%) | 62 (70.5%) |
| Enterprise Management | 0 (0.0%) | 0 (0.0%) |
| Administrative & Support | 73 (59.8%) | 49 (40.2%) |
| Educational Services | 131 (27.9%) | 338 (72.1%) |
| Health Care & Social Assistance | 75 (13.8%) | 469 (86.2%) |
| Arts, Entertainment & Recreation | 16 (12.5%) | 112 (87.5%) |
| Accommodation & Food Services | 144 (36.5%) | 251 (63.5%) |
| Public Administration | 77 (52.7%) | 69 (47.3%) |
| Total | 2,800 (49.4%) | 2,863 (50.6%) |
Education in Celina
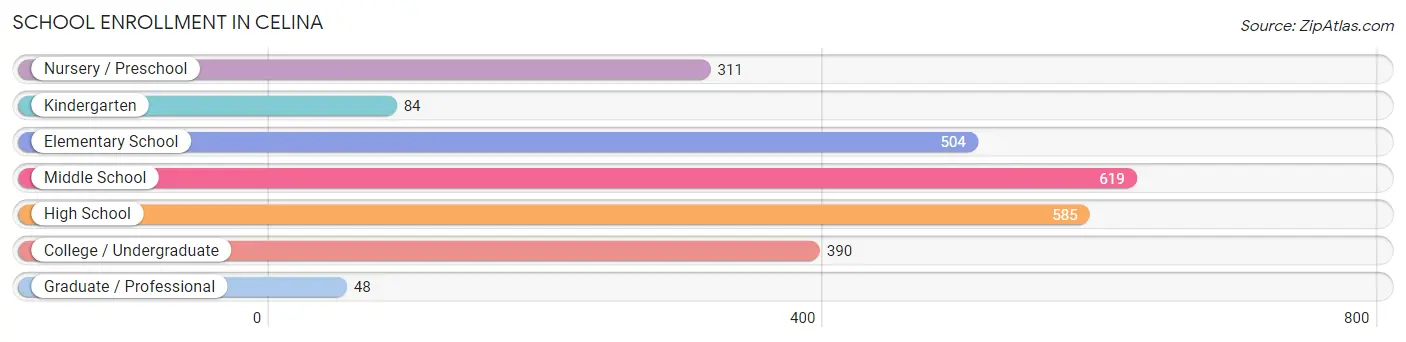
School Enrollment in Celina
The most common levels of schooling among the 2,541 students in Celina are middle school (619 | 24.4%), high school (585 | 23.0%), and elementary school (504 | 19.8%).
| School Level | # Students | % Students |
| Nursery / Preschool | 311 | 12.2% |
| Kindergarten | 84 | 3.3% |
| Elementary School | 504 | 19.8% |
| Middle School | 619 | 24.4% |
| High School | 585 | 23.0% |
| College / Undergraduate | 390 | 15.3% |
| Graduate / Professional | 48 | 1.9% |
| Total | 2,541 | 100.0% |
School Enrollment by Age by Funding Source in Celina
Out of a total of 2,541 students who are enrolled in schools in Celina, 239 (9.4%) attend a private institution, while the remaining 2,302 (90.6%) are enrolled in public schools. The age group of 3 to 4 year olds has the highest likelihood of being enrolled in private schools, with 110 (40.4% in the age bracket) enrolled. Conversely, the age group of 15 to 17 year olds has the lowest likelihood of being enrolled in a private school, with 272 (100.0% in the age bracket) attending a public institution.
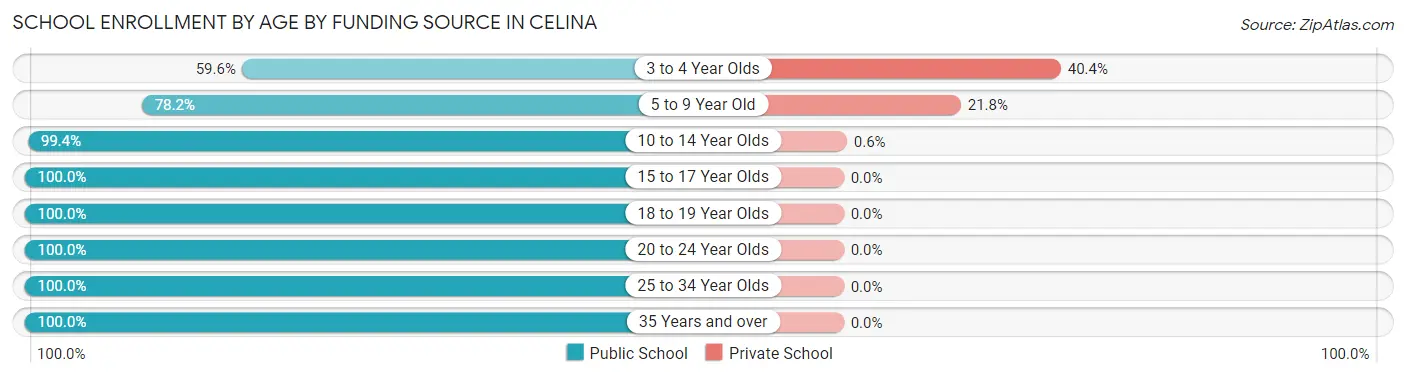
| Age Bracket | Public School | Private School |
| 3 to 4 Year Olds | 162 (59.6%) | 110 (40.4%) |
| 5 to 9 Year Old | 448 (78.2%) | 125 (21.8%) |
| 10 to 14 Year Olds | 824 (99.4%) | 5 (0.6%) |
| 15 to 17 Year Olds | 272 (100.0%) | 0 (0.0%) |
| 18 to 19 Year Olds | 164 (100.0%) | 0 (0.0%) |
| 20 to 24 Year Olds | 190 (100.0%) | 0 (0.0%) |
| 25 to 34 Year Olds | 189 (100.0%) | 0 (0.0%) |
| 35 Years and over | 52 (100.0%) | 0 (0.0%) |
| Total | 2,302 (90.6%) | 239 (9.4%) |
Educational Attainment by Field of Study in Celina
Education (414 | 27.5%), business (328 | 21.8%), science & technology (195 | 13.0%), engineering (144 | 9.6%), and arts & humanities (109 | 7.2%) are the most common fields of study among 1,506 individuals in Celina who have obtained a bachelor's degree or higher.
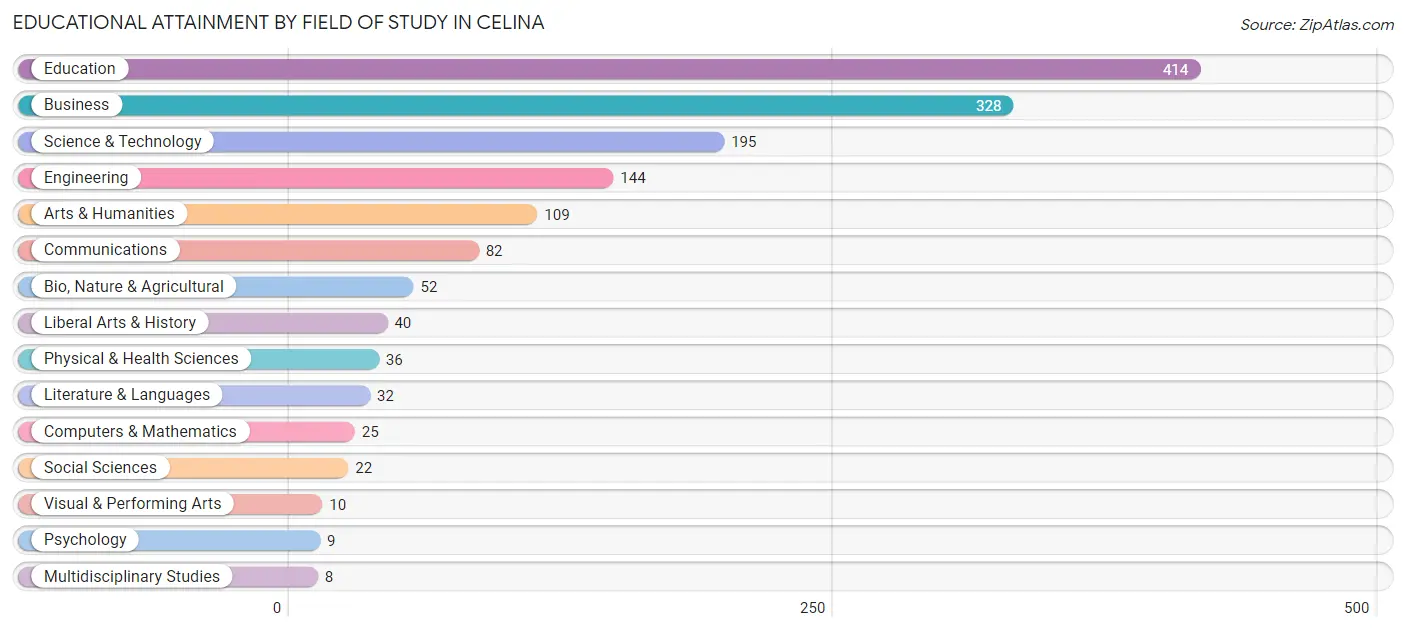
| Field of Study | # Graduates | % Graduates |
| Computers & Mathematics | 25 | 1.7% |
| Bio, Nature & Agricultural | 52 | 3.5% |
| Physical & Health Sciences | 36 | 2.4% |
| Psychology | 9 | 0.6% |
| Social Sciences | 22 | 1.5% |
| Engineering | 144 | 9.6% |
| Multidisciplinary Studies | 8 | 0.5% |
| Science & Technology | 195 | 13.0% |
| Business | 328 | 21.8% |
| Education | 414 | 27.5% |
| Literature & Languages | 32 | 2.1% |
| Liberal Arts & History | 40 | 2.7% |
| Visual & Performing Arts | 10 | 0.7% |
| Communications | 82 | 5.4% |
| Arts & Humanities | 109 | 7.2% |
| Total | 1,506 | 100.0% |
Transportation & Commute in Celina
Vehicle Availability by Sex in Celina
The most prevalent vehicle ownership categories in Celina are males with 2 vehicles (1,088, accounting for 39.0%) and females with 2 vehicles (1,062, making up 39.3%).
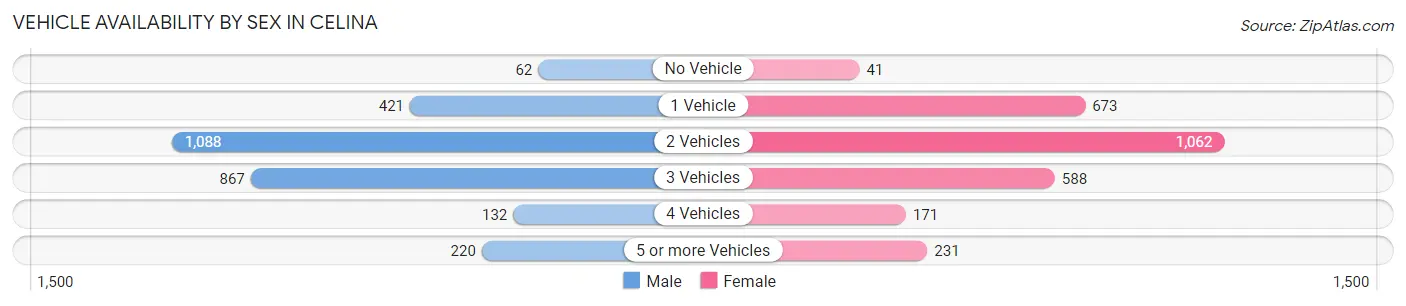
| Vehicles Available | Male | Female |
| No Vehicle | 62 (2.2%) | 41 (1.5%) |
| 1 Vehicle | 421 (15.1%) | 673 (24.3%) |
| 2 Vehicles | 1,088 (39.0%) | 1,062 (38.4%) |
| 3 Vehicles | 867 (31.1%) | 588 (21.3%) |
| 4 Vehicles | 132 (4.7%) | 171 (6.2%) |
| 5 or more Vehicles | 220 (7.9%) | 231 (8.4%) |
| Total | 2,790 (100.0%) | 2,766 (100.0%) |
Commute Time in Celina
The most frequently occuring commute durations in Celina are 5 to 9 minutes (1,548 commuters, 28.0%), 10 to 14 minutes (953 commuters, 17.2%), and 15 to 19 minutes (904 commuters, 16.4%).
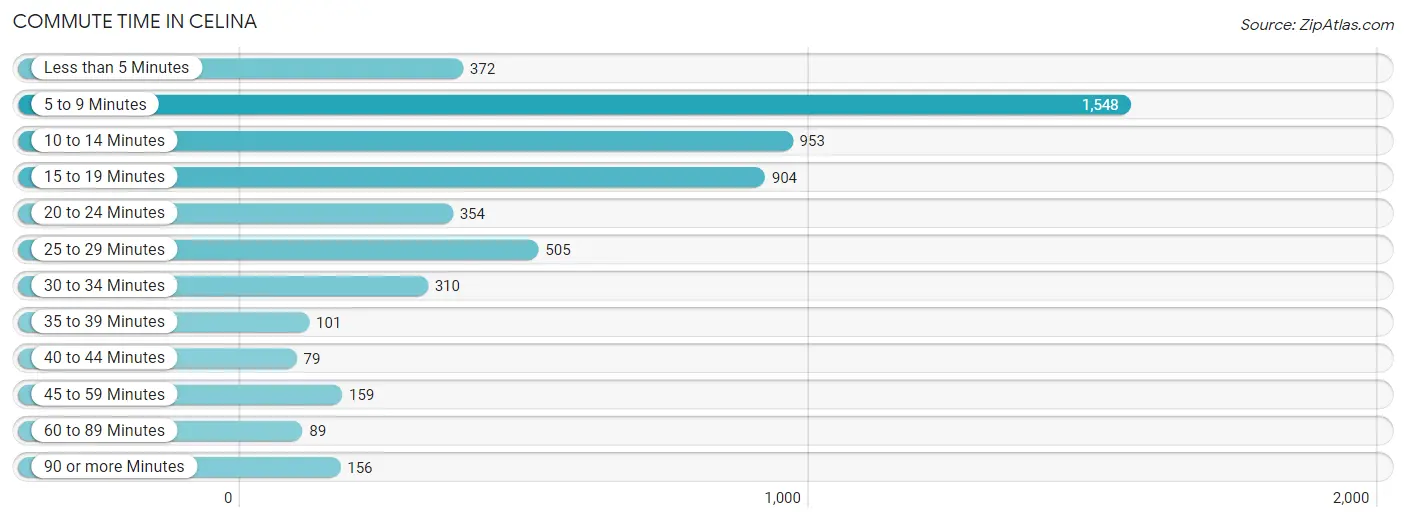
| Commute Time | # Commuters | % Commuters |
| Less than 5 Minutes | 372 | 6.7% |
| 5 to 9 Minutes | 1,548 | 28.0% |
| 10 to 14 Minutes | 953 | 17.2% |
| 15 to 19 Minutes | 904 | 16.4% |
| 20 to 24 Minutes | 354 | 6.4% |
| 25 to 29 Minutes | 505 | 9.1% |
| 30 to 34 Minutes | 310 | 5.6% |
| 35 to 39 Minutes | 101 | 1.8% |
| 40 to 44 Minutes | 79 | 1.4% |
| 45 to 59 Minutes | 159 | 2.9% |
| 60 to 89 Minutes | 89 | 1.6% |
| 90 or more Minutes | 156 | 2.8% |
Commute Time by Sex in Celina
The most common commute times in Celina are 5 to 9 minutes (963 commuters, 34.4%) for males and 5 to 9 minutes (585 commuters, 21.4%) for females.
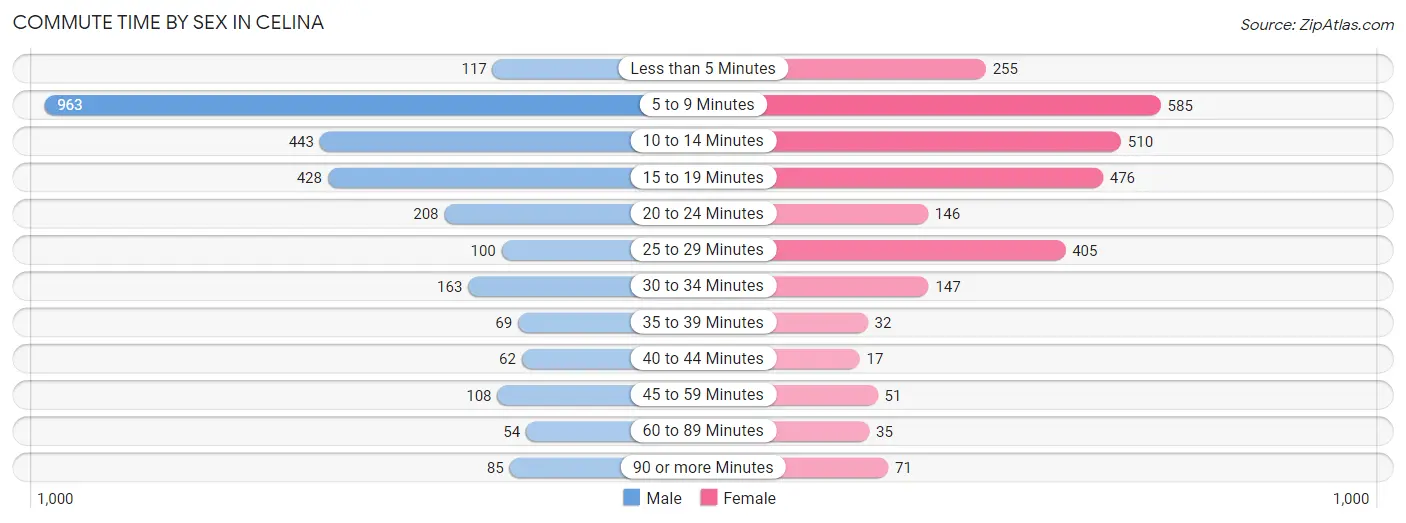
| Commute Time | Male | Female |
| Less than 5 Minutes | 117 (4.2%) | 255 (9.3%) |
| 5 to 9 Minutes | 963 (34.4%) | 585 (21.4%) |
| 10 to 14 Minutes | 443 (15.8%) | 510 (18.7%) |
| 15 to 19 Minutes | 428 (15.3%) | 476 (17.4%) |
| 20 to 24 Minutes | 208 (7.4%) | 146 (5.3%) |
| 25 to 29 Minutes | 100 (3.6%) | 405 (14.8%) |
| 30 to 34 Minutes | 163 (5.8%) | 147 (5.4%) |
| 35 to 39 Minutes | 69 (2.5%) | 32 (1.2%) |
| 40 to 44 Minutes | 62 (2.2%) | 17 (0.6%) |
| 45 to 59 Minutes | 108 (3.9%) | 51 (1.9%) |
| 60 to 89 Minutes | 54 (1.9%) | 35 (1.3%) |
| 90 or more Minutes | 85 (3.0%) | 71 (2.6%) |
Time of Departure to Work by Sex in Celina
The most frequent times of departure to work in Celina are 5:30 AM to 5:59 AM (430, 15.4%) for males and 8:00 AM to 8:29 AM (386, 14.1%) for females.
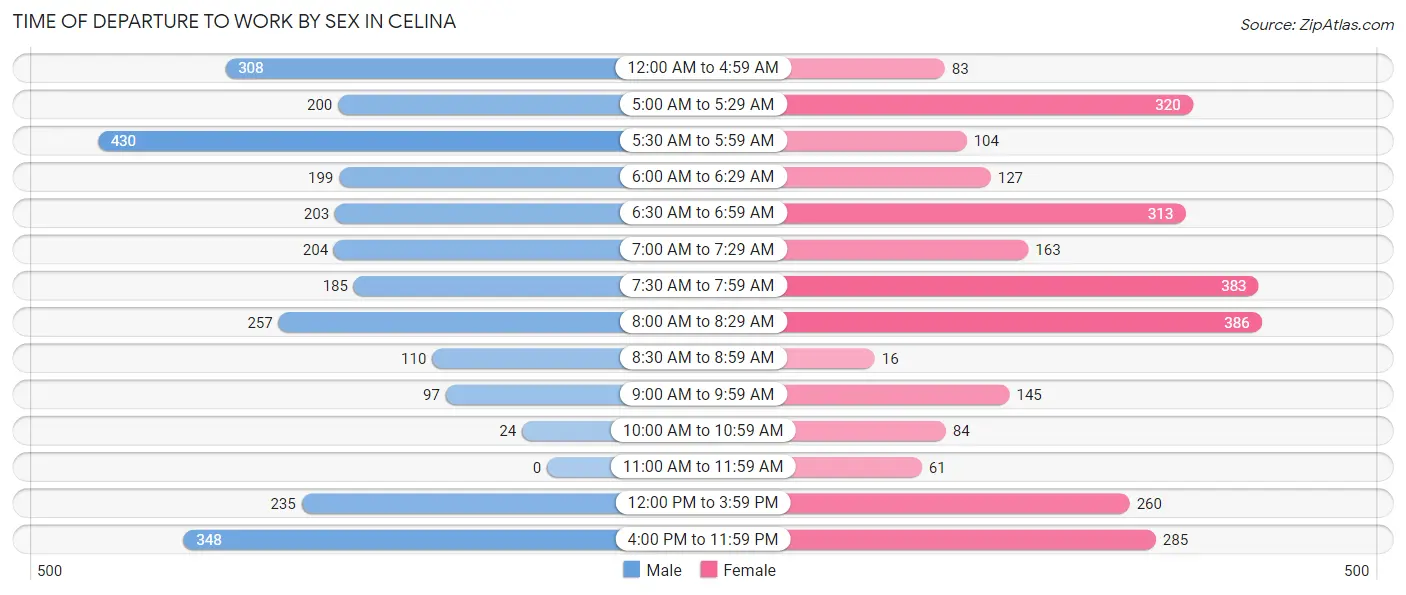
| Time of Departure | Male | Female |
| 12:00 AM to 4:59 AM | 308 (11.0%) | 83 (3.0%) |
| 5:00 AM to 5:29 AM | 200 (7.1%) | 320 (11.7%) |
| 5:30 AM to 5:59 AM | 430 (15.4%) | 104 (3.8%) |
| 6:00 AM to 6:29 AM | 199 (7.1%) | 127 (4.6%) |
| 6:30 AM to 6:59 AM | 203 (7.2%) | 313 (11.5%) |
| 7:00 AM to 7:29 AM | 204 (7.3%) | 163 (6.0%) |
| 7:30 AM to 7:59 AM | 185 (6.6%) | 383 (14.0%) |
| 8:00 AM to 8:29 AM | 257 (9.2%) | 386 (14.1%) |
| 8:30 AM to 8:59 AM | 110 (3.9%) | 16 (0.6%) |
| 9:00 AM to 9:59 AM | 97 (3.5%) | 145 (5.3%) |
| 10:00 AM to 10:59 AM | 24 (0.9%) | 84 (3.1%) |
| 11:00 AM to 11:59 AM | 0 (0.0%) | 61 (2.2%) |
| 12:00 PM to 3:59 PM | 235 (8.4%) | 260 (9.5%) |
| 4:00 PM to 11:59 PM | 348 (12.4%) | 285 (10.4%) |
| Total | 2,800 (100.0%) | 2,730 (100.0%) |
Housing Occupancy in Celina
Occupancy by Ownership in Celina
Of the total 4,453 dwellings in Celina, owner-occupied units account for 2,752 (61.8%), while renter-occupied units make up 1,701 (38.2%).
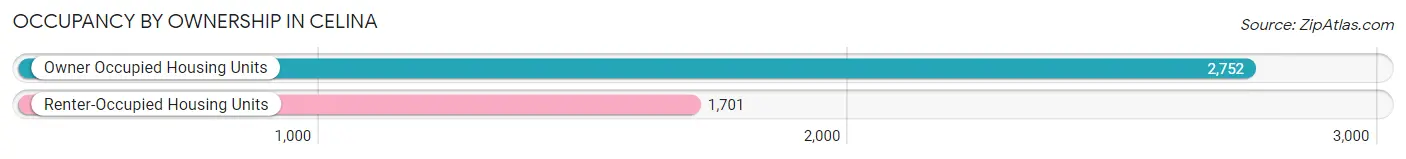
| Occupancy | # Housing Units | % Housing Units |
| Owner Occupied Housing Units | 2,752 | 61.8% |
| Renter-Occupied Housing Units | 1,701 | 38.2% |
| Total Occupied Housing Units | 4,453 | 100.0% |
Occupancy by Household Size in Celina
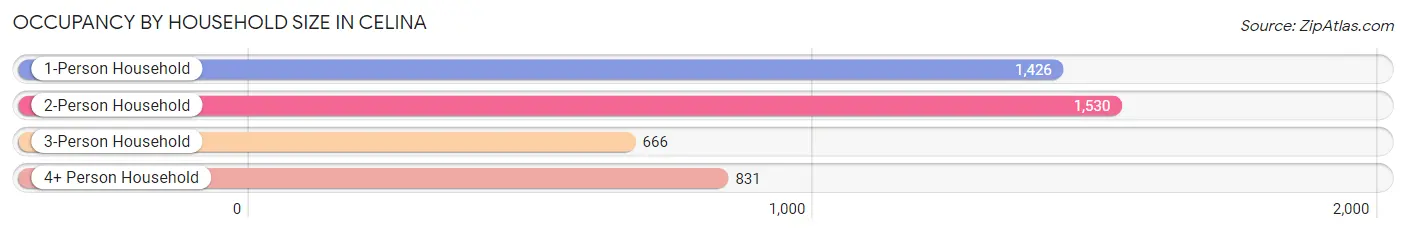
| Household Size | # Housing Units | % Housing Units |
| 1-Person Household | 1,426 | 32.0% |
| 2-Person Household | 1,530 | 34.4% |
| 3-Person Household | 666 | 15.0% |
| 4+ Person Household | 831 | 18.7% |
| Total Housing Units | 4,453 | 100.0% |
Occupancy by Ownership by Household Size in Celina
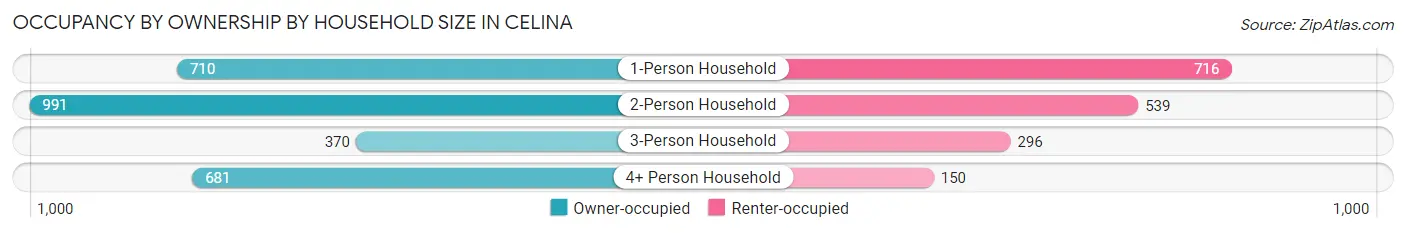
| Household Size | Owner-occupied | Renter-occupied |
| 1-Person Household | 710 (49.8%) | 716 (50.2%) |
| 2-Person Household | 991 (64.8%) | 539 (35.2%) |
| 3-Person Household | 370 (55.6%) | 296 (44.4%) |
| 4+ Person Household | 681 (82.0%) | 150 (18.0%) |
| Total Housing Units | 2,752 (61.8%) | 1,701 (38.2%) |
Occupancy by Educational Attainment in Celina
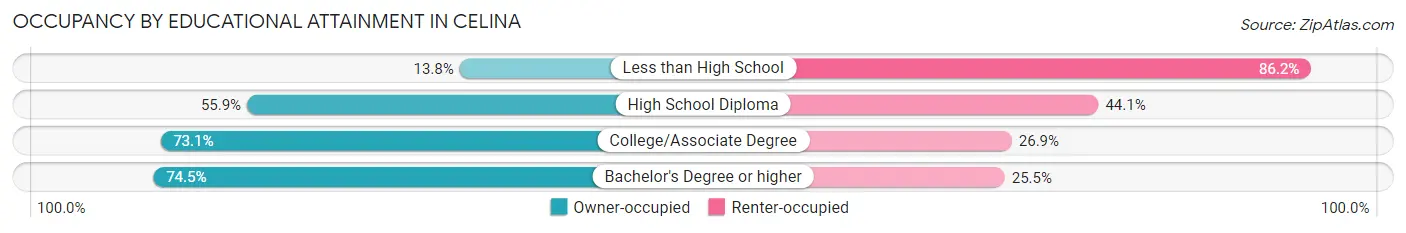
| Household Size | Owner-occupied | Renter-occupied |
| Less than High School | 41 (13.8%) | 257 (86.2%) |
| High School Diploma | 1,106 (55.9%) | 872 (44.1%) |
| College/Associate Degree | 875 (73.1%) | 322 (26.9%) |
| Bachelor's Degree or higher | 730 (74.5%) | 250 (25.5%) |
Occupancy by Age of Householder in Celina
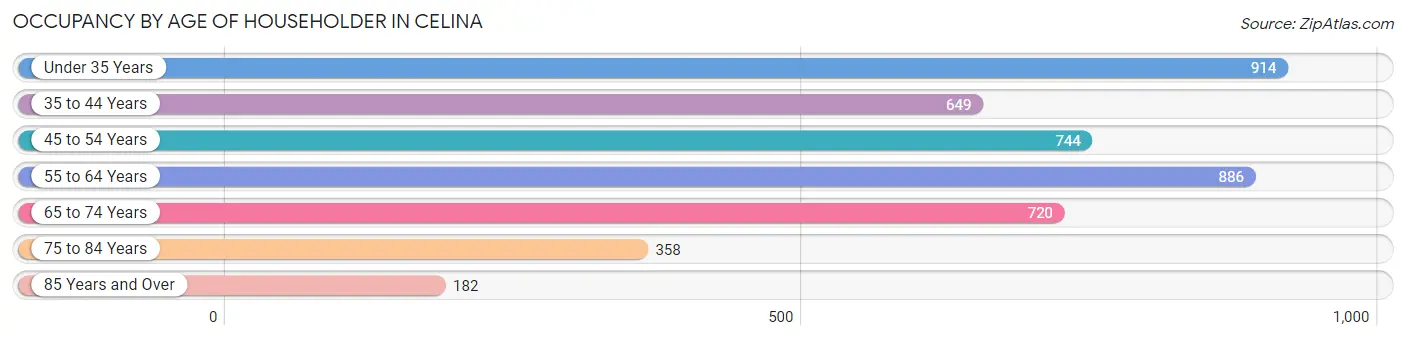
| Age Bracket | # Households | % Households |
| Under 35 Years | 914 | 20.5% |
| 35 to 44 Years | 649 | 14.6% |
| 45 to 54 Years | 744 | 16.7% |
| 55 to 64 Years | 886 | 19.9% |
| 65 to 74 Years | 720 | 16.2% |
| 75 to 84 Years | 358 | 8.0% |
| 85 Years and Over | 182 | 4.1% |
| Total | 4,453 | 100.0% |
Housing Finances in Celina
Median Income by Occupancy in Celina
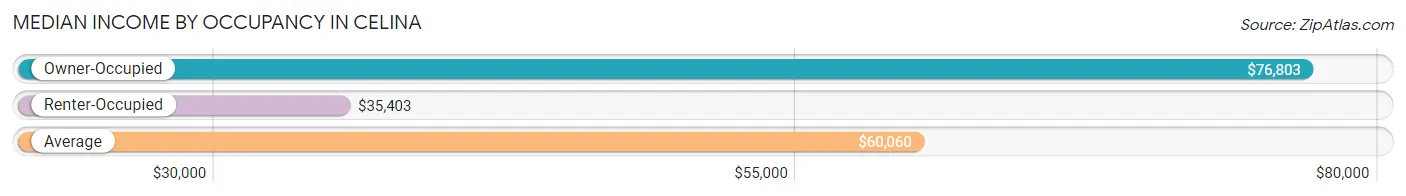
| Occupancy Type | # Households | Median Income |
| Owner-Occupied | 2,752 (61.8%) | $76,803 |
| Renter-Occupied | 1,701 (38.2%) | $35,403 |
| Average | 4,453 (100.0%) | $60,060 |
Occupancy by Householder Income Bracket in Celina
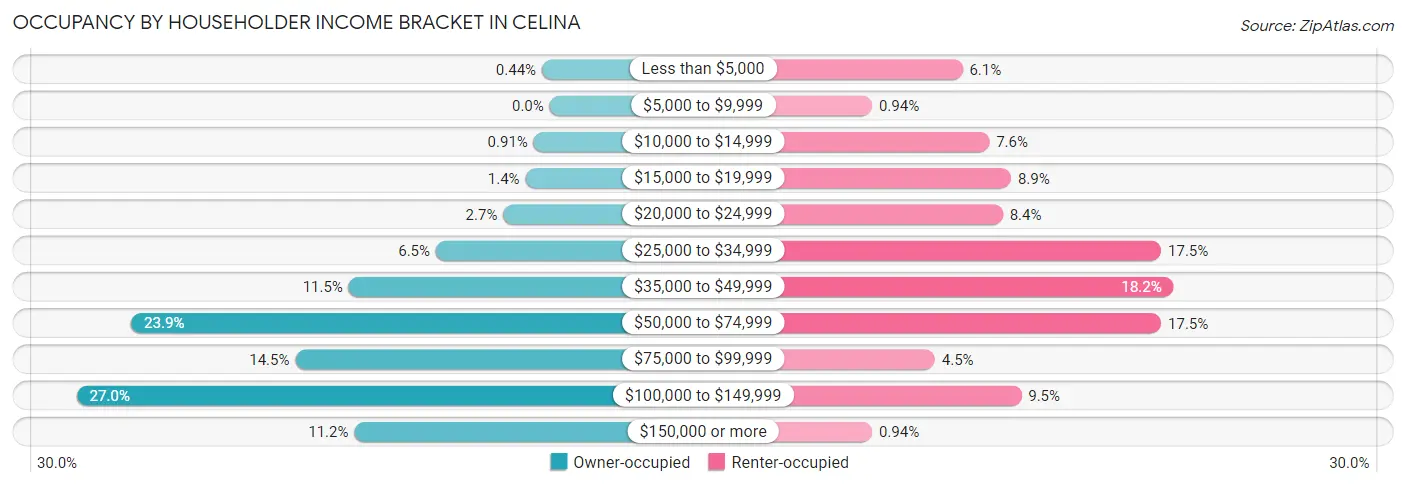
| Income Bracket | Owner-occupied | Renter-occupied |
| Less than $5,000 | 12 (0.4%) | 104 (6.1%) |
| $5,000 to $9,999 | 0 (0.0%) | 16 (0.9%) |
| $10,000 to $14,999 | 25 (0.9%) | 130 (7.6%) |
| $15,000 to $19,999 | 38 (1.4%) | 151 (8.9%) |
| $20,000 to $24,999 | 73 (2.6%) | 143 (8.4%) |
| $25,000 to $34,999 | 179 (6.5%) | 297 (17.5%) |
| $35,000 to $49,999 | 316 (11.5%) | 309 (18.2%) |
| $50,000 to $74,999 | 658 (23.9%) | 297 (17.5%) |
| $75,000 to $99,999 | 400 (14.5%) | 77 (4.5%) |
| $100,000 to $149,999 | 744 (27.0%) | 161 (9.5%) |
| $150,000 or more | 307 (11.2%) | 16 (0.9%) |
| Total | 2,752 (100.0%) | 1,701 (100.0%) |
Monthly Housing Cost Tiers in Celina
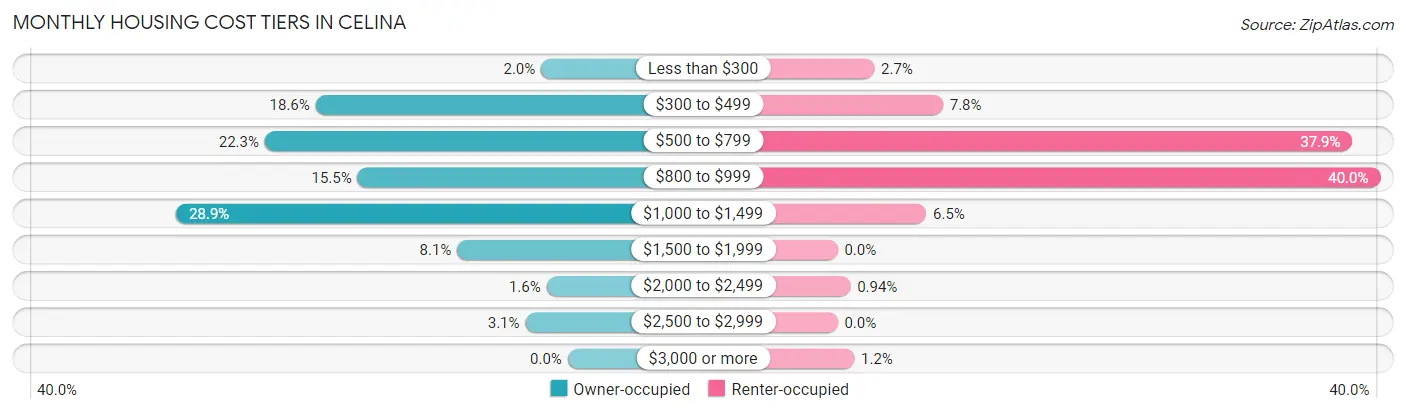
| Monthly Cost | Owner-occupied | Renter-occupied |
| Less than $300 | 54 (2.0%) | 46 (2.7%) |
| $300 to $499 | 511 (18.6%) | 132 (7.8%) |
| $500 to $799 | 614 (22.3%) | 645 (37.9%) |
| $800 to $999 | 426 (15.5%) | 680 (40.0%) |
| $1,000 to $1,499 | 794 (28.8%) | 111 (6.5%) |
| $1,500 to $1,999 | 224 (8.1%) | 0 (0.0%) |
| $2,000 to $2,499 | 43 (1.6%) | 16 (0.9%) |
| $2,500 to $2,999 | 86 (3.1%) | 0 (0.0%) |
| $3,000 or more | 0 (0.0%) | 21 (1.2%) |
| Total | 2,752 (100.0%) | 1,701 (100.0%) |
Physical Housing Characteristics in Celina
Housing Structures in Celina
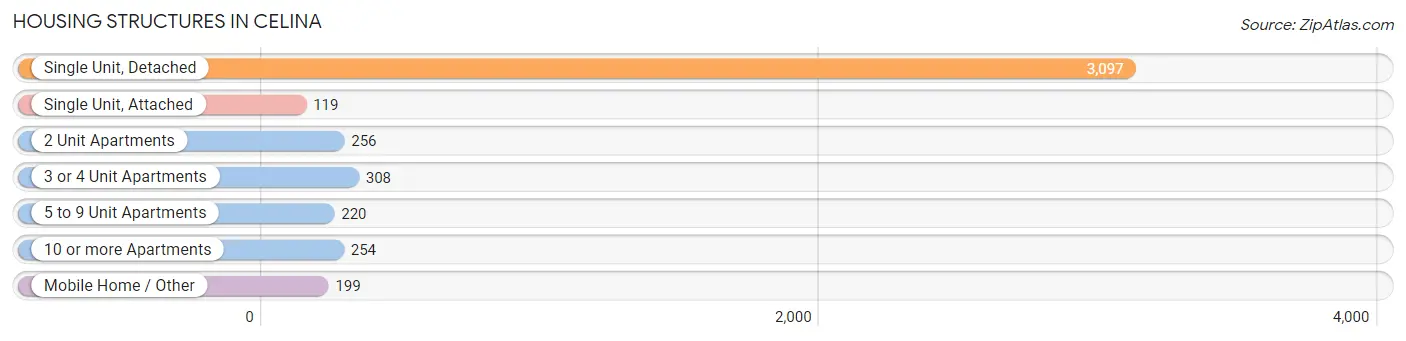
| Structure Type | # Housing Units | % Housing Units |
| Single Unit, Detached | 3,097 | 69.6% |
| Single Unit, Attached | 119 | 2.7% |
| 2 Unit Apartments | 256 | 5.8% |
| 3 or 4 Unit Apartments | 308 | 6.9% |
| 5 to 9 Unit Apartments | 220 | 4.9% |
| 10 or more Apartments | 254 | 5.7% |
| Mobile Home / Other | 199 | 4.5% |
| Total | 4,453 | 100.0% |
Housing Structures by Occupancy in Celina
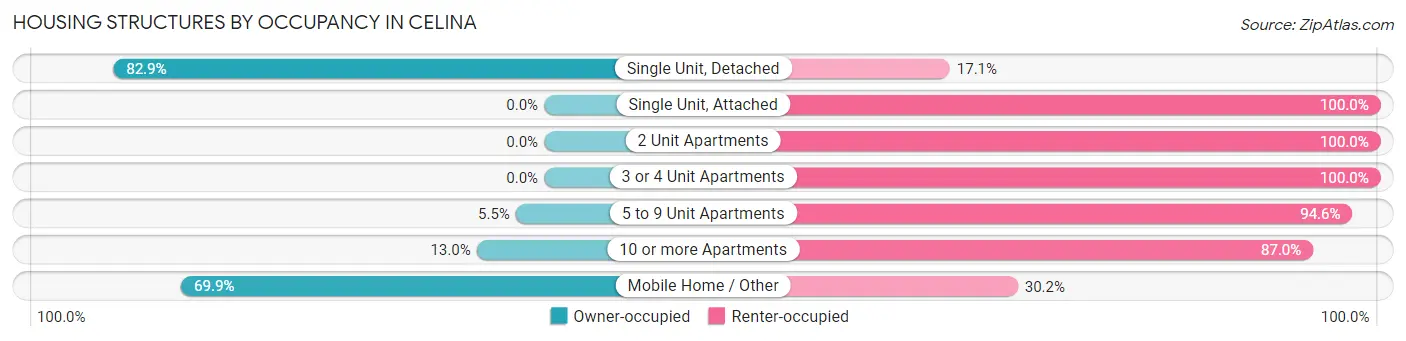
| Structure Type | Owner-occupied | Renter-occupied |
| Single Unit, Detached | 2,568 (82.9%) | 529 (17.1%) |
| Single Unit, Attached | 0 (0.0%) | 119 (100.0%) |
| 2 Unit Apartments | 0 (0.0%) | 256 (100.0%) |
| 3 or 4 Unit Apartments | 0 (0.0%) | 308 (100.0%) |
| 5 to 9 Unit Apartments | 12 (5.4%) | 208 (94.6%) |
| 10 or more Apartments | 33 (13.0%) | 221 (87.0%) |
| Mobile Home / Other | 139 (69.9%) | 60 (30.1%) |
| Total | 2,752 (61.8%) | 1,701 (38.2%) |
Housing Structures by Number of Rooms in Celina
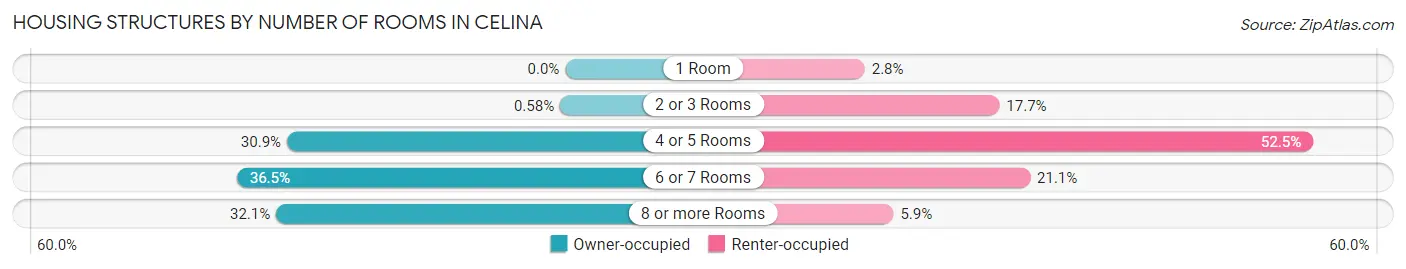
| Number of Rooms | Owner-occupied | Renter-occupied |
| 1 Room | 0 (0.0%) | 47 (2.8%) |
| 2 or 3 Rooms | 16 (0.6%) | 301 (17.7%) |
| 4 or 5 Rooms | 850 (30.9%) | 893 (52.5%) |
| 6 or 7 Rooms | 1,003 (36.4%) | 359 (21.1%) |
| 8 or more Rooms | 883 (32.1%) | 101 (5.9%) |
| Total | 2,752 (100.0%) | 1,701 (100.0%) |
Housing Structure by Heating Type in Celina
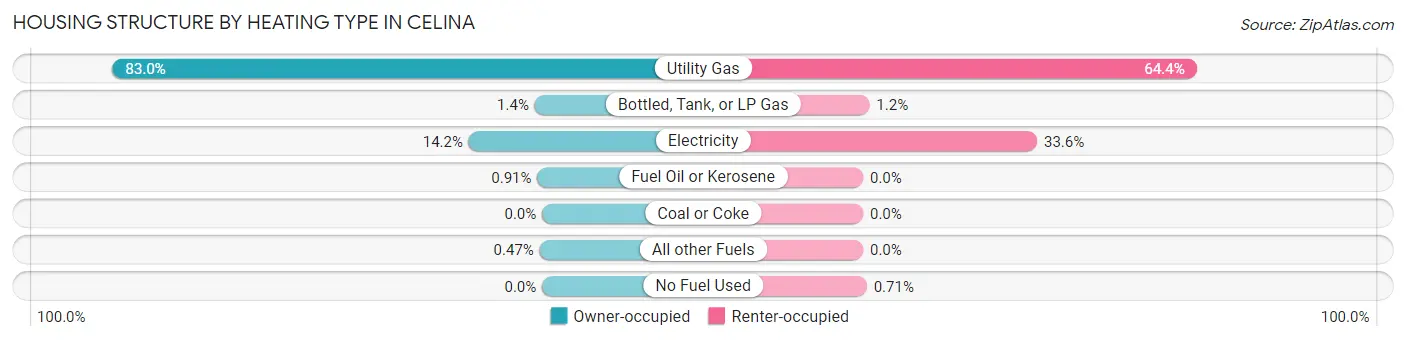
| Heating Type | Owner-occupied | Renter-occupied |
| Utility Gas | 2,285 (83.0%) | 1,096 (64.4%) |
| Bottled, Tank, or LP Gas | 39 (1.4%) | 21 (1.2%) |
| Electricity | 390 (14.2%) | 572 (33.6%) |
| Fuel Oil or Kerosene | 25 (0.9%) | 0 (0.0%) |
| Coal or Coke | 0 (0.0%) | 0 (0.0%) |
| All other Fuels | 13 (0.5%) | 0 (0.0%) |
| No Fuel Used | 0 (0.0%) | 12 (0.7%) |
| Total | 2,752 (100.0%) | 1,701 (100.0%) |
Household Vehicle Usage in Celina
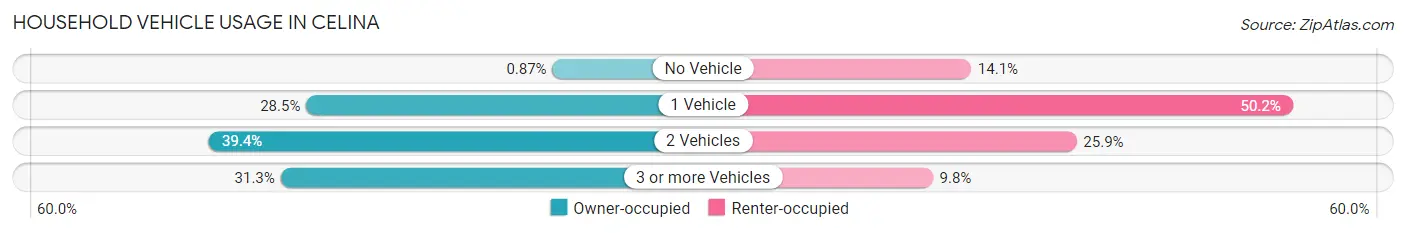
| Vehicles per Household | Owner-occupied | Renter-occupied |
| No Vehicle | 24 (0.9%) | 240 (14.1%) |
| 1 Vehicle | 783 (28.4%) | 853 (50.1%) |
| 2 Vehicles | 1,083 (39.4%) | 441 (25.9%) |
| 3 or more Vehicles | 862 (31.3%) | 167 (9.8%) |
| Total | 2,752 (100.0%) | 1,701 (100.0%) |
Real Estate & Mortgages in Celina
Real Estate and Mortgage Overview in Celina
| Characteristic | Without Mortgage | With Mortgage |
| Housing Units | 1,081 | 1,671 |
| Median Property Value | $150,600 | $153,000 |
| Median Household Income | $67,083 | $232 |
| Monthly Housing Costs | $492 | $0 |
| Real Estate Taxes | $1,593 | $27 |
Property Value by Mortgage Status in Celina
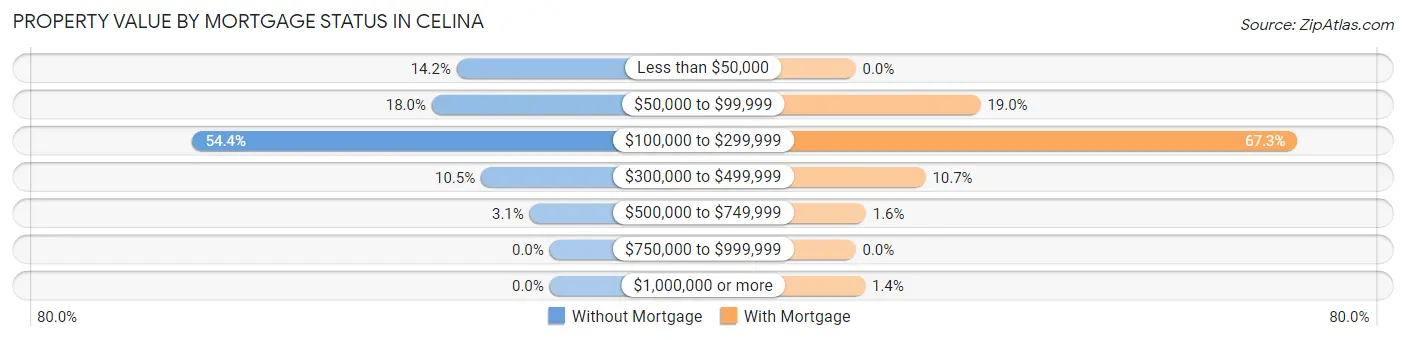
| Property Value | Without Mortgage | With Mortgage |
| Less than $50,000 | 153 (14.1%) | 0 (0.0%) |
| $50,000 to $99,999 | 194 (17.9%) | 318 (19.0%) |
| $100,000 to $299,999 | 588 (54.4%) | 1,125 (67.3%) |
| $300,000 to $499,999 | 113 (10.4%) | 178 (10.6%) |
| $500,000 to $749,999 | 33 (3.0%) | 26 (1.6%) |
| $750,000 to $999,999 | 0 (0.0%) | 0 (0.0%) |
| $1,000,000 or more | 0 (0.0%) | 24 (1.4%) |
| Total | 1,081 (100.0%) | 1,671 (100.0%) |
Household Income by Mortgage Status in Celina
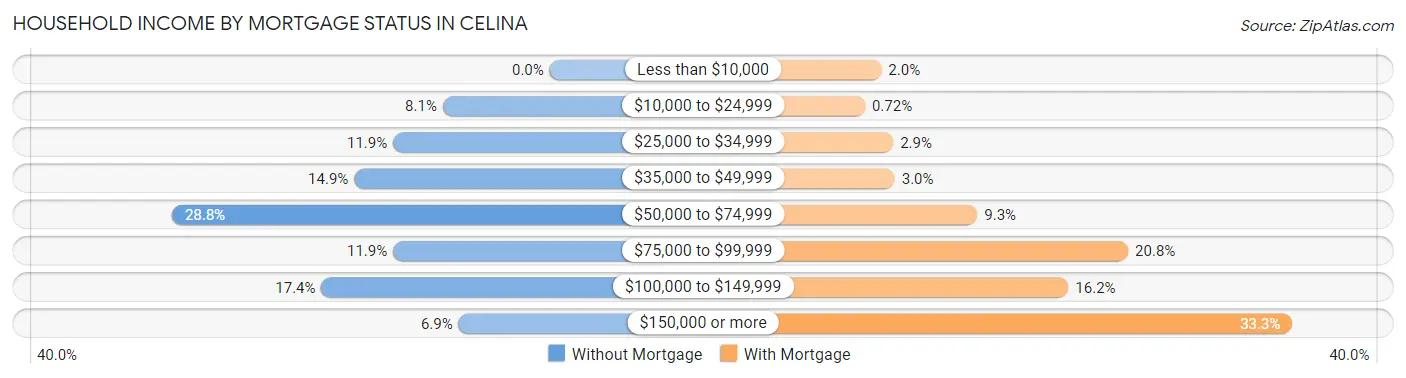
| Household Income | Without Mortgage | With Mortgage |
| Less than $10,000 | 0 (0.0%) | 33 (2.0%) |
| $10,000 to $24,999 | 88 (8.1%) | 12 (0.7%) |
| $25,000 to $34,999 | 129 (11.9%) | 48 (2.9%) |
| $35,000 to $49,999 | 161 (14.9%) | 50 (3.0%) |
| $50,000 to $74,999 | 311 (28.8%) | 155 (9.3%) |
| $75,000 to $99,999 | 129 (11.9%) | 347 (20.8%) |
| $100,000 to $149,999 | 188 (17.4%) | 271 (16.2%) |
| $150,000 or more | 75 (6.9%) | 556 (33.3%) |
| Total | 1,081 (100.0%) | 1,671 (100.0%) |
Property Value to Household Income Ratio in Celina
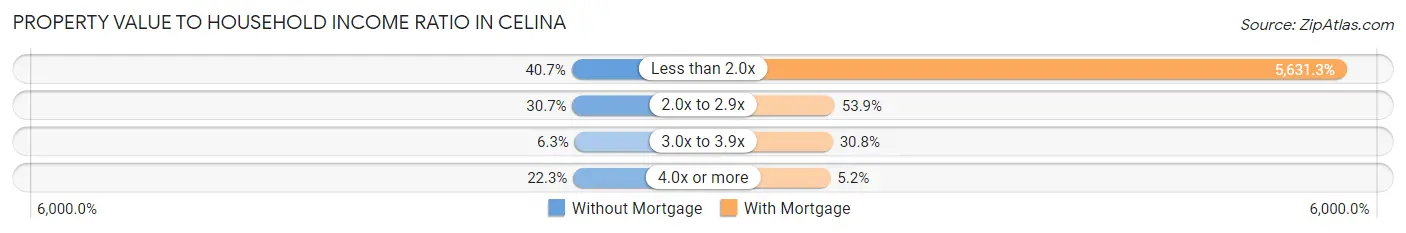
| Value-to-Income Ratio | Without Mortgage | With Mortgage |
| Less than 2.0x | 440 (40.7%) | 94,099 (5,631.3%) |
| 2.0x to 2.9x | 332 (30.7%) | 901 (53.9%) |
| 3.0x to 3.9x | 68 (6.3%) | 514 (30.8%) |
| 4.0x or more | 241 (22.3%) | 87 (5.2%) |
| Total | 1,081 (100.0%) | 1,671 (100.0%) |
Real Estate Taxes by Mortgage Status in Celina
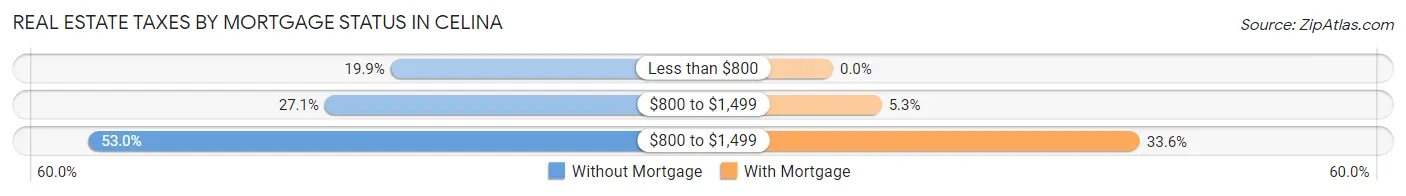
| Property Taxes | Without Mortgage | With Mortgage |
| Less than $800 | 215 (19.9%) | 0 (0.0%) |
| $800 to $1,499 | 293 (27.1%) | 89 (5.3%) |
| $800 to $1,499 | 573 (53.0%) | 562 (33.6%) |
| Total | 1,081 (100.0%) | 1,671 (100.0%) |
Health & Disability in Celina
Health Insurance Coverage by Age in Celina
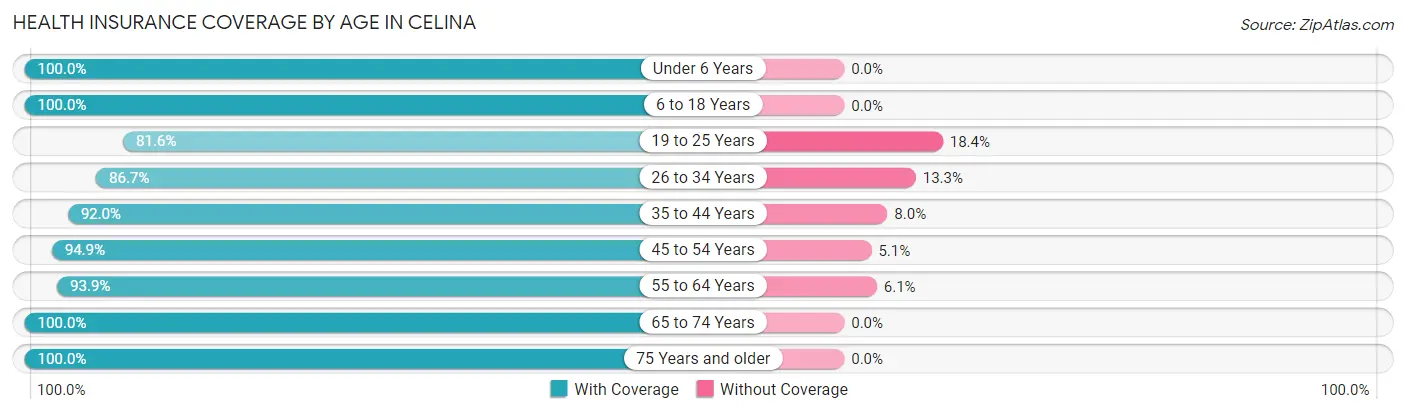
| Age Bracket | With Coverage | Without Coverage |
| Under 6 Years | 1,028 (100.0%) | 0 (0.0%) |
| 6 to 18 Years | 1,827 (100.0%) | 0 (0.0%) |
| 19 to 25 Years | 791 (81.6%) | 178 (18.4%) |
| 26 to 34 Years | 1,104 (86.7%) | 170 (13.3%) |
| 35 to 44 Years | 1,110 (92.0%) | 97 (8.0%) |
| 45 to 54 Years | 1,162 (94.9%) | 62 (5.1%) |
| 55 to 64 Years | 1,299 (93.9%) | 84 (6.1%) |
| 65 to 74 Years | 1,245 (100.0%) | 0 (0.0%) |
| 75 Years and older | 702 (100.0%) | 0 (0.0%) |
| Total | 10,268 (94.6%) | 591 (5.4%) |
Health Insurance Coverage by Citizenship Status in Celina
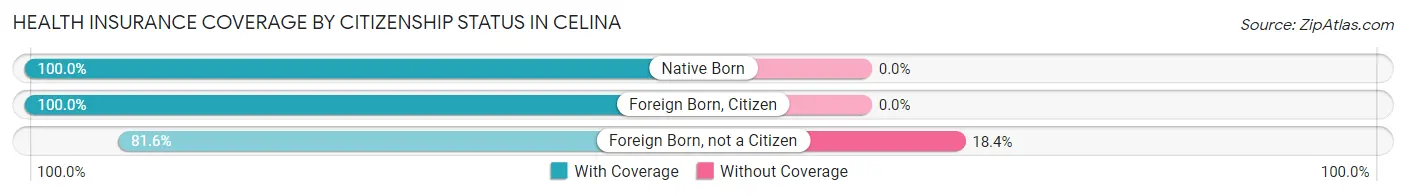
| Citizenship Status | With Coverage | Without Coverage |
| Native Born | 1,028 (100.0%) | 0 (0.0%) |
| Foreign Born, Citizen | 1,827 (100.0%) | 0 (0.0%) |
| Foreign Born, not a Citizen | 791 (81.6%) | 178 (18.4%) |
Health Insurance Coverage by Household Income in Celina
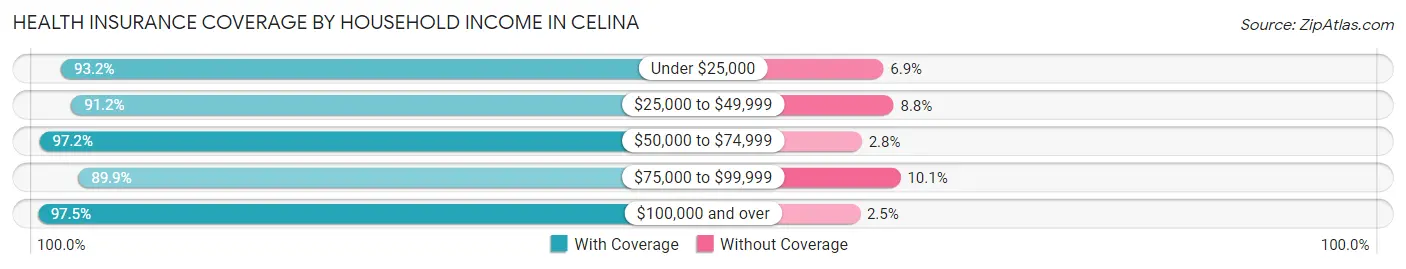
| Household Income | With Coverage | Without Coverage |
| Under $25,000 | 952 (93.1%) | 70 (6.9%) |
| $25,000 to $49,999 | 2,010 (91.2%) | 193 (8.8%) |
| $50,000 to $74,999 | 1,947 (97.2%) | 56 (2.8%) |
| $75,000 to $99,999 | 1,583 (89.9%) | 177 (10.1%) |
| $100,000 and over | 3,756 (97.5%) | 95 (2.5%) |
Public vs Private Health Insurance Coverage by Age in Celina
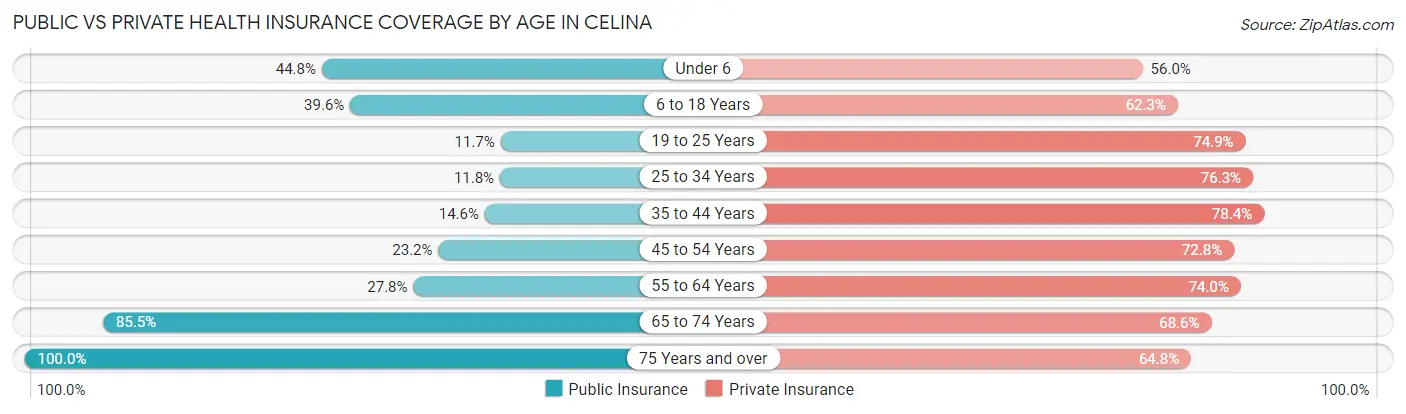
| Age Bracket | Public Insurance | Private Insurance |
| Under 6 | 461 (44.8%) | 576 (56.0%) |
| 6 to 18 Years | 723 (39.6%) | 1,139 (62.3%) |
| 19 to 25 Years | 113 (11.7%) | 726 (74.9%) |
| 25 to 34 Years | 150 (11.8%) | 972 (76.3%) |
| 35 to 44 Years | 176 (14.6%) | 946 (78.4%) |
| 45 to 54 Years | 284 (23.2%) | 891 (72.8%) |
| 55 to 64 Years | 385 (27.8%) | 1,024 (74.0%) |
| 65 to 74 Years | 1,064 (85.5%) | 854 (68.6%) |
| 75 Years and over | 702 (100.0%) | 455 (64.8%) |
| Total | 4,058 (37.4%) | 7,583 (69.8%) |
Disability Status by Sex by Age in Celina
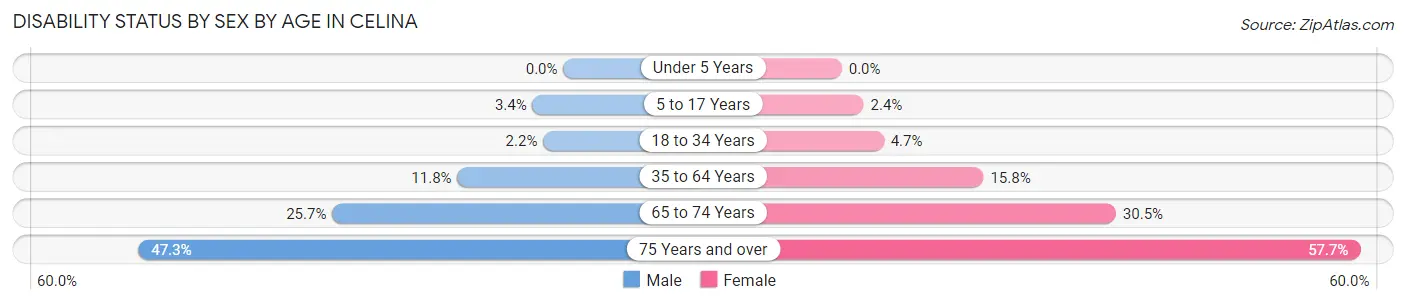
| Age Bracket | Male | Female |
| Under 5 Years | 0 (0.0%) | 0 (0.0%) |
| 5 to 17 Years | 33 (3.4%) | 20 (2.4%) |
| 18 to 34 Years | 29 (2.2%) | 53 (4.7%) |
| 35 to 64 Years | 219 (11.8%) | 309 (15.8%) |
| 65 to 74 Years | 140 (25.7%) | 214 (30.5%) |
| 75 Years and over | 115 (47.3%) | 265 (57.7%) |
Disability Class by Sex by Age in Celina
Disability Class: Hearing Difficulty
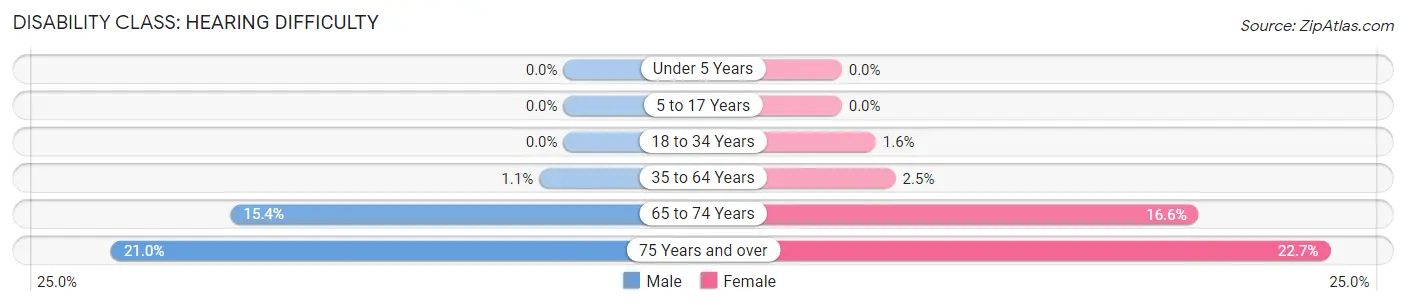
| Age Bracket | Male | Female |
| Under 5 Years | 0 (0.0%) | 0 (0.0%) |
| 5 to 17 Years | 0 (0.0%) | 0 (0.0%) |
| 18 to 34 Years | 0 (0.0%) | 18 (1.6%) |
| 35 to 64 Years | 21 (1.1%) | 49 (2.5%) |
| 65 to 74 Years | 84 (15.4%) | 116 (16.6%) |
| 75 Years and over | 51 (21.0%) | 104 (22.7%) |
Disability Class: Vision Difficulty
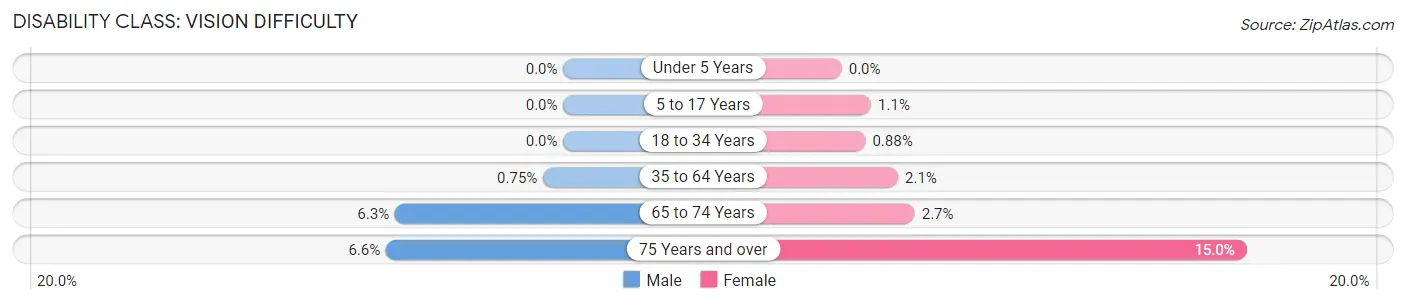
| Age Bracket | Male | Female |
| Under 5 Years | 0 (0.0%) | 0 (0.0%) |
| 5 to 17 Years | 0 (0.0%) | 9 (1.1%) |
| 18 to 34 Years | 0 (0.0%) | 10 (0.9%) |
| 35 to 64 Years | 14 (0.7%) | 41 (2.1%) |
| 65 to 74 Years | 34 (6.2%) | 19 (2.7%) |
| 75 Years and over | 16 (6.6%) | 69 (15.0%) |
Disability Class: Cognitive Difficulty
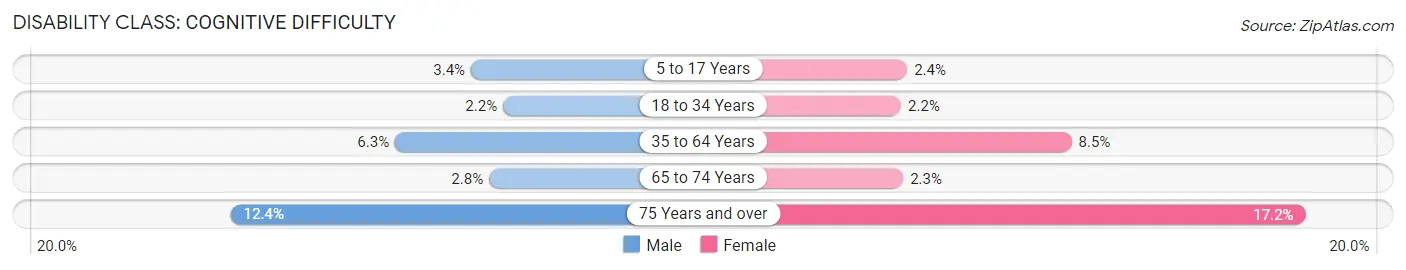
| Age Bracket | Male | Female |
| 5 to 17 Years | 33 (3.4%) | 20 (2.4%) |
| 18 to 34 Years | 29 (2.2%) | 25 (2.2%) |
| 35 to 64 Years | 116 (6.2%) | 167 (8.5%) |
| 65 to 74 Years | 15 (2.8%) | 16 (2.3%) |
| 75 Years and over | 30 (12.3%) | 79 (17.2%) |
Disability Class: Ambulatory Difficulty
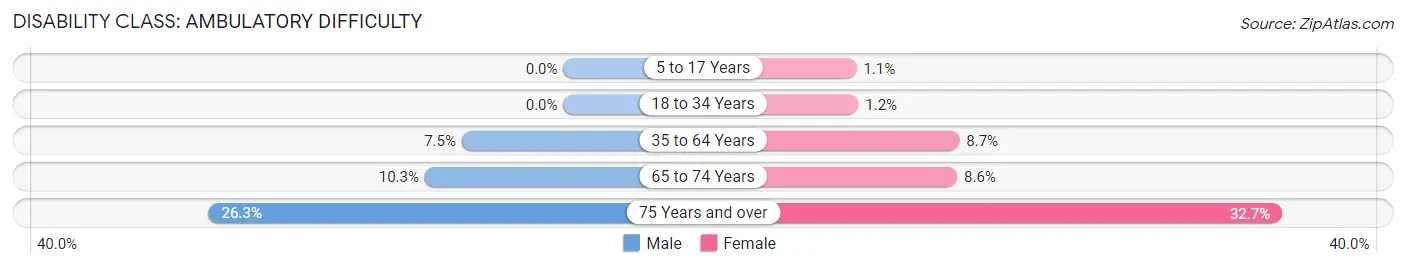
| Age Bracket | Male | Female |
| 5 to 17 Years | 0 (0.0%) | 9 (1.1%) |
| 18 to 34 Years | 0 (0.0%) | 14 (1.2%) |
| 35 to 64 Years | 140 (7.5%) | 171 (8.7%) |
| 65 to 74 Years | 56 (10.3%) | 60 (8.6%) |
| 75 Years and over | 64 (26.3%) | 150 (32.7%) |
Disability Class: Self-Care Difficulty
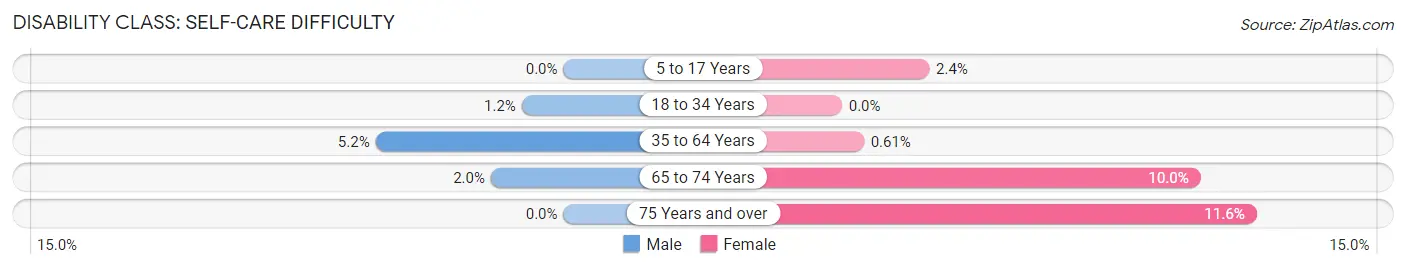
| Age Bracket | Male | Female |
| 5 to 17 Years | 0 (0.0%) | 20 (2.4%) |
| 18 to 34 Years | 15 (1.2%) | 0 (0.0%) |
| 35 to 64 Years | 97 (5.2%) | 12 (0.6%) |
| 65 to 74 Years | 11 (2.0%) | 70 (10.0%) |
| 75 Years and over | 0 (0.0%) | 53 (11.6%) |
Technology Access in Celina
Computing Device Access in Celina
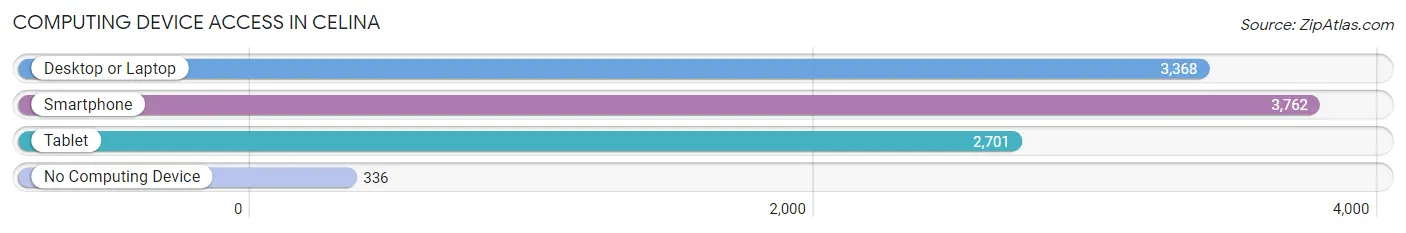
| Device Type | # Households | % Households |
| Desktop or Laptop | 3,368 | 75.6% |
| Smartphone | 3,762 | 84.5% |
| Tablet | 2,701 | 60.7% |
| No Computing Device | 336 | 7.5% |
| Total | 4,453 | 100.0% |
Internet Access in Celina
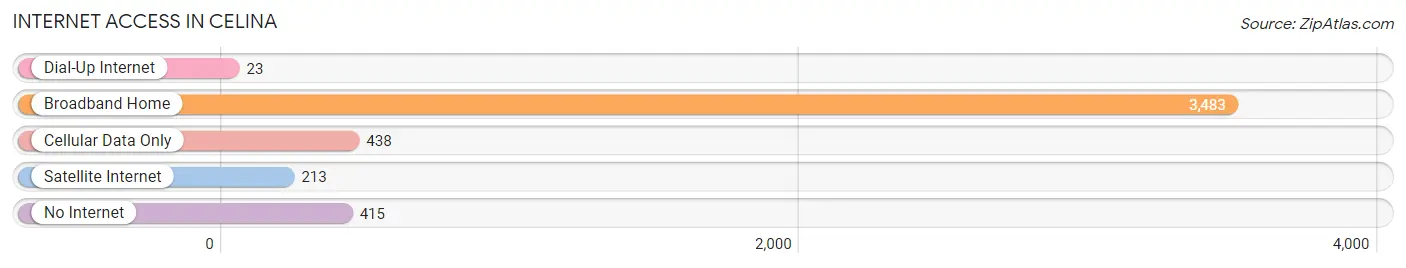
| Internet Type | # Households | % Households |
| Dial-Up Internet | 23 | 0.5% |
| Broadband Home | 3,483 | 78.2% |
| Cellular Data Only | 438 | 9.8% |
| Satellite Internet | 213 | 4.8% |
| No Internet | 415 | 9.3% |
| Total | 4,453 | 100.0% |
Celina Summary
Celina, Ohio is a small city located in Mercer County, Ohio. It is situated on the western edge of Grand Lake St. Marys, the largest inland lake in the state. The city has a population of 10,400 people, according to the 2010 census.
History
Celina was founded in 1834 by a group of settlers from Pennsylvania. The city was named after Celina, the daughter of one of the settlers. The city was incorporated in 1841 and was the county seat of Mercer County until 1877.
In the late 19th century, Celina was a major center for the production of brick and tile. The city was also home to several manufacturing companies, including the Celina Chair Company, the Celina Stove Company, and the Celina Foundry.
Geography
Celina is located in western Ohio, about 50 miles west of Dayton. The city is situated on the western edge of Grand Lake St. Marys, the largest inland lake in the state. The lake is a popular destination for fishing, boating, and other recreational activities.
The city is located in a flat, low-lying area, with an elevation of about 830 feet above sea level. The climate is humid continental, with hot summers and cold winters.
Economy
Celina’s economy is largely based on manufacturing and agriculture. The city is home to several manufacturing companies, including the Celina Chair Company, the Celina Stove Company, and the Celina Foundry.
Agriculture is also an important part of the local economy. The city is home to several large farms, which produce corn, soybeans, wheat, and other crops.
Demographics
According to the 2010 census, Celina has a population of 10,400 people. The racial makeup of the city is 94.3% White, 1.2% African American, 0.3% Native American, 0.7% Asian, 0.1% Pacific Islander, and 3.4% from other races.
The median household income in Celina is $41,945, and the median family income is $50,945. The city has a poverty rate of 16.3%.
Conclusion
Celina, Ohio is a small city located in Mercer County, Ohio. It is situated on the western edge of Grand Lake St. Marys, the largest inland lake in the state. The city has a population of 10,400 people, according to the 2010 census. Celina’s economy is largely based on manufacturing and agriculture, and the city is home to several large farms. The racial makeup of the city is 94.3% White, 1.2% African American, 0.3% Native American, 0.7% Asian, 0.1% Pacific Islander, and 3.4% from other races. The median household income in Celina is $41,945, and the median family income is $50,945. The city has a poverty rate of 16.3%.
Common Questions
What is Per Capita Income in Celina?
Per Capita income in Celina is $30,927.
What is the Median Family Income in Celina?
Median Family Income in Celina is $74,823.
What is the Median Household income in Celina?
Median Household Income in Celina is $60,060.
What is Income or Wage Gap in Celina?
Income or Wage Gap in Celina is 29.3%.
Women in Celina earn 70.7 cents for every dollar earned by a man.
What is Inequality or Gini Index in Celina?
Inequality or Gini Index in Celina is 0.39.
What is the Total Population of Celina?
Total Population of Celina is 10,974.
What is the Total Male Population of Celina?
Total Male Population of Celina is 5,316.
What is the Total Female Population of Celina?
Total Female Population of Celina is 5,658.
What is the Ratio of Males per 100 Females in Celina?
There are 93.96 Males per 100 Females in Celina.
What is the Ratio of Females per 100 Males in Celina?
There are 106.43 Females per 100 Males in Celina.
What is the Median Population Age in Celina?
Median Population Age in Celina is 37.8 Years.
What is the Average Family Size in Celina
Average Family Size in Celina is 3.0 People.
What is the Average Household Size in Celina
Average Household Size in Celina is 2.4 People.
How Large is the Labor Force in Celina?
There are 5,801 People in the Labor Forcein in Celina.
What is the Percentage of People in the Labor Force in Celina?
68.1% of People are in the Labor Force in Celina.
What is the Unemployment Rate in Celina?
Unemployment Rate in Celina is 2.0%.