Williamson, NY Map & Demographics
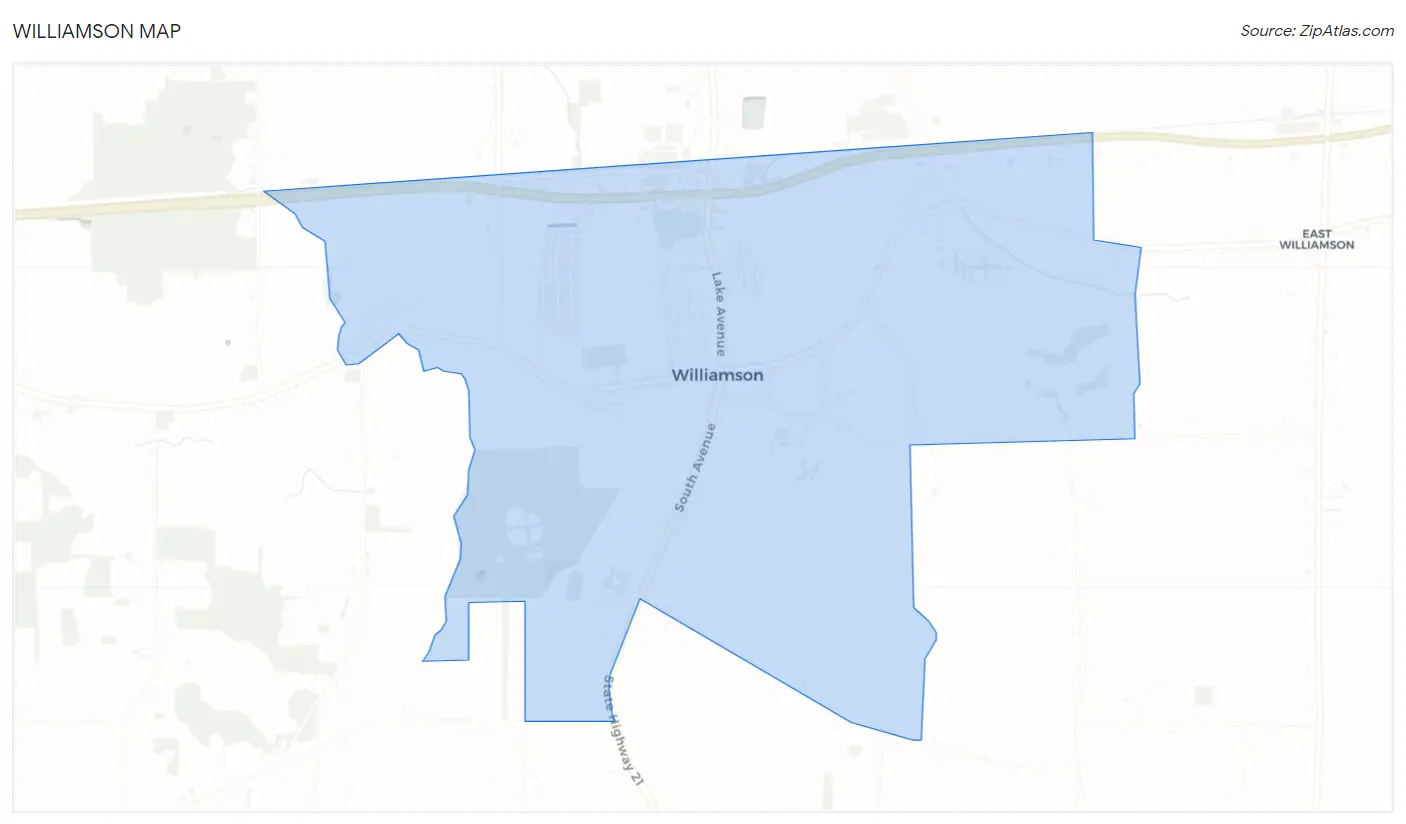
Williamson Map
Williamson Overview
$28,157
PER CAPITA INCOME
$71,065
AVG FAMILY INCOME
$58,198
AVG HOUSEHOLD INCOME
30.2%
WAGE / INCOME GAP [ % ]
69.8¢/ $1
WAGE / INCOME GAP [ $ ]
0.41
INEQUALITY / GINI INDEX
2,560
TOTAL POPULATION
1,264
MALE POPULATION
1,296
FEMALE POPULATION
97.53
MALES / 100 FEMALES
102.53
FEMALES / 100 MALES
36.9
MEDIAN AGE
3.1
AVG FAMILY SIZE
2.4
AVG HOUSEHOLD SIZE
1,086
LABOR FORCE [ PEOPLE ]
54.9%
PERCENT IN LABOR FORCE
5.7%
UNEMPLOYMENT RATE
Williamson Zip Codes
Williamson Area Codes
Income in Williamson
Income Overview in Williamson
Per Capita Income in Williamson is $28,157, while median incomes of families and households are $71,065 and $58,198 respectively.
| Characteristic | Number | Measure |
| Per Capita Income | 2,560 | $28,157 |
| Median Family Income | 657 | $71,065 |
| Mean Family Income | 657 | $81,862 |
| Median Household Income | 1,041 | $58,198 |
| Mean Household Income | 1,041 | $66,778 |
| Income Deficit | 657 | $0 |
| Wage / Income Gap (%) | 2,560 | 30.24% |
| Wage / Income Gap ($) | 2,560 | 69.76¢ per $1 |
| Gini / Inequality Index | 2,560 | 0.41 |
Earnings by Sex in Williamson
Average Earnings in Williamson are $33,067, $39,188 for men and $27,339 for women, a difference of 30.2%.
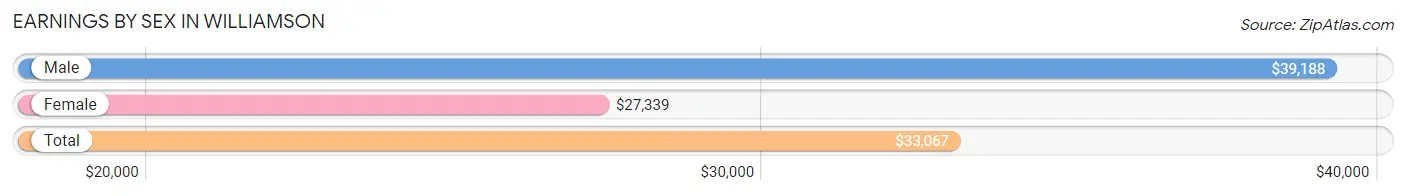
| Sex | Number | Average Earnings |
| Male | 628 (51.6%) | $39,188 |
| Female | 588 (48.4%) | $27,339 |
| Total | 1,216 (100.0%) | $33,067 |
Earnings by Sex by Income Bracket in Williamson
The most common earnings brackets in Williamson are $100,000+ for men (121 | 19.3%) and $30,000 to $34,999 for women (85 | 14.5%).
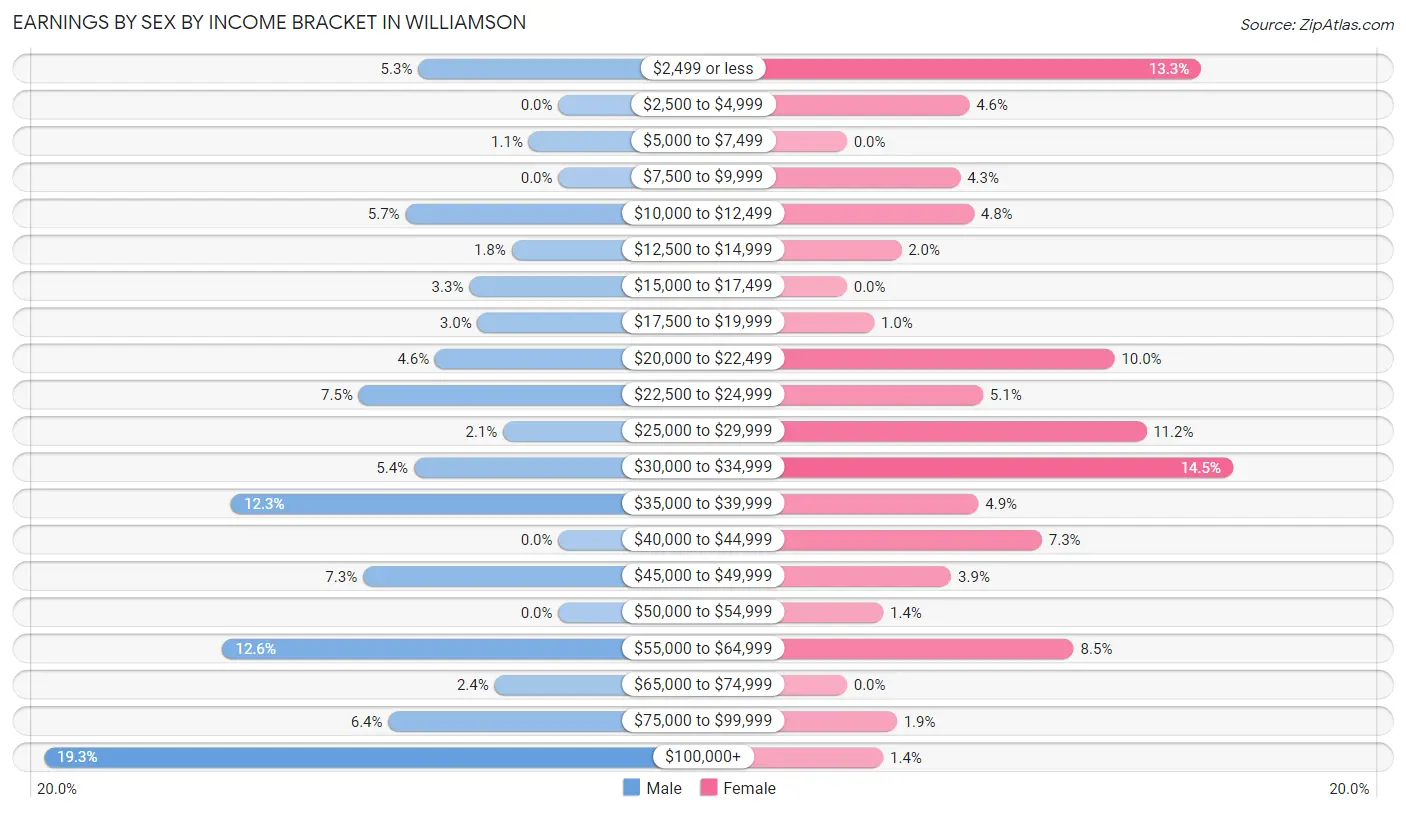
| Income | Male | Female |
| $2,499 or less | 33 (5.2%) | 78 (13.3%) |
| $2,500 to $4,999 | 0 (0.0%) | 27 (4.6%) |
| $5,000 to $7,499 | 7 (1.1%) | 0 (0.0%) |
| $7,500 to $9,999 | 0 (0.0%) | 25 (4.3%) |
| $10,000 to $12,499 | 36 (5.7%) | 28 (4.8%) |
| $12,500 to $14,999 | 11 (1.8%) | 12 (2.0%) |
| $15,000 to $17,499 | 21 (3.3%) | 0 (0.0%) |
| $17,500 to $19,999 | 19 (3.0%) | 6 (1.0%) |
| $20,000 to $22,499 | 29 (4.6%) | 59 (10.0%) |
| $22,500 to $24,999 | 47 (7.5%) | 30 (5.1%) |
| $25,000 to $29,999 | 13 (2.1%) | 66 (11.2%) |
| $30,000 to $34,999 | 34 (5.4%) | 85 (14.5%) |
| $35,000 to $39,999 | 77 (12.3%) | 29 (4.9%) |
| $40,000 to $44,999 | 0 (0.0%) | 43 (7.3%) |
| $45,000 to $49,999 | 46 (7.3%) | 23 (3.9%) |
| $50,000 to $54,999 | 0 (0.0%) | 8 (1.4%) |
| $55,000 to $64,999 | 79 (12.6%) | 50 (8.5%) |
| $65,000 to $74,999 | 15 (2.4%) | 0 (0.0%) |
| $75,000 to $99,999 | 40 (6.4%) | 11 (1.9%) |
| $100,000+ | 121 (19.3%) | 8 (1.4%) |
| Total | 628 (100.0%) | 588 (100.0%) |
Earnings by Sex by Educational Attainment in Williamson
Average earnings in Williamson are $48,750 for men and $31,625 for women, a difference of 35.1%. Men with an educational attainment of high school diploma enjoy the highest average annual earnings of $61,600, while those with bachelor's degree education earn the least with $35,114. Women with an educational attainment of college or associate's degree earn the most with the average annual earnings of $34,261, while those with high school diploma education have the smallest earnings of $23,750.
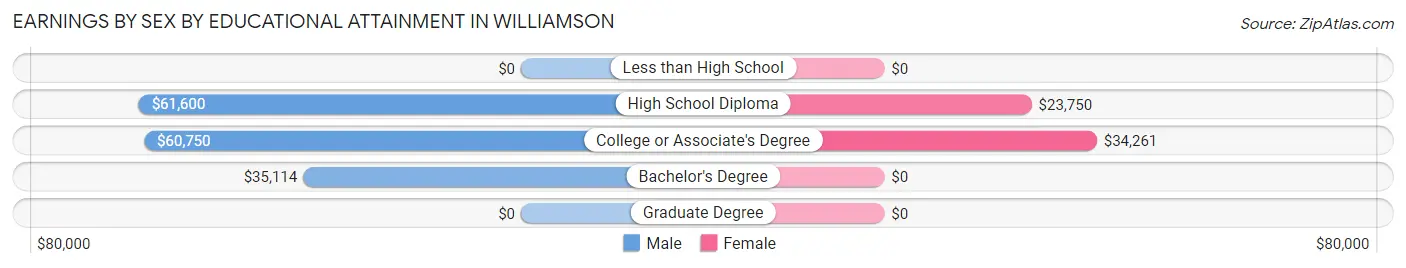
| Educational Attainment | Male Income | Female Income |
| Less than High School | - | - |
| High School Diploma | $61,600 | $23,750 |
| College or Associate's Degree | $60,750 | $34,261 |
| Bachelor's Degree | $35,114 | $0 |
| Graduate Degree | - | - |
| Total | $48,750 | $31,625 |
Family Income in Williamson
Family Income Brackets in Williamson
According to the Williamson family income data, there are 193 families falling into the $50,000 to $74,999 income range, which is the most common income bracket and makes up 29.4% of all families. Conversely, the less than $10,000 income bracket is the least frequent group with only 12 families (1.8%) belonging to this category.
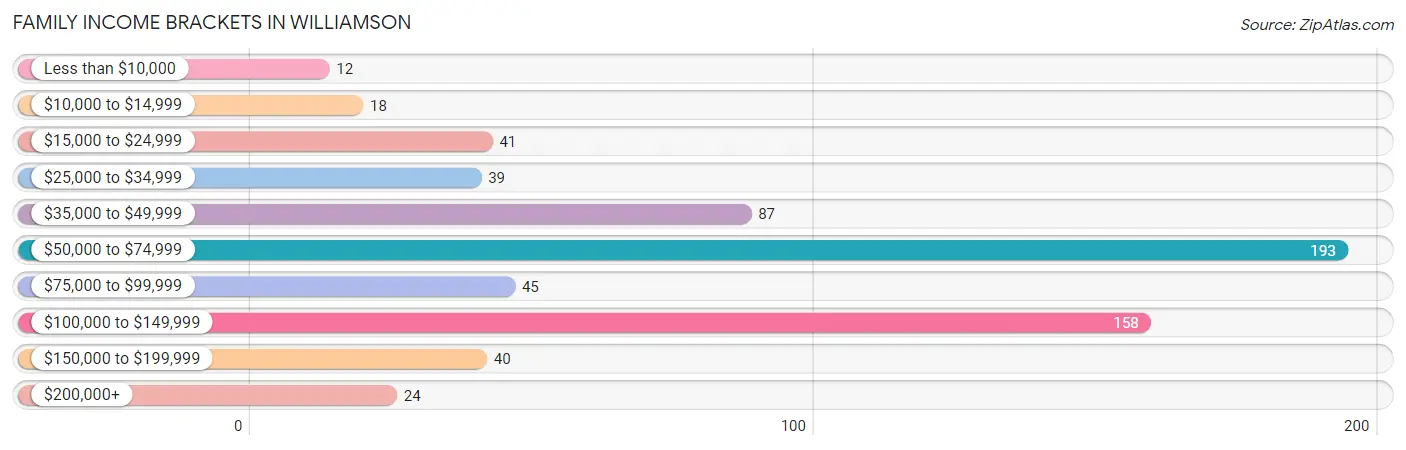
| Income Bracket | # Families | % Families |
| Less than $10,000 | 12 | 1.8% |
| $10,000 to $14,999 | 18 | 2.7% |
| $15,000 to $24,999 | 41 | 6.2% |
| $25,000 to $34,999 | 39 | 5.9% |
| $35,000 to $49,999 | 87 | 13.2% |
| $50,000 to $74,999 | 193 | 29.4% |
| $75,000 to $99,999 | 45 | 6.8% |
| $100,000 to $149,999 | 158 | 24.0% |
| $150,000 to $199,999 | 40 | 6.1% |
| $200,000+ | 24 | 3.7% |
Family Income by Famaliy Size in Williamson
5-person families (130 | 19.8%) account for the highest median family income in Williamson with $124,103 per family, while 2-person families (250 | 38.1%) have the highest median income of $27,720 per family member.
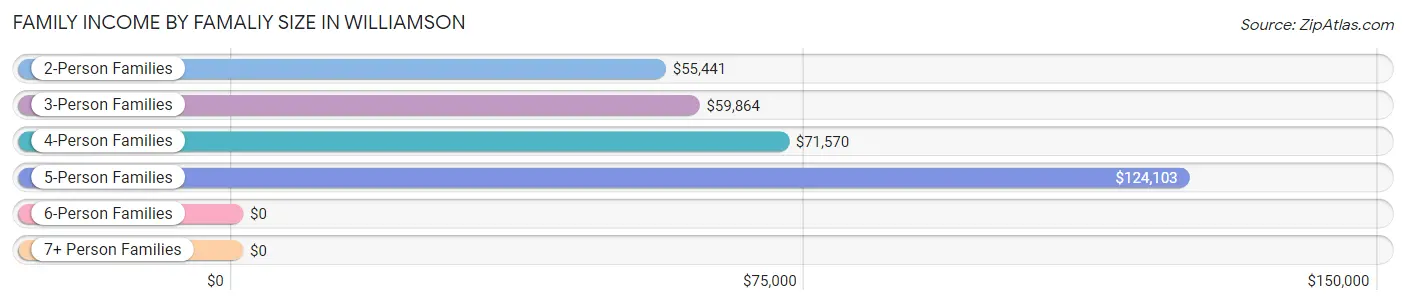
| Income Bracket | # Families | Median Income |
| 2-Person Families | 250 (38.1%) | $55,441 |
| 3-Person Families | 189 (28.8%) | $59,864 |
| 4-Person Families | 54 (8.2%) | $71,570 |
| 5-Person Families | 130 (19.8%) | $124,103 |
| 6-Person Families | 23 (3.5%) | $0 |
| 7+ Person Families | 11 (1.7%) | $0 |
| Total | 657 (100.0%) | $71,065 |
Family Income by Number of Earners in Williamson
The median family income in Williamson is $71,065, with families comprising 3+ earners (96) having the highest median family income of $113,864, while families with no earners (89) have the lowest median family income of $36,635, accounting for 14.6% and 13.6% of families, respectively.
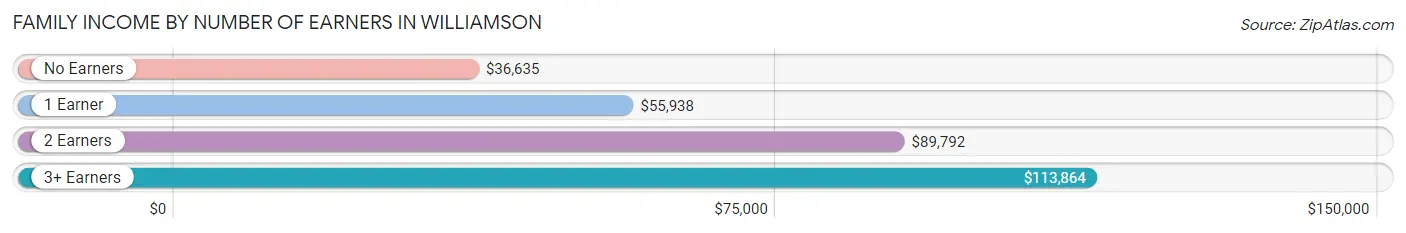
| Number of Earners | # Families | Median Income |
| No Earners | 89 (13.6%) | $36,635 |
| 1 Earner | 278 (42.3%) | $55,938 |
| 2 Earners | 194 (29.5%) | $89,792 |
| 3+ Earners | 96 (14.6%) | $113,864 |
| Total | 657 (100.0%) | $71,065 |
Household Income in Williamson
Household Income Brackets in Williamson
With 318 households falling in the category, the $50,000 to $74,999 income range is the most frequent in Williamson, accounting for 30.5% of all households. In contrast, only 37 households (3.5%) fall into the $200,000+ income bracket, making it the least populous group.
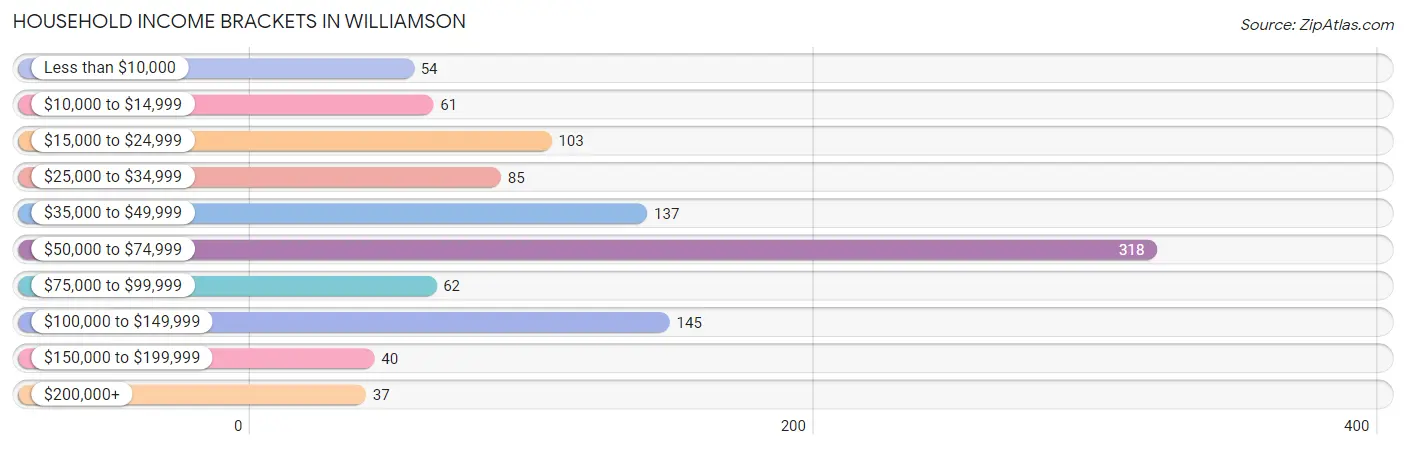
| Income Bracket | # Households | % Households |
| Less than $10,000 | 54 | 5.2% |
| $10,000 to $14,999 | 61 | 5.9% |
| $15,000 to $24,999 | 103 | 9.9% |
| $25,000 to $34,999 | 85 | 8.2% |
| $35,000 to $49,999 | 137 | 13.2% |
| $50,000 to $74,999 | 318 | 30.5% |
| $75,000 to $99,999 | 62 | 6.0% |
| $100,000 to $149,999 | 145 | 13.9% |
| $150,000 to $199,999 | 40 | 3.8% |
| $200,000+ | 37 | 3.6% |
Household Income by Householder Age in Williamson
The median household income in Williamson is $58,198, with the highest median household income of $71,397 found in the 45 to 64 years age bracket for the primary householder. A total of 408 households (39.2%) fall into this category. Meanwhile, the 15 to 24 years age bracket for the primary householder has the lowest median household income of $0, with 74 households (7.1%) in this group.
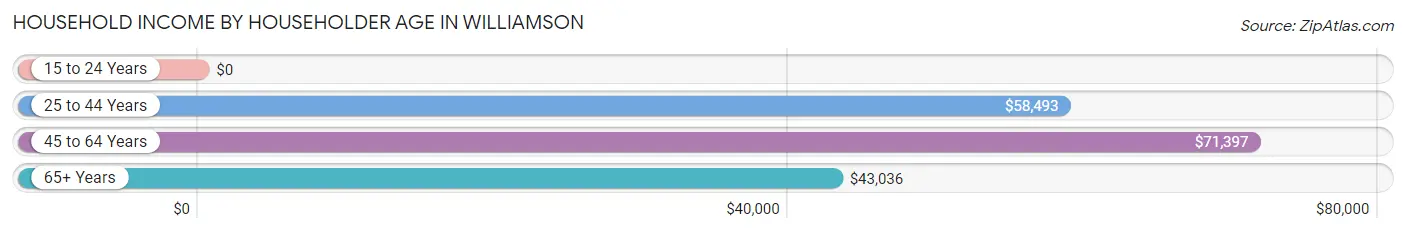
| Income Bracket | # Households | Median Income |
| 15 to 24 Years | 74 (7.1%) | $0 |
| 25 to 44 Years | 223 (21.4%) | $58,493 |
| 45 to 64 Years | 408 (39.2%) | $71,397 |
| 65+ Years | 336 (32.3%) | $43,036 |
| Total | 1,041 (100.0%) | $58,198 |
Poverty in Williamson
Income Below Poverty by Sex and Age in Williamson
With 12.4% poverty level for males and 7.4% for females among the residents of Williamson, 18 to 24 year old males and 16 and 17 year old females are the most vulnerable to poverty, with 35 males (38.9%) and 13 females (43.3%) in their respective age groups living below the poverty level.
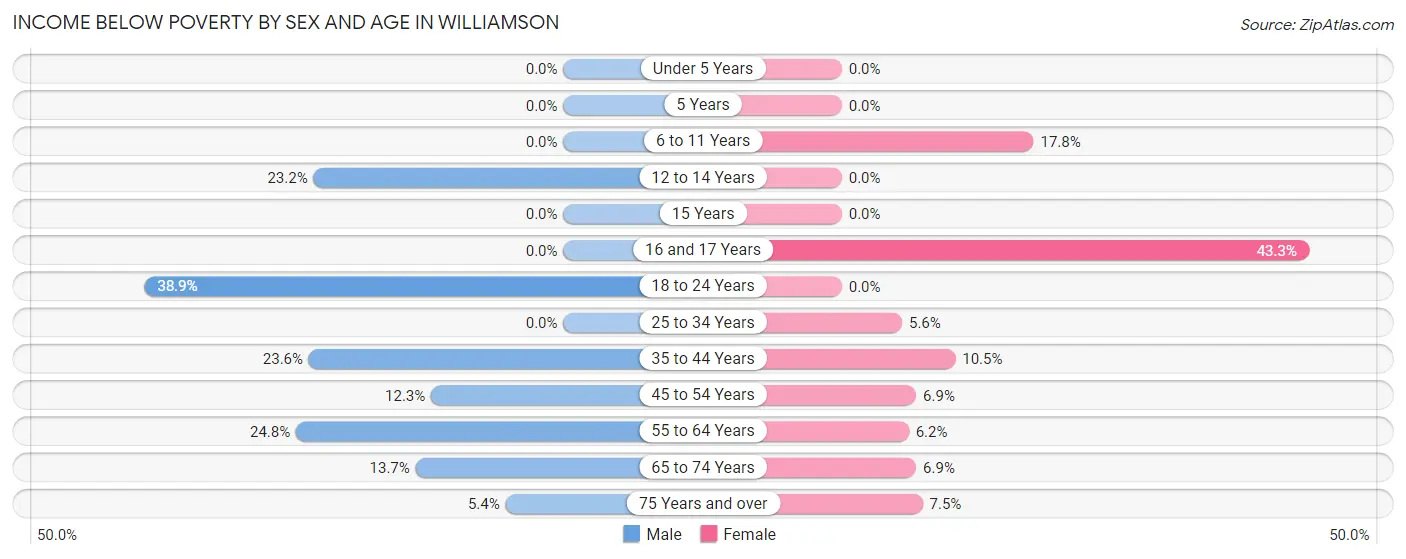
| Age Bracket | Male | Female |
| Under 5 Years | 0 (0.0%) | 0 (0.0%) |
| 5 Years | 0 (0.0%) | 0 (0.0%) |
| 6 to 11 Years | 0 (0.0%) | 21 (17.8%) |
| 12 to 14 Years | 16 (23.2%) | 0 (0.0%) |
| 15 Years | 0 (0.0%) | 0 (0.0%) |
| 16 and 17 Years | 0 (0.0%) | 13 (43.3%) |
| 18 to 24 Years | 35 (38.9%) | 0 (0.0%) |
| 25 to 34 Years | 0 (0.0%) | 9 (5.6%) |
| 35 to 44 Years | 30 (23.6%) | 12 (10.5%) |
| 45 to 54 Years | 20 (12.3%) | 12 (6.9%) |
| 55 to 64 Years | 32 (24.8%) | 10 (6.2%) |
| 65 to 74 Years | 17 (13.7%) | 10 (6.9%) |
| 75 Years and over | 6 (5.4%) | 9 (7.5%) |
| Total | 156 (12.4%) | 96 (7.4%) |
Income Above Poverty by Sex and Age in Williamson
According to the poverty statistics in Williamson, males aged under 5 years and females aged under 5 years are the age groups that are most secure financially, with 100.0% of males and 100.0% of females in these age groups living above the poverty line.
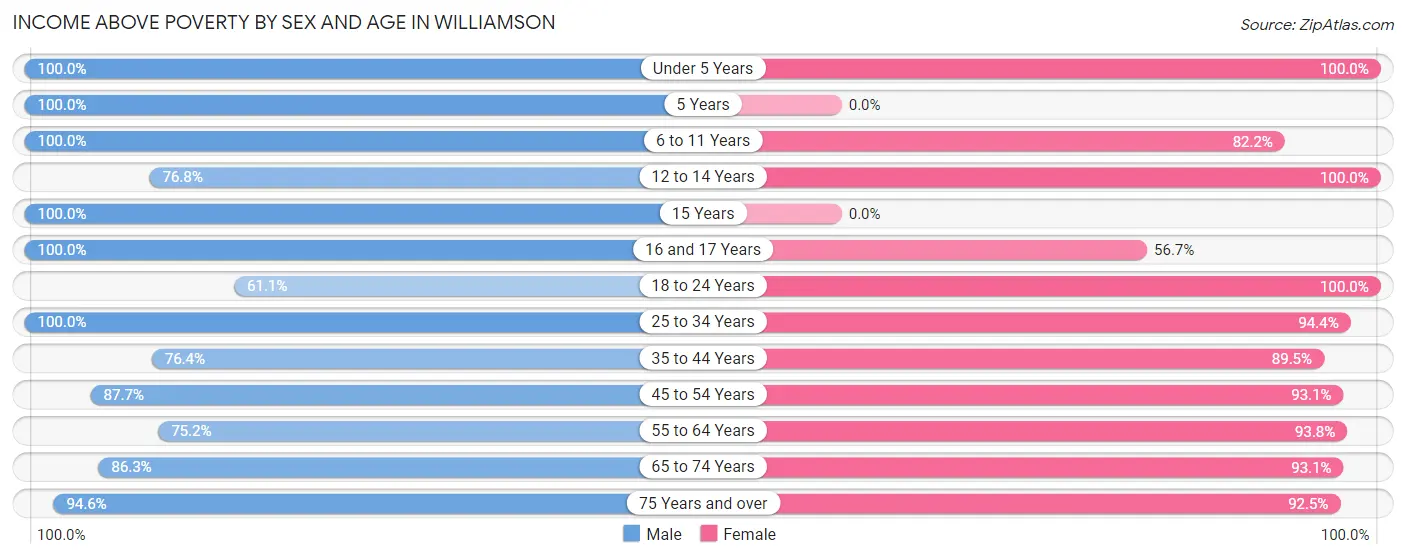
| Age Bracket | Male | Female |
| Under 5 Years | 87 (100.0%) | 82 (100.0%) |
| 5 Years | 21 (100.0%) | 0 (0.0%) |
| 6 to 11 Years | 77 (100.0%) | 97 (82.2%) |
| 12 to 14 Years | 53 (76.8%) | 65 (100.0%) |
| 15 Years | 55 (100.0%) | 0 (0.0%) |
| 16 and 17 Years | 10 (100.0%) | 17 (56.7%) |
| 18 to 24 Years | 55 (61.1%) | 126 (100.0%) |
| 25 to 34 Years | 191 (100.0%) | 152 (94.4%) |
| 35 to 44 Years | 97 (76.4%) | 102 (89.5%) |
| 45 to 54 Years | 143 (87.7%) | 162 (93.1%) |
| 55 to 64 Years | 97 (75.2%) | 151 (93.8%) |
| 65 to 74 Years | 107 (86.3%) | 135 (93.1%) |
| 75 Years and over | 106 (94.6%) | 111 (92.5%) |
| Total | 1,099 (87.6%) | 1,200 (92.6%) |
Income Below Poverty Among Married-Couple Families in Williamson
The poverty statistics for married-couple families in Williamson show that 1.4% or 6 of the total 439 families live below the poverty line. Families with no children have the highest poverty rate of 2.4%, comprising of 6 families. On the other hand, families with 1 or 2 children have the lowest poverty rate of 0.0%, which includes 0 families.
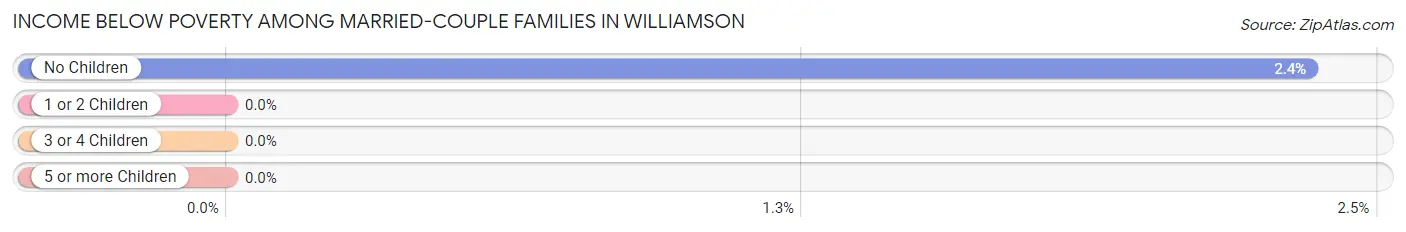
| Children | Above Poverty | Below Poverty |
| No Children | 249 (97.7%) | 6 (2.4%) |
| 1 or 2 Children | 111 (100.0%) | 0 (0.0%) |
| 3 or 4 Children | 62 (100.0%) | 0 (0.0%) |
| 5 or more Children | 11 (100.0%) | 0 (0.0%) |
| Total | 433 (98.6%) | 6 (1.4%) |
Income Below Poverty Among Single-Parent Households in Williamson
According to the poverty data in Williamson, 67.2% or 41 single-father households and 15.3% or 24 single-mother households are living below the poverty line. Among single-father households, those with 1 or 2 children have the highest poverty rate, with 41 households (80.4%) experiencing poverty. Likewise, among single-mother households, those with 1 or 2 children have the highest poverty rate, with 24 households (24.0%) falling below the poverty line.
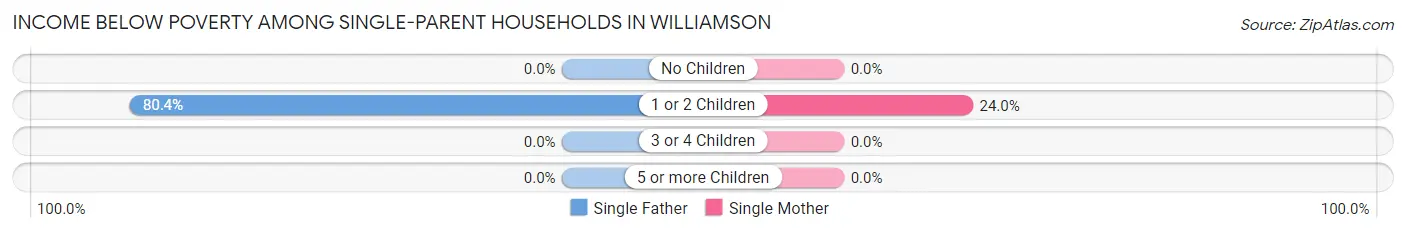
| Children | Single Father | Single Mother |
| No Children | 0 (0.0%) | 0 (0.0%) |
| 1 or 2 Children | 41 (80.4%) | 24 (24.0%) |
| 3 or 4 Children | 0 (0.0%) | 0 (0.0%) |
| 5 or more Children | 0 (0.0%) | 0 (0.0%) |
| Total | 41 (67.2%) | 24 (15.3%) |
Income Below Poverty Among Married-Couple vs Single-Parent Households in Williamson
The poverty data for Williamson shows that 6 of the married-couple family households (1.4%) and 65 of the single-parent households (29.8%) are living below the poverty level. Within the married-couple family households, those with no children have the highest poverty rate, with 6 households (2.4%) falling below the poverty line. Among the single-parent households, those with 1 or 2 children have the highest poverty rate, with 65 household (43.0%) living below poverty.
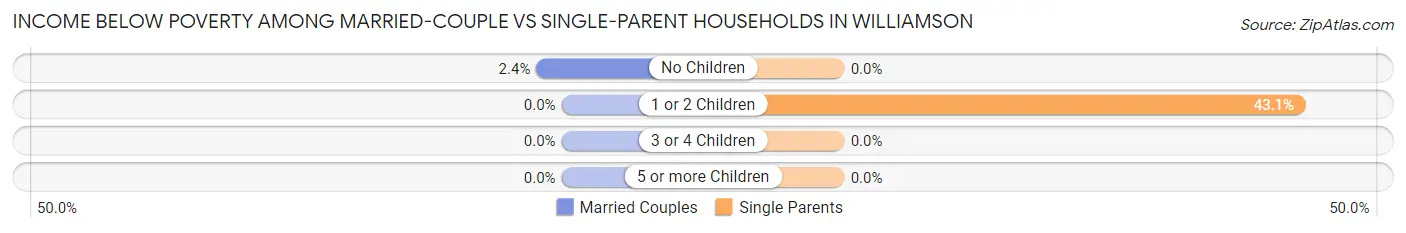
| Children | Married-Couple Families | Single-Parent Households |
| No Children | 6 (2.4%) | 0 (0.0%) |
| 1 or 2 Children | 0 (0.0%) | 65 (43.0%) |
| 3 or 4 Children | 0 (0.0%) | 0 (0.0%) |
| 5 or more Children | 0 (0.0%) | 0 (0.0%) |
| Total | 6 (1.4%) | 65 (29.8%) |
Race in Williamson
The most populous races in Williamson are White / Caucasian (2,370 | 92.6%), Hispanic or Latino (200 | 7.8%), and Two or more Races (113 | 4.4%).
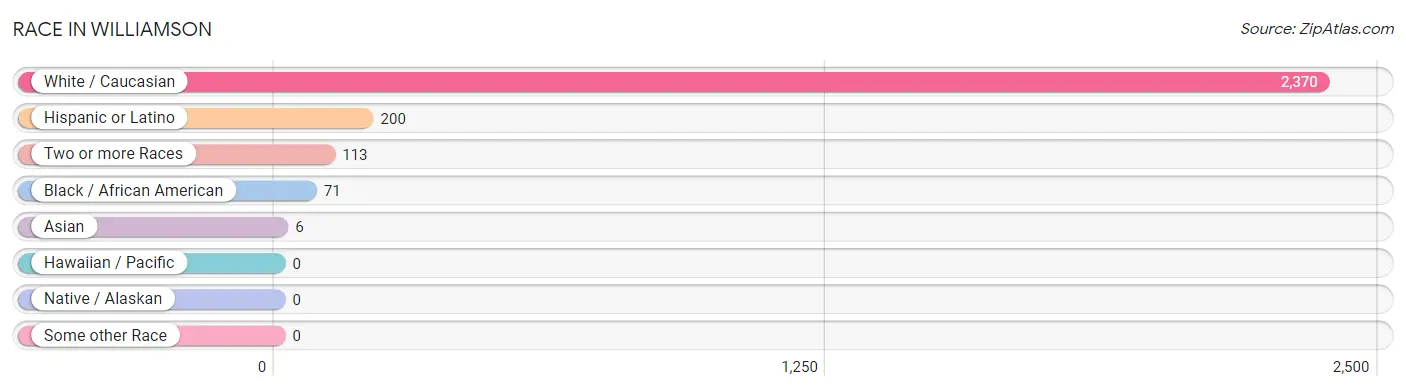
| Race | # Population | % Population |
| Asian | 6 | 0.2% |
| Black / African American | 71 | 2.8% |
| Hawaiian / Pacific | 0 | 0.0% |
| Hispanic or Latino | 200 | 7.8% |
| Native / Alaskan | 0 | 0.0% |
| White / Caucasian | 2,370 | 92.6% |
| Two or more Races | 113 | 4.4% |
| Some other Race | 0 | 0.0% |
| Total | 2,560 | 100.0% |
Ancestry in Williamson
The most populous ancestries reported in Williamson are German (576 | 22.5%), Italian (550 | 21.5%), English (382 | 14.9%), Irish (334 | 13.1%), and Dutch (233 | 9.1%), together accounting for 81.0% of all Williamson residents.
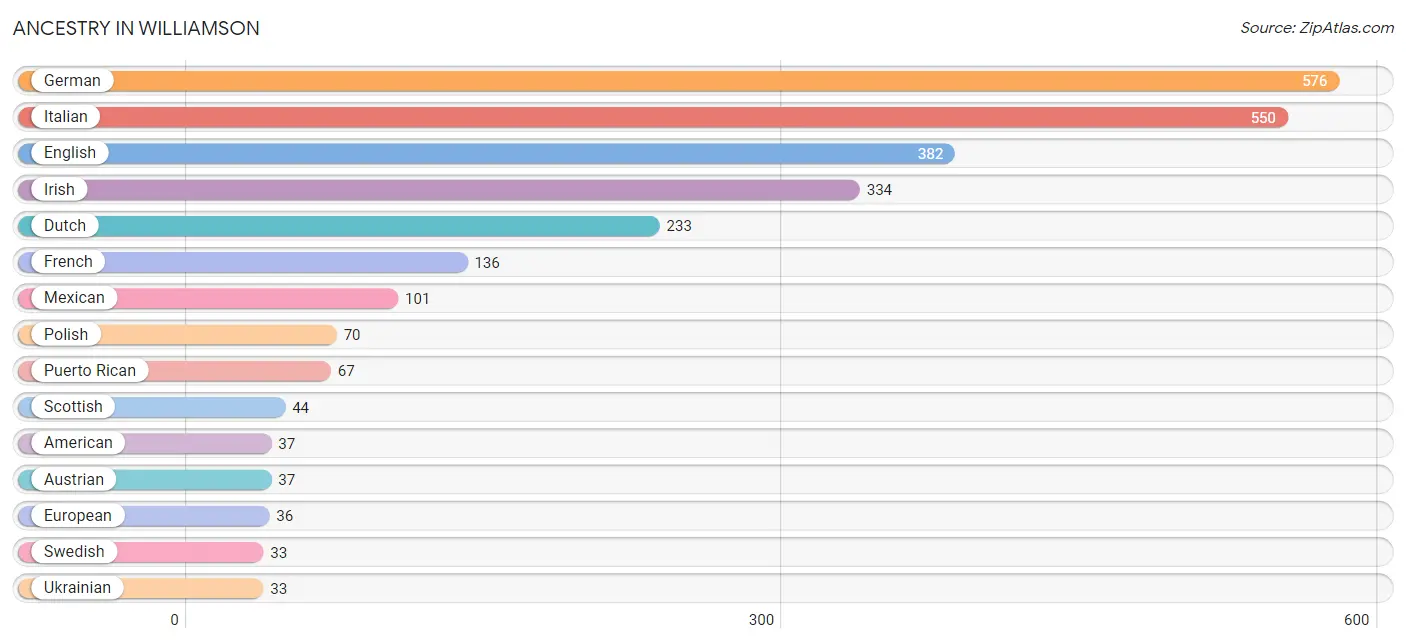
| Ancestry | # Population | % Population |
| American | 37 | 1.5% |
| Austrian | 37 | 1.5% |
| British | 21 | 0.8% |
| Cherokee | 3 | 0.1% |
| Dominican | 1 | 0.0% |
| Dutch | 233 | 9.1% |
| Eastern European | 11 | 0.4% |
| English | 382 | 14.9% |
| European | 36 | 1.4% |
| French | 136 | 5.3% |
| German | 576 | 22.5% |
| Irish | 334 | 13.1% |
| Italian | 550 | 21.5% |
| Lithuanian | 26 | 1.0% |
| Mexican | 101 | 4.0% |
| Peruvian | 11 | 0.4% |
| Polish | 70 | 2.7% |
| Puerto Rican | 67 | 2.6% |
| Scottish | 44 | 1.7% |
| Slovak | 31 | 1.2% |
| South American | 11 | 0.4% |
| Spanish | 20 | 0.8% |
| Swedish | 33 | 1.3% |
| Thai | 6 | 0.2% |
| Ukrainian | 33 | 1.3% |
| Welsh | 17 | 0.7% | View All 26 Rows |
Immigrants in Williamson
The most numerous immigrant groups reported in Williamson came from Latin America (59 | 2.3%), Central America (34 | 1.3%), Mexico (34 | 1.3%), Caribbean (25 | 1.0%), and Trinidad and Tobago (17 | 0.7%), together accounting for 6.6% of all Williamson residents.
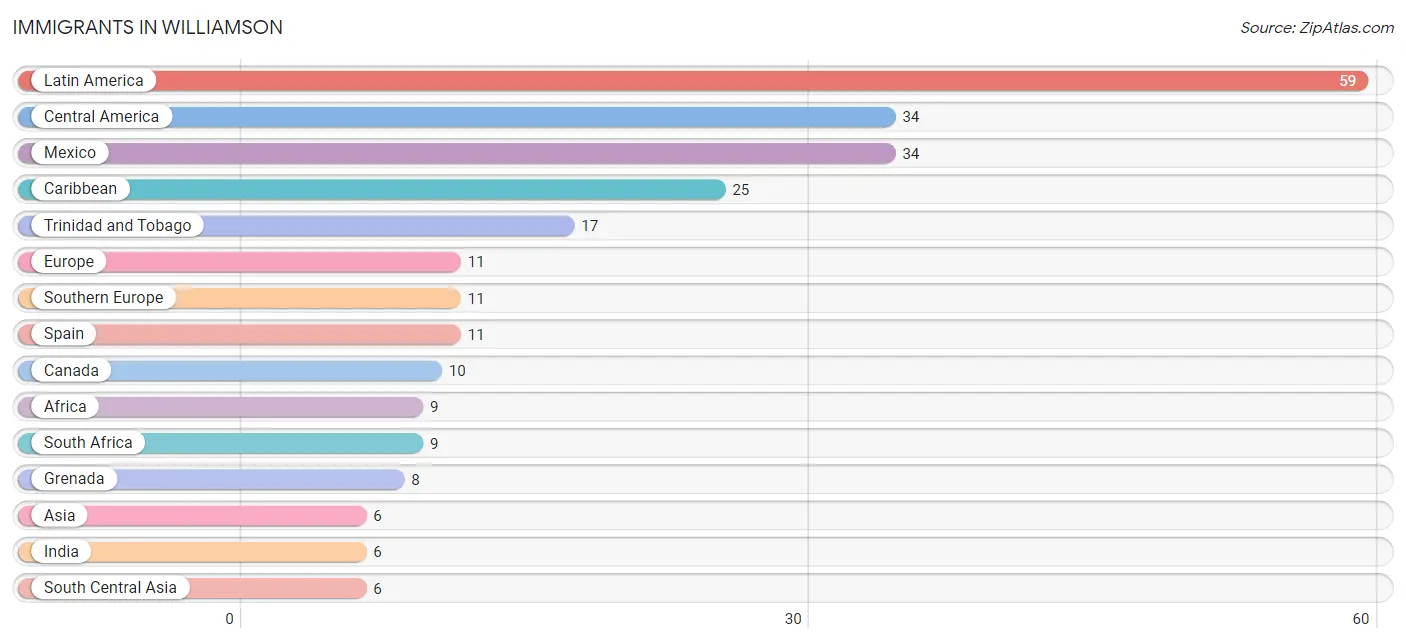
| Immigration Origin | # Population | % Population |
| Africa | 9 | 0.4% |
| Asia | 6 | 0.2% |
| Canada | 10 | 0.4% |
| Caribbean | 25 | 1.0% |
| Central America | 34 | 1.3% |
| Europe | 11 | 0.4% |
| Grenada | 8 | 0.3% |
| India | 6 | 0.2% |
| Latin America | 59 | 2.3% |
| Mexico | 34 | 1.3% |
| South Africa | 9 | 0.4% |
| South Central Asia | 6 | 0.2% |
| Southern Europe | 11 | 0.4% |
| Spain | 11 | 0.4% |
| Trinidad and Tobago | 17 | 0.7% | View All 15 Rows |
Sex and Age in Williamson
Sex and Age in Williamson
The most populous age groups in Williamson are 25 to 29 Years (133 | 10.5%) for men and 65 to 69 Years (121 | 9.3%) for women.
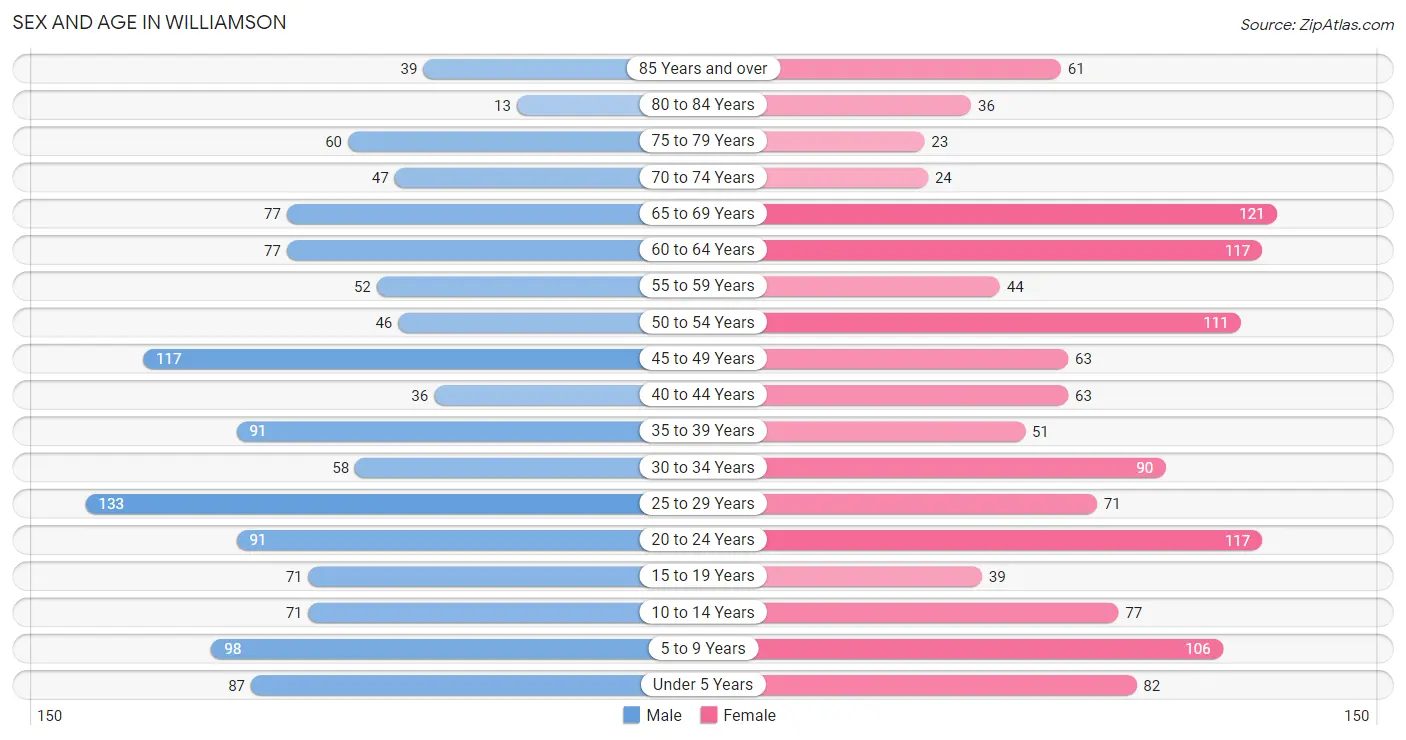
| Age Bracket | Male | Female |
| Under 5 Years | 87 (6.9%) | 82 (6.3%) |
| 5 to 9 Years | 98 (7.7%) | 106 (8.2%) |
| 10 to 14 Years | 71 (5.6%) | 77 (5.9%) |
| 15 to 19 Years | 71 (5.6%) | 39 (3.0%) |
| 20 to 24 Years | 91 (7.2%) | 117 (9.0%) |
| 25 to 29 Years | 133 (10.5%) | 71 (5.5%) |
| 30 to 34 Years | 58 (4.6%) | 90 (6.9%) |
| 35 to 39 Years | 91 (7.2%) | 51 (3.9%) |
| 40 to 44 Years | 36 (2.9%) | 63 (4.9%) |
| 45 to 49 Years | 117 (9.3%) | 63 (4.9%) |
| 50 to 54 Years | 46 (3.6%) | 111 (8.6%) |
| 55 to 59 Years | 52 (4.1%) | 44 (3.4%) |
| 60 to 64 Years | 77 (6.1%) | 117 (9.0%) |
| 65 to 69 Years | 77 (6.1%) | 121 (9.3%) |
| 70 to 74 Years | 47 (3.7%) | 24 (1.8%) |
| 75 to 79 Years | 60 (4.8%) | 23 (1.8%) |
| 80 to 84 Years | 13 (1.0%) | 36 (2.8%) |
| 85 Years and over | 39 (3.1%) | 61 (4.7%) |
| Total | 1,264 (100.0%) | 1,296 (100.0%) |
Families and Households in Williamson
Median Family Size in Williamson
The median family size in Williamson is 3.08 persons per family, with married-couple families (439 | 66.8%) accounting for the largest median family size of 3.25 persons per family. On the other hand, single male/father families (61 | 9.3%) represent the smallest median family size with 1.77 persons per family.
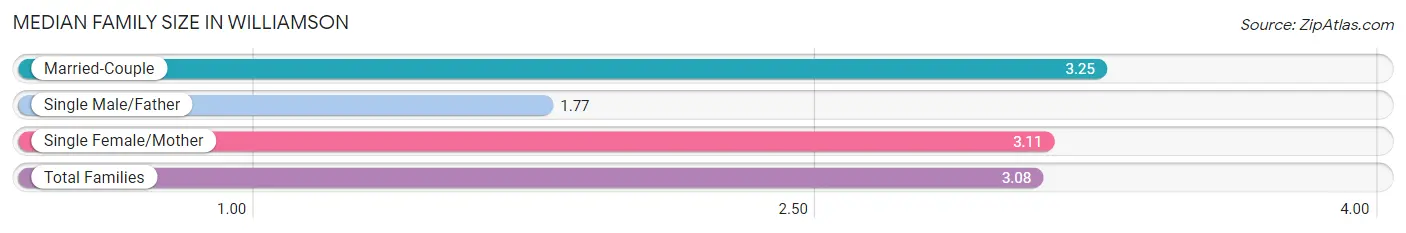
| Family Type | # Families | Family Size |
| Married-Couple | 439 (66.8%) | 3.25 |
| Single Male/Father | 61 (9.3%) | 1.77 |
| Single Female/Mother | 157 (23.9%) | 3.11 |
| Total Families | 657 (100.0%) | 3.08 |
Median Household Size in Williamson
The median household size in Williamson is 2.41 persons per household, with single female/mother households (157 | 15.1%) accounting for the largest median household size of 3.36 persons per household. non-family households (384 | 36.9%) represent the smallest median household size with 1.04 persons per household.
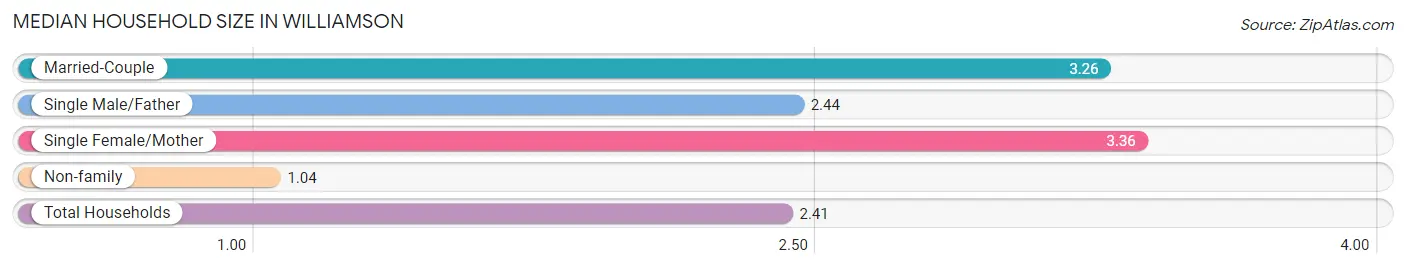
| Household Type | # Households | Household Size |
| Married-Couple | 439 (42.2%) | 3.26 |
| Single Male/Father | 61 (5.9%) | 2.44 |
| Single Female/Mother | 157 (15.1%) | 3.36 |
| Non-family | 384 (36.9%) | 1.04 |
| Total Households | 1,041 (100.0%) | 2.41 |
Household Size by Marriage Status in Williamson
Out of a total of 1,041 households in Williamson, 657 (63.1%) are family households, while 384 (36.9%) are nonfamily households. The most numerous type of family households are 2-person households, comprising 208, and the most common type of nonfamily households are 1-person households, comprising 367.
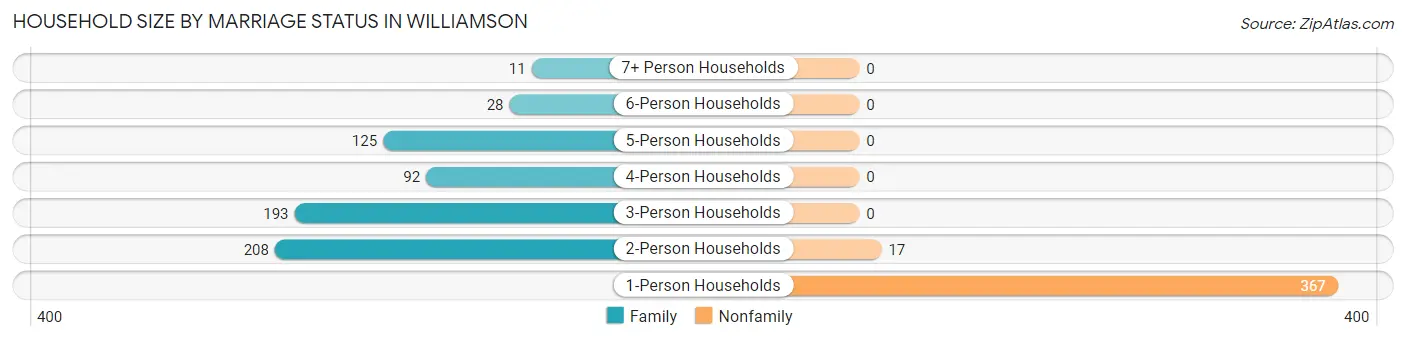
| Household Size | Family Households | Nonfamily Households |
| 1-Person Households | - | 367 (35.2%) |
| 2-Person Households | 208 (20.0%) | 17 (1.6%) |
| 3-Person Households | 193 (18.5%) | 0 (0.0%) |
| 4-Person Households | 92 (8.8%) | 0 (0.0%) |
| 5-Person Households | 125 (12.0%) | 0 (0.0%) |
| 6-Person Households | 28 (2.7%) | 0 (0.0%) |
| 7+ Person Households | 11 (1.1%) | 0 (0.0%) |
| Total | 657 (63.1%) | 384 (36.9%) |
Female Fertility in Williamson
Fertility by Age in Williamson
Average fertility rate in Williamson is 137.0 births per 1,000 women. Women in the age bracket of 20 to 34 years have the highest fertility rate with 248.0 births per 1,000 women. Women in the age bracket of 20 to 34 years acount for 100.0% of all women with births.
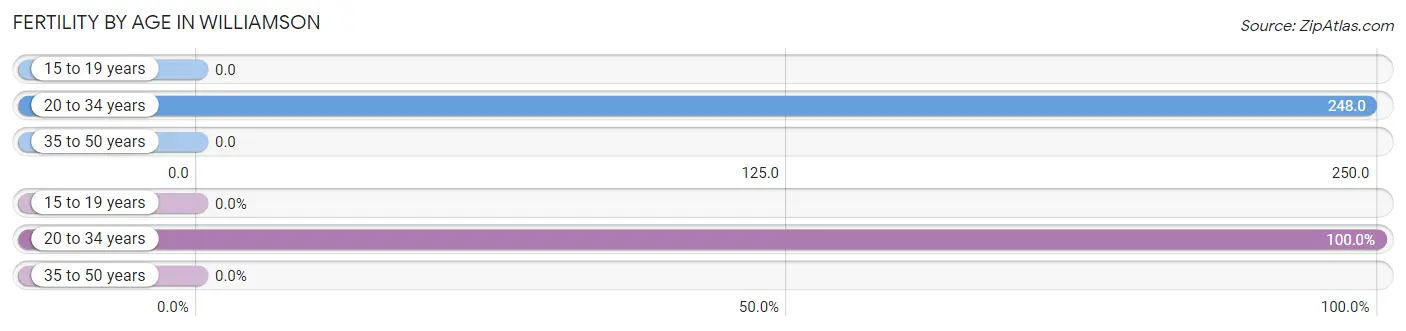
| Age Bracket | Women with Births | Births / 1,000 Women |
| 15 to 19 years | 0 (0.0%) | 0.0 |
| 20 to 34 years | 69 (100.0%) | 248.0 |
| 35 to 50 years | 0 (0.0%) | 0.0 |
| Total | 69 (100.0%) | 137.0 |
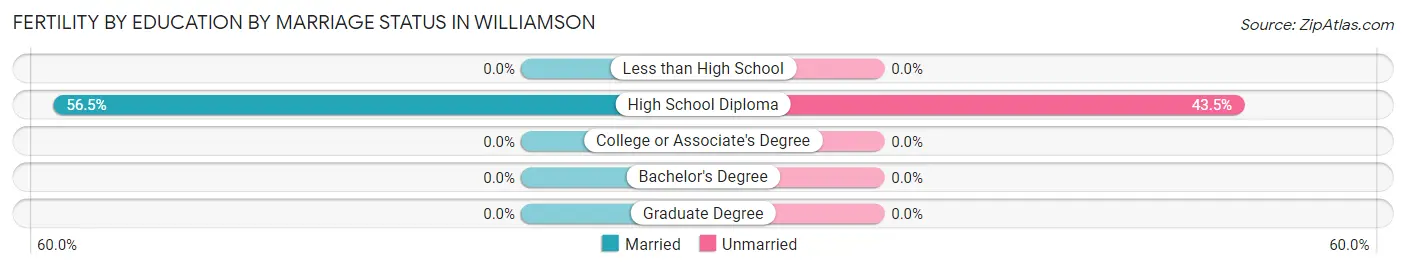
Fertility by Age by Marriage Status in Williamson
56.5% of women with births (69) in Williamson are married. The highest percentage of unmarried women with births falls into 20 to 34 years age bracket with 43.5% of them unmarried at the time of birth, while the lowest percentage of unmarried women with births belong to 20 to 34 years age bracket with 43.5% of them unmarried.
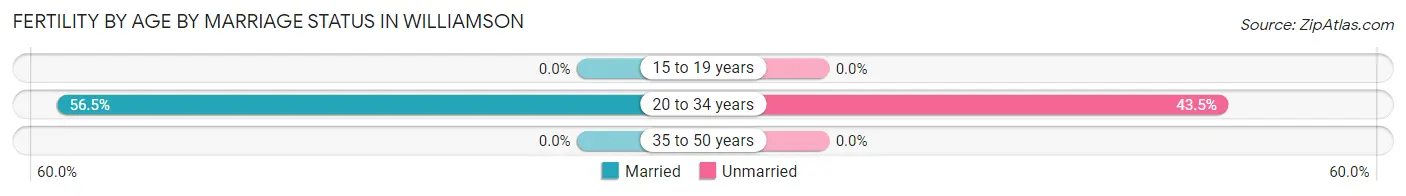
| Age Bracket | Married | Unmarried |
| 15 to 19 years | 0 (0.0%) | 0 (0.0%) |
| 20 to 34 years | 39 (56.5%) | 30 (43.5%) |
| 35 to 50 years | 0 (0.0%) | 0 (0.0%) |
| Total | 39 (56.5%) | 30 (43.5%) |
Fertility by Education in Williamson
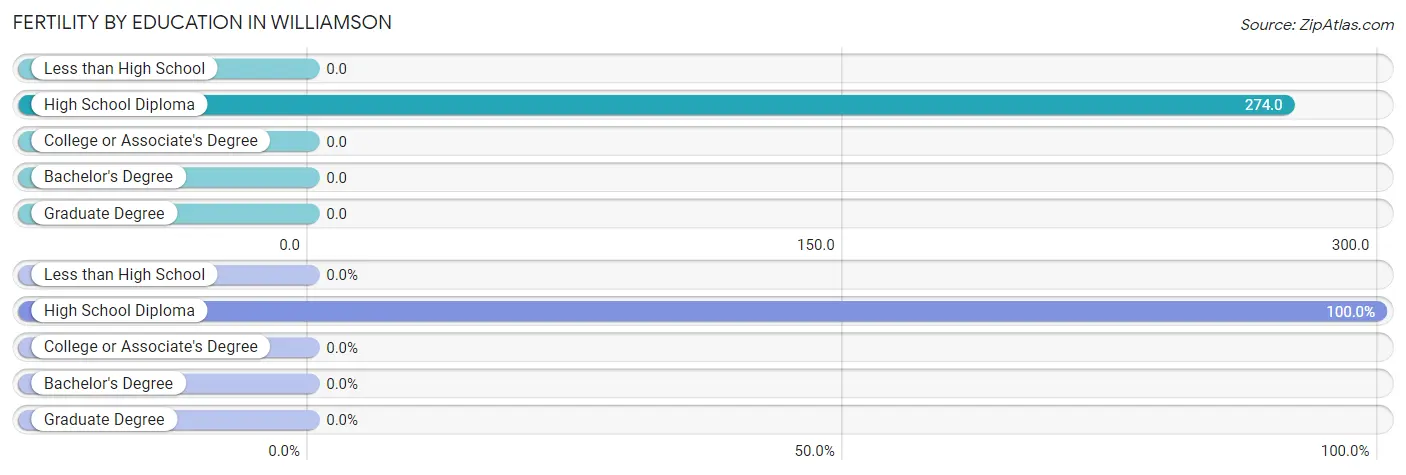
| Educational Attainment | Women with Births | Births / 1,000 Women |
| Less than High School | 0 (0.0%) | 0.0 |
| High School Diploma | 69 (100.0%) | 274.0 |
| College or Associate's Degree | 0 (0.0%) | 0.0 |
| Bachelor's Degree | 0 (0.0%) | 0.0 |
| Graduate Degree | 0 (0.0%) | 0.0 |
| Total | 69 (100.0%) | 137.0 |
Fertility by Education by Marriage Status in Williamson
43.5% of women with births in Williamson are unmarried. Women with the educational attainment of high school diploma are most likely to be married with 56.5% of them married at childbirth, while women with the educational attainment of high school diploma are least likely to be married with 43.5% of them unmarried at childbirth.
| Educational Attainment | Married | Unmarried |
| Less than High School | 0 (0.0%) | 0 (0.0%) |
| High School Diploma | 39 (56.5%) | 30 (43.5%) |
| College or Associate's Degree | 0 (0.0%) | 0 (0.0%) |
| Bachelor's Degree | 0 (0.0%) | 0 (0.0%) |
| Graduate Degree | 0 (0.0%) | 0 (0.0%) |
| Total | 39 (56.5%) | 30 (43.5%) |
Employment Characteristics in Williamson
Employment by Class of Employer in Williamson
Among the 1,013 employed individuals in Williamson, private company employees (686 | 67.7%), local government employees (100 | 9.9%), and self-employed (not incorporated) (70 | 6.9%) make up the most common classes of employment.
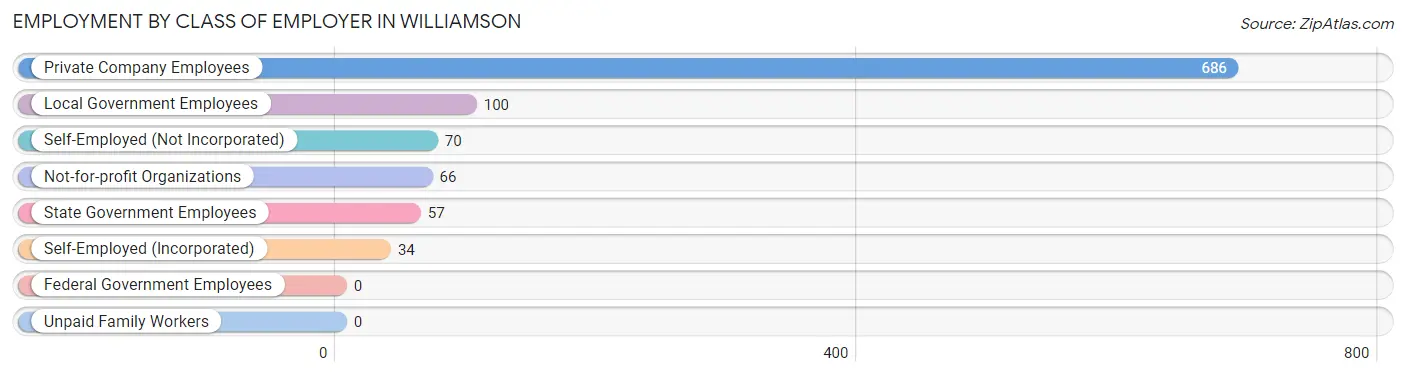
| Employer Class | # Employees | % Employees |
| Private Company Employees | 686 | 67.7% |
| Self-Employed (Incorporated) | 34 | 3.4% |
| Self-Employed (Not Incorporated) | 70 | 6.9% |
| Not-for-profit Organizations | 66 | 6.5% |
| Local Government Employees | 100 | 9.9% |
| State Government Employees | 57 | 5.6% |
| Federal Government Employees | 0 | 0.0% |
| Unpaid Family Workers | 0 | 0.0% |
| Total | 1,013 | 100.0% |
Employment Status by Age in Williamson
According to the labor force statistics for Williamson, out of the total population over 16 years of age (1,978), 54.9% or 1,086 individuals are in the labor force, with 5.7% or 62 of them unemployed. The age group with the highest labor force participation rate is 25 to 29 years, with 84.8% or 173 individuals in the labor force. Within the labor force, the 16 to 19 years age range has the highest percentage of unemployed individuals, with 27.8% or 10 of them being unemployed.
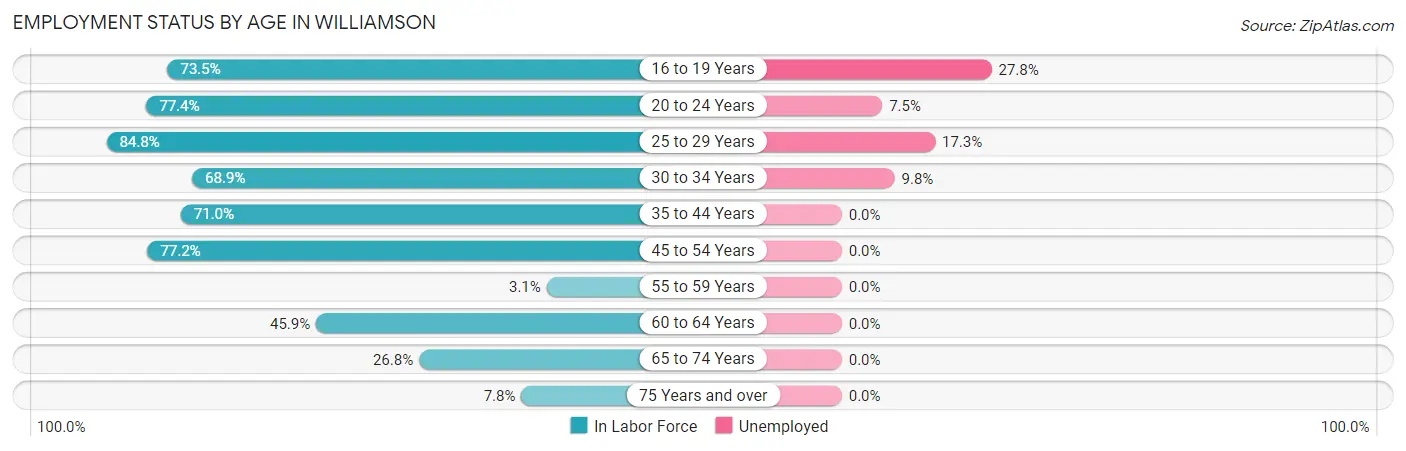
| Age Bracket | In Labor Force | Unemployed |
| 16 to 19 Years | 36 (73.5%) | 10 (27.8%) |
| 20 to 24 Years | 161 (77.4%) | 12 (7.5%) |
| 25 to 29 Years | 173 (84.8%) | 30 (17.3%) |
| 30 to 34 Years | 102 (68.9%) | 10 (9.8%) |
| 35 to 44 Years | 171 (71.0%) | 0 (0.0%) |
| 45 to 54 Years | 260 (77.2%) | 0 (0.0%) |
| 55 to 59 Years | 3 (3.1%) | 0 (0.0%) |
| 60 to 64 Years | 89 (45.9%) | 0 (0.0%) |
| 65 to 74 Years | 72 (26.8%) | 0 (0.0%) |
| 75 Years and over | 18 (7.8%) | 0 (0.0%) |
| Total | 1,086 (54.9%) | 62 (5.7%) |
Employment Status by Educational Attainment in Williamson
According to labor force statistics for Williamson, 65.4% of individuals (798) out of the total population between 25 and 64 years of age (1,220) are in the labor force, with 5.0% or 40 of them being unemployed. The group with the highest labor force participation rate are those with the educational attainment of bachelor's degree or higher, with 89.9% or 151 individuals in the labor force. Within the labor force, individuals with high school diploma education have the highest percentage of unemployment, with 10.0% or 40 of them being unemployed.
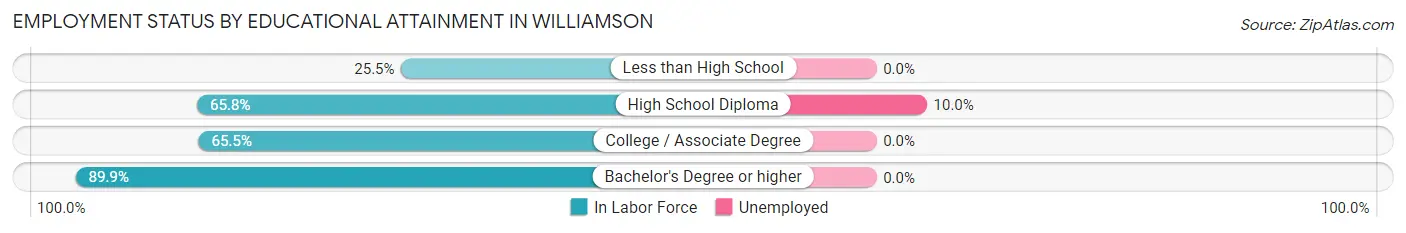
| Educational Attainment | In Labor Force | Unemployed |
| Less than High School | 28 (25.5%) | 0 (0.0%) |
| High School Diploma | 401 (65.8%) | 61 (10.0%) |
| College / Associate Degree | 218 (65.5%) | 0 (0.0%) |
| Bachelor's Degree or higher | 151 (89.9%) | 0 (0.0%) |
| Total | 798 (65.4%) | 61 (5.0%) |
Employment Occupations by Sex in Williamson
Management, Business, Science and Arts Occupations
The most common Management, Business, Science and Arts occupations in Williamson are Community & Social Service (113 | 11.1%), Education Instruction & Library (67 | 6.6%), Business & Financial (55 | 5.4%), Health Diagnosing & Treating (52 | 5.1%), and Computers, Engineering & Science (39 | 3.8%).
Management, Business, Science and Arts Occupations by Sex
Within the Management, Business, Science and Arts occupations in Williamson, the most male-oriented occupations are Computers, Engineering & Science (100.0%), Computers & Mathematics (100.0%), and Architecture & Engineering (100.0%), while the most female-oriented occupations are Education, Arts & Media (100.0%), Arts, Media & Entertainment (100.0%), and Health Diagnosing & Treating (78.8%).
| Occupation | Male | Female |
| Management | 27 (77.1%) | 8 (22.9%) |
| Business & Financial | 21 (38.2%) | 34 (61.8%) |
| Computers, Engineering & Science | 39 (100.0%) | 0 (0.0%) |
| Computers & Mathematics | 22 (100.0%) | 0 (0.0%) |
| Architecture & Engineering | 17 (100.0%) | 0 (0.0%) |
| Life, Physical & Social Science | 0 (0.0%) | 0 (0.0%) |
| Community & Social Service | 35 (31.0%) | 78 (69.0%) |
| Education, Arts & Media | 0 (0.0%) | 36 (100.0%) |
| Legal Services & Support | 0 (0.0%) | 0 (0.0%) |
| Education Instruction & Library | 35 (52.2%) | 32 (47.8%) |
| Arts, Media & Entertainment | 0 (0.0%) | 10 (100.0%) |
| Health Diagnosing & Treating | 11 (21.1%) | 41 (78.8%) |
| Health Technologists | 11 (47.8%) | 12 (52.2%) |
| Total (Category) | 133 (45.2%) | 161 (54.8%) |
| Total (Overall) | 537 (52.5%) | 486 (47.5%) |
Services Occupations
The most common Services occupations in Williamson are Healthcare Support (96 | 9.4%), Cleaning & Maintenance (76 | 7.4%), Security & Protection (69 | 6.7%), Food Preparation & Serving (60 | 5.9%), and Firefighting & Prevention (59 | 5.8%).
Services Occupations by Sex
Within the Services occupations in Williamson, the most male-oriented occupations are Security & Protection (100.0%), Firefighting & Prevention (100.0%), and Law Enforcement (100.0%), while the most female-oriented occupations are Food Preparation & Serving (85.0%), Healthcare Support (72.9%), and Cleaning & Maintenance (15.8%).
| Occupation | Male | Female |
| Healthcare Support | 26 (27.1%) | 70 (72.9%) |
| Security & Protection | 69 (100.0%) | 0 (0.0%) |
| Firefighting & Prevention | 59 (100.0%) | 0 (0.0%) |
| Law Enforcement | 10 (100.0%) | 0 (0.0%) |
| Food Preparation & Serving | 9 (15.0%) | 51 (85.0%) |
| Cleaning & Maintenance | 64 (84.2%) | 12 (15.8%) |
| Personal Care & Service | 22 (100.0%) | 0 (0.0%) |
| Total (Category) | 190 (58.8%) | 133 (41.2%) |
| Total (Overall) | 537 (52.5%) | 486 (47.5%) |
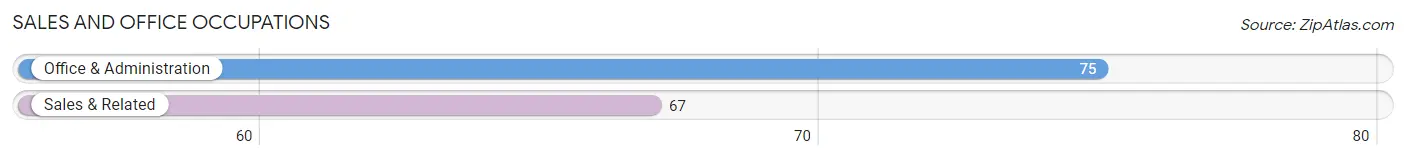
Sales and Office Occupations
The most common Sales and Office occupations in Williamson are Office & Administration (75 | 7.3%), and Sales & Related (67 | 6.6%).
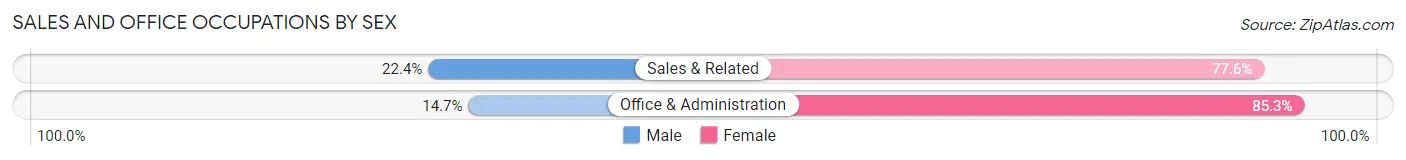
Sales and Office Occupations by Sex
| Occupation | Male | Female |
| Sales & Related | 15 (22.4%) | 52 (77.6%) |
| Office & Administration | 11 (14.7%) | 64 (85.3%) |
| Total (Category) | 26 (18.3%) | 116 (81.7%) |
| Total (Overall) | 537 (52.5%) | 486 (47.5%) |
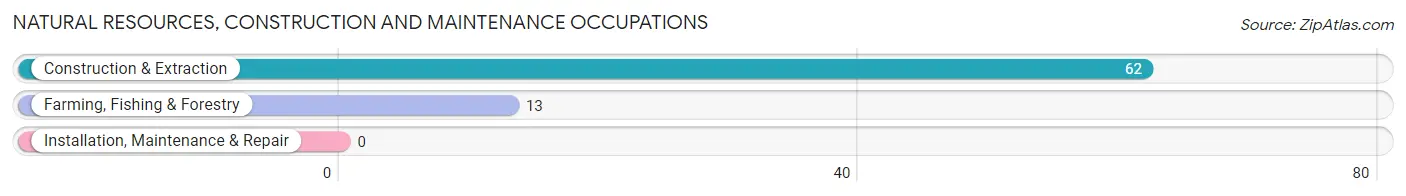
Natural Resources, Construction and Maintenance Occupations
The most common Natural Resources, Construction and Maintenance occupations in Williamson are Construction & Extraction (62 | 6.1%), and Farming, Fishing & Forestry (13 | 1.3%).
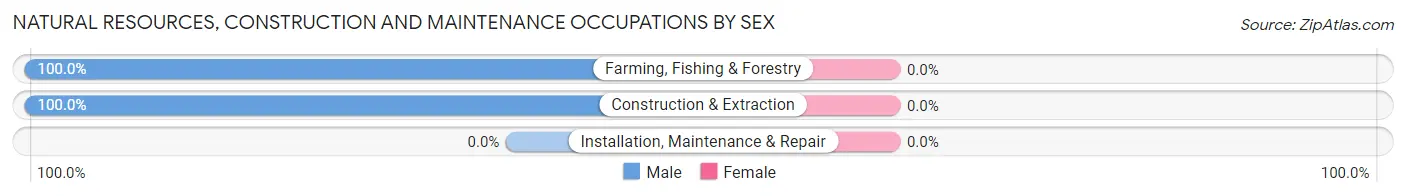
Natural Resources, Construction and Maintenance Occupations by Sex
| Occupation | Male | Female |
| Farming, Fishing & Forestry | 13 (100.0%) | 0 (0.0%) |
| Construction & Extraction | 62 (100.0%) | 0 (0.0%) |
| Installation, Maintenance & Repair | 0 (0.0%) | 0 (0.0%) |
| Total (Category) | 75 (100.0%) | 0 (0.0%) |
| Total (Overall) | 537 (52.5%) | 486 (47.5%) |
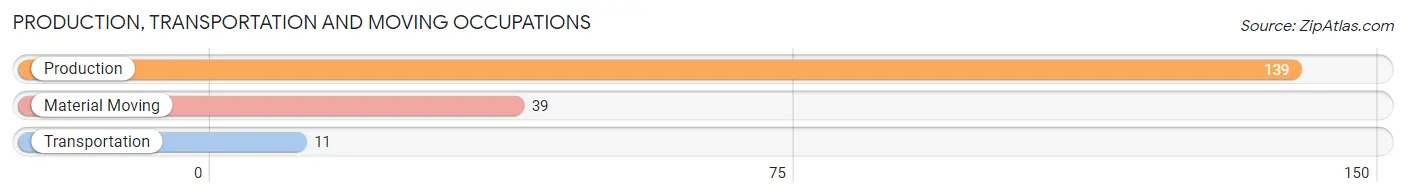
Production, Transportation and Moving Occupations
The most common Production, Transportation and Moving occupations in Williamson are Production (139 | 13.6%), Material Moving (39 | 3.8%), and Transportation (11 | 1.1%).
Production, Transportation and Moving Occupations by Sex
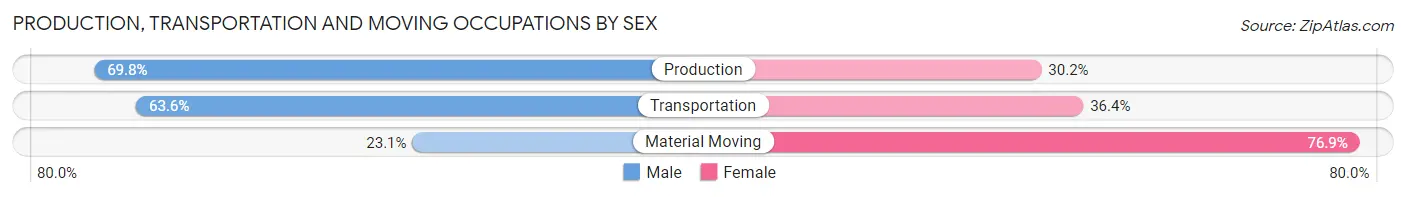
| Occupation | Male | Female |
| Production | 97 (69.8%) | 42 (30.2%) |
| Transportation | 7 (63.6%) | 4 (36.4%) |
| Material Moving | 9 (23.1%) | 30 (76.9%) |
| Total (Category) | 113 (59.8%) | 76 (40.2%) |
| Total (Overall) | 537 (52.5%) | 486 (47.5%) |
Employment Industries by Sex in Williamson
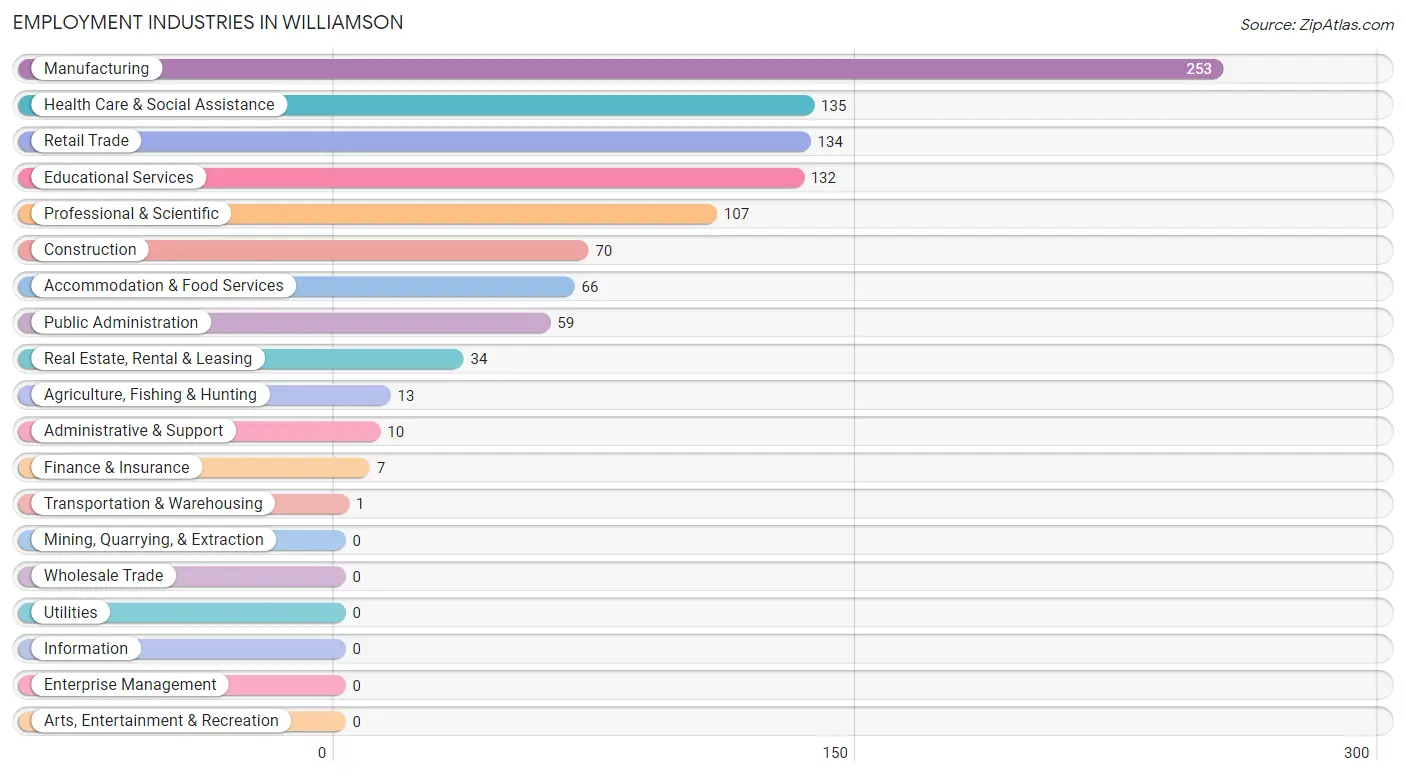
Employment Industries in Williamson
The major employment industries in Williamson include Manufacturing (253 | 24.7%), Health Care & Social Assistance (135 | 13.2%), Retail Trade (134 | 13.1%), Educational Services (132 | 12.9%), and Professional & Scientific (107 | 10.5%).
Employment Industries by Sex in Williamson
The Williamson industries that see more men than women are Agriculture, Fishing & Hunting (100.0%), Construction (100.0%), and Transportation & Warehousing (100.0%), whereas the industries that tend to have a higher number of women are Finance & Insurance (100.0%), Administrative & Support (100.0%), and Real Estate, Rental & Leasing (91.2%).
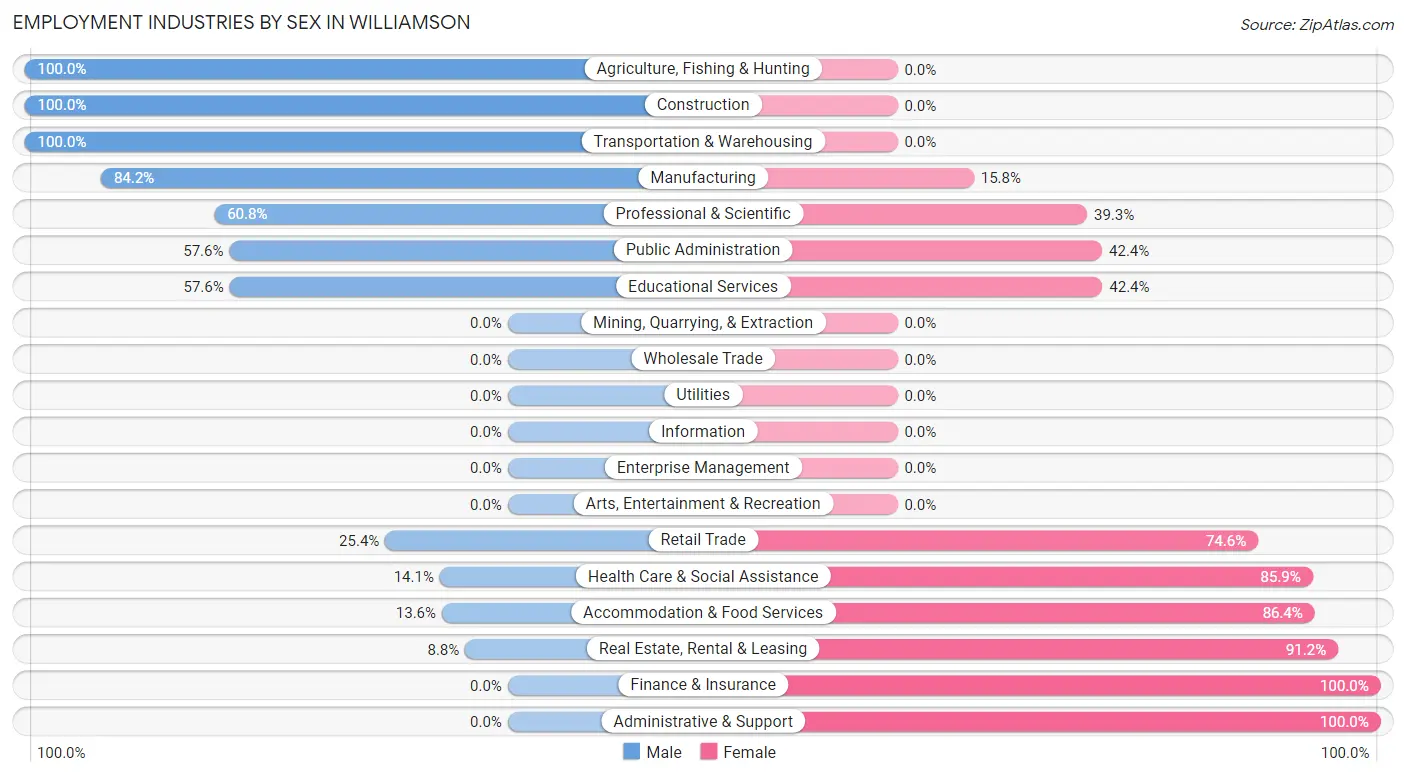
| Industry | Male | Female |
| Agriculture, Fishing & Hunting | 13 (100.0%) | 0 (0.0%) |
| Mining, Quarrying, & Extraction | 0 (0.0%) | 0 (0.0%) |
| Construction | 70 (100.0%) | 0 (0.0%) |
| Manufacturing | 213 (84.2%) | 40 (15.8%) |
| Wholesale Trade | 0 (0.0%) | 0 (0.0%) |
| Retail Trade | 34 (25.4%) | 100 (74.6%) |
| Transportation & Warehousing | 1 (100.0%) | 0 (0.0%) |
| Utilities | 0 (0.0%) | 0 (0.0%) |
| Information | 0 (0.0%) | 0 (0.0%) |
| Finance & Insurance | 0 (0.0%) | 7 (100.0%) |
| Real Estate, Rental & Leasing | 3 (8.8%) | 31 (91.2%) |
| Professional & Scientific | 65 (60.8%) | 42 (39.3%) |
| Enterprise Management | 0 (0.0%) | 0 (0.0%) |
| Administrative & Support | 0 (0.0%) | 10 (100.0%) |
| Educational Services | 76 (57.6%) | 56 (42.4%) |
| Health Care & Social Assistance | 19 (14.1%) | 116 (85.9%) |
| Arts, Entertainment & Recreation | 0 (0.0%) | 0 (0.0%) |
| Accommodation & Food Services | 9 (13.6%) | 57 (86.4%) |
| Public Administration | 34 (57.6%) | 25 (42.4%) |
| Total | 537 (52.5%) | 486 (47.5%) |
Education in Williamson
School Enrollment in Williamson
The most common levels of schooling among the 551 students in Williamson are elementary school (183 | 33.2%), high school (138 | 25.1%), and middle school (111 | 20.2%).
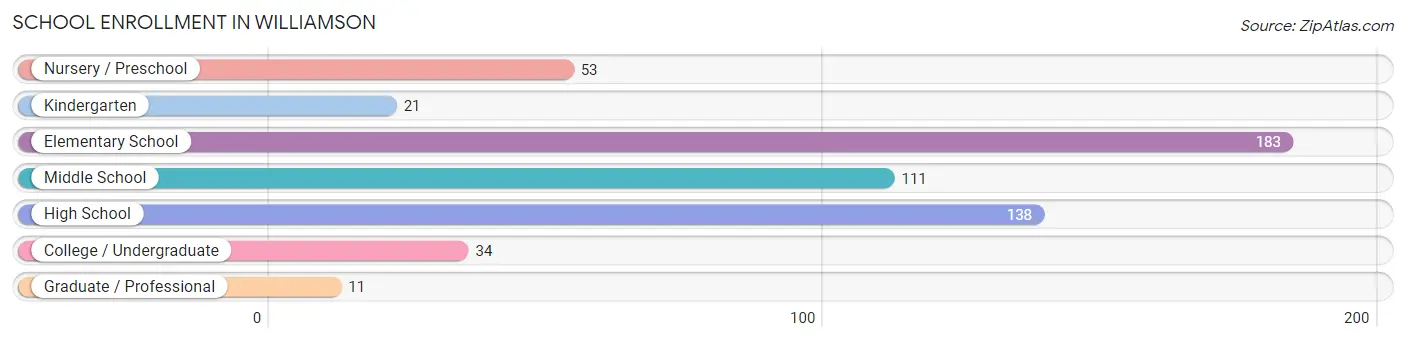
| School Level | # Students | % Students |
| Nursery / Preschool | 53 | 9.6% |
| Kindergarten | 21 | 3.8% |
| Elementary School | 183 | 33.2% |
| Middle School | 111 | 20.2% |
| High School | 138 | 25.1% |
| College / Undergraduate | 34 | 6.2% |
| Graduate / Professional | 11 | 2.0% |
| Total | 551 | 100.0% |
School Enrollment by Age by Funding Source in Williamson
Out of a total of 551 students who are enrolled in schools in Williamson, 31 (5.6%) attend a private institution, while the remaining 520 (94.4%) are enrolled in public schools. The age group of 25 to 34 year olds has the highest likelihood of being enrolled in private schools, with 12 (100.0% in the age bracket) enrolled. Conversely, the age group of 3 to 4 year olds has the lowest likelihood of being enrolled in a private school, with 53 (100.0% in the age bracket) attending a public institution.
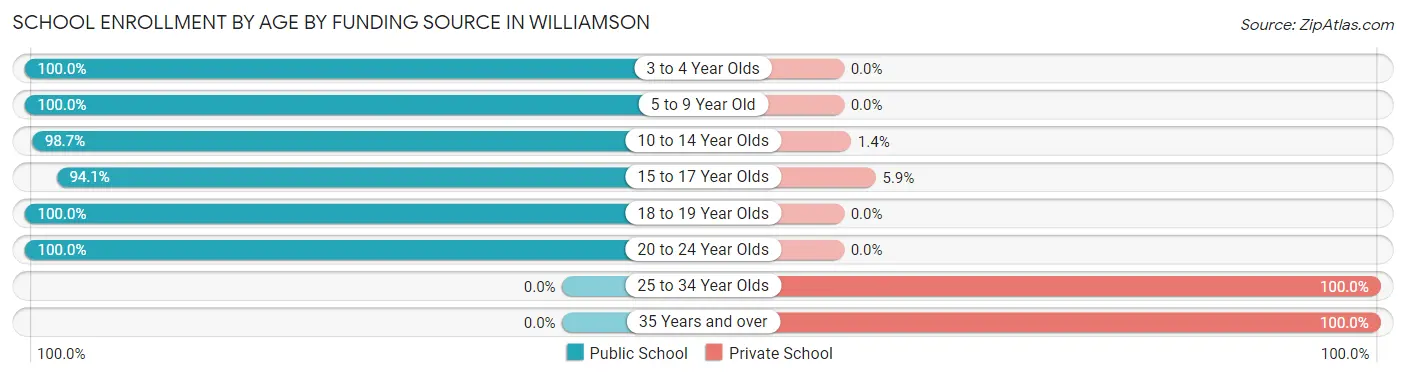
| Age Bracket | Public School | Private School |
| 3 to 4 Year Olds | 53 (100.0%) | 0 (0.0%) |
| 5 to 9 Year Old | 204 (100.0%) | 0 (0.0%) |
| 10 to 14 Year Olds | 146 (98.7%) | 2 (1.3%) |
| 15 to 17 Year Olds | 95 (94.1%) | 6 (5.9%) |
| 18 to 19 Year Olds | 9 (100.0%) | 0 (0.0%) |
| 20 to 24 Year Olds | 13 (100.0%) | 0 (0.0%) |
| 25 to 34 Year Olds | 0 (0.0%) | 12 (100.0%) |
| 35 Years and over | 0 (0.0%) | 11 (100.0%) |
| Total | 520 (94.4%) | 31 (5.6%) |
Educational Attainment by Field of Study in Williamson
Education (78 | 25.4%), science & technology (59 | 19.2%), business (35 | 11.4%), bio, nature & agricultural (29 | 9.5%), and psychology (22 | 7.2%) are the most common fields of study among 307 individuals in Williamson who have obtained a bachelor's degree or higher.
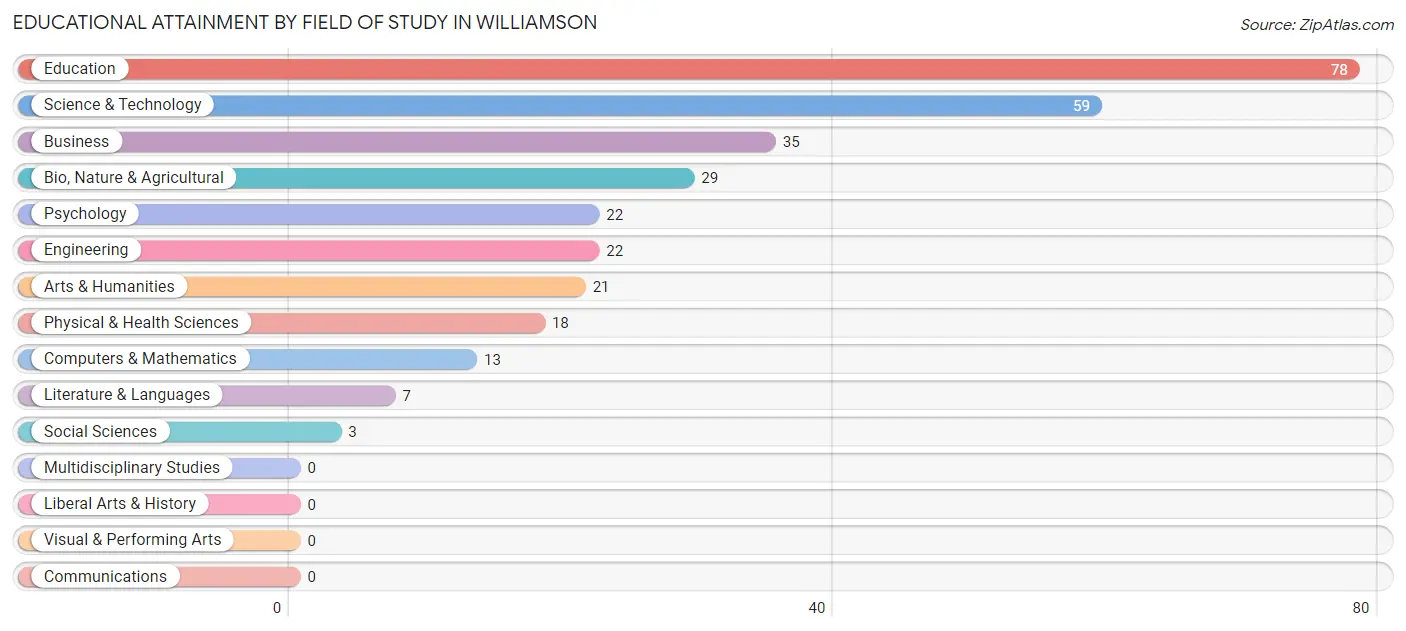
| Field of Study | # Graduates | % Graduates |
| Computers & Mathematics | 13 | 4.2% |
| Bio, Nature & Agricultural | 29 | 9.5% |
| Physical & Health Sciences | 18 | 5.9% |
| Psychology | 22 | 7.2% |
| Social Sciences | 3 | 1.0% |
| Engineering | 22 | 7.2% |
| Multidisciplinary Studies | 0 | 0.0% |
| Science & Technology | 59 | 19.2% |
| Business | 35 | 11.4% |
| Education | 78 | 25.4% |
| Literature & Languages | 7 | 2.3% |
| Liberal Arts & History | 0 | 0.0% |
| Visual & Performing Arts | 0 | 0.0% |
| Communications | 0 | 0.0% |
| Arts & Humanities | 21 | 6.8% |
| Total | 307 | 100.0% |
Transportation & Commute in Williamson
Vehicle Availability by Sex in Williamson
The most prevalent vehicle ownership categories in Williamson are males with 2 vehicles (206, accounting for 38.4%) and females with 2 vehicles (133, making up 43.5%).
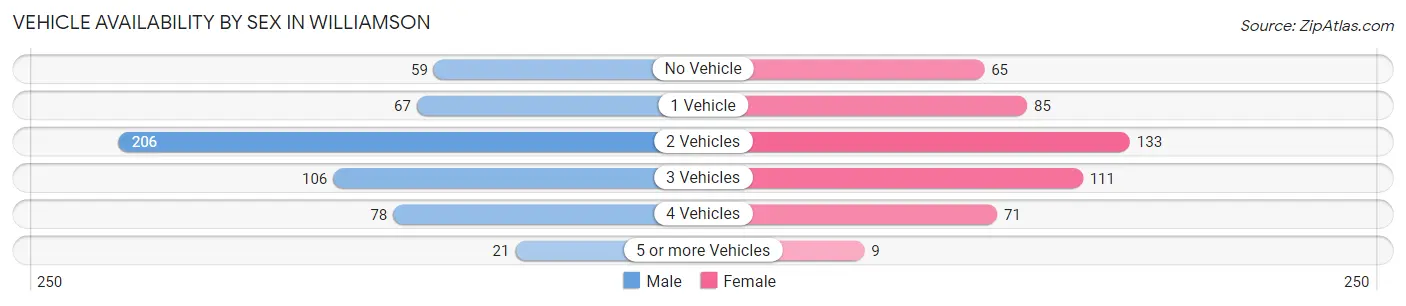
| Vehicles Available | Male | Female |
| No Vehicle | 59 (11.0%) | 65 (13.7%) |
| 1 Vehicle | 67 (12.5%) | 85 (17.9%) |
| 2 Vehicles | 206 (38.4%) | 133 (28.1%) |
| 3 Vehicles | 106 (19.7%) | 111 (23.4%) |
| 4 Vehicles | 78 (14.5%) | 71 (15.0%) |
| 5 or more Vehicles | 21 (3.9%) | 9 (1.9%) |
| Total | 537 (100.0%) | 474 (100.0%) |
Commute Time in Williamson
The most frequently occuring commute durations in Williamson are 30 to 34 minutes (180 commuters, 18.9%), 5 to 9 minutes (155 commuters, 16.2%), and 45 to 59 minutes (135 commuters, 14.1%).
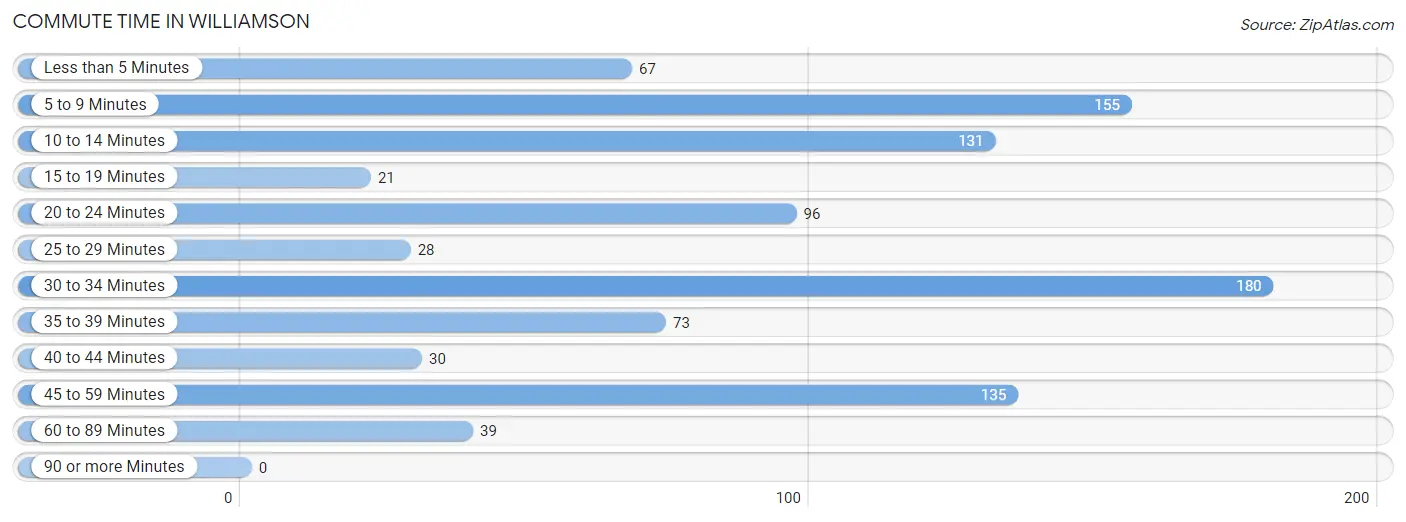
| Commute Time | # Commuters | % Commuters |
| Less than 5 Minutes | 67 | 7.0% |
| 5 to 9 Minutes | 155 | 16.2% |
| 10 to 14 Minutes | 131 | 13.7% |
| 15 to 19 Minutes | 21 | 2.2% |
| 20 to 24 Minutes | 96 | 10.1% |
| 25 to 29 Minutes | 28 | 2.9% |
| 30 to 34 Minutes | 180 | 18.9% |
| 35 to 39 Minutes | 73 | 7.6% |
| 40 to 44 Minutes | 30 | 3.1% |
| 45 to 59 Minutes | 135 | 14.1% |
| 60 to 89 Minutes | 39 | 4.1% |
| 90 or more Minutes | 0 | 0.0% |
Commute Time by Sex in Williamson
The most common commute times in Williamson are 30 to 34 minutes (122 commuters, 23.4%) for males and 5 to 9 minutes (135 commuters, 31.1%) for females.
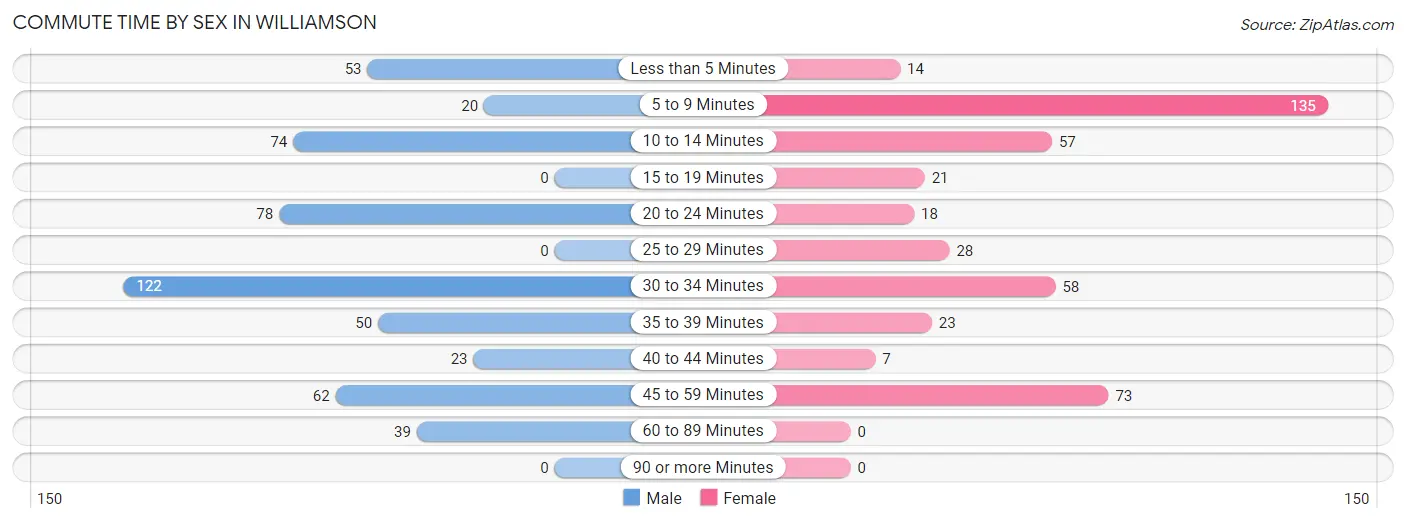
| Commute Time | Male | Female |
| Less than 5 Minutes | 53 (10.2%) | 14 (3.2%) |
| 5 to 9 Minutes | 20 (3.8%) | 135 (31.1%) |
| 10 to 14 Minutes | 74 (14.2%) | 57 (13.1%) |
| 15 to 19 Minutes | 0 (0.0%) | 21 (4.8%) |
| 20 to 24 Minutes | 78 (15.0%) | 18 (4.2%) |
| 25 to 29 Minutes | 0 (0.0%) | 28 (6.5%) |
| 30 to 34 Minutes | 122 (23.4%) | 58 (13.4%) |
| 35 to 39 Minutes | 50 (9.6%) | 23 (5.3%) |
| 40 to 44 Minutes | 23 (4.4%) | 7 (1.6%) |
| 45 to 59 Minutes | 62 (11.9%) | 73 (16.8%) |
| 60 to 89 Minutes | 39 (7.5%) | 0 (0.0%) |
| 90 or more Minutes | 0 (0.0%) | 0 (0.0%) |
Time of Departure to Work by Sex in Williamson
The most frequent times of departure to work in Williamson are 6:30 AM to 6:59 AM (156, 29.9%) for males and 7:30 AM to 7:59 AM (133, 30.6%) for females.
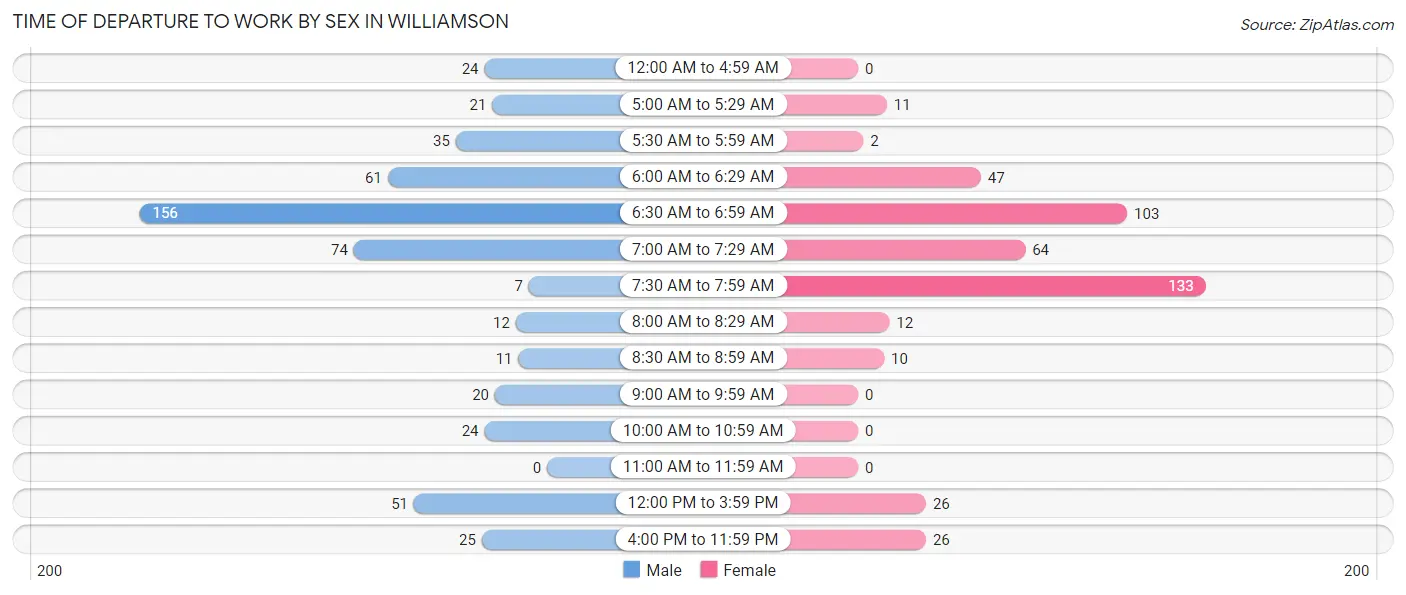
| Time of Departure | Male | Female |
| 12:00 AM to 4:59 AM | 24 (4.6%) | 0 (0.0%) |
| 5:00 AM to 5:29 AM | 21 (4.0%) | 11 (2.5%) |
| 5:30 AM to 5:59 AM | 35 (6.7%) | 2 (0.5%) |
| 6:00 AM to 6:29 AM | 61 (11.7%) | 47 (10.8%) |
| 6:30 AM to 6:59 AM | 156 (29.9%) | 103 (23.7%) |
| 7:00 AM to 7:29 AM | 74 (14.2%) | 64 (14.7%) |
| 7:30 AM to 7:59 AM | 7 (1.3%) | 133 (30.6%) |
| 8:00 AM to 8:29 AM | 12 (2.3%) | 12 (2.8%) |
| 8:30 AM to 8:59 AM | 11 (2.1%) | 10 (2.3%) |
| 9:00 AM to 9:59 AM | 20 (3.8%) | 0 (0.0%) |
| 10:00 AM to 10:59 AM | 24 (4.6%) | 0 (0.0%) |
| 11:00 AM to 11:59 AM | 0 (0.0%) | 0 (0.0%) |
| 12:00 PM to 3:59 PM | 51 (9.8%) | 26 (6.0%) |
| 4:00 PM to 11:59 PM | 25 (4.8%) | 26 (6.0%) |
| Total | 521 (100.0%) | 434 (100.0%) |
Housing Occupancy in Williamson
Occupancy by Ownership in Williamson
Of the total 1,041 dwellings in Williamson, owner-occupied units account for 652 (62.6%), while renter-occupied units make up 389 (37.4%).
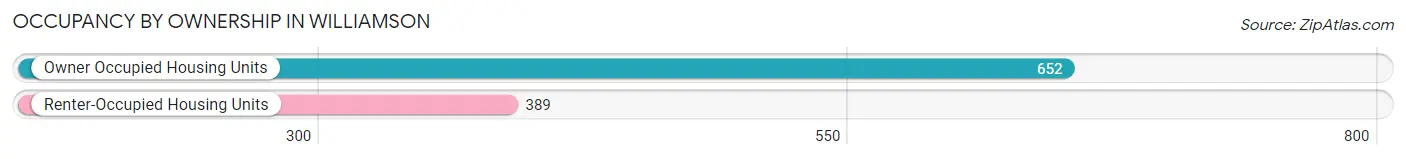
| Occupancy | # Housing Units | % Housing Units |
| Owner Occupied Housing Units | 652 | 62.6% |
| Renter-Occupied Housing Units | 389 | 37.4% |
| Total Occupied Housing Units | 1,041 | 100.0% |
Occupancy by Household Size in Williamson
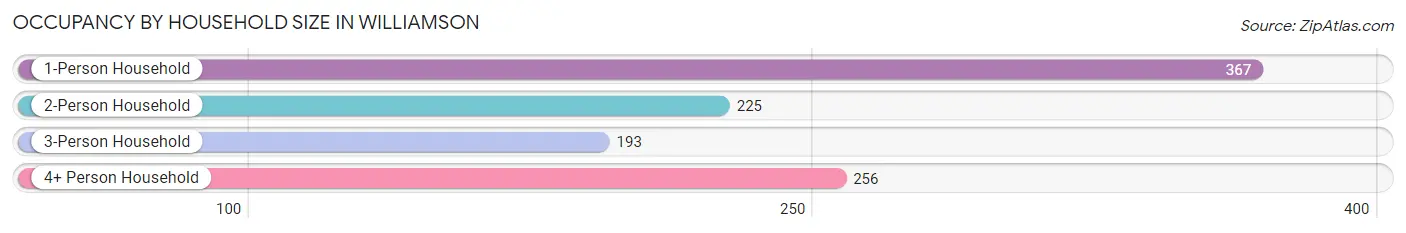
| Household Size | # Housing Units | % Housing Units |
| 1-Person Household | 367 | 35.2% |
| 2-Person Household | 225 | 21.6% |
| 3-Person Household | 193 | 18.5% |
| 4+ Person Household | 256 | 24.6% |
| Total Housing Units | 1,041 | 100.0% |
Occupancy by Ownership by Household Size in Williamson
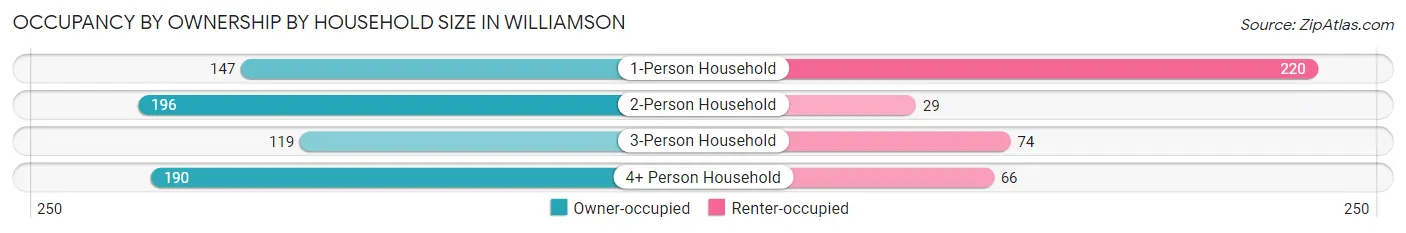
| Household Size | Owner-occupied | Renter-occupied |
| 1-Person Household | 147 (40.1%) | 220 (60.0%) |
| 2-Person Household | 196 (87.1%) | 29 (12.9%) |
| 3-Person Household | 119 (61.7%) | 74 (38.3%) |
| 4+ Person Household | 190 (74.2%) | 66 (25.8%) |
| Total Housing Units | 652 (62.6%) | 389 (37.4%) |
Occupancy by Educational Attainment in Williamson
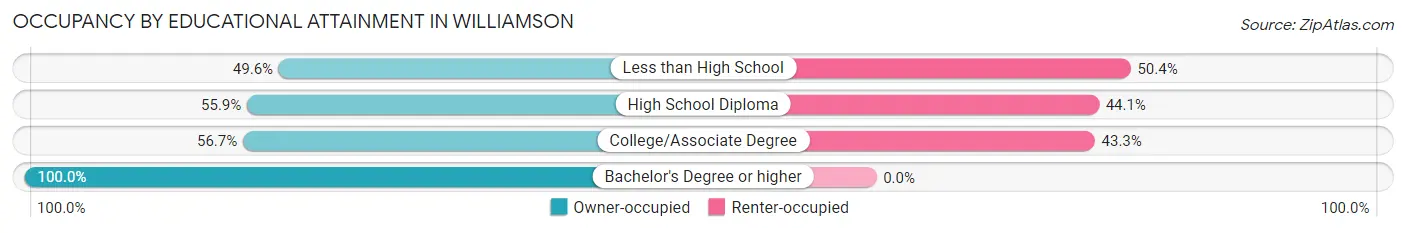
| Household Size | Owner-occupied | Renter-occupied |
| Less than High School | 59 (49.6%) | 60 (50.4%) |
| High School Diploma | 228 (55.9%) | 180 (44.1%) |
| College/Associate Degree | 195 (56.7%) | 149 (43.3%) |
| Bachelor's Degree or higher | 170 (100.0%) | 0 (0.0%) |
Occupancy by Age of Householder in Williamson
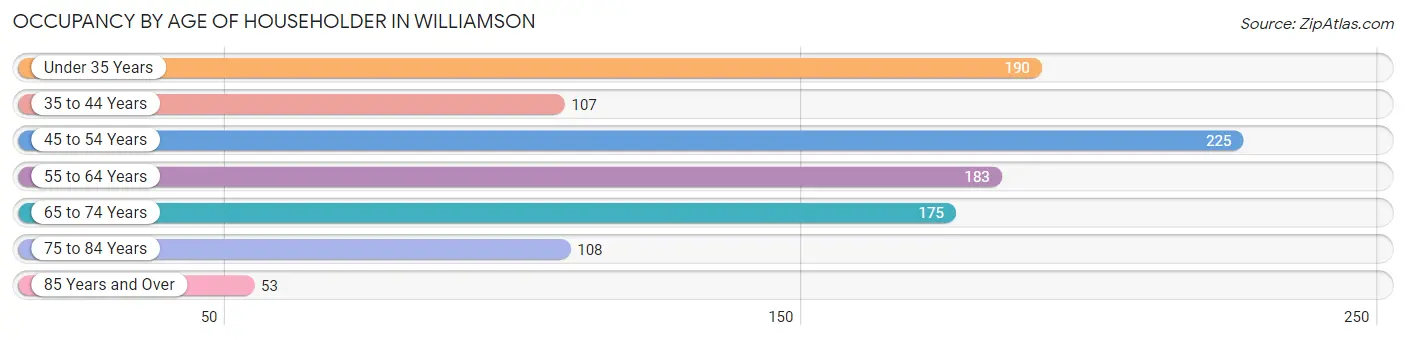
| Age Bracket | # Households | % Households |
| Under 35 Years | 190 | 18.2% |
| 35 to 44 Years | 107 | 10.3% |
| 45 to 54 Years | 225 | 21.6% |
| 55 to 64 Years | 183 | 17.6% |
| 65 to 74 Years | 175 | 16.8% |
| 75 to 84 Years | 108 | 10.4% |
| 85 Years and Over | 53 | 5.1% |
| Total | 1,041 | 100.0% |
Housing Finances in Williamson
Median Income by Occupancy in Williamson
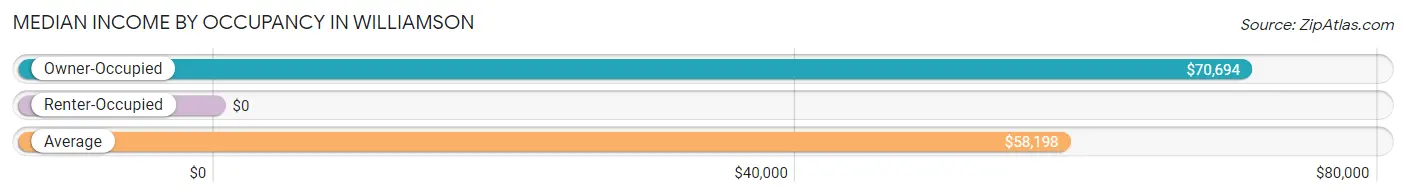
| Occupancy Type | # Households | Median Income |
| Owner-Occupied | 652 (62.6%) | $70,694 |
| Renter-Occupied | 389 (37.4%) | $0 |
| Average | 1,041 (100.0%) | $58,198 |
Occupancy by Householder Income Bracket in Williamson
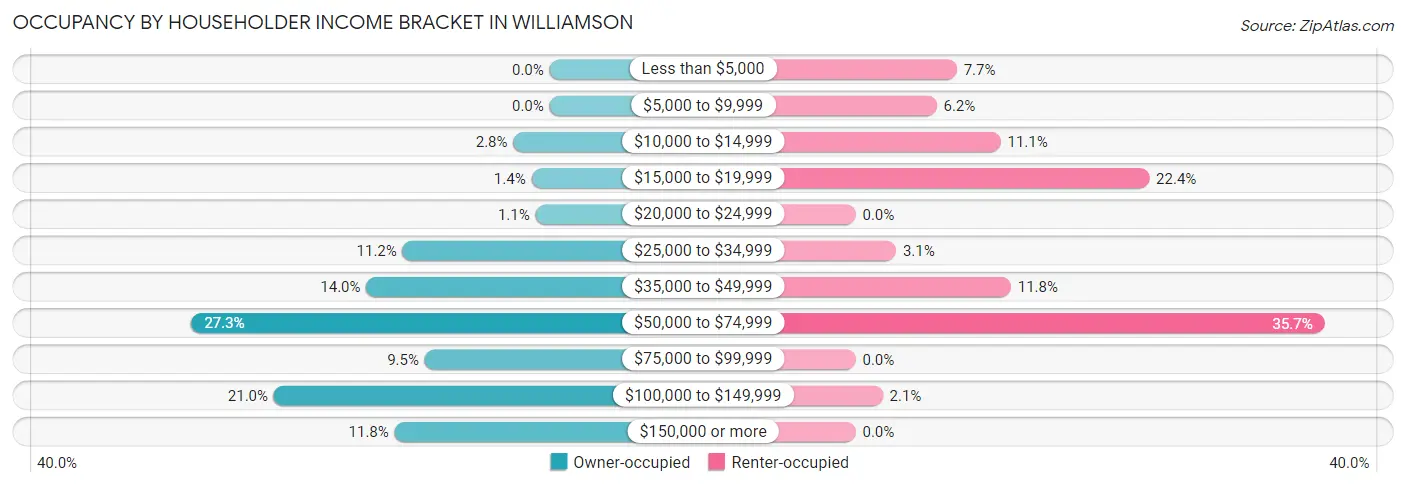
| Income Bracket | Owner-occupied | Renter-occupied |
| Less than $5,000 | 0 (0.0%) | 30 (7.7%) |
| $5,000 to $9,999 | 0 (0.0%) | 24 (6.2%) |
| $10,000 to $14,999 | 18 (2.8%) | 43 (11.1%) |
| $15,000 to $19,999 | 9 (1.4%) | 87 (22.4%) |
| $20,000 to $24,999 | 7 (1.1%) | 0 (0.0%) |
| $25,000 to $34,999 | 73 (11.2%) | 12 (3.1%) |
| $35,000 to $49,999 | 91 (14.0%) | 46 (11.8%) |
| $50,000 to $74,999 | 178 (27.3%) | 139 (35.7%) |
| $75,000 to $99,999 | 62 (9.5%) | 0 (0.0%) |
| $100,000 to $149,999 | 137 (21.0%) | 8 (2.1%) |
| $150,000 or more | 77 (11.8%) | 0 (0.0%) |
| Total | 652 (100.0%) | 389 (100.0%) |
Monthly Housing Cost Tiers in Williamson
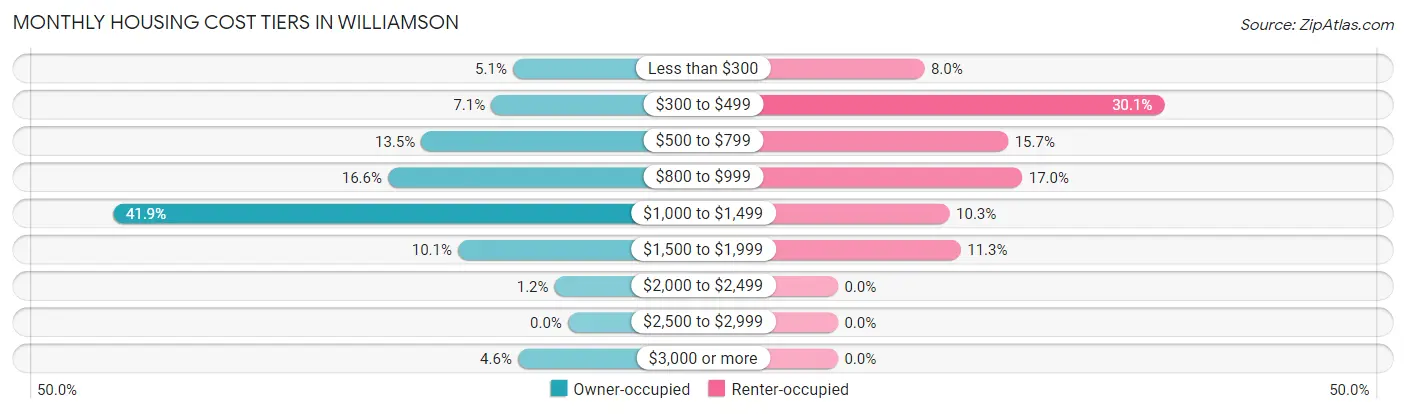
| Monthly Cost | Owner-occupied | Renter-occupied |
| Less than $300 | 33 (5.1%) | 31 (8.0%) |
| $300 to $499 | 46 (7.1%) | 117 (30.1%) |
| $500 to $799 | 88 (13.5%) | 61 (15.7%) |
| $800 to $999 | 108 (16.6%) | 66 (17.0%) |
| $1,000 to $1,499 | 273 (41.9%) | 40 (10.3%) |
| $1,500 to $1,999 | 66 (10.1%) | 44 (11.3%) |
| $2,000 to $2,499 | 8 (1.2%) | 0 (0.0%) |
| $2,500 to $2,999 | 0 (0.0%) | 0 (0.0%) |
| $3,000 or more | 30 (4.6%) | 0 (0.0%) |
| Total | 652 (100.0%) | 389 (100.0%) |
Physical Housing Characteristics in Williamson
Housing Structures in Williamson
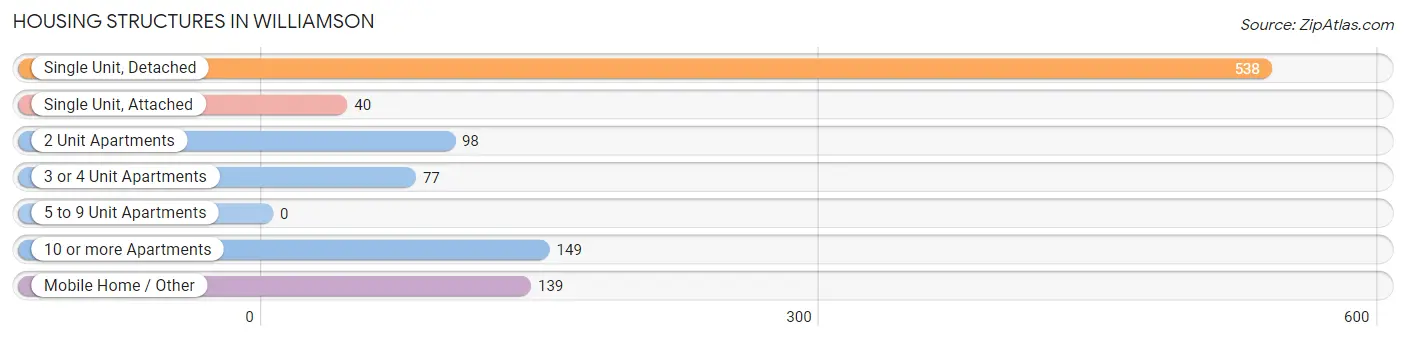
| Structure Type | # Housing Units | % Housing Units |
| Single Unit, Detached | 538 | 51.7% |
| Single Unit, Attached | 40 | 3.8% |
| 2 Unit Apartments | 98 | 9.4% |
| 3 or 4 Unit Apartments | 77 | 7.4% |
| 5 to 9 Unit Apartments | 0 | 0.0% |
| 10 or more Apartments | 149 | 14.3% |
| Mobile Home / Other | 139 | 13.4% |
| Total | 1,041 | 100.0% |
Housing Structures by Occupancy in Williamson
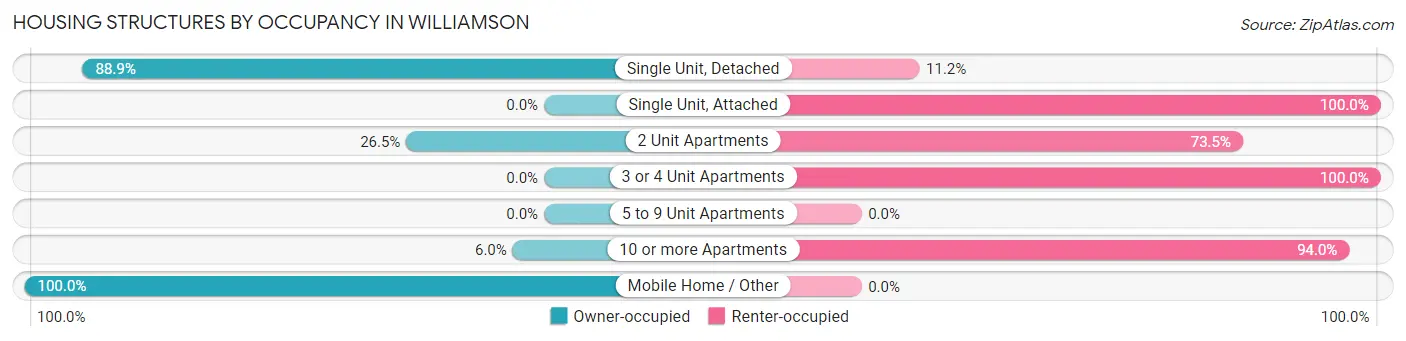
| Structure Type | Owner-occupied | Renter-occupied |
| Single Unit, Detached | 478 (88.8%) | 60 (11.2%) |
| Single Unit, Attached | 0 (0.0%) | 40 (100.0%) |
| 2 Unit Apartments | 26 (26.5%) | 72 (73.5%) |
| 3 or 4 Unit Apartments | 0 (0.0%) | 77 (100.0%) |
| 5 to 9 Unit Apartments | 0 (0.0%) | 0 (0.0%) |
| 10 or more Apartments | 9 (6.0%) | 140 (94.0%) |
| Mobile Home / Other | 139 (100.0%) | 0 (0.0%) |
| Total | 652 (62.6%) | 389 (37.4%) |
Housing Structures by Number of Rooms in Williamson
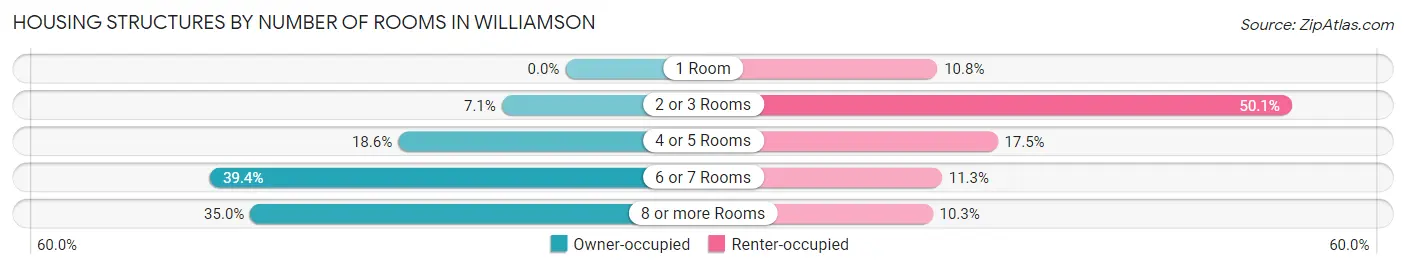
| Number of Rooms | Owner-occupied | Renter-occupied |
| 1 Room | 0 (0.0%) | 42 (10.8%) |
| 2 or 3 Rooms | 46 (7.1%) | 195 (50.1%) |
| 4 or 5 Rooms | 121 (18.6%) | 68 (17.5%) |
| 6 or 7 Rooms | 257 (39.4%) | 44 (11.3%) |
| 8 or more Rooms | 228 (35.0%) | 40 (10.3%) |
| Total | 652 (100.0%) | 389 (100.0%) |
Housing Structure by Heating Type in Williamson
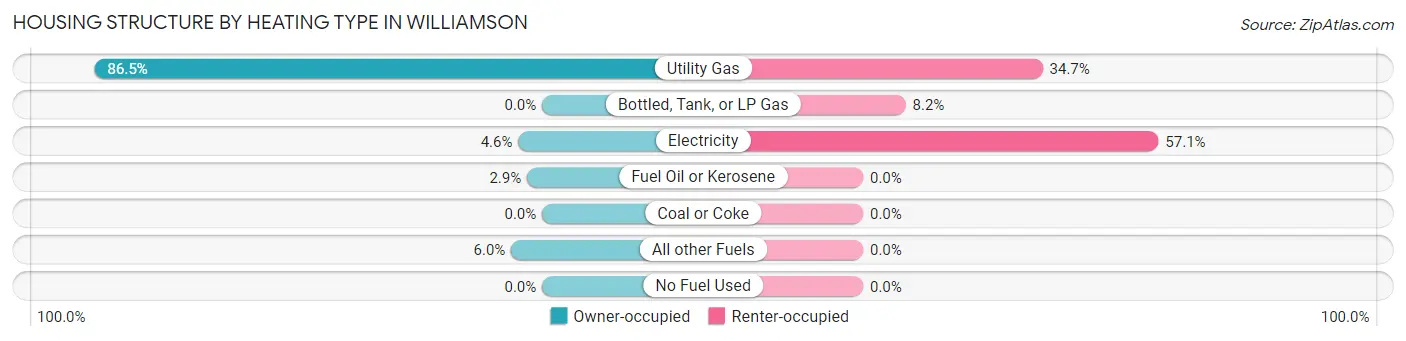
| Heating Type | Owner-occupied | Renter-occupied |
| Utility Gas | 564 (86.5%) | 135 (34.7%) |
| Bottled, Tank, or LP Gas | 0 (0.0%) | 32 (8.2%) |
| Electricity | 30 (4.6%) | 222 (57.1%) |
| Fuel Oil or Kerosene | 19 (2.9%) | 0 (0.0%) |
| Coal or Coke | 0 (0.0%) | 0 (0.0%) |
| All other Fuels | 39 (6.0%) | 0 (0.0%) |
| No Fuel Used | 0 (0.0%) | 0 (0.0%) |
| Total | 652 (100.0%) | 389 (100.0%) |
Household Vehicle Usage in Williamson
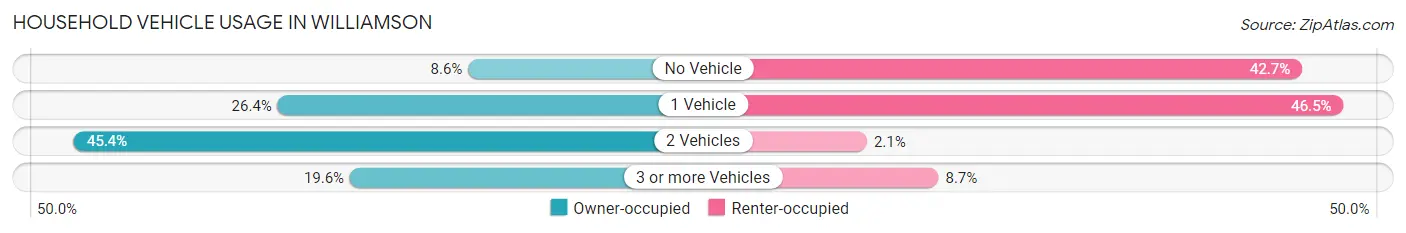
| Vehicles per Household | Owner-occupied | Renter-occupied |
| No Vehicle | 56 (8.6%) | 166 (42.7%) |
| 1 Vehicle | 172 (26.4%) | 181 (46.5%) |
| 2 Vehicles | 296 (45.4%) | 8 (2.1%) |
| 3 or more Vehicles | 128 (19.6%) | 34 (8.7%) |
| Total | 652 (100.0%) | 389 (100.0%) |
Real Estate & Mortgages in Williamson
Real Estate and Mortgage Overview in Williamson
| Characteristic | Without Mortgage | With Mortgage |
| Housing Units | 255 | 397 |
| Median Property Value | $68,400 | $139,700 |
| Median Household Income | $58,854 | $59 |
| Monthly Housing Costs | $709 | $30 |
| Real Estate Taxes | - | - |
Property Value by Mortgage Status in Williamson
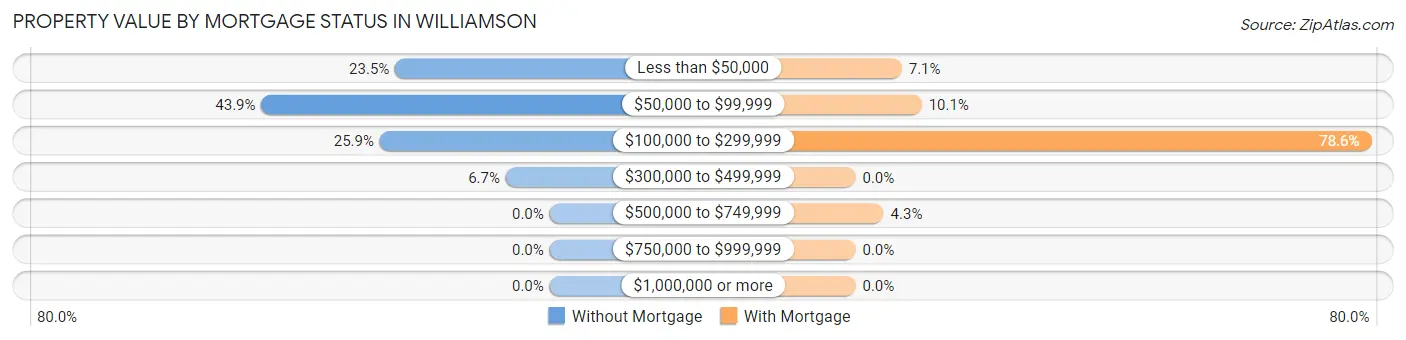
| Property Value | Without Mortgage | With Mortgage |
| Less than $50,000 | 60 (23.5%) | 28 (7.0%) |
| $50,000 to $99,999 | 112 (43.9%) | 40 (10.1%) |
| $100,000 to $299,999 | 66 (25.9%) | 312 (78.6%) |
| $300,000 to $499,999 | 17 (6.7%) | 0 (0.0%) |
| $500,000 to $749,999 | 0 (0.0%) | 17 (4.3%) |
| $750,000 to $999,999 | 0 (0.0%) | 0 (0.0%) |
| $1,000,000 or more | 0 (0.0%) | 0 (0.0%) |
| Total | 255 (100.0%) | 397 (100.0%) |
Household Income by Mortgage Status in Williamson
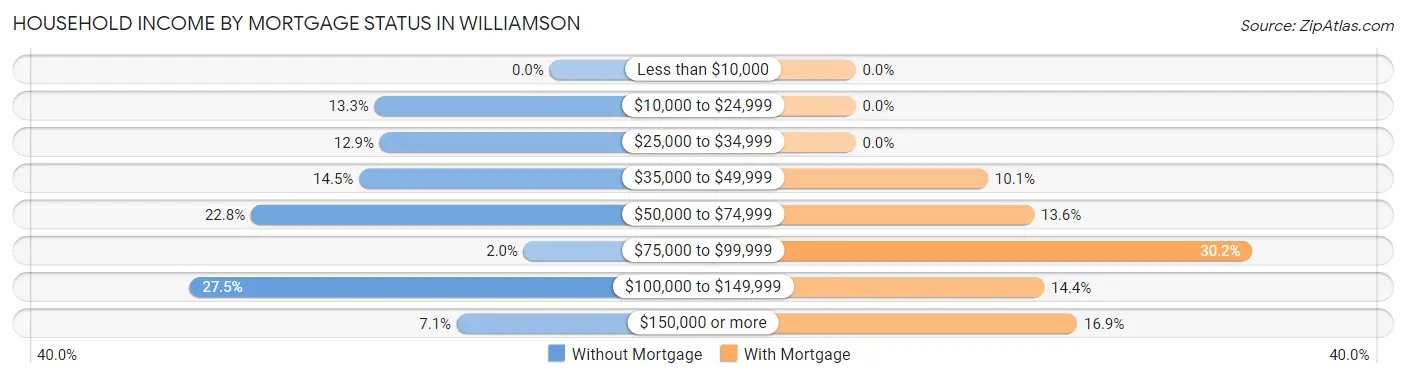
| Household Income | Without Mortgage | With Mortgage |
| Less than $10,000 | 0 (0.0%) | 0 (0.0%) |
| $10,000 to $24,999 | 34 (13.3%) | 0 (0.0%) |
| $25,000 to $34,999 | 33 (12.9%) | 0 (0.0%) |
| $35,000 to $49,999 | 37 (14.5%) | 40 (10.1%) |
| $50,000 to $74,999 | 58 (22.8%) | 54 (13.6%) |
| $75,000 to $99,999 | 5 (2.0%) | 120 (30.2%) |
| $100,000 to $149,999 | 70 (27.5%) | 57 (14.4%) |
| $150,000 or more | 18 (7.1%) | 67 (16.9%) |
| Total | 255 (100.0%) | 397 (100.0%) |
Property Value to Household Income Ratio in Williamson
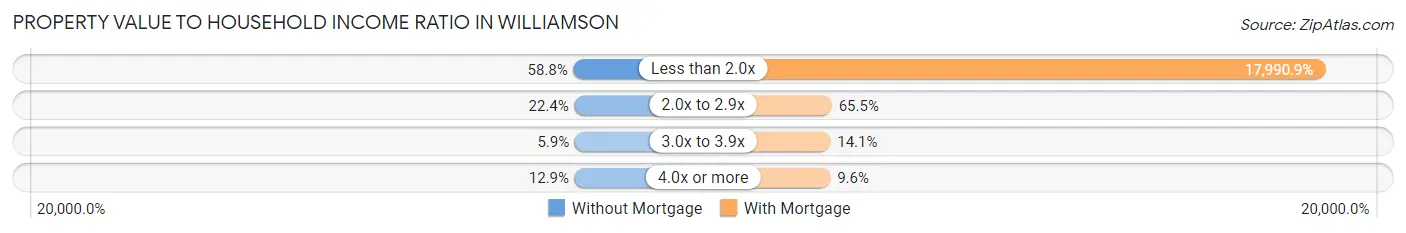
| Value-to-Income Ratio | Without Mortgage | With Mortgage |
| Less than 2.0x | 150 (58.8%) | 71,424 (17,990.9%) |
| 2.0x to 2.9x | 57 (22.4%) | 260 (65.5%) |
| 3.0x to 3.9x | 15 (5.9%) | 56 (14.1%) |
| 4.0x or more | 33 (12.9%) | 38 (9.6%) |
| Total | 255 (100.0%) | 397 (100.0%) |
Real Estate Taxes by Mortgage Status in Williamson
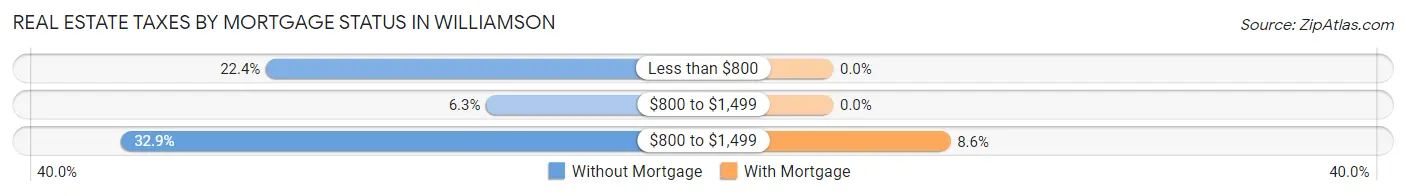
| Property Taxes | Without Mortgage | With Mortgage |
| Less than $800 | 57 (22.4%) | 0 (0.0%) |
| $800 to $1,499 | 16 (6.3%) | 0 (0.0%) |
| $800 to $1,499 | 84 (32.9%) | 34 (8.6%) |
| Total | 255 (100.0%) | 397 (100.0%) |
Health & Disability in Williamson
Health Insurance Coverage by Age in Williamson
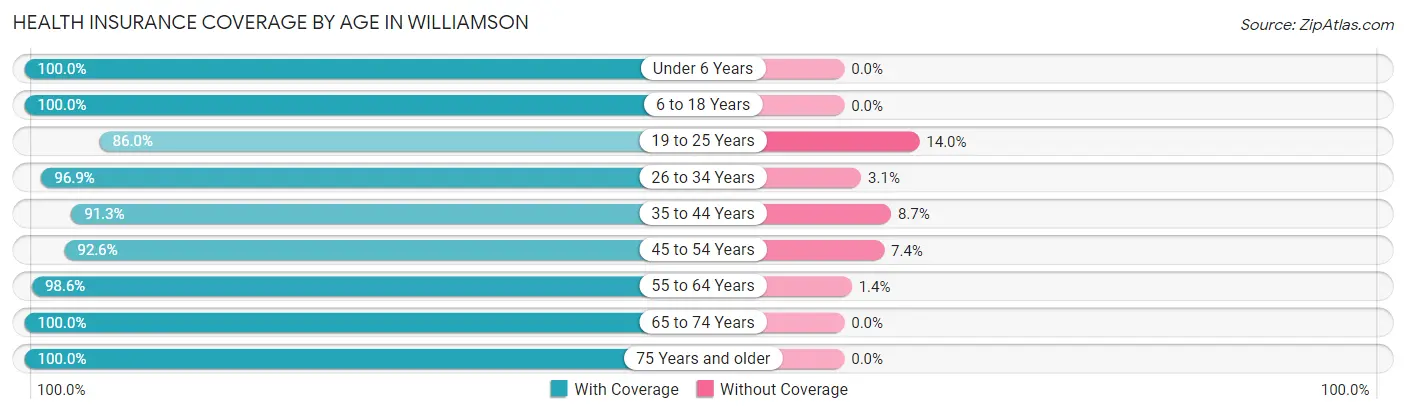
| Age Bracket | With Coverage | Without Coverage |
| Under 6 Years | 190 (100.0%) | 0 (0.0%) |
| 6 to 18 Years | 424 (100.0%) | 0 (0.0%) |
| 19 to 25 Years | 215 (86.0%) | 35 (14.0%) |
| 26 to 34 Years | 308 (96.9%) | 10 (3.1%) |
| 35 to 44 Years | 220 (91.3%) | 21 (8.7%) |
| 45 to 54 Years | 312 (92.6%) | 25 (7.4%) |
| 55 to 64 Years | 286 (98.6%) | 4 (1.4%) |
| 65 to 74 Years | 269 (100.0%) | 0 (0.0%) |
| 75 Years and older | 232 (100.0%) | 0 (0.0%) |
| Total | 2,456 (96.3%) | 95 (3.7%) |
Health Insurance Coverage by Citizenship Status in Williamson
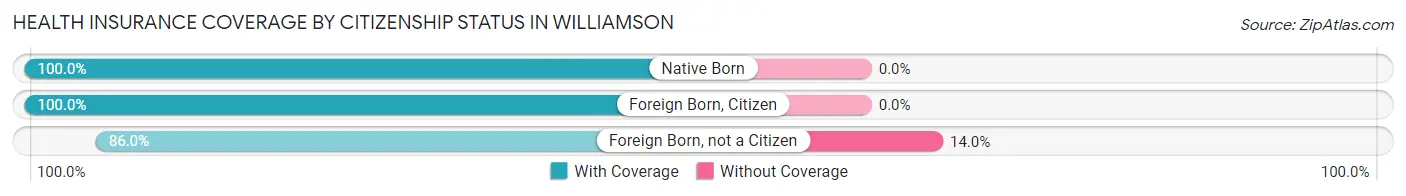
| Citizenship Status | With Coverage | Without Coverage |
| Native Born | 190 (100.0%) | 0 (0.0%) |
| Foreign Born, Citizen | 424 (100.0%) | 0 (0.0%) |
| Foreign Born, not a Citizen | 215 (86.0%) | 35 (14.0%) |
Health Insurance Coverage by Household Income in Williamson
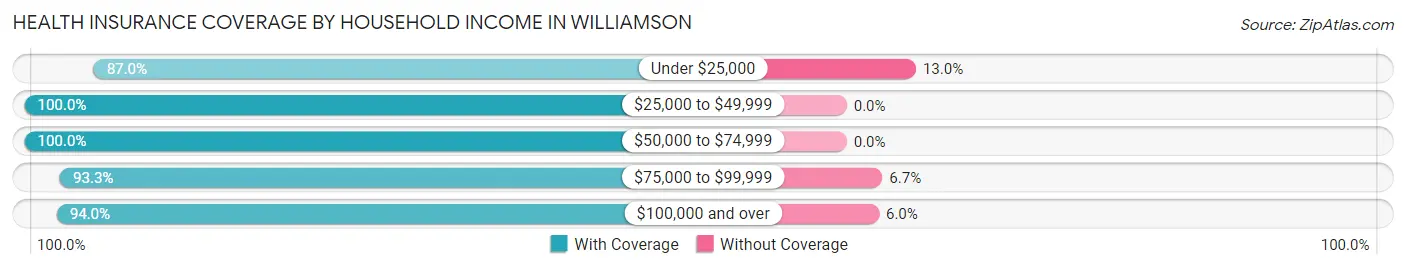
| Household Income | With Coverage | Without Coverage |
| Under $25,000 | 235 (87.0%) | 35 (13.0%) |
| $25,000 to $49,999 | 427 (100.0%) | 0 (0.0%) |
| $50,000 to $74,999 | 835 (100.0%) | 0 (0.0%) |
| $75,000 to $99,999 | 140 (93.3%) | 10 (6.7%) |
| $100,000 and over | 778 (94.0%) | 50 (6.0%) |
Public vs Private Health Insurance Coverage by Age in Williamson
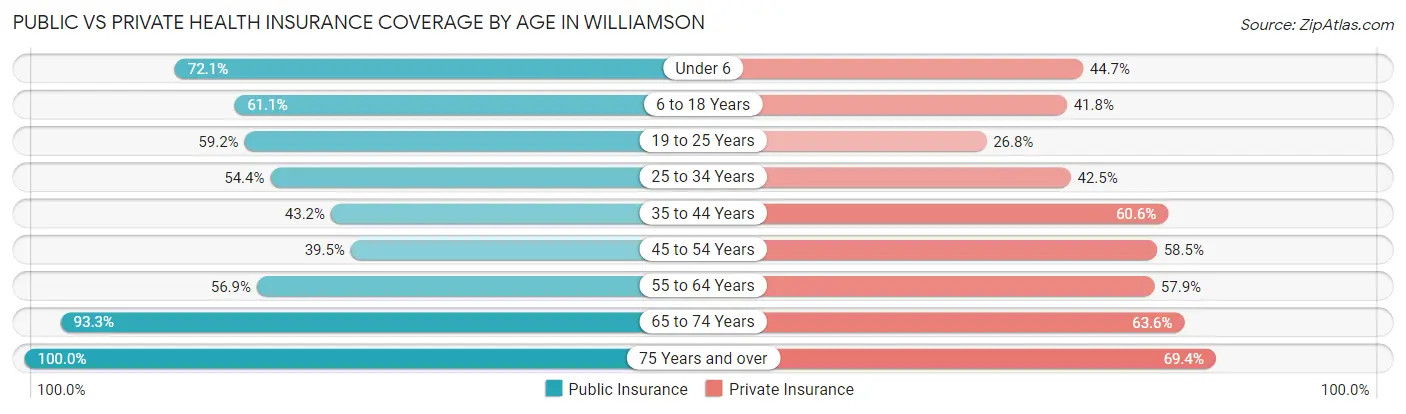
| Age Bracket | Public Insurance | Private Insurance |
| Under 6 | 137 (72.1%) | 85 (44.7%) |
| 6 to 18 Years | 259 (61.1%) | 177 (41.7%) |
| 19 to 25 Years | 148 (59.2%) | 67 (26.8%) |
| 25 to 34 Years | 173 (54.4%) | 135 (42.4%) |
| 35 to 44 Years | 104 (43.1%) | 146 (60.6%) |
| 45 to 54 Years | 133 (39.5%) | 197 (58.5%) |
| 55 to 64 Years | 165 (56.9%) | 168 (57.9%) |
| 65 to 74 Years | 251 (93.3%) | 171 (63.6%) |
| 75 Years and over | 232 (100.0%) | 161 (69.4%) |
| Total | 1,602 (62.8%) | 1,307 (51.2%) |
Disability Status by Sex by Age in Williamson
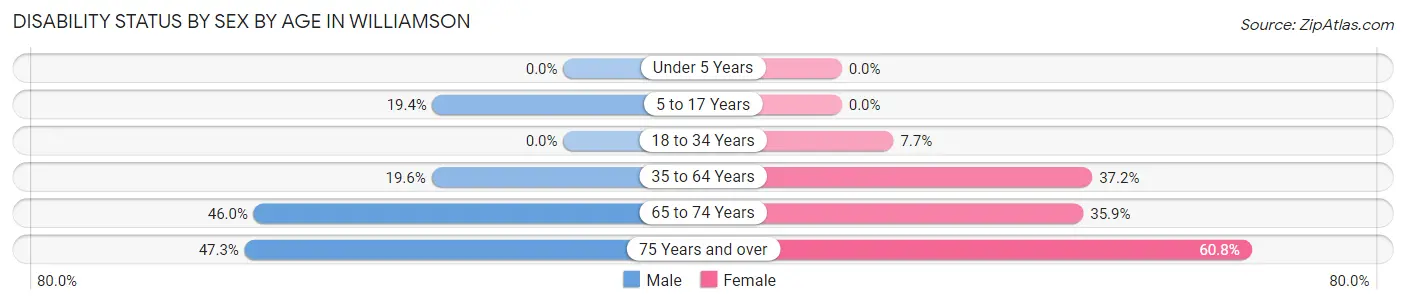
| Age Bracket | Male | Female |
| Under 5 Years | 0 (0.0%) | 0 (0.0%) |
| 5 to 17 Years | 45 (19.4%) | 0 (0.0%) |
| 18 to 34 Years | 0 (0.0%) | 22 (7.7%) |
| 35 to 64 Years | 82 (19.6%) | 167 (37.2%) |
| 65 to 74 Years | 57 (46.0%) | 52 (35.9%) |
| 75 Years and over | 53 (47.3%) | 73 (60.8%) |
Disability Class by Sex by Age in Williamson
Disability Class: Hearing Difficulty
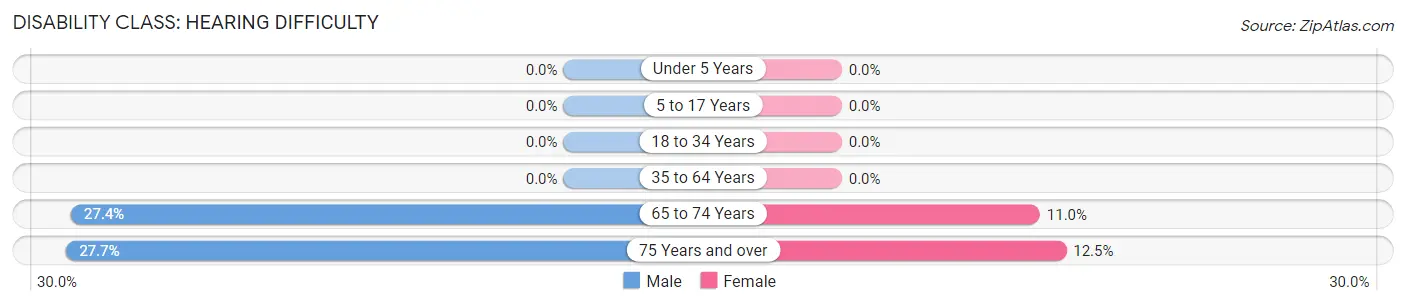
| Age Bracket | Male | Female |
| Under 5 Years | 0 (0.0%) | 0 (0.0%) |
| 5 to 17 Years | 0 (0.0%) | 0 (0.0%) |
| 18 to 34 Years | 0 (0.0%) | 0 (0.0%) |
| 35 to 64 Years | 0 (0.0%) | 0 (0.0%) |
| 65 to 74 Years | 34 (27.4%) | 16 (11.0%) |
| 75 Years and over | 31 (27.7%) | 15 (12.5%) |
Disability Class: Vision Difficulty
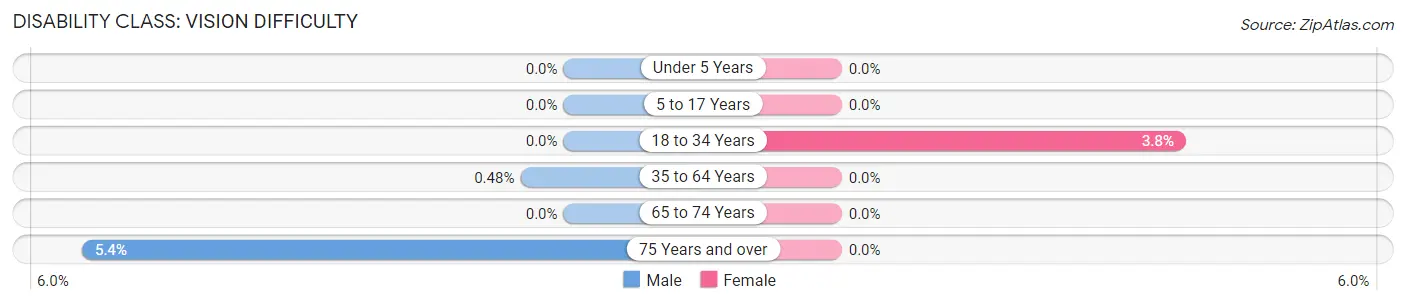
| Age Bracket | Male | Female |
| Under 5 Years | 0 (0.0%) | 0 (0.0%) |
| 5 to 17 Years | 0 (0.0%) | 0 (0.0%) |
| 18 to 34 Years | 0 (0.0%) | 11 (3.8%) |
| 35 to 64 Years | 2 (0.5%) | 0 (0.0%) |
| 65 to 74 Years | 0 (0.0%) | 0 (0.0%) |
| 75 Years and over | 6 (5.4%) | 0 (0.0%) |
Disability Class: Cognitive Difficulty
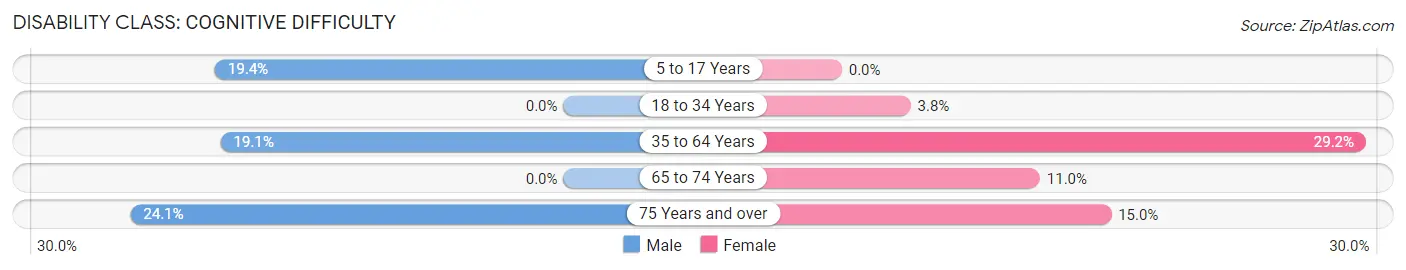
| Age Bracket | Male | Female |
| 5 to 17 Years | 45 (19.4%) | 0 (0.0%) |
| 18 to 34 Years | 0 (0.0%) | 11 (3.8%) |
| 35 to 64 Years | 80 (19.1%) | 131 (29.2%) |
| 65 to 74 Years | 0 (0.0%) | 16 (11.0%) |
| 75 Years and over | 27 (24.1%) | 18 (15.0%) |
Disability Class: Ambulatory Difficulty
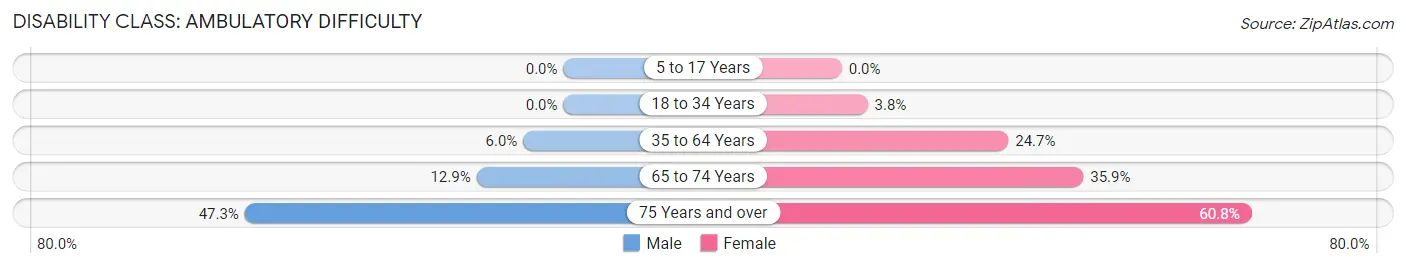
| Age Bracket | Male | Female |
| 5 to 17 Years | 0 (0.0%) | 0 (0.0%) |
| 18 to 34 Years | 0 (0.0%) | 11 (3.8%) |
| 35 to 64 Years | 25 (6.0%) | 111 (24.7%) |
| 65 to 74 Years | 16 (12.9%) | 52 (35.9%) |
| 75 Years and over | 53 (47.3%) | 73 (60.8%) |
Disability Class: Self-Care Difficulty
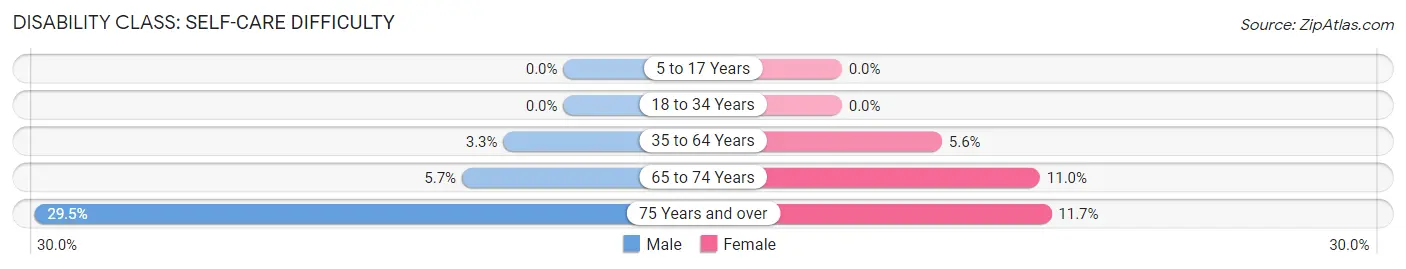
| Age Bracket | Male | Female |
| 5 to 17 Years | 0 (0.0%) | 0 (0.0%) |
| 18 to 34 Years | 0 (0.0%) | 0 (0.0%) |
| 35 to 64 Years | 14 (3.3%) | 25 (5.6%) |
| 65 to 74 Years | 7 (5.7%) | 16 (11.0%) |
| 75 Years and over | 33 (29.5%) | 14 (11.7%) |
Technology Access in Williamson
Computing Device Access in Williamson
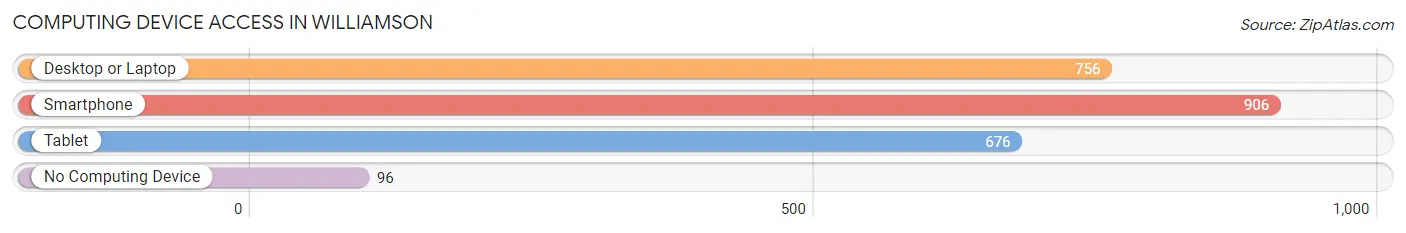
| Device Type | # Households | % Households |
| Desktop or Laptop | 756 | 72.6% |
| Smartphone | 906 | 87.0% |
| Tablet | 676 | 64.9% |
| No Computing Device | 96 | 9.2% |
| Total | 1,041 | 100.0% |
Internet Access in Williamson
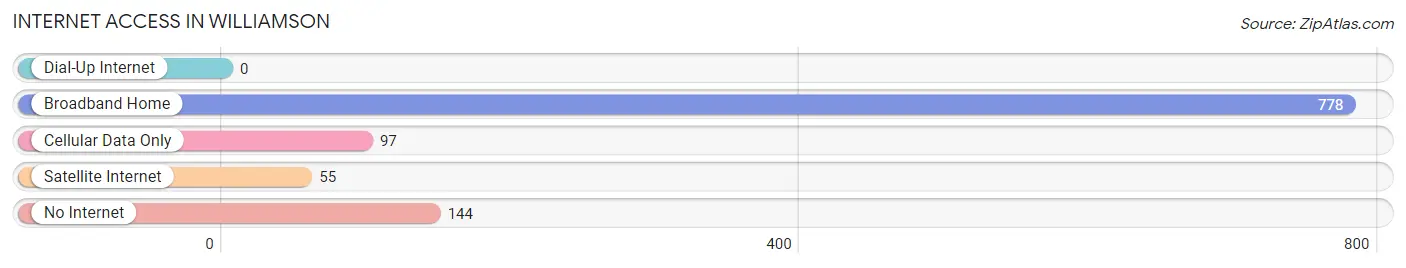
| Internet Type | # Households | % Households |
| Dial-Up Internet | 0 | 0.0% |
| Broadband Home | 778 | 74.7% |
| Cellular Data Only | 97 | 9.3% |
| Satellite Internet | 55 | 5.3% |
| No Internet | 144 | 13.8% |
| Total | 1,041 | 100.0% |
Williamson Summary
Williamson is a town located in Wayne County, New York, United States. The population was 6,817 at the 2010 census. The town is named after Robert Williamson, an early settler.
Geography
Williamson is located in the northwest corner of Wayne County, bordered by Lake Ontario to the north, Monroe County to the west, and Ontario County to the east. According to the United States Census Bureau, the town has a total area of 36.2sqmi, of which 35.9sqmi is land and 0.3sqmi, or 0.77%, is water.
The town is located on the south shore of Lake Ontario, and is part of the Lake Ontario State Parkway. The New York State Thruway (Interstate 90) passes through the town.
Demographics
As of the census of 2000, there were 6,817 people, 2,619 households, and 1,919 families residing in the town. The population density was 189.7 people per square mile (73.2/km^2). There were 2,845 housing units at an average density of 79.2 per square mile (30.6/km^2). The racial makeup of the town was 97.45% White, 0.45% African American, 0.20% Native American, 0.45% Asian, 0.02% Pacific Islander, 0.45% from other races, and 0.98% from two or more races. Hispanic or Latino of any race were 1.17% of the population.
There were 2,619 households, out of which 33.2% had children under the age of 18 living with them, 57.2% were married couples living together, 10.2% had a female householder with no husband present, and 28.2% were non-families. 22.7% of all households were made up of individuals, and 10.2% had someone living alone who was 65 years of age or older. The average household size was 2.60 and the average family size was 3.05.
In the town, the population was spread out, with 25.9% under the age of 18, 7.2% from 18 to 24, 28.7% from 25 to 44, 24.2% from 45 to 64, and 14.0% who were 65 years of age or older. The median age was 38 years. For every 100 females, there were 97.2 males. For every 100 females age 18 and over, there were 94.2 males.
The median income for a household in the town was $41,945, and the median income for a family was $48,958. Males had a median income of $35,945 versus $25,917 for females. The per capita income for the town was $18,945. About 6.2% of families and 8.3% of the population were below the poverty line, including 10.2% of those under age 18 and 8.2% of those age 65 or over.
Economy
Williamson is home to several businesses, including a number of wineries, a brewery, and a distillery. The town is also home to a number of farms, including vegetable farms, dairy farms, and fruit farms.
The town is also home to a number of manufacturing companies, including a plastics manufacturer, a metal fabricator, and a machine shop.
The town is also home to a number of retail stores, including a grocery store, a hardware store, and a number of antique stores.
The town is also home to a number of restaurants, including a number of family-style restaurants, a number of fast food restaurants, and a number of fine dining establishments.
The town is also home to a number of recreational activities, including a number of golf courses, a number of parks, and a number of beaches.
The town is also home to a number of educational institutions, including a number of public schools, a number of private schools, and a number of colleges and universities.
Conclusion
Williamson is a town located in Wayne County, New York, United States. The population was 6,817 at the 2010 census. The town is named after Robert Williamson, an early settler. The town is located on the south shore of Lake Ontario, and is part of the Lake Ontario State Parkway. The town is home to a number of businesses, including a number of wineries, a brewery, and a distillery. The town is also home to a number of farms, manufacturing companies, retail stores, restaurants, recreational activities, and educational institutions.
Common Questions
What is Per Capita Income in Williamson?
Per Capita income in Williamson is $28,157.
What is the Median Family Income in Williamson?
Median Family Income in Williamson is $71,065.
What is the Median Household income in Williamson?
Median Household Income in Williamson is $58,198.
What is Income or Wage Gap in Williamson?
Income or Wage Gap in Williamson is 30.2%.
Women in Williamson earn 69.8 cents for every dollar earned by a man.
What is Inequality or Gini Index in Williamson?
Inequality or Gini Index in Williamson is 0.41.
What is the Total Population of Williamson?
Total Population of Williamson is 2,560.
What is the Total Male Population of Williamson?
Total Male Population of Williamson is 1,264.
What is the Total Female Population of Williamson?
Total Female Population of Williamson is 1,296.
What is the Ratio of Males per 100 Females in Williamson?
There are 97.53 Males per 100 Females in Williamson.
What is the Ratio of Females per 100 Males in Williamson?
There are 102.53 Females per 100 Males in Williamson.
What is the Median Population Age in Williamson?
Median Population Age in Williamson is 36.9 Years.
What is the Average Family Size in Williamson
Average Family Size in Williamson is 3.1 People.
What is the Average Household Size in Williamson
Average Household Size in Williamson is 2.4 People.
How Large is the Labor Force in Williamson?
There are 1,086 People in the Labor Forcein in Williamson.
What is the Percentage of People in the Labor Force in Williamson?
54.9% of People are in the Labor Force in Williamson.
What is the Unemployment Rate in Williamson?
Unemployment Rate in Williamson is 5.7%.