Zip Codes with the Highest Percentage of Population Employed in Firefighting & Prevention in New York, NY

RELATED REPORTS & OPTIONS

Firefighting & Prevention
Population
Families and Households
Female Fertility
Female Fertility (Unmarried)
Race (Community Size)
Race (Percentage)
Ancestry (Community Size)
AfghanAfricanAlbanianAlsatianAmericanApacheArabArgentineanArmenianAssyrian / Chaldean / SyriacAustralianAustrianBahamianBarbadianBasqueBelgianBelizeanBermudanBhutaneseBlackfeetBolivianBrazilianBritishBritish West IndianBulgarianBurmeseCajunCambodianCanadianCape VerdeanCarpatho RusynCelticCentral AmericanCentral American IndianCherokeeChickasawChileanChippewaChoctawColombianCosta RicanCreekCroatianCubanCypriotCzechCzechoslovakianDanishDelawareDominicanDutchDutch West IndianEastern EuropeanEcuadorianEgyptianEnglishEstonianEthiopianEuropeanFilipinoFinnishFrenchFrench American IndianFrench CanadianGermanGhanaianGreekGuamanian / ChamorroGuatemalanGuyaneseHaitianHmongHonduranHungarianIcelanderIndian (Asian)IndonesianIranianIraqiIrishIroquoisIsraeliItalianJamaicanJapaneseJordanianKenyanKoreanLaotianLatvianLebaneseLiberianLithuanianLuxembourgerMacedonianMalaysianMalteseMexicanMexican American IndianMongolianMoroccanNative HawaiianNew ZealanderNicaraguanNigerianNorthern EuropeanNorwegianOkinawanPakistaniPalestinianPanamanianParaguayanPennsylvania GermanPeruvianPolishPortuguesePuebloPuerto RicanRomanianRussianSalvadoranSamoanScandinavianScotch-IrishScottishSenegaleseSerbianSierra LeoneanSiouxSlavicSlovakSloveneSomaliSouth AfricanSouth AmericanSouth American IndianSoviet UnionSpaniardSpanishSpanish AmericanSpanish American IndianSri LankanSubsaharan AfricanSudaneseSwedishSwissSyrianThaiTrinidadian and TobagonianTurkishU.S. Virgin IslanderUgandanUkrainianUruguayanVenezuelanVietnameseWelshWest IndianYugoslavianZimbabwean
Ancestry (Percentage)
AfghanAfricanAlbanianAlsatianAmericanApacheArabArgentineanArmenianAssyrian / Chaldean / SyriacAustralianAustrianBahamianBarbadianBasqueBelgianBelizeanBermudanBhutaneseBlackfeetBolivianBrazilianBritishBritish West IndianBulgarianBurmeseCajunCambodianCanadianCape VerdeanCarpatho RusynCelticCentral AmericanCentral American IndianCherokeeChickasawChileanChippewaChoctawColombianCosta RicanCreekCroatianCubanCypriotCzechCzechoslovakianDanishDelawareDominicanDutchDutch West IndianEastern EuropeanEcuadorianEgyptianEnglishEstonianEthiopianEuropeanFilipinoFinnishFrenchFrench American IndianFrench CanadianGermanGhanaianGreekGuamanian / ChamorroGuatemalanGuyaneseHaitianHmongHonduranHungarianIcelanderIndian (Asian)IndonesianIranianIraqiIrishIroquoisIsraeliItalianJamaicanJapaneseJordanianKenyanKoreanLaotianLatvianLebaneseLiberianLithuanianLuxembourgerMacedonianMalaysianMalteseMexicanMexican American IndianMongolianMoroccanNative HawaiianNew ZealanderNicaraguanNigerianNorthern EuropeanNorwegianOkinawanPakistaniPalestinianPanamanianParaguayanPennsylvania GermanPeruvianPolishPortuguesePuebloPuerto RicanRomanianRussianSalvadoranSamoanScandinavianScotch-IrishScottishSenegaleseSerbianSierra LeoneanSiouxSlavicSlovakSloveneSomaliSouth AfricanSouth AmericanSouth American IndianSoviet UnionSpaniardSpanishSpanish AmericanSpanish American IndianSri LankanSubsaharan AfricanSudaneseSwedishSwissSyrianThaiTrinidadian and TobagonianTurkishU.S. Virgin IslanderUgandanUkrainianUruguayanVenezuelanVietnameseWelshWest IndianYugoslavianZimbabwean
Immigrant Origin (Total)
AfghanistanAfricaAlbaniaArgentinaArmeniaAsiaAustraliaAustriaBahamasBangladeshBarbadosBelarusBelgiumBelizeBoliviaBosnia and HerzegovinaBrazilBulgariaBurma / MyanmarCambodiaCameroonCanadaCaribbeanCentral AmericaChileChinaColombiaCongoCosta RicaCroatiaCubaCzechoslovakiaDenmarkDominicaDominican RepublicEastern AfricaEastern AsiaEastern EuropeEcuadorEgyptEl SalvadorEnglandEritreaEthiopiaEuropeFranceGermanyGhanaGreeceGrenadaGuatemalaGuyanaHaitiHondurasHong KongHungaryIndiaIndonesiaIranIraqIrelandIsraelItalyJamaicaJapanJordanKazakhstanKenyaKoreaKuwaitLatin AmericaLatviaLebanonLiberiaLithuaniaMalaysiaMexicoMiddle AfricaMoldovaMoroccoNepalNetherlandsNicaraguaNigeriaNorth MacedoniaNorthern AfricaNorthern EuropeNorwayOceaniaPakistanPanamaPeruPhilippinesPolandPortugalRomaniaRussiaSaudi ArabiaScotlandSenegalSerbiaSierra LeoneSingaporeSomaliaSouth AfricaSouth AmericaSouth Central AsiaSouth Eastern AsiaSouthern EuropeSpainSri LankaSt. Vincent and the GrenadinesSudanSwedenSwitzerlandSyriaTaiwanThailandTrinidad and TobagoTurkeyUgandaUkraineUruguayUzbekistanVenezuelaVietnamWest IndiesWestern AfricaWestern AsiaWestern EuropeYemenZaireZimbabwe
Immigrant Origin (Percentage)
AfghanistanAfricaAlbaniaArgentinaArmeniaAsiaAustraliaAustriaBahamasBangladeshBarbadosBelarusBelgiumBelizeBoliviaBosnia and HerzegovinaBrazilBulgariaBurma / MyanmarCambodiaCameroonCanadaCaribbeanCentral AmericaChileChinaColombiaCongoCosta RicaCroatiaCubaCzechoslovakiaDenmarkDominicaDominican RepublicEastern AfricaEastern AsiaEastern EuropeEcuadorEgyptEl SalvadorEnglandEritreaEthiopiaEuropeFranceGermanyGhanaGreeceGrenadaGuatemalaGuyanaHaitiHondurasHong KongHungaryIndiaIndonesiaIranIraqIrelandIsraelItalyJamaicaJapanJordanKazakhstanKenyaKoreaKuwaitLatin AmericaLatviaLebanonLiberiaLithuaniaMalaysiaMexicoMiddle AfricaMoldovaMoroccoNepalNetherlandsNicaraguaNigeriaNorth MacedoniaNorthern AfricaNorthern EuropeNorwayOceaniaPakistanPanamaPeruPhilippinesPolandPortugalRomaniaRussiaSaudi ArabiaScotlandSenegalSerbiaSierra LeoneSingaporeSomaliaSouth AfricaSouth AmericaSouth Central AsiaSouth Eastern AsiaSouthern EuropeSpainSri LankaSt. Vincent and the GrenadinesSudanSwedenSwitzerlandSyriaTaiwanThailandTrinidad and TobagoTurkeyUgandaUkraineUruguayUzbekistanVenezuelaVietnamWest IndiesWestern AfricaWestern AsiaWestern EuropeYemenZaireZimbabwe
Income
Income (Families)
Income (Households)
Poverty
Poverty (Families)
Unemployment
Employment Occupations
Employment Industries
Employer Class
Commute Time
Commute Means
School Enrollment
Education by Degree Field
Occupancy
Finances
Physical Characteristics
New York
Compare Zip Codes
Comparison Subject

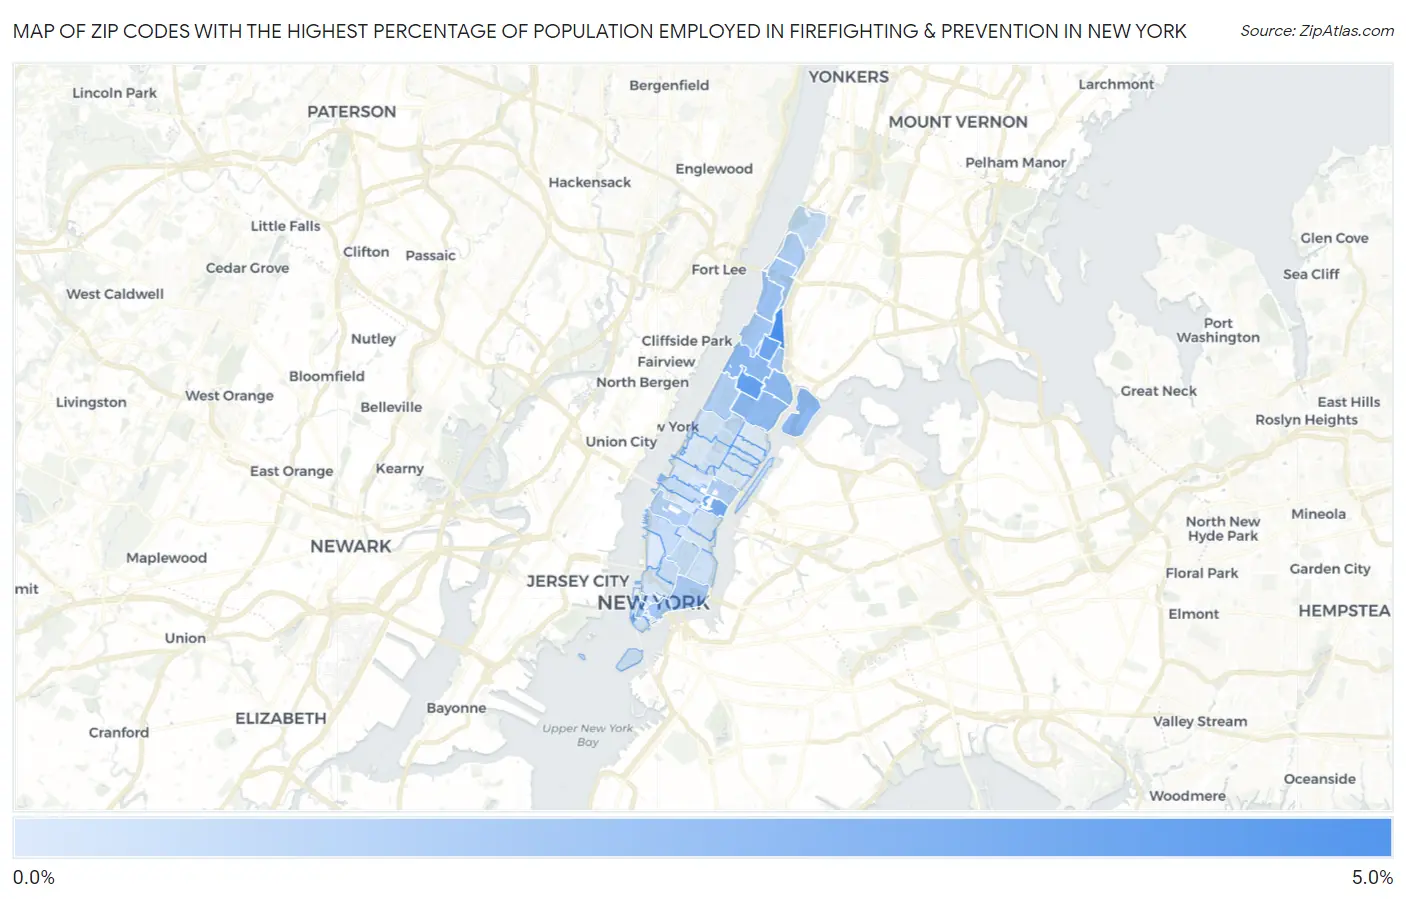
Map of Zip Codes with the Highest Percentage of Population Employed in Firefighting & Prevention in New York

0.0%
5.0%
Zip Codes with the Highest Percentage of Population Employed in Firefighting & Prevention in New York Map

Zip Codes with the Highest Percentage of Population Employed in Firefighting & Prevention in New York, NY

Zip Code % Employed vs State vs National
1.100394.6%1.6%(+2.98)#651.2%(+3.37)#1,076
2.100263.7%1.6%(+2.17)#961.2%(+2.56)#1,510
3.100303.4%1.6%(+1.85)#1171.2%(+2.24)#1,786
4.100173.2%1.6%(+1.58)#1451.2%(+1.97)#2,064
5.100272.5%1.6%(+0.913)#2361.2%(+1.30)#3,119
6.100352.4%1.6%(+0.822)#2551.2%(+1.21)#3,342
7.100292.3%1.6%(+0.746)#2691.2%(+1.14)#3,515
8.100372.1%1.6%(+0.530)#3091.2%(+0.920)#4,136
9.100322.0%1.6%(+0.470)#3221.2%(+0.860)#4,352
10.100311.8%1.6%(+0.261)#3731.2%(+0.651)#5,189
11.100381.7%1.6%(+0.158)#4171.2%(+0.548)#5,669
12.100061.7%1.6%(+0.153)#4191.2%(+0.543)#5,689
13.100331.7%1.6%(+0.074)#4421.2%(+0.464)#6,097
14.100021.6%1.6%(+0.017)#4691.2%(+0.407)#6,423
15.100401.5%1.6%(-0.089)#5051.2%(+0.301)#7,068
16.100251.4%1.6%(-0.143)#5251.2%(+0.246)#7,427
17.100221.4%1.6%(-0.219)#5541.2%(+0.171)#7,929
18.100011.3%1.6%(-0.245)#5711.2%(+0.145)#8,123
19.100070.98%1.6%(-0.596)#7381.2%(-0.206)#11,301
20.100340.85%1.6%(-0.723)#7951.2%(-0.333)#12,641
21.100030.84%1.6%(-0.736)#8071.2%(-0.346)#12,770
22.100120.79%1.6%(-0.782)#8381.2%(-0.392)#13,292
23.100360.72%1.6%(-0.856)#8691.2%(-0.466)#14,099
24.100110.70%1.6%(-0.872)#8781.2%(-0.482)#14,290
25.102800.70%1.6%(-0.880)#8831.2%(-0.490)#14,376
26.100440.62%1.6%(-0.952)#9241.2%(-0.562)#15,168
27.100090.53%1.6%(-1.05)#9661.2%(-0.658)#16,237
28.100040.51%1.6%(-1.06)#9791.2%(-0.674)#16,422
29.100160.49%1.6%(-1.09)#9931.2%(-0.699)#16,710
30.100240.45%1.6%(-1.12)#1,0071.2%(-0.734)#17,083
31.100750.43%1.6%(-1.15)#1,0191.2%(-0.758)#17,343
32.100210.38%1.6%(-1.20)#1,0451.2%(-0.807)#17,900
33.100130.31%1.6%(-1.26)#1,0851.2%(-0.871)#18,601
34.100650.28%1.6%(-1.29)#1,1001.2%(-0.903)#18,928
35.100100.27%1.6%(-1.30)#1,1031.2%(-0.913)#19,031
36.100230.21%1.6%(-1.37)#1,1241.2%(-0.976)#19,586
37.100280.20%1.6%(-1.38)#1,1261.2%(-0.986)#19,681
38.100190.17%1.6%(-1.40)#1,1341.2%(-1.01)#19,871
39.100140.15%1.6%(-1.42)#1,1381.2%(-1.03)#20,001
40.101280.15%1.6%(-1.42)#1,1391.2%(-1.03)#20,010
41.100180.14%1.6%(-1.44)#1,1421.2%(-1.05)#20,121

Common Questions

What are the Top 10 Zip Codes with the Highest Percentage of Population Employed in Firefighting & Prevention in New York, NY?
Top 10 Zip Codes with the Highest Percentage of Population Employed in Firefighting & Prevention in New York, NY are:
#1
4.6%
#2
3.7%
#3
3.4%
#4
3.2%
#5
2.5%
#6
2.4%
#7
2.3%
#8
2.1%
#9
2.0%
#10
1.8%
What zip code has the Highest Percentage of Population Employed in Firefighting & Prevention in New York, NY?
10039 has the Highest Percentage of Population Employed in Firefighting & Prevention in New York, NY with 4.6%.
What is the Percentage of Population Employed in Firefighting & Prevention in New York, NY?
Percentage of Population Employed in Firefighting & Prevention in New York is 1.9%.
What is the Percentage of Population Employed in Firefighting & Prevention in New York?
Percentage of Population Employed in Firefighting & Prevention in New York is 1.6%.
What is the Percentage of Population Employed in Firefighting & Prevention in the United States?
Percentage of Population Employed in Firefighting & Prevention in the United States is 1.2%.