Zip Codes with the Highest Percentage of Population Employed in Firefighting & Prevention in New York
RELATED REPORTS & OPTIONS
Firefighting & Prevention
New York
Compare Zip Codes
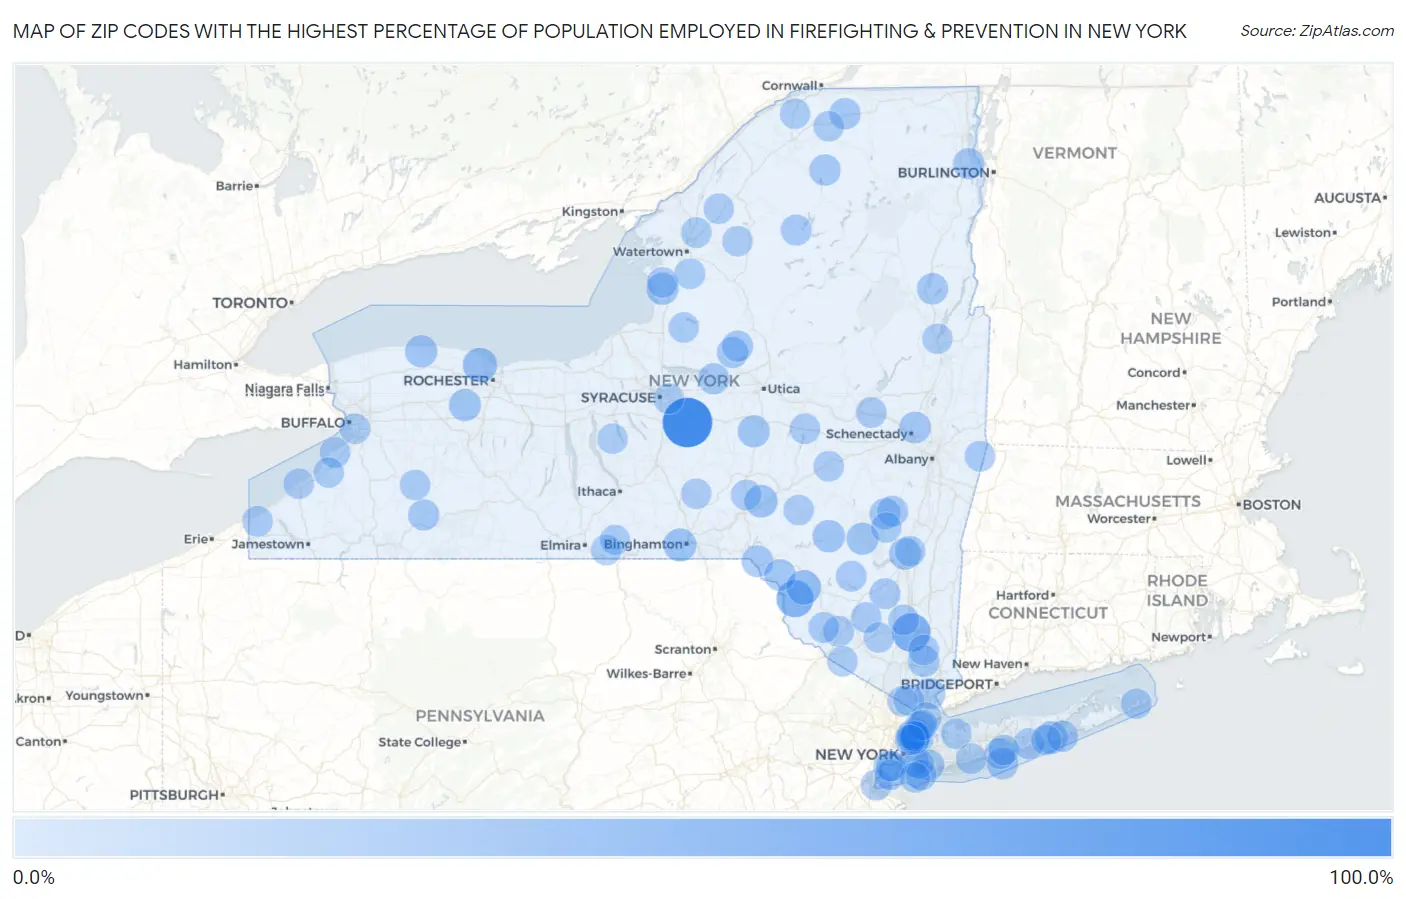
Map of Zip Codes with the Highest Percentage of Population Employed in Firefighting & Prevention in New York
0.0%
100.0%
Zip Codes with the Highest Percentage of Population Employed in Firefighting & Prevention in New York
| Zip Code | % Employed | vs State | vs National | |
| 1. | 13051 | 100.0% | 1.6%(+98.4)#1 | 1.2%(+98.8)#8 |
| 2. | 12527 | 43.8% | 1.6%(+42.2)#2 | 1.2%(+42.6)#23 |
| 3. | 12750 | 36.4% | 1.6%(+34.8)#3 | 1.2%(+35.2)#32 |
| 4. | 12791 | 23.7% | 1.6%(+22.1)#4 | 1.2%(+22.5)#71 |
| 5. | 14515 | 22.9% | 1.6%(+21.4)#5 | 1.2%(+21.7)#73 |
| 6. | 13902 | 16.9% | 1.6%(+15.3)#6 | 1.2%(+15.7)#132 |
| 7. | 11972 | 15.2% | 1.6%(+13.6)#7 | 1.2%(+14.0)#154 |
| 8. | 13859 | 15.1% | 1.6%(+13.5)#8 | 1.2%(+13.9)#157 |
| 9. | 12455 | 13.8% | 1.6%(+12.3)#9 | 1.2%(+12.6)#181 |
| 10. | 12480 | 12.8% | 1.6%(+11.2)#10 | 1.2%(+11.6)#204 |
| 11. | 14571 | 12.6% | 1.6%(+11.0)#11 | 1.2%(+11.4)#208 |
| 12. | 14511 | 12.2% | 1.6%(+10.6)#12 | 1.2%(+11.0)#218 |
| 13. | 13314 | 12.1% | 1.6%(+10.5)#13 | 1.2%(+10.9)#220 |
| 14. | 13636 | 11.9% | 1.6%(+10.3)#14 | 1.2%(+10.7)#231 |
| 15. | 12456 | 11.0% | 1.6%(+9.45)#15 | 1.2%(+9.84)#266 |
| 16. | 12008 | 10.4% | 1.6%(+8.78)#16 | 1.2%(+9.17)#289 |
| 17. | 13783 | 9.9% | 1.6%(+8.32)#17 | 1.2%(+8.71)#307 |
| 18. | 12760 | 9.6% | 1.6%(+8.01)#18 | 1.2%(+8.40)#320 |
| 19. | 11770 | 9.2% | 1.6%(+7.63)#19 | 1.2%(+8.02)#336 |
| 20. | 10588 | 8.9% | 1.6%(+7.36)#20 | 1.2%(+7.75)#346 |
| 21. | 12975 | 8.3% | 1.6%(+6.76)#21 | 1.2%(+7.15)#380 |
| 22. | 12916 | 8.3% | 1.6%(+6.68)#22 | 1.2%(+7.07)#387 |
| 23. | 13672 | 8.2% | 1.6%(+6.62)#23 | 1.2%(+7.01)#392 |
| 24. | 12808 | 8.1% | 1.6%(+6.51)#24 | 1.2%(+6.90)#404 |
| 25. | 13363 | 8.1% | 1.6%(+6.48)#25 | 1.2%(+6.87)#407 |
| 26. | 10474 | 7.7% | 1.6%(+6.10)#26 | 1.2%(+6.49)#443 |
| 27. | 11959 | 7.7% | 1.6%(+6.09)#27 | 1.2%(+6.48)#445 |
| 28. | 13303 | 7.2% | 1.6%(+5.62)#28 | 1.2%(+6.01)#486 |
| 29. | 13054 | 7.2% | 1.6%(+5.60)#29 | 1.2%(+5.99)#493 |
| 30. | 14714 | 6.9% | 1.6%(+5.32)#30 | 1.2%(+5.71)#524 |
| 31. | 11430 | 6.7% | 1.6%(+5.09)#31 | 1.2%(+5.48)#563 |
| 32. | 12439 | 6.7% | 1.6%(+5.09)#32 | 1.2%(+5.48)#564 |
| 33. | 10307 | 6.5% | 1.6%(+4.95)#33 | 1.2%(+5.34)#588 |
| 34. | 12405 | 6.4% | 1.6%(+4.85)#34 | 1.2%(+5.24)#604 |
| 35. | 11719 | 6.4% | 1.6%(+4.79)#35 | 1.2%(+5.18)#613 |
| 36. | 12785 | 6.2% | 1.6%(+4.65)#36 | 1.2%(+5.04)#639 |
| 37. | 13695 | 6.2% | 1.6%(+4.63)#37 | 1.2%(+5.02)#643 |
| 38. | 12440 | 6.1% | 1.6%(+4.54)#38 | 1.2%(+4.93)#657 |
| 39. | 10594 | 6.0% | 1.6%(+4.46)#39 | 1.2%(+4.85)#669 |
| 40. | 11739 | 6.0% | 1.6%(+4.39)#40 | 1.2%(+4.78)#685 |
| 41. | 11212 | 5.8% | 1.6%(+4.19)#41 | 1.2%(+4.58)#715 |
| 42. | 12777 | 5.8% | 1.6%(+4.18)#42 | 1.2%(+4.57)#717 |
| 43. | 12740 | 5.4% | 1.6%(+3.86)#43 | 1.2%(+4.25)#781 |
| 44. | 12177 | 5.3% | 1.6%(+3.74)#44 | 1.2%(+4.13)#804 |
| 45. | 12022 | 5.2% | 1.6%(+3.67)#45 | 1.2%(+4.06)#818 |
| 46. | 12542 | 5.2% | 1.6%(+3.66)#46 | 1.2%(+4.05)#822 |
| 47. | 10459 | 5.2% | 1.6%(+3.65)#47 | 1.2%(+4.04)#823 |
| 48. | 10579 | 5.2% | 1.6%(+3.63)#48 | 1.2%(+4.02)#833 |
| 49. | 10454 | 5.2% | 1.6%(+3.60)#49 | 1.2%(+3.99)#848 |
| 50. | 10302 | 5.1% | 1.6%(+3.50)#50 | 1.2%(+3.89)#881 |
| 51. | 11769 | 5.0% | 1.6%(+3.47)#51 | 1.2%(+3.86)#894 |
| 52. | 14775 | 5.0% | 1.6%(+3.44)#52 | 1.2%(+3.83)#902 |
| 53. | 11694 | 5.0% | 1.6%(+3.37)#53 | 1.2%(+3.76)#929 |
| 54. | 14047 | 4.9% | 1.6%(+3.28)#54 | 1.2%(+3.67)#965 |
| 55. | 12566 | 4.8% | 1.6%(+3.26)#55 | 1.2%(+3.65)#971 |
| 56. | 13611 | 4.8% | 1.6%(+3.24)#56 | 1.2%(+3.63)#983 |
| 57. | 10913 | 4.8% | 1.6%(+3.24)#57 | 1.2%(+3.63)#986 |
| 58. | 11732 | 4.7% | 1.6%(+3.12)#58 | 1.2%(+3.51)#1,026 |
| 59. | 12432 | 4.7% | 1.6%(+3.09)#59 | 1.2%(+3.48)#1,040 |
| 60. | 13214 | 4.6% | 1.6%(+3.05)#60 | 1.2%(+3.44)#1,051 |
| 61. | 14825 | 4.6% | 1.6%(+3.05)#61 | 1.2%(+3.44)#1,052 |
| 62. | 12064 | 4.6% | 1.6%(+3.04)#62 | 1.2%(+3.43)#1,055 |
| 63. | 12967 | 4.6% | 1.6%(+3.02)#63 | 1.2%(+3.41)#1,060 |
| 64. | 13637 | 4.6% | 1.6%(+3.01)#64 | 1.2%(+3.40)#1,065 |
| 65. | 10039 | 4.6% | 1.6%(+2.98)#65 | 1.2%(+3.37)#1,076 |
| 66. | 13682 | 4.5% | 1.6%(+2.94)#66 | 1.2%(+3.33)#1,097 |
| 67. | 11239 | 4.5% | 1.6%(+2.93)#67 | 1.2%(+3.32)#1,098 |
| 68. | 10965 | 4.5% | 1.6%(+2.93)#68 | 1.2%(+3.32)#1,102 |
| 69. | 14065 | 4.5% | 1.6%(+2.93)#69 | 1.2%(+3.32)#1,103 |
| 70. | 13809 | 4.5% | 1.6%(+2.91)#70 | 1.2%(+3.30)#1,111 |
| 71. | 10457 | 4.4% | 1.6%(+2.86)#71 | 1.2%(+3.25)#1,137 |
| 72. | 10455 | 4.4% | 1.6%(+2.80)#72 | 1.2%(+3.19)#1,165 |
| 73. | 11701 | 4.3% | 1.6%(+2.69)#73 | 1.2%(+3.08)#1,214 |
| 74. | 10452 | 4.3% | 1.6%(+2.68)#74 | 1.2%(+3.07)#1,219 |
| 75. | 13468 | 4.3% | 1.6%(+2.68)#75 | 1.2%(+3.07)#1,223 |
| 76. | 14220 | 4.3% | 1.6%(+2.68)#76 | 1.2%(+3.07)#1,226 |
| 77. | 14048 | 4.2% | 1.6%(+2.65)#77 | 1.2%(+3.04)#1,241 |
| 78. | 10709 | 4.2% | 1.6%(+2.65)#78 | 1.2%(+3.04)#1,244 |
| 79. | 10998 | 4.1% | 1.6%(+2.51)#79 | 1.2%(+2.90)#1,304 |
| 80. | 12485 | 4.1% | 1.6%(+2.49)#80 | 1.2%(+2.88)#1,314 |
| 81. | 13665 | 4.1% | 1.6%(+2.49)#81 | 1.2%(+2.88)#1,315 |
| 82. | 13608 | 4.1% | 1.6%(+2.48)#82 | 1.2%(+2.87)#1,322 |
| 83. | 13147 | 4.0% | 1.6%(+2.46)#83 | 1.2%(+2.85)#1,334 |
| 84. | 10470 | 4.0% | 1.6%(+2.44)#84 | 1.2%(+2.83)#1,345 |
| 85. | 13302 | 4.0% | 1.6%(+2.42)#85 | 1.2%(+2.81)#1,358 |
| 86. | 10306 | 3.9% | 1.6%(+2.34)#86 | 1.2%(+2.73)#1,402 |
| 87. | 10550 | 3.9% | 1.6%(+2.33)#87 | 1.2%(+2.72)#1,405 |
| 88. | 13667 | 3.9% | 1.6%(+2.33)#88 | 1.2%(+2.72)#1,408 |
| 89. | 10456 | 3.9% | 1.6%(+2.31)#89 | 1.2%(+2.70)#1,422 |
| 90. | 10310 | 3.9% | 1.6%(+2.29)#90 | 1.2%(+2.68)#1,435 |
| 91. | 13753 | 3.8% | 1.6%(+2.25)#91 | 1.2%(+2.64)#1,455 |
| 92. | 11954 | 3.8% | 1.6%(+2.22)#92 | 1.2%(+2.61)#1,473 |
| 93. | 14081 | 3.8% | 1.6%(+2.20)#93 | 1.2%(+2.59)#1,489 |
| 94. | 11697 | 3.8% | 1.6%(+2.19)#94 | 1.2%(+2.58)#1,493 |
| 95. | 13841 | 3.8% | 1.6%(+2.18)#95 | 1.2%(+2.57)#1,504 |
| 96. | 10026 | 3.7% | 1.6%(+2.17)#96 | 1.2%(+2.56)#1,510 |
| 97. | 14859 | 3.7% | 1.6%(+2.17)#97 | 1.2%(+2.56)#1,516 |
| 98. | 12845 | 3.7% | 1.6%(+2.15)#98 | 1.2%(+2.54)#1,526 |
| 99. | 11940 | 3.7% | 1.6%(+2.14)#99 | 1.2%(+2.53)#1,538 |
| 100. | 12543 | 3.7% | 1.6%(+2.13)#100 | 1.2%(+2.52)#1,552 |
Common Questions
What are the Top 10 Zip Codes with the Highest Percentage of Population Employed in Firefighting & Prevention in New York?
Top 10 Zip Codes with the Highest Percentage of Population Employed in Firefighting & Prevention in New York are:
What zip code has the Highest Percentage of Population Employed in Firefighting & Prevention in New York?
13051 has the Highest Percentage of Population Employed in Firefighting & Prevention in New York with 100.0%.
What is the Percentage of Population Employed in Firefighting & Prevention in the State of New York?
Percentage of Population Employed in Firefighting & Prevention in New York is 1.6%.
What is the Percentage of Population Employed in Firefighting & Prevention in the United States?
Percentage of Population Employed in Firefighting & Prevention in the United States is 1.2%.