Zip Codes with the Highest Percentage of Population Employed in Firefighting & Prevention in Brooklyn, NY

RELATED REPORTS & OPTIONS

Firefighting & Prevention
Population
Families and Households
Female Fertility
Female Fertility (Unmarried)
Race (Community Size)
Race (Percentage)
Ancestry (Community Size)
AfghanAfricanAlbanianAlsatianAmericanApacheArabArgentineanArmenianAssyrian / Chaldean / SyriacAustralianAustrianBahamianBangladeshiBarbadianBasqueBelgianBelizeanBermudanBhutaneseBlackfeetBolivianBrazilianBritishBritish West IndianBulgarianBurmeseCajunCambodianCanadianCape VerdeanCarpatho RusynCelticCentral AmericanCentral American IndianCherokeeChickasawChileanChippewaChoctawColombianCosta RicanCreekCroatianCrowCubanCypriotCzechCzechoslovakianDanishDominicanDutchDutch West IndianEastern EuropeanEcuadorianEgyptianEnglishEstonianEthiopianEuropeanFilipinoFinnishFrenchFrench American IndianFrench CanadianGermanGerman RussianGhanaianGreekGuamanian / ChamorroGuatemalanGuyaneseHaitianHonduranHungarianIcelanderIndian (Asian)IndonesianIranianIraqiIrishIroquoisIsraeliItalianJamaicanJapaneseJordanianKenyanKoreanLaotianLatvianLebaneseLiberianLithuanianLumbeeLuxembourgerMacedonianMalaysianMalteseMexicanMexican American IndianMongolianMoroccanNative HawaiianNavajoNew ZealanderNicaraguanNigerianNorthern EuropeanNorwegianOkinawanPakistaniPalestinianPanamanianParaguayanPennsylvania GermanPeruvianPolishPortuguesePuebloPuerto RicanRomanianRussianSalvadoranSamoanScandinavianScotch-IrishScottishSeminoleSenegaleseSerbianSierra LeoneanSiouxSlavicSlovakSloveneSomaliSouth AfricanSouth AmericanSouth American IndianSoviet UnionSpaniardSpanishSpanish AmericanSpanish American IndianSri LankanSubsaharan AfricanSudaneseSwedishSwissSyrianThaiTrinidadian and TobagonianTurkishU.S. Virgin IslanderUgandanUkrainianUruguayanVenezuelanVietnameseWelshWest IndianYugoslavian
Ancestry (Percentage)
AfghanAfricanAlbanianAlsatianAmericanApacheArabArgentineanArmenianAssyrian / Chaldean / SyriacAustralianAustrianBahamianBangladeshiBarbadianBasqueBelgianBelizeanBermudanBhutaneseBlackfeetBolivianBrazilianBritishBritish West IndianBulgarianBurmeseCajunCambodianCanadianCape VerdeanCarpatho RusynCelticCentral AmericanCentral American IndianCherokeeChickasawChileanChippewaChoctawColombianCosta RicanCreekCroatianCrowCubanCypriotCzechCzechoslovakianDanishDominicanDutchDutch West IndianEastern EuropeanEcuadorianEgyptianEnglishEstonianEthiopianEuropeanFilipinoFinnishFrenchFrench American IndianFrench CanadianGermanGerman RussianGhanaianGreekGuamanian / ChamorroGuatemalanGuyaneseHaitianHonduranHungarianIcelanderIndian (Asian)IndonesianIranianIraqiIrishIroquoisIsraeliItalianJamaicanJapaneseJordanianKenyanKoreanLaotianLatvianLebaneseLiberianLithuanianLumbeeLuxembourgerMacedonianMalaysianMalteseMexicanMexican American IndianMongolianMoroccanNative HawaiianNavajoNew ZealanderNicaraguanNigerianNorthern EuropeanNorwegianOkinawanPakistaniPalestinianPanamanianParaguayanPennsylvania GermanPeruvianPolishPortuguesePuebloPuerto RicanRomanianRussianSalvadoranSamoanScandinavianScotch-IrishScottishSeminoleSenegaleseSerbianSierra LeoneanSiouxSlavicSlovakSloveneSomaliSouth AfricanSouth AmericanSouth American IndianSoviet UnionSpaniardSpanishSpanish AmericanSpanish American IndianSri LankanSubsaharan AfricanSudaneseSwedishSwissSyrianThaiTrinidadian and TobagonianTurkishU.S. Virgin IslanderUgandanUkrainianUruguayanVenezuelanVietnameseWelshWest IndianYugoslavian
Immigrant Origin (Total)
AfghanistanAfricaAlbaniaArgentinaArmeniaAsiaAustraliaAustriaBahamasBangladeshBarbadosBelarusBelgiumBelizeBoliviaBosnia and HerzegovinaBrazilBulgariaBurma / MyanmarCambodiaCameroonCanadaCaribbeanCentral AmericaChileChinaColombiaCongoCosta RicaCroatiaCubaCzechoslovakiaDenmarkDominicaDominican RepublicEastern AfricaEastern AsiaEastern EuropeEcuadorEgyptEl SalvadorEnglandEritreaEthiopiaEuropeFranceGermanyGhanaGreeceGrenadaGuatemalaGuyanaHaitiHondurasHong KongHungaryIndiaIndonesiaIranIraqIrelandIsraelItalyJamaicaJapanJordanKazakhstanKenyaKoreaKuwaitLaosLatin AmericaLatviaLebanonLiberiaLithuaniaMalaysiaMexicoMicronesiaMiddle AfricaMoldovaMoroccoNepalNetherlandsNicaraguaNigeriaNorth MacedoniaNorthern AfricaNorthern EuropeNorwayOceaniaPakistanPanamaPeruPhilippinesPolandPortugalRomaniaRussiaSaudi ArabiaScotlandSenegalSerbiaSierra LeoneSingaporeSomaliaSouth AfricaSouth AmericaSouth Central AsiaSouth Eastern AsiaSouthern EuropeSpainSri LankaSt. Vincent and the GrenadinesSudanSwedenSwitzerlandSyriaTaiwanThailandTrinidad and TobagoTurkeyUgandaUkraineUruguayUzbekistanVenezuelaVietnamWest IndiesWestern AfricaWestern AsiaWestern EuropeYemenZaireZimbabwe
Immigrant Origin (Percentage)
AfghanistanAfricaAlbaniaArgentinaArmeniaAsiaAustraliaAustriaBahamasBangladeshBarbadosBelarusBelgiumBelizeBoliviaBosnia and HerzegovinaBrazilBulgariaBurma / MyanmarCambodiaCameroonCanadaCaribbeanCentral AmericaChileChinaColombiaCongoCosta RicaCroatiaCubaCzechoslovakiaDenmarkDominicaDominican RepublicEastern AfricaEastern AsiaEastern EuropeEcuadorEgyptEl SalvadorEnglandEritreaEthiopiaEuropeFranceGermanyGhanaGreeceGrenadaGuatemalaGuyanaHaitiHondurasHong KongHungaryIndiaIndonesiaIranIraqIrelandIsraelItalyJamaicaJapanJordanKazakhstanKenyaKoreaKuwaitLaosLatin AmericaLatviaLebanonLiberiaLithuaniaMalaysiaMexicoMicronesiaMiddle AfricaMoldovaMoroccoNepalNetherlandsNicaraguaNigeriaNorth MacedoniaNorthern AfricaNorthern EuropeNorwayOceaniaPakistanPanamaPeruPhilippinesPolandPortugalRomaniaRussiaSaudi ArabiaScotlandSenegalSerbiaSierra LeoneSingaporeSomaliaSouth AfricaSouth AmericaSouth Central AsiaSouth Eastern AsiaSouthern EuropeSpainSri LankaSt. Vincent and the GrenadinesSudanSwedenSwitzerlandSyriaTaiwanThailandTrinidad and TobagoTurkeyUgandaUkraineUruguayUzbekistanVenezuelaVietnamWest IndiesWestern AfricaWestern AsiaWestern EuropeYemenZaireZimbabwe
Income
Income (Families)
Income (Households)
Poverty
Poverty (Families)
Unemployment
Employment Occupations
Employment Industries
Employer Class
Commute Time
Commute Means
School Enrollment
Education by Degree Field
Occupancy
Finances
Physical Characteristics
Brooklyn
Compare Zip Codes
Comparison Subject

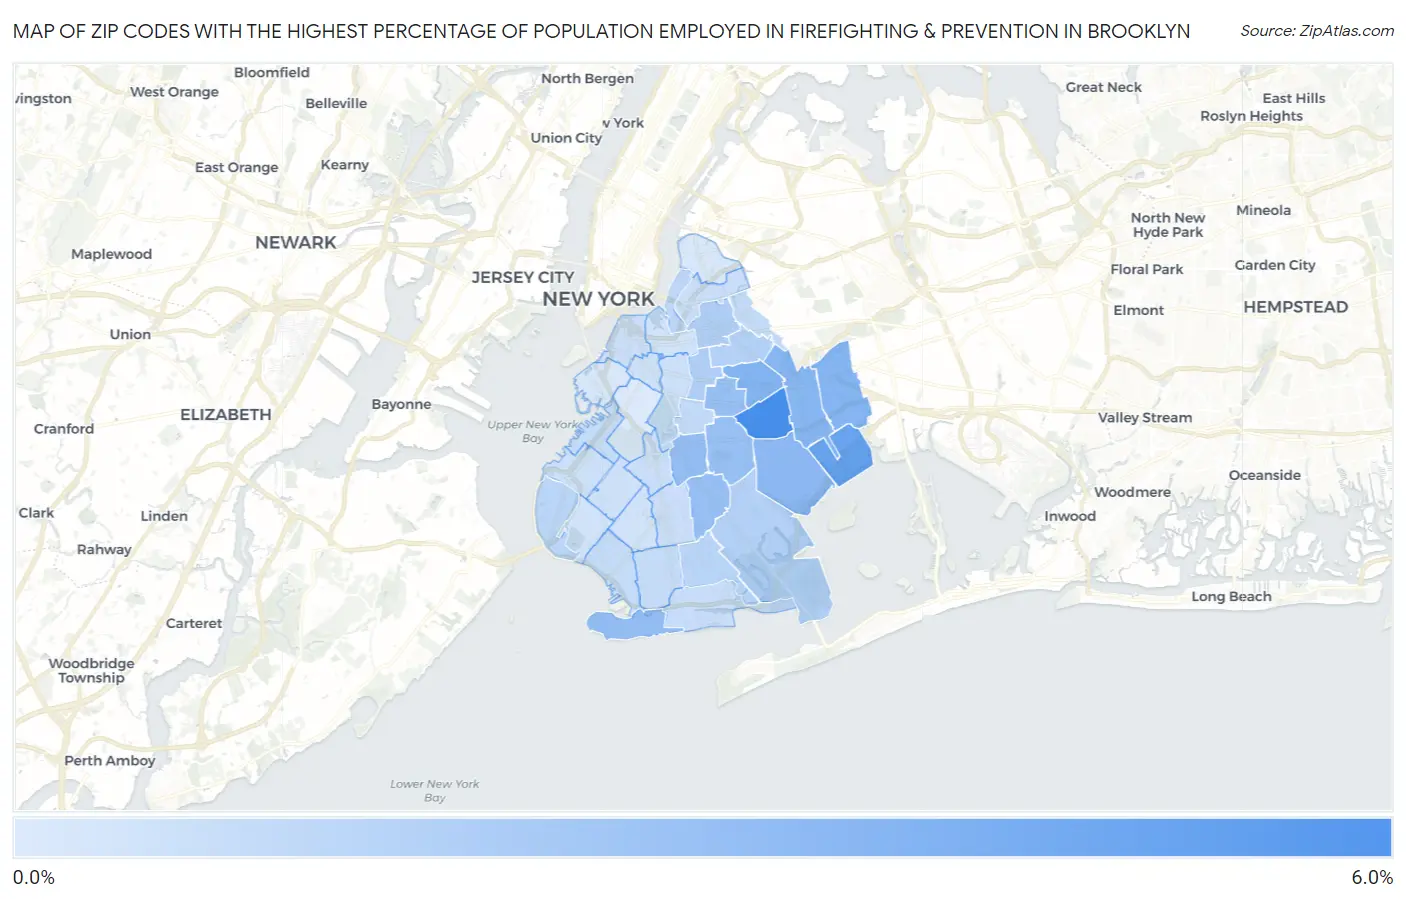
Map of Zip Codes with the Highest Percentage of Population Employed in Firefighting & Prevention in Brooklyn

0.0%
6.0%
Zip Codes with the Highest Percentage of Population Employed in Firefighting & Prevention in Brooklyn Map

Zip Codes with the Highest Percentage of Population Employed in Firefighting & Prevention in Brooklyn, NY

Zip Code % Employed vs State vs National
1.112125.8%1.6%(+4.19)#411.2%(+4.58)#715
2.112394.5%1.6%(+2.93)#671.2%(+3.32)#1,098
3.112333.5%1.6%(+1.97)#1061.2%(+2.36)#1,690
4.112083.5%1.6%(+1.88)#1151.2%(+2.27)#1,761
5.112073.3%1.6%(+1.77)#1251.2%(+2.16)#1,861
6.112363.2%1.6%(+1.62)#1411.2%(+2.01)#2,026
7.112263.0%1.6%(+1.42)#1611.2%(+1.81)#2,250
8.112242.9%1.6%(+1.37)#1701.2%(+1.76)#2,324
9.112132.8%1.6%(+1.25)#1851.2%(+1.64)#2,525
10.112032.8%1.6%(+1.24)#1871.2%(+1.63)#2,539
11.112102.8%1.6%(+1.20)#1971.2%(+1.59)#2,603
12.112062.0%1.6%(+0.414)#3321.2%(+0.804)#4,539
13.112161.9%1.6%(+0.347)#3481.2%(+0.737)#4,819
14.112211.8%1.6%(+0.262)#3721.2%(+0.652)#5,183
15.112341.8%1.6%(+0.251)#3781.2%(+0.641)#5,229
16.112291.6%1.6%(+0.009)#4721.2%(+0.399)#6,465
17.112091.5%1.6%(-0.055)#4921.2%(+0.335)#6,843
18.112491.4%1.6%(-0.140)#5221.2%(+0.250)#7,401
19.112251.3%1.6%(-0.230)#5621.2%(+0.160)#8,018
20.112371.2%1.6%(-0.350)#6221.2%(+0.040)#8,931
21.112141.2%1.6%(-0.415)#6471.2%(-0.025)#9,497
22.112321.1%1.6%(-0.449)#6581.2%(-0.059)#9,861
23.112231.1%1.6%(-0.470)#6711.2%(-0.080)#10,059
24.112351.1%1.6%(-0.494)#6831.2%(-0.104)#10,268
25.112111.0%1.6%(-0.564)#7201.2%(-0.174)#10,961
26.112301.0%1.6%(-0.575)#7261.2%(-0.185)#11,080
27.112010.96%1.6%(-0.621)#7561.2%(-0.231)#11,586
28.112180.95%1.6%(-0.627)#7571.2%(-0.237)#11,660
29.112200.90%1.6%(-0.677)#7771.2%(-0.287)#12,170
30.112380.87%1.6%(-0.708)#7881.2%(-0.318)#12,495
31.112170.85%1.6%(-0.723)#7961.2%(-0.333)#12,643
32.112190.81%1.6%(-0.764)#8231.2%(-0.374)#13,069
33.112050.72%1.6%(-0.860)#8711.2%(-0.470)#14,152
34.112040.70%1.6%(-0.878)#8811.2%(-0.488)#14,359
35.112280.70%1.6%(-0.879)#8821.2%(-0.489)#14,366
36.112310.53%1.6%(-1.05)#9641.2%(-0.656)#16,204
37.112220.51%1.6%(-1.07)#9801.2%(-0.676)#16,444
38.112150.33%1.6%(-1.25)#1,0761.2%(-0.858)#18,475

Common Questions

What are the Top 10 Zip Codes with the Highest Percentage of Population Employed in Firefighting & Prevention in Brooklyn, NY?
Top 10 Zip Codes with the Highest Percentage of Population Employed in Firefighting & Prevention in Brooklyn, NY are:
#1
5.8%
#2
4.5%
#3
3.5%
#4
3.5%
#5
3.3%
#6
3.2%
#7
3.0%
#8
2.9%
#9
2.8%
#10
2.8%
What zip code has the Highest Percentage of Population Employed in Firefighting & Prevention in Brooklyn, NY?
11212 has the Highest Percentage of Population Employed in Firefighting & Prevention in Brooklyn, NY with 5.8%.
What is the Percentage of Population Employed in Firefighting & Prevention in New York?
Percentage of Population Employed in Firefighting & Prevention in New York is 1.6%.
What is the Percentage of Population Employed in Firefighting & Prevention in the United States?
Percentage of Population Employed in Firefighting & Prevention in the United States is 1.2%.