Zip Codes with the Highest Percentage of Population Employed in Firefighting & Prevention in Buffalo, NY

RELATED REPORTS & OPTIONS

Firefighting & Prevention
Population
Families and Households
Female Fertility
Female Fertility (Unmarried)
Race (Community Size)
Race (Percentage)
Ancestry (Community Size)
AfghanAfricanAlbanianAlsatianAmericanArabArgentineanArmenianAustralianAustrianBahamianBarbadianBelgianBelizeanBhutaneseBlackfeetBolivianBrazilianBritishBritish West IndianBulgarianBurmeseCajunCambodianCanadianCarpatho RusynCelticCentral AmericanCentral American IndianCherokeeChileanChippewaColombianCosta RicanCreekCroatianCubanCzechCzechoslovakianDanishDominicanDutchDutch West IndianEastern EuropeanEcuadorianEgyptianEnglishEstonianEthiopianEuropeanFilipinoFinnishFrenchFrench American IndianFrench CanadianGermanGerman RussianGhanaianGreekGuamanian / ChamorroGuatemalanGuyaneseHaitianHonduranHungarianIcelanderIndian (Asian)IndonesianIranianIraqiIrishIroquoisIsraeliItalianJamaicanJapaneseJordanianKenyanKoreanLaotianLatvianLebaneseLithuanianMacedonianMalaysianMalteseMexicanMexican American IndianMongolianMoroccanNative HawaiianNavajoNicaraguanNigerianNorthern EuropeanNorwegianOkinawanPakistaniPalestinianPanamanianPennsylvania GermanPeruvianPolishPortuguesePuerto RicanRomanianRussianSalvadoranSamoanScandinavianScotch-IrishScottishSerbianSiouxSlavicSlovakSloveneSomaliSouth AfricanSouth AmericanSouth American IndianSpaniardSpanishSri LankanSubsaharan AfricanSudaneseSwedishSwissSyrianTaiwaneseThaiTrinidadian and TobagonianTurkishUkrainianVenezuelanVietnameseWelshWest IndianYugoslavian
Ancestry (Percentage)
AfghanAfricanAlbanianAlsatianAmericanArabArgentineanArmenianAustralianAustrianBahamianBarbadianBelgianBelizeanBhutaneseBlackfeetBolivianBrazilianBritishBritish West IndianBulgarianBurmeseCajunCambodianCanadianCarpatho RusynCelticCentral AmericanCentral American IndianCherokeeChileanChippewaColombianCosta RicanCreekCroatianCubanCzechCzechoslovakianDanishDominicanDutchDutch West IndianEastern EuropeanEcuadorianEgyptianEnglishEstonianEthiopianEuropeanFilipinoFinnishFrenchFrench American IndianFrench CanadianGermanGerman RussianGhanaianGreekGuamanian / ChamorroGuatemalanGuyaneseHaitianHonduranHungarianIcelanderIndian (Asian)IndonesianIranianIraqiIrishIroquoisIsraeliItalianJamaicanJapaneseJordanianKenyanKoreanLaotianLatvianLebaneseLithuanianMacedonianMalaysianMalteseMexicanMexican American IndianMongolianMoroccanNative HawaiianNavajoNicaraguanNigerianNorthern EuropeanNorwegianOkinawanPakistaniPalestinianPanamanianPennsylvania GermanPeruvianPolishPortuguesePuerto RicanRomanianRussianSalvadoranSamoanScandinavianScotch-IrishScottishSerbianSiouxSlavicSlovakSloveneSomaliSouth AfricanSouth AmericanSouth American IndianSpaniardSpanishSri LankanSubsaharan AfricanSudaneseSwedishSwissSyrianTaiwaneseThaiTrinidadian and TobagonianTurkishUkrainianVenezuelanVietnameseWelshWest IndianYugoslavian
Immigrant Origin (Total)
AfghanistanAfricaAlbaniaArgentinaAsiaAustraliaAustriaBangladeshBarbadosBelarusBosnia and HerzegovinaBrazilBulgariaBurma / MyanmarCameroonCanadaCaribbeanCentral AmericaChinaColombiaCongoCosta RicaCroatiaCubaCzechoslovakiaDominican RepublicEastern AfricaEastern AsiaEastern EuropeEcuadorEgyptEl SalvadorEnglandEritreaEthiopiaEuropeFranceGermanyGhanaGreeceGuatemalaGuyanaHaitiHondurasHong KongHungaryIndiaIndonesiaIranIraqIrelandIsraelItalyJamaicaJapanJordanKazakhstanKenyaKoreaKuwaitLaosLatin AmericaLatviaLebanonLiberiaLithuaniaMalaysiaMexicoMiddle AfricaMoldovaMoroccoNepalNetherlandsNigeriaNorth MacedoniaNorthern AfricaNorthern EuropeNorwayOceaniaPakistanPanamaPeruPhilippinesPolandRomaniaRussiaSaudi ArabiaScotlandSerbiaSierra LeoneSingaporeSomaliaSouth AfricaSouth AmericaSouth Central AsiaSouth Eastern AsiaSouthern EuropeSpainSri LankaSt. Vincent and the GrenadinesSudanSwedenSwitzerlandSyriaTaiwanThailandTrinidad and TobagoTurkeyUgandaUkraineUzbekistanVenezuelaVietnamWest IndiesWestern AfricaWestern AsiaWestern EuropeYemenZaire
Immigrant Origin (Percentage)
AfghanistanAfricaAlbaniaArgentinaAsiaAustraliaAustriaBangladeshBarbadosBelarusBosnia and HerzegovinaBrazilBulgariaBurma / MyanmarCameroonCanadaCaribbeanCentral AmericaChinaColombiaCongoCosta RicaCroatiaCubaCzechoslovakiaDominican RepublicEastern AfricaEastern AsiaEastern EuropeEcuadorEgyptEl SalvadorEnglandEritreaEthiopiaEuropeFranceGermanyGhanaGreeceGuatemalaGuyanaHaitiHondurasHong KongHungaryIndiaIndonesiaIranIraqIrelandIsraelItalyJamaicaJapanJordanKazakhstanKenyaKoreaKuwaitLaosLatin AmericaLatviaLebanonLiberiaLithuaniaMalaysiaMexicoMiddle AfricaMoldovaMoroccoNepalNetherlandsNigeriaNorth MacedoniaNorthern AfricaNorthern EuropeNorwayOceaniaPakistanPanamaPeruPhilippinesPolandRomaniaRussiaSaudi ArabiaScotlandSerbiaSierra LeoneSingaporeSomaliaSouth AfricaSouth AmericaSouth Central AsiaSouth Eastern AsiaSouthern EuropeSpainSri LankaSt. Vincent and the GrenadinesSudanSwedenSwitzerlandSyriaTaiwanThailandTrinidad and TobagoTurkeyUgandaUkraineUzbekistanVenezuelaVietnamWest IndiesWestern AfricaWestern AsiaWestern EuropeYemenZaire
Income
Income (Families)
Income (Households)
Poverty
Poverty (Families)
Unemployment
Employment Occupations
Employment Industries
Employer Class
Commute Time
Commute Means
School Enrollment
Education by Degree Field
Occupancy
Finances
Physical Characteristics
Buffalo
Compare Zip Codes
Comparison Subject

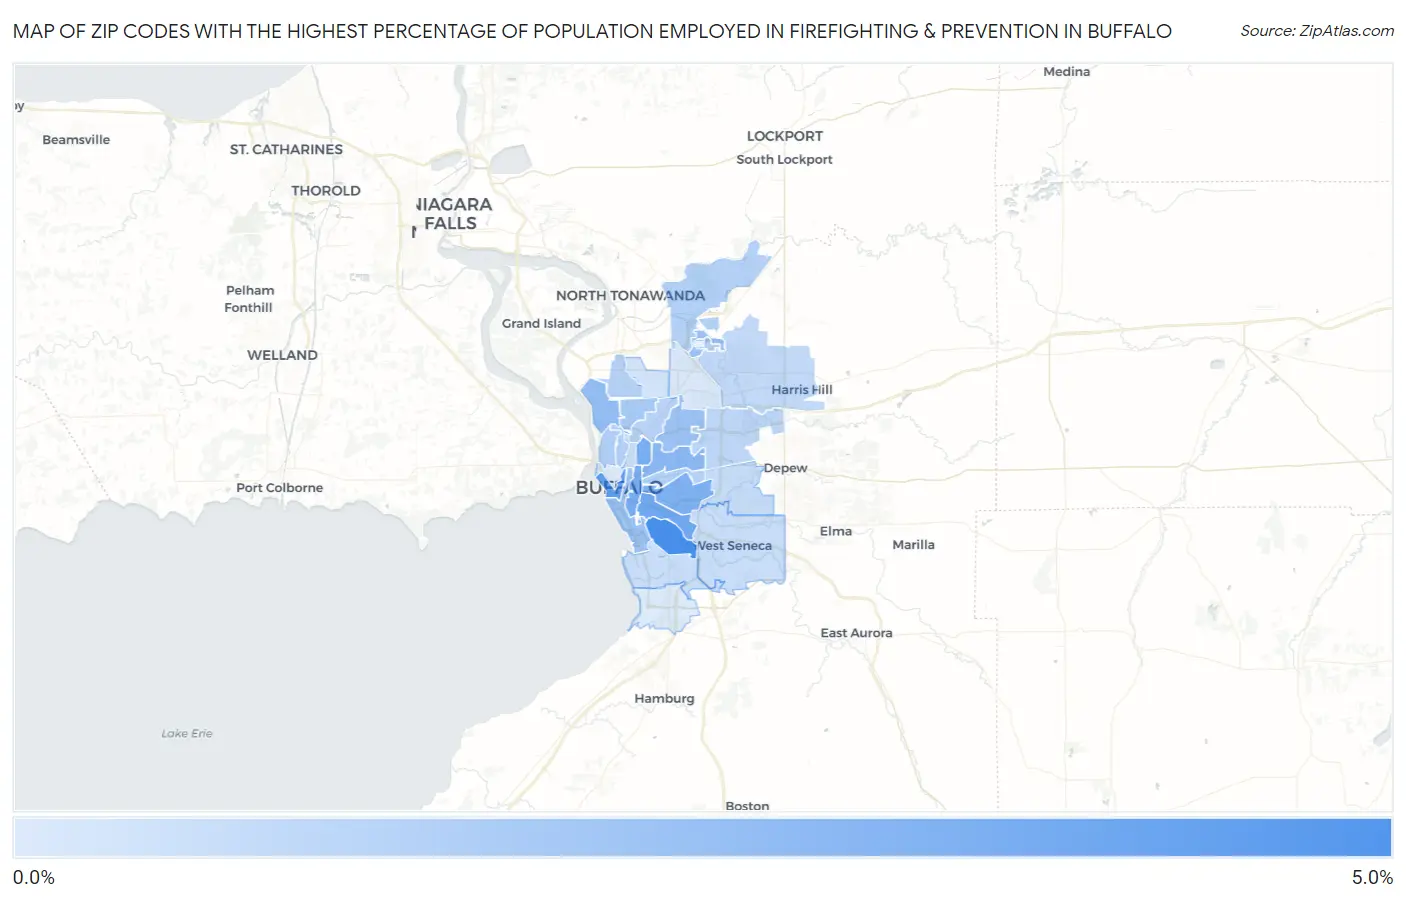
Map of Zip Codes with the Highest Percentage of Population Employed in Firefighting & Prevention in Buffalo

0.0%
5.0%
Zip Codes with the Highest Percentage of Population Employed in Firefighting & Prevention in Buffalo Map

Zip Codes with the Highest Percentage of Population Employed in Firefighting & Prevention in Buffalo, NY

Zip Code % Employed vs State vs National
1.142204.3%1.6%(+2.68)#761.2%(+3.07)#1,226
2.142023.5%1.6%(+1.89)#1131.2%(+2.28)#1,750
3.142103.1%1.6%(+1.54)#1511.2%(+1.93)#2,121
4.142083.0%1.6%(+1.39)#1651.2%(+1.78)#2,298
5.142042.9%1.6%(+1.34)#1741.2%(+1.73)#2,358
6.142062.7%1.6%(+1.15)#2041.2%(+1.54)#2,688
7.142112.4%1.6%(+0.863)#2461.2%(+1.25)#3,233
8.142072.2%1.6%(+0.645)#2871.2%(+1.03)#3,796
9.142612.0%1.6%(+0.435)#3291.2%(+0.825)#4,476
10.142151.9%1.6%(+0.361)#3461.2%(+0.751)#4,760
11.142031.9%1.6%(+0.289)#3631.2%(+0.679)#5,070
12.142161.6%1.6%(+0.052)#4521.2%(+0.442)#6,234
13.142131.5%1.6%(-0.114)#5091.2%(+0.276)#7,229
14.142121.3%1.6%(-0.260)#5791.2%(+0.130)#8,238
15.142221.3%1.6%(-0.260)#5801.2%(+0.129)#8,241
16.142281.3%1.6%(-0.275)#5871.2%(+0.115)#8,344
17.142171.3%1.6%(-0.313)#6081.2%(+0.077)#8,638
18.142141.2%1.6%(-0.367)#6281.2%(+0.023)#9,076
19.142251.1%1.6%(-0.467)#6691.2%(-0.077)#10,036
20.142210.95%1.6%(-0.628)#7581.2%(-0.238)#11,669
21.142270.85%1.6%(-0.730)#8031.2%(-0.340)#12,715
22.142090.79%1.6%(-0.787)#8421.2%(-0.397)#13,342
23.142180.77%1.6%(-0.804)#8501.2%(-0.414)#13,527
24.142240.76%1.6%(-0.818)#8541.2%(-0.428)#13,674
25.142230.52%1.6%(-1.06)#9741.2%(-0.667)#16,341
26.142260.37%1.6%(-1.20)#1,0521.2%(-0.814)#17,975
27.142010.25%1.6%(-1.32)#1,1111.2%(-0.932)#19,211
28.142190.23%1.6%(-1.34)#1,1161.2%(-0.951)#19,375

Common Questions

What are the Top 10 Zip Codes with the Highest Percentage of Population Employed in Firefighting & Prevention in Buffalo, NY?
Top 10 Zip Codes with the Highest Percentage of Population Employed in Firefighting & Prevention in Buffalo, NY are:
#1
4.3%
#2
3.5%
#3
3.1%
#4
3.0%
#5
2.9%
#6
2.7%
#7
2.4%
#8
2.2%
#9
2.0%
#10
1.9%
What zip code has the Highest Percentage of Population Employed in Firefighting & Prevention in Buffalo, NY?
14220 has the Highest Percentage of Population Employed in Firefighting & Prevention in Buffalo, NY with 4.3%.
What is the Percentage of Population Employed in Firefighting & Prevention in Buffalo, NY?
Percentage of Population Employed in Firefighting & Prevention in Buffalo is 2.1%.
What is the Percentage of Population Employed in Firefighting & Prevention in New York?
Percentage of Population Employed in Firefighting & Prevention in New York is 1.6%.
What is the Percentage of Population Employed in Firefighting & Prevention in the United States?
Percentage of Population Employed in Firefighting & Prevention in the United States is 1.2%.