East Syracuse, NY Map & Demographics
East Syracuse Map
East Syracuse Overview
$30,029
PER CAPITA INCOME
$66,875
AVG FAMILY INCOME
$52,794
AVG HOUSEHOLD INCOME
2.8%
WAGE / INCOME GAP [ % ]
97.2¢/ $1
WAGE / INCOME GAP [ $ ]
0.41
INEQUALITY / GINI INDEX
3,065
TOTAL POPULATION
1,648
MALE POPULATION
1,417
FEMALE POPULATION
116.30
MALES / 100 FEMALES
85.98
FEMALES / 100 MALES
43.8
MEDIAN AGE
3.0
AVG FAMILY SIZE
2.2
AVG HOUSEHOLD SIZE
1,703
LABOR FORCE [ PEOPLE ]
63.6%
PERCENT IN LABOR FORCE
1.6%
UNEMPLOYMENT RATE
East Syracuse Zip Codes
East Syracuse Area Codes
Income in East Syracuse
Income Overview in East Syracuse
Per Capita Income in East Syracuse is $30,029, while median incomes of families and households are $66,875 and $52,794 respectively.
| Characteristic | Number | Measure |
| Per Capita Income | 3,065 | $30,029 |
| Median Family Income | 681 | $66,875 |
| Mean Family Income | 681 | $81,899 |
| Median Household Income | 1,412 | $52,794 |
| Mean Household Income | 1,412 | $64,855 |
| Income Deficit | 681 | $0 |
| Wage / Income Gap (%) | 3,065 | 2.77% |
| Wage / Income Gap ($) | 3,065 | 97.23¢ per $1 |
| Gini / Inequality Index | 3,065 | 0.41 |
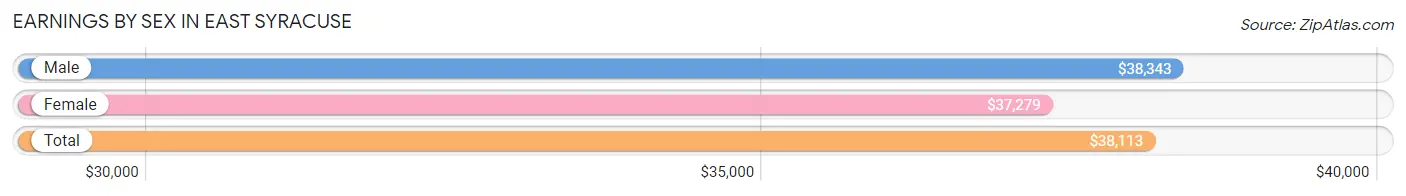
Earnings by Sex in East Syracuse
Average Earnings in East Syracuse are $38,113, $38,343 for men and $37,279 for women, a difference of 2.8%.
| Sex | Number | Average Earnings |
| Male | 1,035 (57.6%) | $38,343 |
| Female | 761 (42.4%) | $37,279 |
| Total | 1,796 (100.0%) | $38,113 |
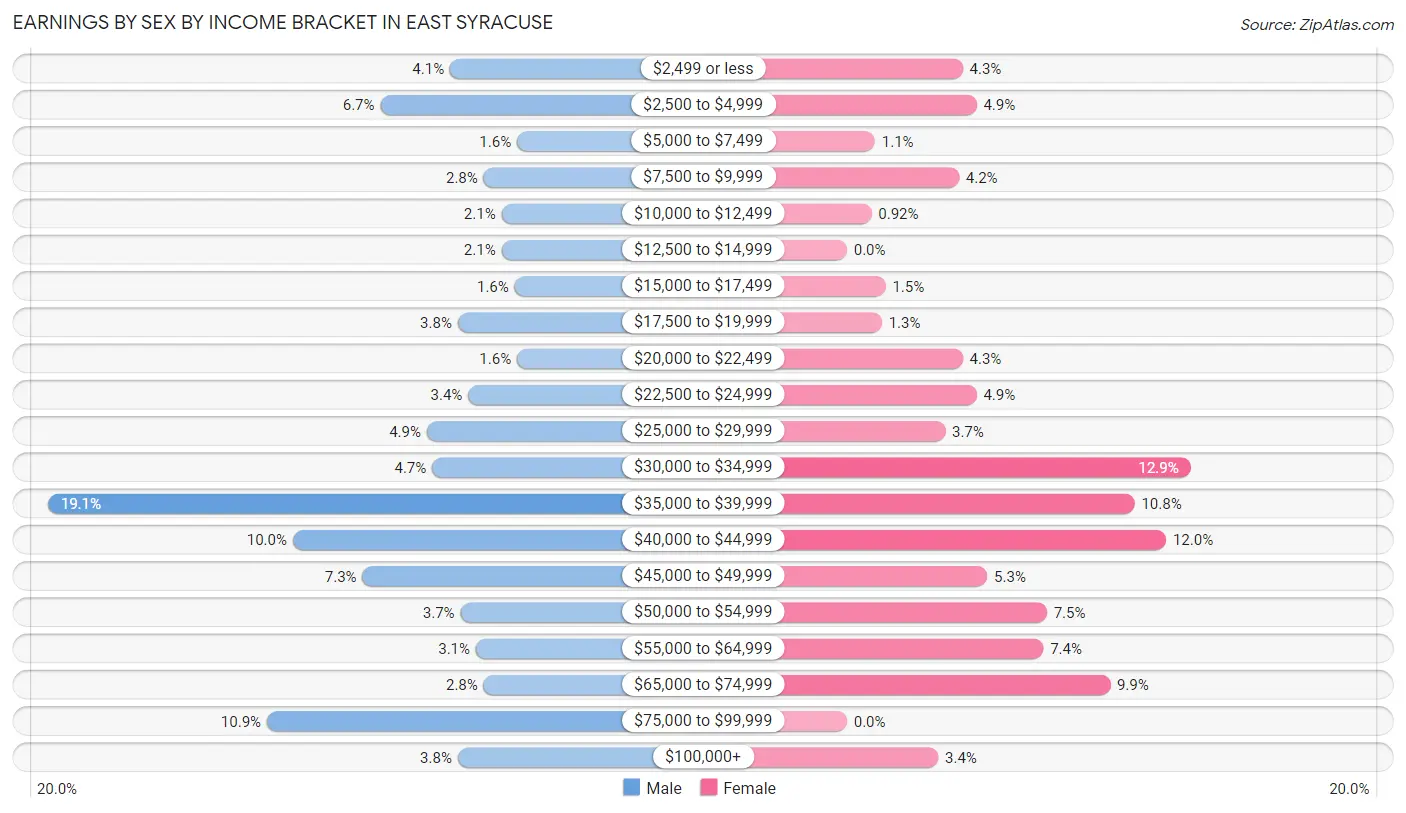
Earnings by Sex by Income Bracket in East Syracuse
The most common earnings brackets in East Syracuse are $35,000 to $39,999 for men (198 | 19.1%) and $30,000 to $34,999 for women (98 | 12.9%).
| Income | Male | Female |
| $2,499 or less | 42 (4.1%) | 33 (4.3%) |
| $2,500 to $4,999 | 69 (6.7%) | 37 (4.9%) |
| $5,000 to $7,499 | 16 (1.5%) | 8 (1.1%) |
| $7,500 to $9,999 | 29 (2.8%) | 32 (4.2%) |
| $10,000 to $12,499 | 22 (2.1%) | 7 (0.9%) |
| $12,500 to $14,999 | 22 (2.1%) | 0 (0.0%) |
| $15,000 to $17,499 | 17 (1.6%) | 11 (1.5%) |
| $17,500 to $19,999 | 39 (3.8%) | 10 (1.3%) |
| $20,000 to $22,499 | 16 (1.5%) | 33 (4.3%) |
| $22,500 to $24,999 | 35 (3.4%) | 37 (4.9%) |
| $25,000 to $29,999 | 51 (4.9%) | 28 (3.7%) |
| $30,000 to $34,999 | 49 (4.7%) | 98 (12.9%) |
| $35,000 to $39,999 | 198 (19.1%) | 82 (10.8%) |
| $40,000 to $44,999 | 103 (10.0%) | 91 (12.0%) |
| $45,000 to $49,999 | 76 (7.3%) | 40 (5.3%) |
| $50,000 to $54,999 | 38 (3.7%) | 57 (7.5%) |
| $55,000 to $64,999 | 32 (3.1%) | 56 (7.4%) |
| $65,000 to $74,999 | 29 (2.8%) | 75 (9.9%) |
| $75,000 to $99,999 | 113 (10.9%) | 0 (0.0%) |
| $100,000+ | 39 (3.8%) | 26 (3.4%) |
| Total | 1,035 (100.0%) | 761 (100.0%) |
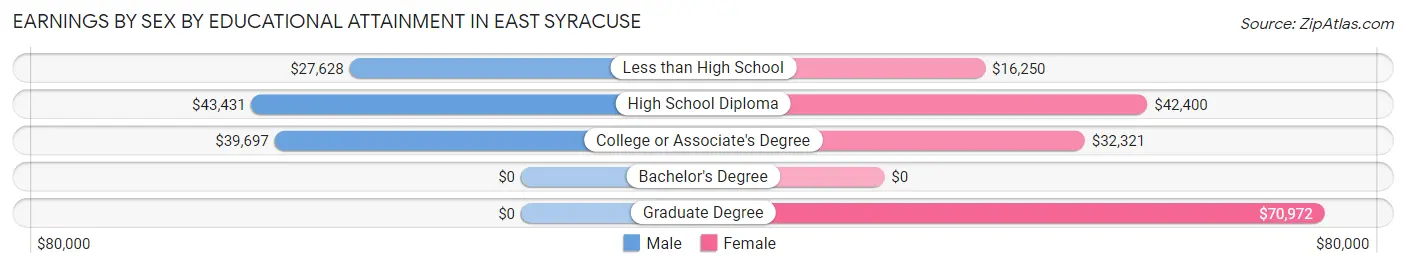
Earnings by Sex by Educational Attainment in East Syracuse
Average earnings in East Syracuse are $39,479 for men and $40,300 for women, a difference of 2.0%. Men with an educational attainment of high school diploma enjoy the highest average annual earnings of $43,431, while those with less than high school education earn the least with $27,628. Women with an educational attainment of graduate degree earn the most with the average annual earnings of $70,972, while those with less than high school education have the smallest earnings of $16,250.
| Educational Attainment | Male Income | Female Income |
| Less than High School | $27,628 | $16,250 |
| High School Diploma | $43,431 | $42,400 |
| College or Associate's Degree | $39,697 | $32,321 |
| Bachelor's Degree | - | - |
| Graduate Degree | - | - |
| Total | $39,479 | $40,300 |
Family Income in East Syracuse
Family Income Brackets in East Syracuse
According to the East Syracuse family income data, there are 163 families falling into the $100,000 to $149,999 income range, which is the most common income bracket and makes up 23.9% of all families. Conversely, the $10,000 to $14,999 income bracket is the least frequent group with only 8 families (1.2%) belonging to this category.
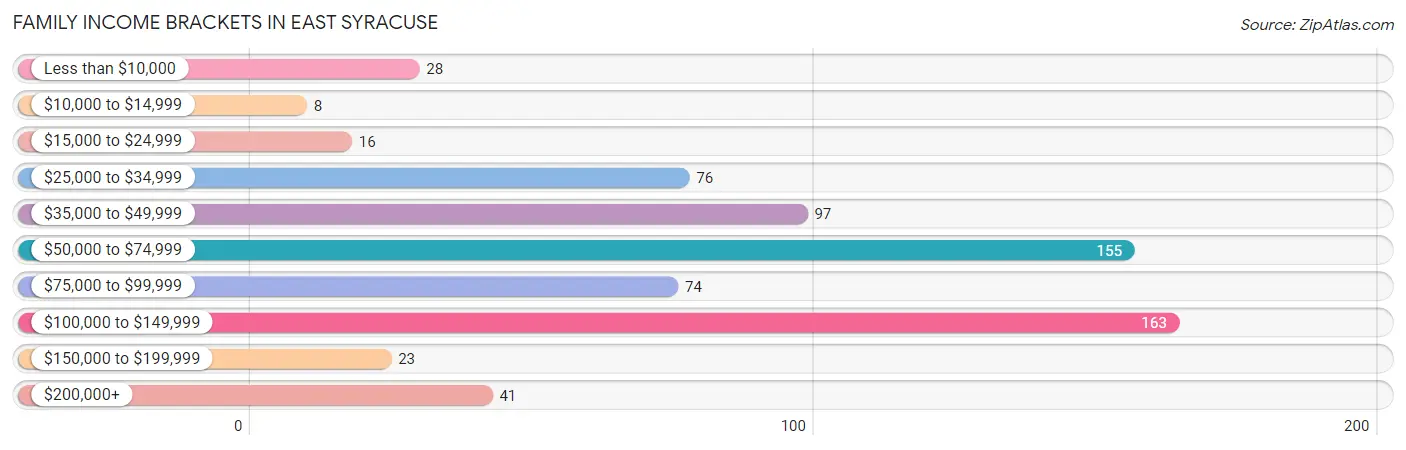
| Income Bracket | # Families | % Families |
| Less than $10,000 | 28 | 4.1% |
| $10,000 to $14,999 | 8 | 1.2% |
| $15,000 to $24,999 | 16 | 2.3% |
| $25,000 to $34,999 | 76 | 11.2% |
| $35,000 to $49,999 | 97 | 14.2% |
| $50,000 to $74,999 | 155 | 22.8% |
| $75,000 to $99,999 | 74 | 10.9% |
| $100,000 to $149,999 | 163 | 23.9% |
| $150,000 to $199,999 | 23 | 3.4% |
| $200,000+ | 41 | 6.0% |
Family Income by Famaliy Size in East Syracuse
4-person families (86 | 12.6%) account for the highest median family income in East Syracuse with $110,380 per family, while 4-person families (86 | 12.6%) have the highest median income of $27,595 per family member.
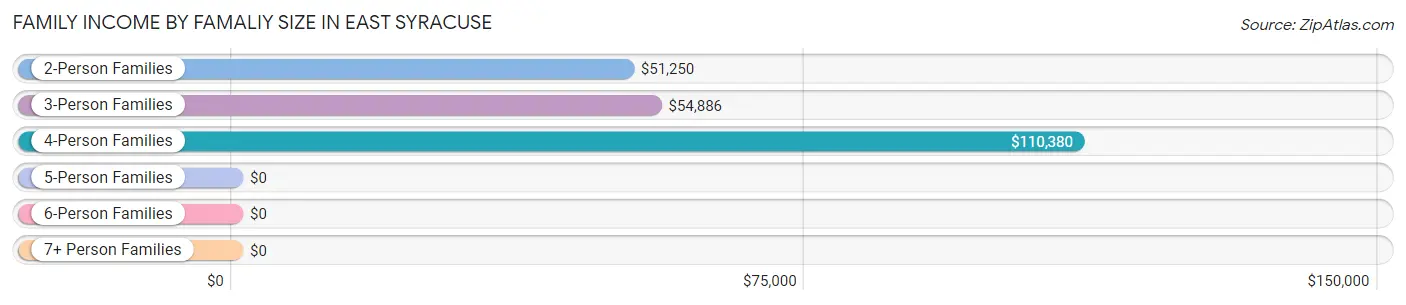
| Income Bracket | # Families | Median Income |
| 2-Person Families | 343 (50.4%) | $51,250 |
| 3-Person Families | 155 (22.8%) | $54,886 |
| 4-Person Families | 86 (12.6%) | $110,380 |
| 5-Person Families | 66 (9.7%) | $0 |
| 6-Person Families | 21 (3.1%) | $0 |
| 7+ Person Families | 10 (1.5%) | $0 |
| Total | 681 (100.0%) | $66,875 |
Family Income by Number of Earners in East Syracuse
The median family income in East Syracuse is $66,875, with families comprising 3+ earners (123) having the highest median family income of $117,875, while families with no earners (97) have the lowest median family income of $31,775, accounting for 18.1% and 14.2% of families, respectively.
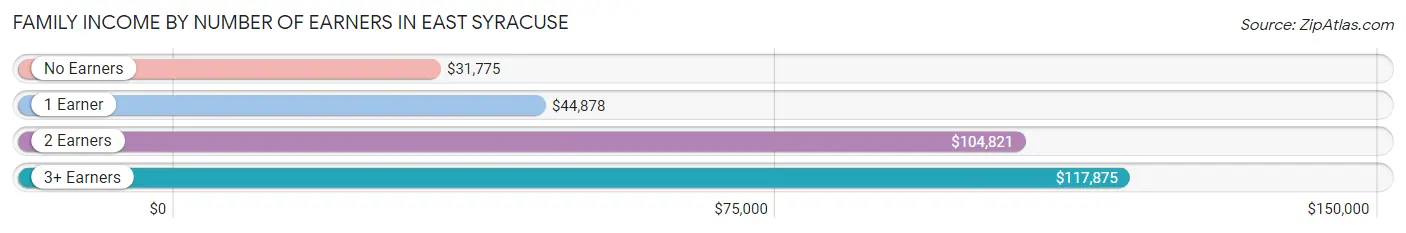
| Number of Earners | # Families | Median Income |
| No Earners | 97 (14.2%) | $31,775 |
| 1 Earner | 218 (32.0%) | $44,878 |
| 2 Earners | 243 (35.7%) | $104,821 |
| 3+ Earners | 123 (18.1%) | $117,875 |
| Total | 681 (100.0%) | $66,875 |
Household Income in East Syracuse
Household Income Brackets in East Syracuse
With 352 households falling in the category, the $50,000 to $74,999 income range is the most frequent in East Syracuse, accounting for 24.9% of all households. In contrast, only 30 households (2.1%) fall into the less than $10,000 income bracket, making it the least populous group.
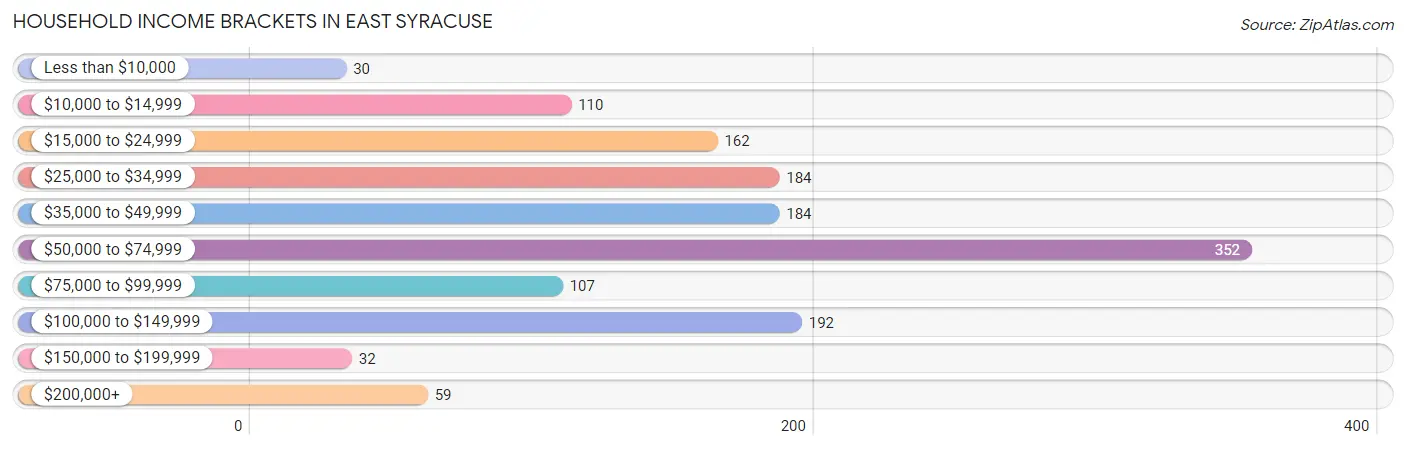
| Income Bracket | # Households | % Households |
| Less than $10,000 | 30 | 2.1% |
| $10,000 to $14,999 | 110 | 7.8% |
| $15,000 to $24,999 | 162 | 11.5% |
| $25,000 to $34,999 | 184 | 13.0% |
| $35,000 to $49,999 | 184 | 13.0% |
| $50,000 to $74,999 | 352 | 24.9% |
| $75,000 to $99,999 | 107 | 7.6% |
| $100,000 to $149,999 | 192 | 13.6% |
| $150,000 to $199,999 | 32 | 2.3% |
| $200,000+ | 59 | 4.2% |
Household Income by Householder Age in East Syracuse
The median household income in East Syracuse is $52,794, with the highest median household income of $70,788 found in the 25 to 44 years age bracket for the primary householder. A total of 462 households (32.7%) fall into this category.
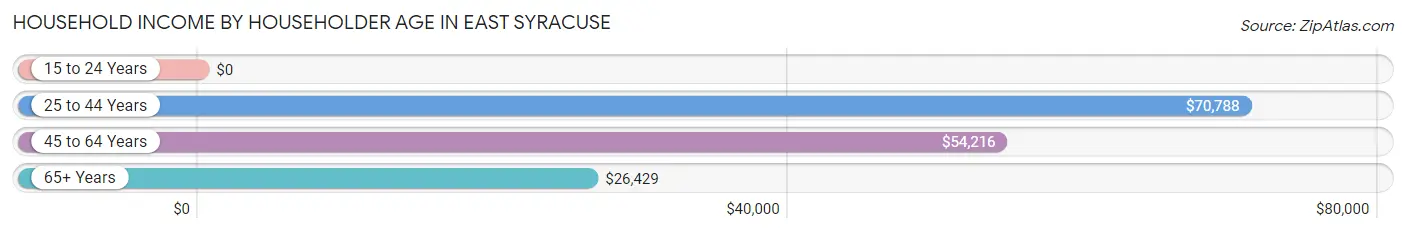
| Income Bracket | # Households | Median Income |
| 15 to 24 Years | 0 (0.0%) | $0 |
| 25 to 44 Years | 462 (32.7%) | $70,788 |
| 45 to 64 Years | 622 (44.1%) | $54,216 |
| 65+ Years | 328 (23.2%) | $26,429 |
| Total | 1,412 (100.0%) | $52,794 |
Poverty in East Syracuse
Income Below Poverty by Sex and Age in East Syracuse
With 10.1% poverty level for males and 10.4% for females among the residents of East Syracuse, 5 year old males and 75 year old and over females are the most vulnerable to poverty, with 18 males (100.0%) and 20 females (29.4%) in their respective age groups living below the poverty level.
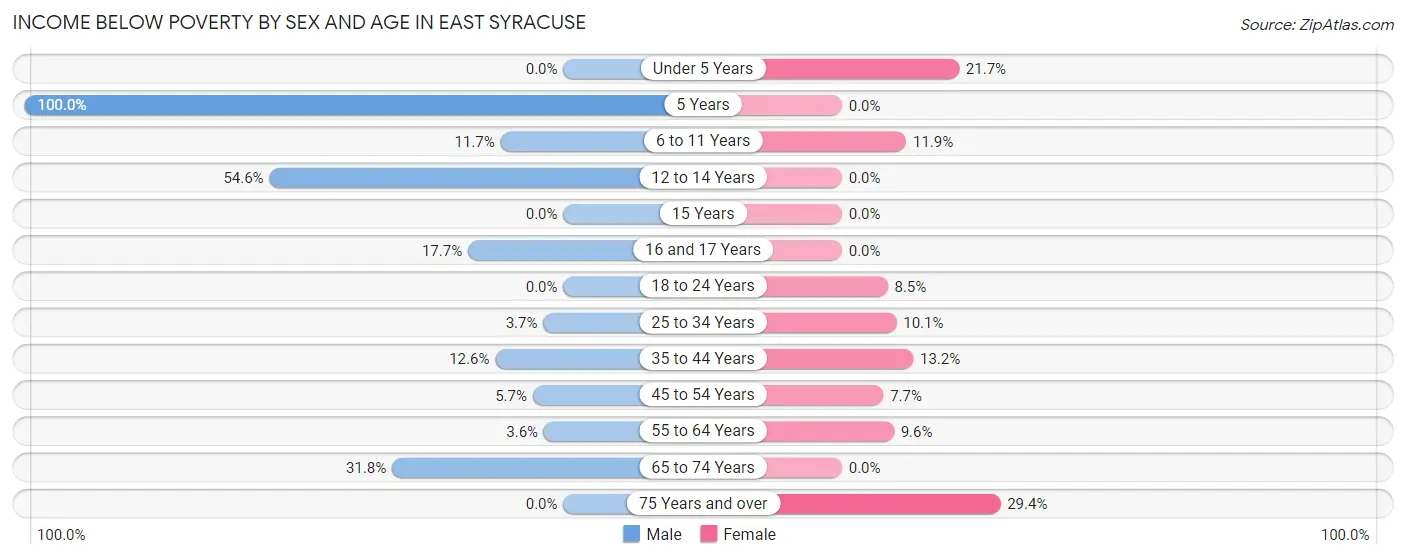
| Age Bracket | Male | Female |
| Under 5 Years | 0 (0.0%) | 10 (21.7%) |
| 5 Years | 18 (100.0%) | 0 (0.0%) |
| 6 to 11 Years | 12 (11.7%) | 13 (11.9%) |
| 12 to 14 Years | 18 (54.5%) | 0 (0.0%) |
| 15 Years | 0 (0.0%) | 0 (0.0%) |
| 16 and 17 Years | 20 (17.7%) | 0 (0.0%) |
| 18 to 24 Years | 0 (0.0%) | 9 (8.5%) |
| 25 to 34 Years | 9 (3.7%) | 25 (10.1%) |
| 35 to 44 Years | 22 (12.6%) | 25 (13.2%) |
| 45 to 54 Years | 14 (5.7%) | 12 (7.7%) |
| 55 to 64 Years | 12 (3.6%) | 32 (9.6%) |
| 65 to 74 Years | 41 (31.8%) | 0 (0.0%) |
| 75 Years and over | 0 (0.0%) | 20 (29.4%) |
| Total | 166 (10.1%) | 146 (10.4%) |
Income Above Poverty by Sex and Age in East Syracuse
According to the poverty statistics in East Syracuse, males aged under 5 years and females aged 12 to 14 years are the age groups that are most secure financially, with 100.0% of males and 100.0% of females in these age groups living above the poverty line.
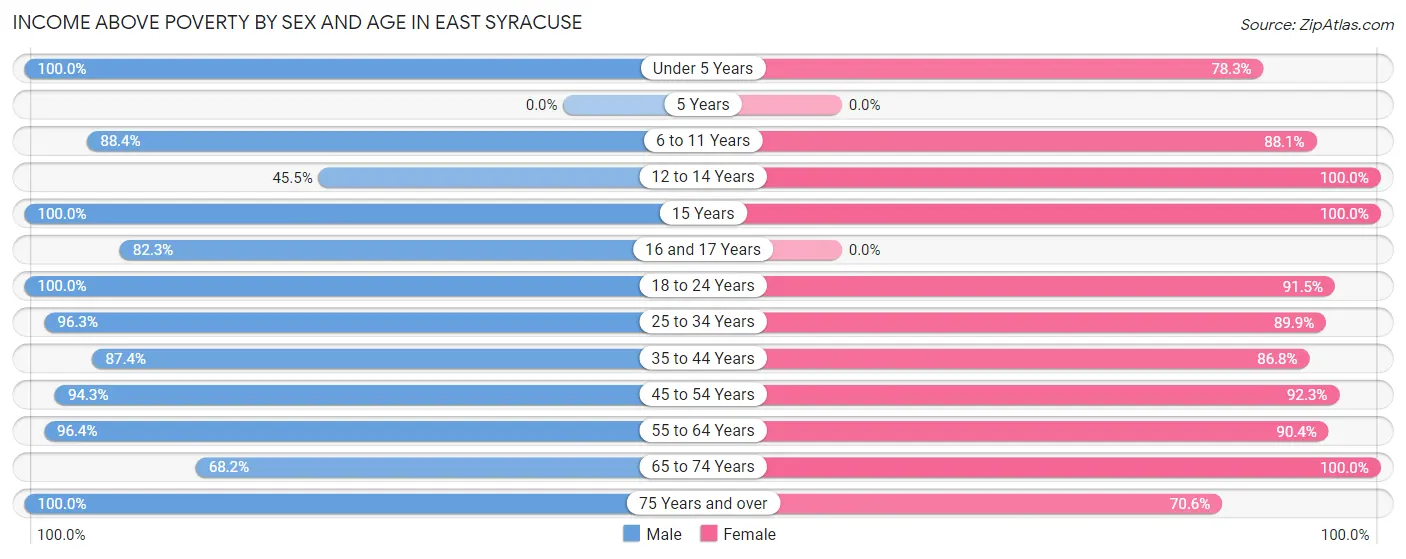
| Age Bracket | Male | Female |
| Under 5 Years | 27 (100.0%) | 36 (78.3%) |
| 5 Years | 0 (0.0%) | 0 (0.0%) |
| 6 to 11 Years | 91 (88.3%) | 96 (88.1%) |
| 12 to 14 Years | 15 (45.5%) | 12 (100.0%) |
| 15 Years | 15 (100.0%) | 7 (100.0%) |
| 16 and 17 Years | 93 (82.3%) | 0 (0.0%) |
| 18 to 24 Years | 108 (100.0%) | 97 (91.5%) |
| 25 to 34 Years | 233 (96.3%) | 222 (89.9%) |
| 35 to 44 Years | 152 (87.4%) | 164 (86.8%) |
| 45 to 54 Years | 233 (94.3%) | 144 (92.3%) |
| 55 to 64 Years | 320 (96.4%) | 300 (90.4%) |
| 65 to 74 Years | 88 (68.2%) | 128 (100.0%) |
| 75 Years and over | 107 (100.0%) | 48 (70.6%) |
| Total | 1,482 (89.9%) | 1,254 (89.6%) |
Income Below Poverty Among Married-Couple Families in East Syracuse
The poverty statistics for married-couple families in East Syracuse show that 2.1% or 9 of the total 437 families live below the poverty line. Families with 1 or 2 children have the highest poverty rate of 4.9%, comprising of 8 families. On the other hand, families with 3 or 4 children have the lowest poverty rate of 0.0%, which includes 0 families.
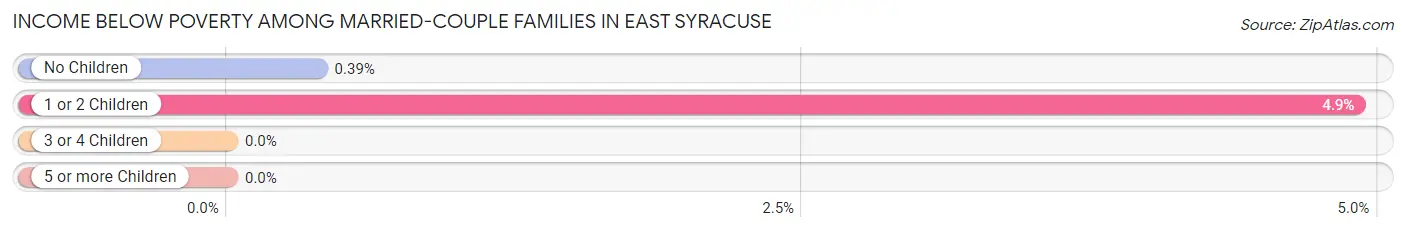
| Children | Above Poverty | Below Poverty |
| No Children | 256 (99.6%) | 1 (0.4%) |
| 1 or 2 Children | 155 (95.1%) | 8 (4.9%) |
| 3 or 4 Children | 17 (100.0%) | 0 (0.0%) |
| 5 or more Children | 0 (0.0%) | 0 (0.0%) |
| Total | 428 (97.9%) | 9 (2.1%) |
Income Below Poverty Among Single-Parent Households in East Syracuse
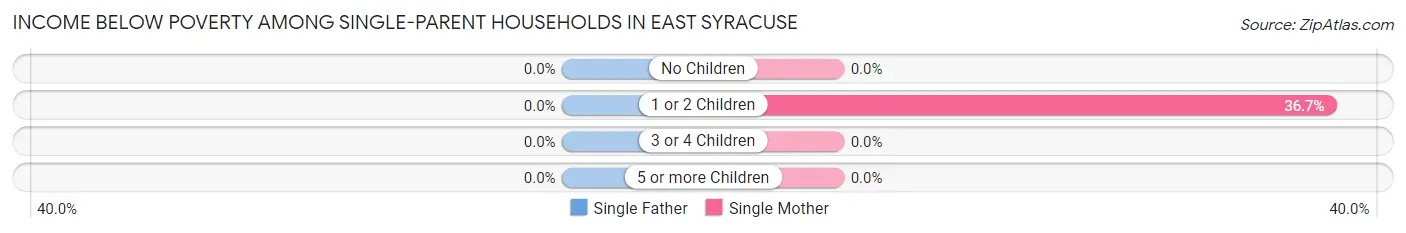
| Children | Single Father | Single Mother |
| No Children | 0 (0.0%) | 0 (0.0%) |
| 1 or 2 Children | 0 (0.0%) | 40 (36.7%) |
| 3 or 4 Children | 0 (0.0%) | 0 (0.0%) |
| 5 or more Children | 0 (0.0%) | 0 (0.0%) |
| Total | 0 (0.0%) | 40 (28.0%) |
Income Below Poverty Among Married-Couple vs Single-Parent Households in East Syracuse
The poverty data for East Syracuse shows that 9 of the married-couple family households (2.1%) and 40 of the single-parent households (16.4%) are living below the poverty level. Within the married-couple family households, those with 1 or 2 children have the highest poverty rate, with 8 households (4.9%) falling below the poverty line. Among the single-parent households, those with 1 or 2 children have the highest poverty rate, with 40 household (27.0%) living below poverty.
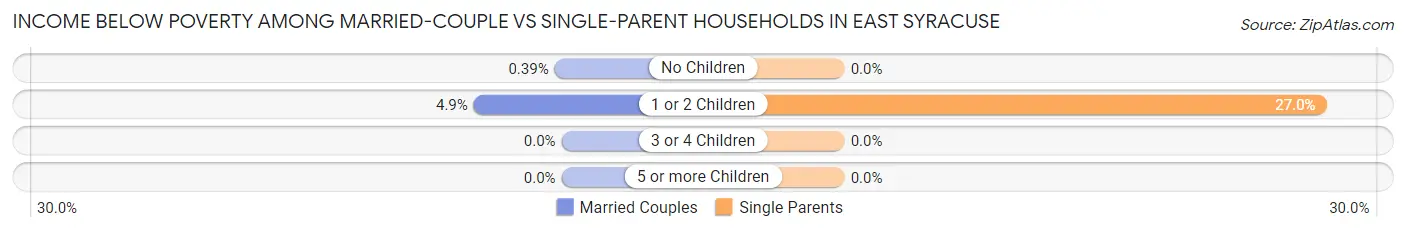
| Children | Married-Couple Families | Single-Parent Households |
| No Children | 1 (0.4%) | 0 (0.0%) |
| 1 or 2 Children | 8 (4.9%) | 40 (27.0%) |
| 3 or 4 Children | 0 (0.0%) | 0 (0.0%) |
| 5 or more Children | 0 (0.0%) | 0 (0.0%) |
| Total | 9 (2.1%) | 40 (16.4%) |
Race in East Syracuse
The most populous races in East Syracuse are White / Caucasian (2,777 | 90.6%), Two or more Races (152 | 5.0%), and Hispanic or Latino (119 | 3.9%).
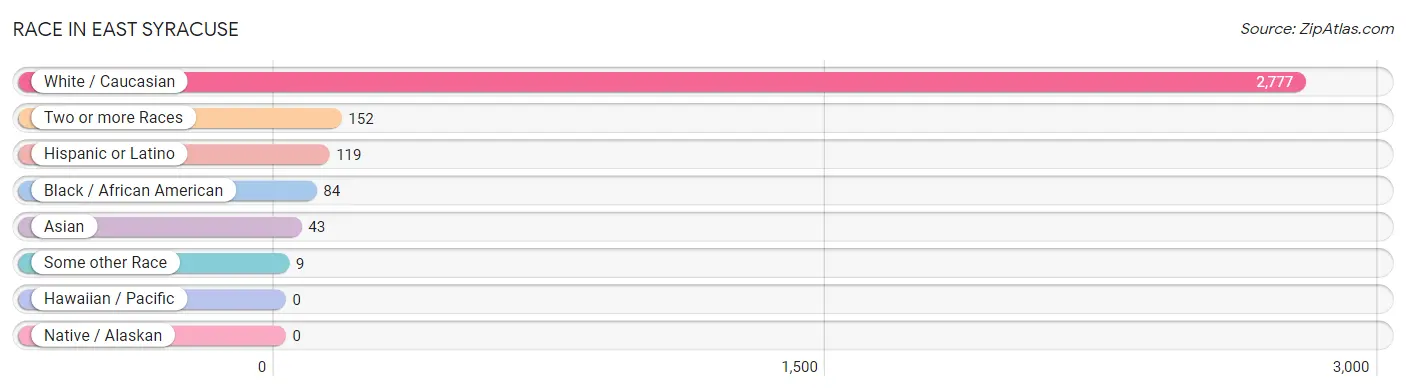
| Race | # Population | % Population |
| Asian | 43 | 1.4% |
| Black / African American | 84 | 2.7% |
| Hawaiian / Pacific | 0 | 0.0% |
| Hispanic or Latino | 119 | 3.9% |
| Native / Alaskan | 0 | 0.0% |
| White / Caucasian | 2,777 | 90.6% |
| Two or more Races | 152 | 5.0% |
| Some other Race | 9 | 0.3% |
| Total | 3,065 | 100.0% |
Ancestry in East Syracuse
The most populous ancestries reported in East Syracuse are Irish (628 | 20.5%), German (345 | 11.3%), Italian (344 | 11.2%), English (321 | 10.5%), and Yugoslavian (256 | 8.4%), together accounting for 61.8% of all East Syracuse residents.
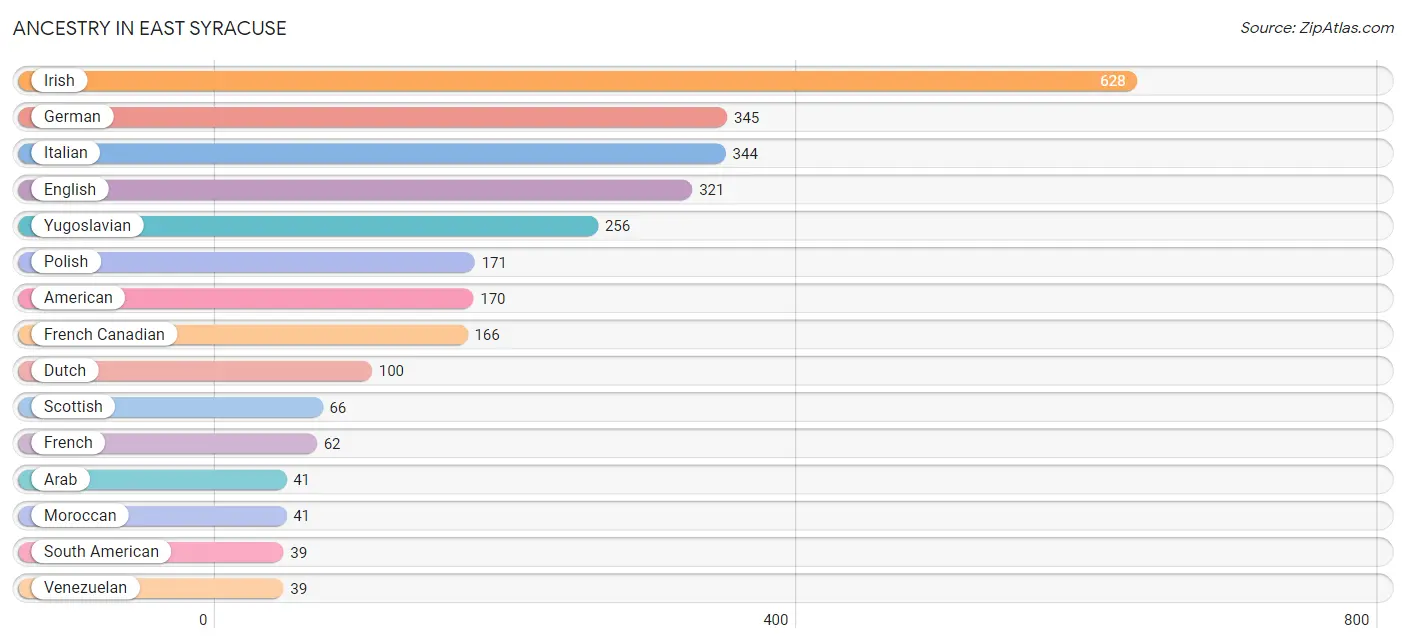
| Ancestry | # Population | % Population |
| American | 170 | 5.6% |
| Arab | 41 | 1.3% |
| Bhutanese | 17 | 0.5% |
| Celtic | 21 | 0.7% |
| Cuban | 37 | 1.2% |
| Dutch | 100 | 3.3% |
| English | 321 | 10.5% |
| French | 62 | 2.0% |
| French Canadian | 166 | 5.4% |
| German | 345 | 11.3% |
| Indian (Asian) | 4 | 0.1% |
| Irish | 628 | 20.5% |
| Iroquois | 11 | 0.4% |
| Italian | 344 | 11.2% |
| Lithuanian | 23 | 0.7% |
| Mexican | 18 | 0.6% |
| Moroccan | 41 | 1.3% |
| Norwegian | 16 | 0.5% |
| Polish | 171 | 5.6% |
| Portuguese | 25 | 0.8% |
| Puerto Rican | 25 | 0.8% |
| Russian | 7 | 0.2% |
| Scottish | 66 | 2.1% |
| Slovak | 9 | 0.3% |
| South American | 39 | 1.3% |
| Swedish | 17 | 0.5% |
| Thai | 12 | 0.4% |
| Ukrainian | 7 | 0.2% |
| Venezuelan | 39 | 1.3% |
| Yugoslavian | 256 | 8.4% | View All 30 Rows |
Immigrants in East Syracuse
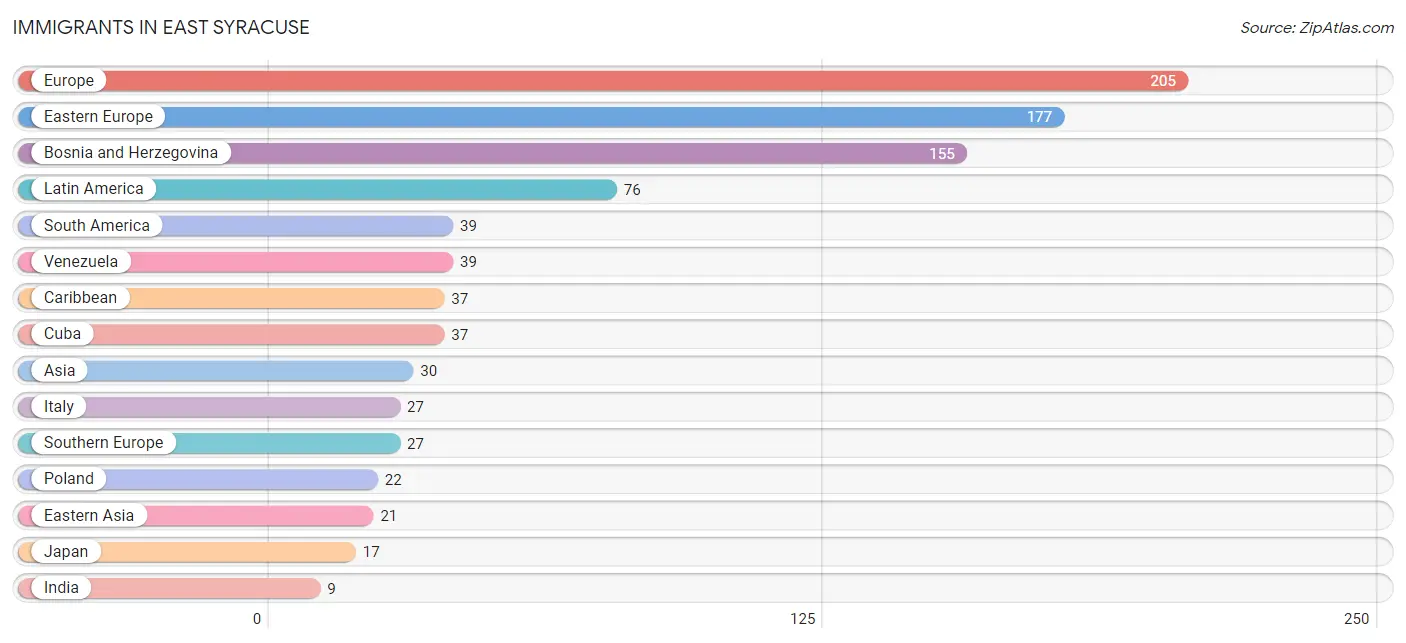
The most numerous immigrant groups reported in East Syracuse came from Europe (205 | 6.7%), Eastern Europe (177 | 5.8%), Bosnia and Herzegovina (155 | 5.1%), Latin America (76 | 2.5%), and South America (39 | 1.3%), together accounting for 21.3% of all East Syracuse residents.
| Immigration Origin | # Population | % Population |
| Asia | 30 | 1.0% |
| Bosnia and Herzegovina | 155 | 5.1% |
| Caribbean | 37 | 1.2% |
| China | 4 | 0.1% |
| Cuba | 37 | 1.2% |
| Eastern Asia | 21 | 0.7% |
| Eastern Europe | 177 | 5.8% |
| Europe | 205 | 6.7% |
| Germany | 1 | 0.0% |
| India | 9 | 0.3% |
| Italy | 27 | 0.9% |
| Japan | 17 | 0.5% |
| Latin America | 76 | 2.5% |
| Poland | 22 | 0.7% |
| South America | 39 | 1.3% |
| South Central Asia | 9 | 0.3% |
| Southern Europe | 27 | 0.9% |
| Venezuela | 39 | 1.3% |
| Western Europe | 1 | 0.0% | View All 19 Rows |
Sex and Age in East Syracuse
Sex and Age in East Syracuse
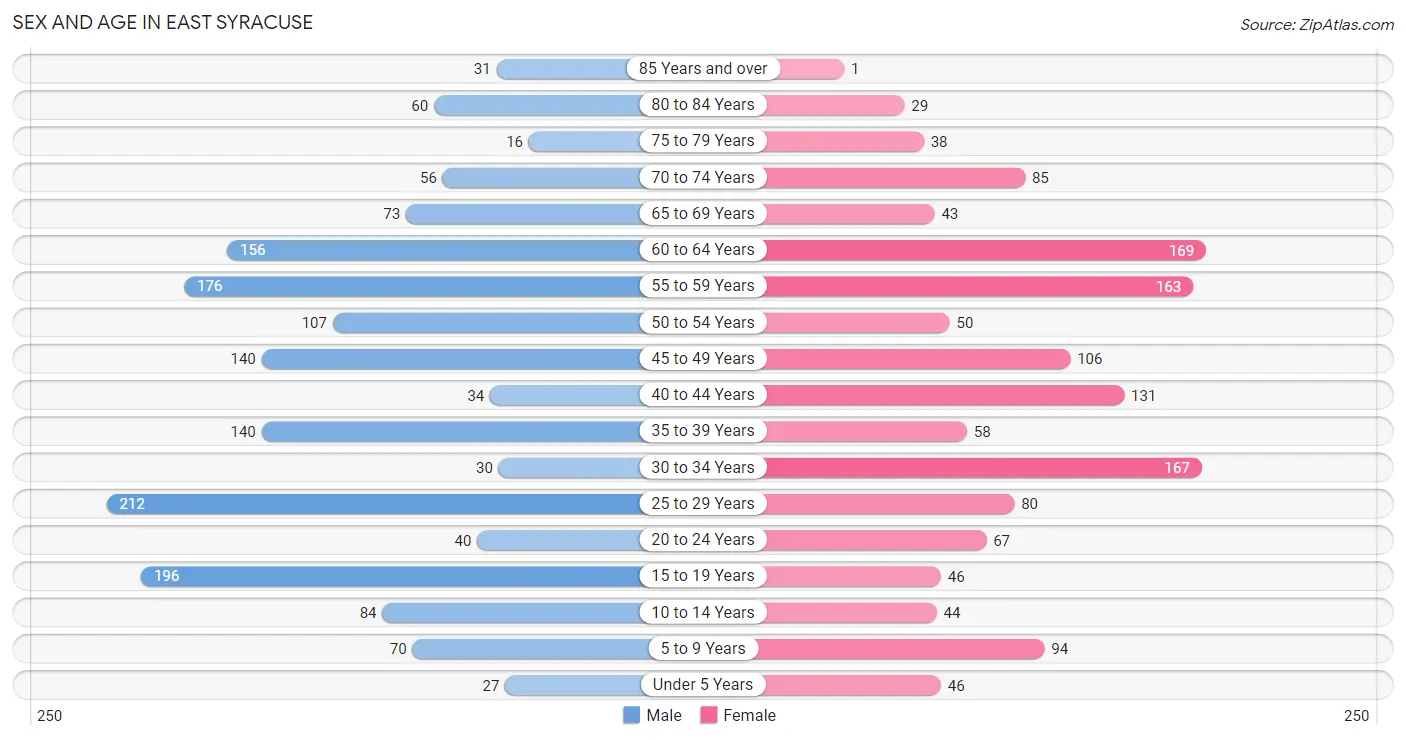
The most populous age groups in East Syracuse are 25 to 29 Years (212 | 12.9%) for men and 60 to 64 Years (169 | 11.9%) for women.
| Age Bracket | Male | Female |
| Under 5 Years | 27 (1.6%) | 46 (3.3%) |
| 5 to 9 Years | 70 (4.3%) | 94 (6.6%) |
| 10 to 14 Years | 84 (5.1%) | 44 (3.1%) |
| 15 to 19 Years | 196 (11.9%) | 46 (3.3%) |
| 20 to 24 Years | 40 (2.4%) | 67 (4.7%) |
| 25 to 29 Years | 212 (12.9%) | 80 (5.7%) |
| 30 to 34 Years | 30 (1.8%) | 167 (11.8%) |
| 35 to 39 Years | 140 (8.5%) | 58 (4.1%) |
| 40 to 44 Years | 34 (2.1%) | 131 (9.2%) |
| 45 to 49 Years | 140 (8.5%) | 106 (7.5%) |
| 50 to 54 Years | 107 (6.5%) | 50 (3.5%) |
| 55 to 59 Years | 176 (10.7%) | 163 (11.5%) |
| 60 to 64 Years | 156 (9.5%) | 169 (11.9%) |
| 65 to 69 Years | 73 (4.4%) | 43 (3.0%) |
| 70 to 74 Years | 56 (3.4%) | 85 (6.0%) |
| 75 to 79 Years | 16 (1.0%) | 38 (2.7%) |
| 80 to 84 Years | 60 (3.6%) | 29 (2.1%) |
| 85 Years and over | 31 (1.9%) | 1 (0.1%) |
| Total | 1,648 (100.0%) | 1,417 (100.0%) |
Families and Households in East Syracuse
Median Family Size in East Syracuse
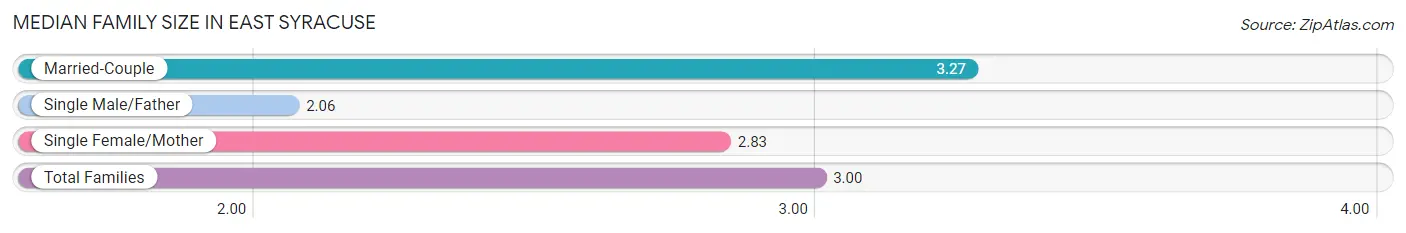
The median family size in East Syracuse is 3.00 persons per family, with married-couple families (437 | 64.2%) accounting for the largest median family size of 3.27 persons per family. On the other hand, single male/father families (101 | 14.8%) represent the smallest median family size with 2.06 persons per family.
| Family Type | # Families | Family Size |
| Married-Couple | 437 (64.2%) | 3.27 |
| Single Male/Father | 101 (14.8%) | 2.06 |
| Single Female/Mother | 143 (21.0%) | 2.83 |
| Total Families | 681 (100.0%) | 3.00 |
Median Household Size in East Syracuse
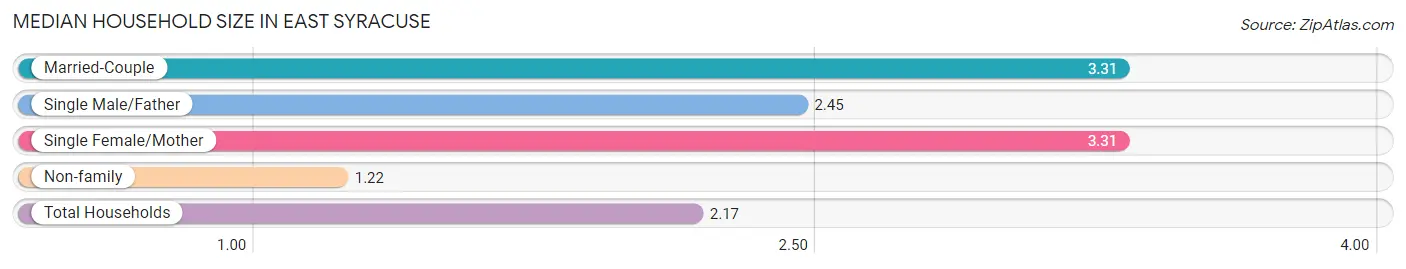
The median household size in East Syracuse is 2.17 persons per household, with married-couple households (437 | 30.9%) accounting for the largest median household size of 3.31 persons per household. non-family households (731 | 51.8%) represent the smallest median household size with 1.22 persons per household.
| Household Type | # Households | Household Size |
| Married-Couple | 437 (30.9%) | 3.31 |
| Single Male/Father | 101 (7.1%) | 2.45 |
| Single Female/Mother | 143 (10.1%) | 3.31 |
| Non-family | 731 (51.8%) | 1.22 |
| Total Households | 1,412 (100.0%) | 2.17 |
Household Size by Marriage Status in East Syracuse
Out of a total of 1,412 households in East Syracuse, 681 (48.2%) are family households, while 731 (51.8%) are nonfamily households. The most numerous type of family households are 2-person households, comprising 289, and the most common type of nonfamily households are 1-person households, comprising 543.
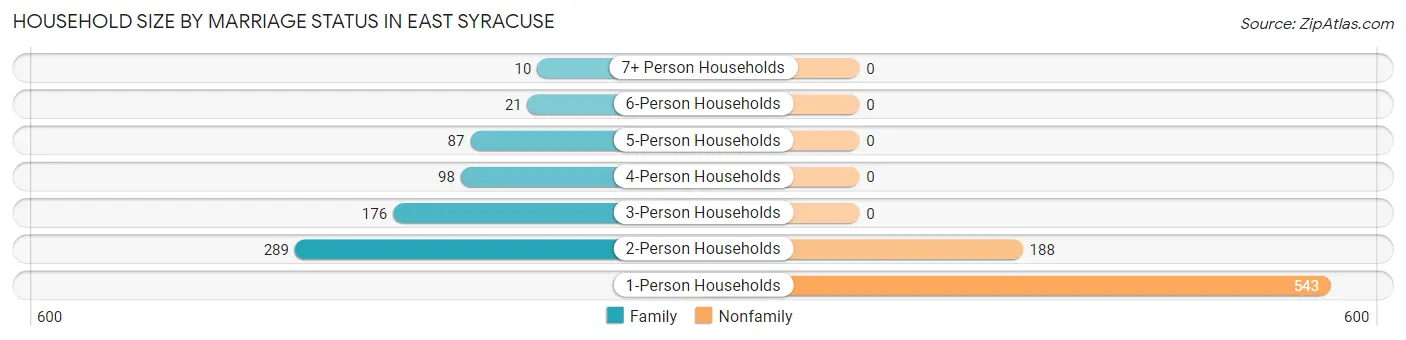
| Household Size | Family Households | Nonfamily Households |
| 1-Person Households | - | 543 (38.5%) |
| 2-Person Households | 289 (20.5%) | 188 (13.3%) |
| 3-Person Households | 176 (12.5%) | 0 (0.0%) |
| 4-Person Households | 98 (6.9%) | 0 (0.0%) |
| 5-Person Households | 87 (6.2%) | 0 (0.0%) |
| 6-Person Households | 21 (1.5%) | 0 (0.0%) |
| 7+ Person Households | 10 (0.7%) | 0 (0.0%) |
| Total | 681 (48.2%) | 731 (51.8%) |
Female Fertility in East Syracuse
Fertility by Age in East Syracuse
Average fertility rate in East Syracuse is 71.0 births per 1,000 women. Women in the age bracket of 20 to 34 years have the highest fertility rate with 124.0 births per 1,000 women. Women in the age bracket of 20 to 34 years acount for 81.2% of all women with births.
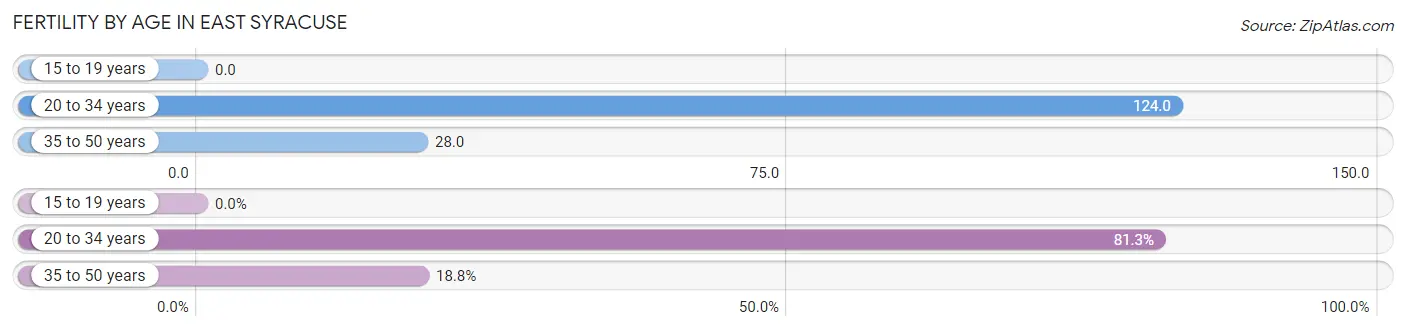
| Age Bracket | Women with Births | Births / 1,000 Women |
| 15 to 19 years | 0 (0.0%) | 0.0 |
| 20 to 34 years | 39 (81.2%) | 124.0 |
| 35 to 50 years | 9 (18.8%) | 28.0 |
| Total | 48 (100.0%) | 71.0 |
Fertility by Age by Marriage Status in East Syracuse
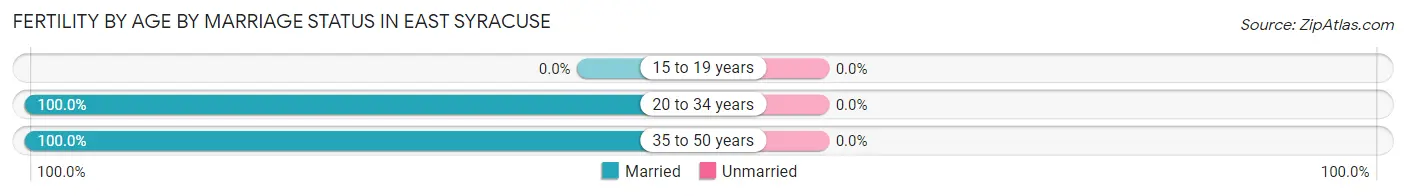
| Age Bracket | Married | Unmarried |
| 15 to 19 years | 0 (0.0%) | 0 (0.0%) |
| 20 to 34 years | 39 (100.0%) | 0 (0.0%) |
| 35 to 50 years | 9 (100.0%) | 0 (0.0%) |
| Total | 48 (100.0%) | 0 (0.0%) |
Fertility by Education in East Syracuse
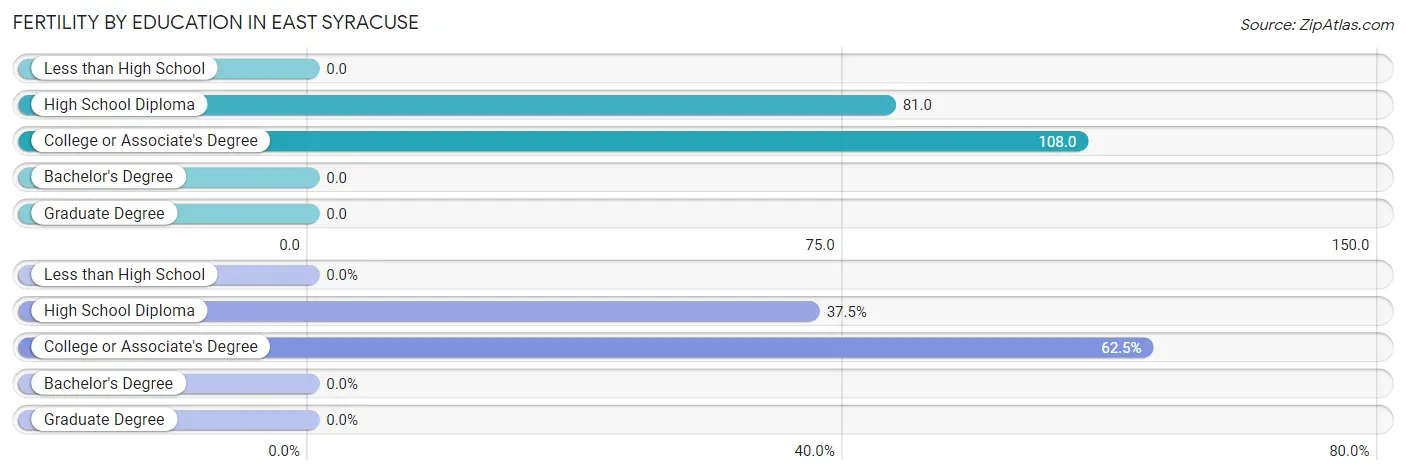
| Educational Attainment | Women with Births | Births / 1,000 Women |
| Less than High School | 0 (0.0%) | 0.0 |
| High School Diploma | 18 (37.5%) | 81.0 |
| College or Associate's Degree | 30 (62.5%) | 108.0 |
| Bachelor's Degree | 0 (0.0%) | 0.0 |
| Graduate Degree | 0 (0.0%) | 0.0 |
| Total | 48 (100.0%) | 71.0 |
Fertility by Education by Marriage Status in East Syracuse
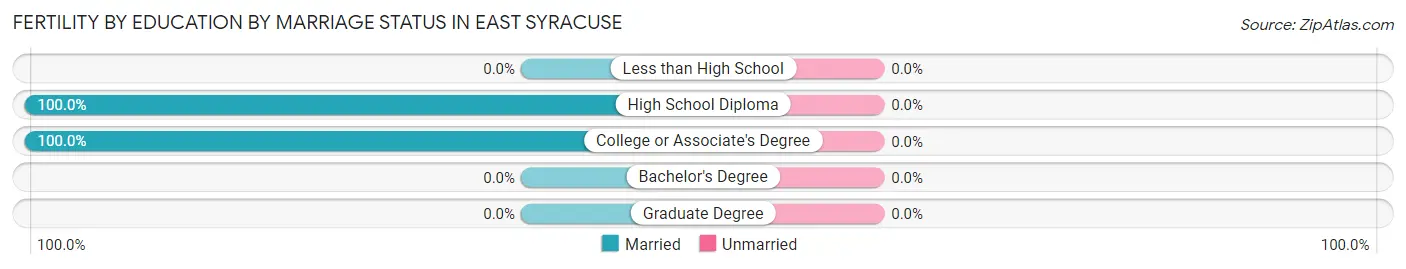
| Educational Attainment | Married | Unmarried |
| Less than High School | 0 (0.0%) | 0 (0.0%) |
| High School Diploma | 18 (100.0%) | 0 (0.0%) |
| College or Associate's Degree | 30 (100.0%) | 0 (0.0%) |
| Bachelor's Degree | 0 (0.0%) | 0 (0.0%) |
| Graduate Degree | 0 (0.0%) | 0 (0.0%) |
| Total | 48 (100.0%) | 0 (0.0%) |
Employment Characteristics in East Syracuse
Employment by Class of Employer in East Syracuse
Among the 1,636 employed individuals in East Syracuse, private company employees (1,158 | 70.8%), not-for-profit organizations (145 | 8.9%), and local government employees (104 | 6.4%) make up the most common classes of employment.
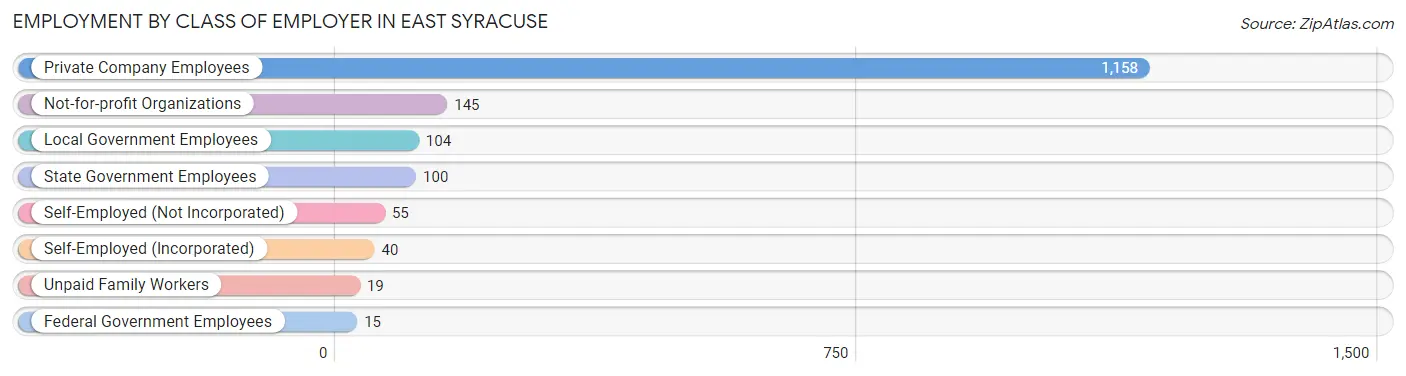
| Employer Class | # Employees | % Employees |
| Private Company Employees | 1,158 | 70.8% |
| Self-Employed (Incorporated) | 40 | 2.4% |
| Self-Employed (Not Incorporated) | 55 | 3.4% |
| Not-for-profit Organizations | 145 | 8.9% |
| Local Government Employees | 104 | 6.4% |
| State Government Employees | 100 | 6.1% |
| Federal Government Employees | 15 | 0.9% |
| Unpaid Family Workers | 19 | 1.2% |
| Total | 1,636 | 100.0% |
Employment Status by Age in East Syracuse
According to the labor force statistics for East Syracuse, out of the total population over 16 years of age (2,678), 63.6% or 1,703 individuals are in the labor force, with 1.6% or 27 of them unemployed. The age group with the highest labor force participation rate is 25 to 29 years, with 100.0% or 292 individuals in the labor force. Within the labor force, the 30 to 34 years age range has the highest percentage of unemployed individuals, with 8.7% or 15 of them being unemployed.
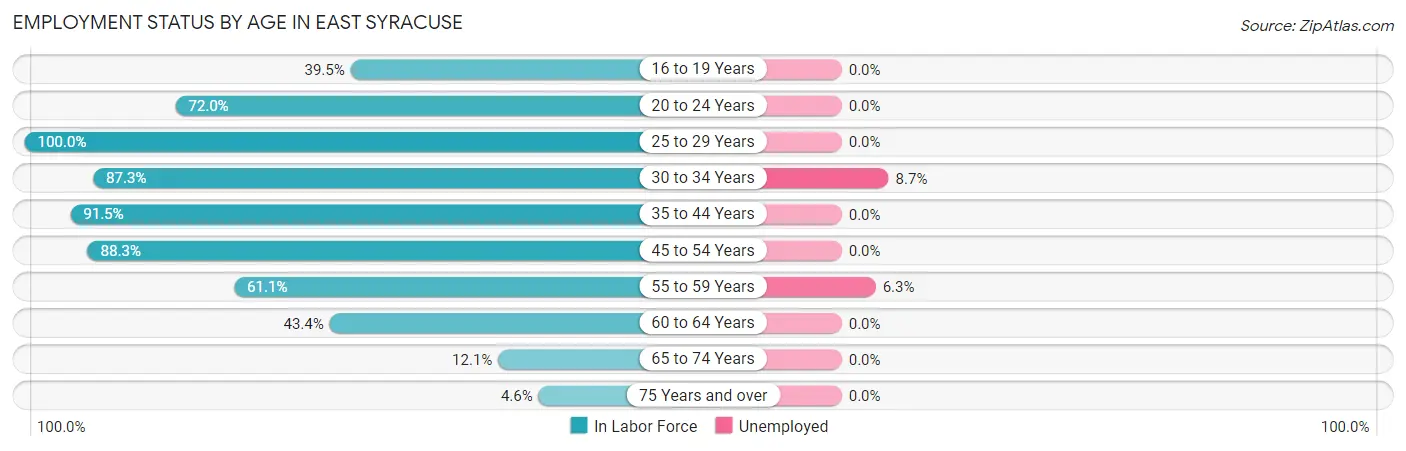
| Age Bracket | In Labor Force | Unemployed |
| 16 to 19 Years | 87 (39.5%) | 0 (0.0%) |
| 20 to 24 Years | 77 (72.0%) | 0 (0.0%) |
| 25 to 29 Years | 292 (100.0%) | 0 (0.0%) |
| 30 to 34 Years | 172 (87.3%) | 15 (8.7%) |
| 35 to 44 Years | 332 (91.5%) | 0 (0.0%) |
| 45 to 54 Years | 356 (88.3%) | 0 (0.0%) |
| 55 to 59 Years | 207 (61.1%) | 13 (6.3%) |
| 60 to 64 Years | 141 (43.4%) | 0 (0.0%) |
| 65 to 74 Years | 31 (12.1%) | 0 (0.0%) |
| 75 Years and over | 8 (4.6%) | 0 (0.0%) |
| Total | 1,703 (63.6%) | 27 (1.6%) |
Employment Status by Educational Attainment in East Syracuse
According to labor force statistics for East Syracuse, 78.2% of individuals (1,501) out of the total population between 25 and 64 years of age (1,919) are in the labor force, with 1.9% or 29 of them being unemployed. The group with the highest labor force participation rate are those with the educational attainment of college / associate degree, with 87.5% or 673 individuals in the labor force. Within the labor force, individuals with high school diploma education have the highest percentage of unemployment, with 2.8% or 13 of them being unemployed.
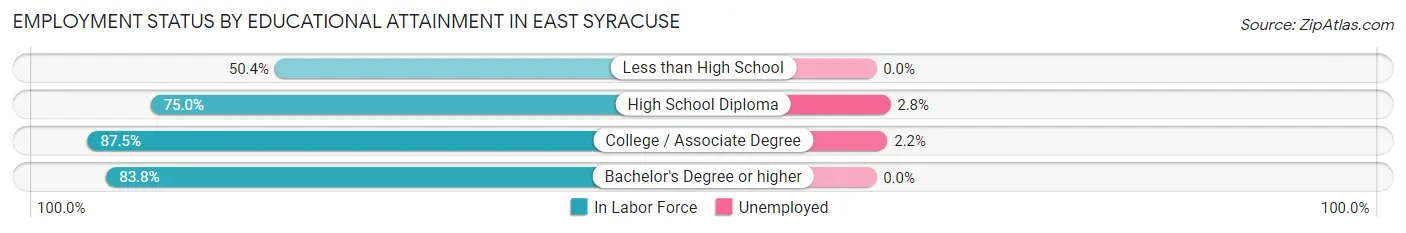
| Educational Attainment | In Labor Force | Unemployed |
| Less than High School | 125 (50.4%) | 0 (0.0%) |
| High School Diploma | 459 (75.0%) | 17 (2.8%) |
| College / Associate Degree | 673 (87.5%) | 17 (2.2%) |
| Bachelor's Degree or higher | 243 (83.8%) | 0 (0.0%) |
| Total | 1,501 (78.2%) | 36 (1.9%) |
Employment Occupations by Sex in East Syracuse
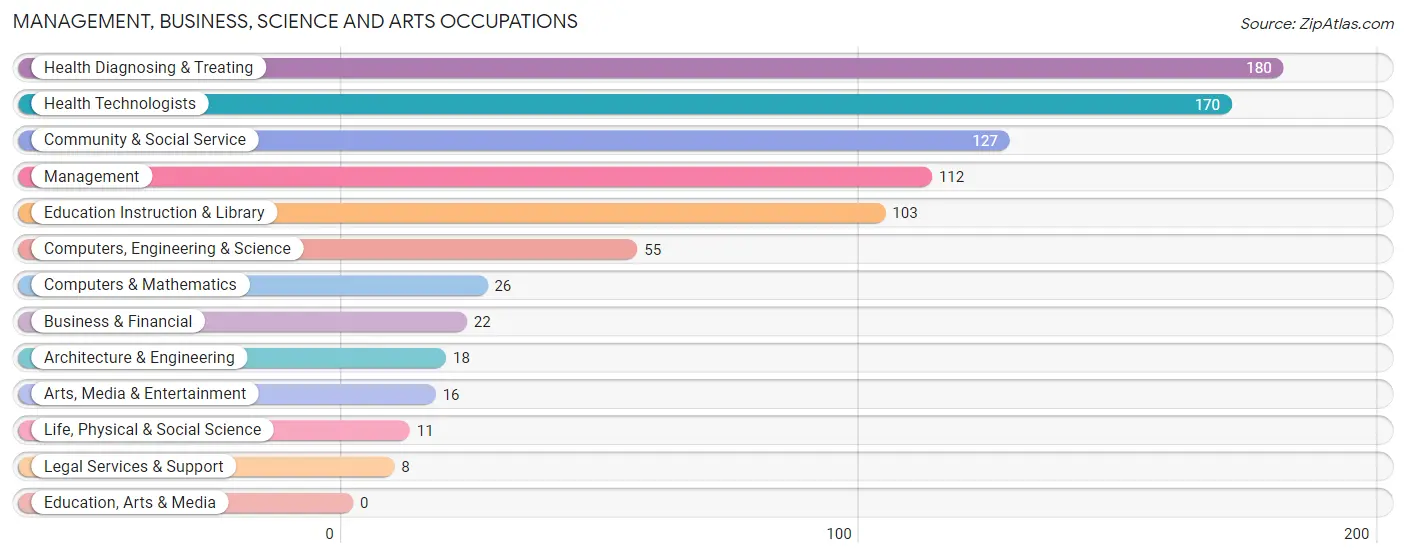
Management, Business, Science and Arts Occupations
The most common Management, Business, Science and Arts occupations in East Syracuse are Health Diagnosing & Treating (180 | 10.7%), Health Technologists (170 | 10.2%), Community & Social Service (127 | 7.6%), Management (112 | 6.7%), and Education Instruction & Library (103 | 6.1%).
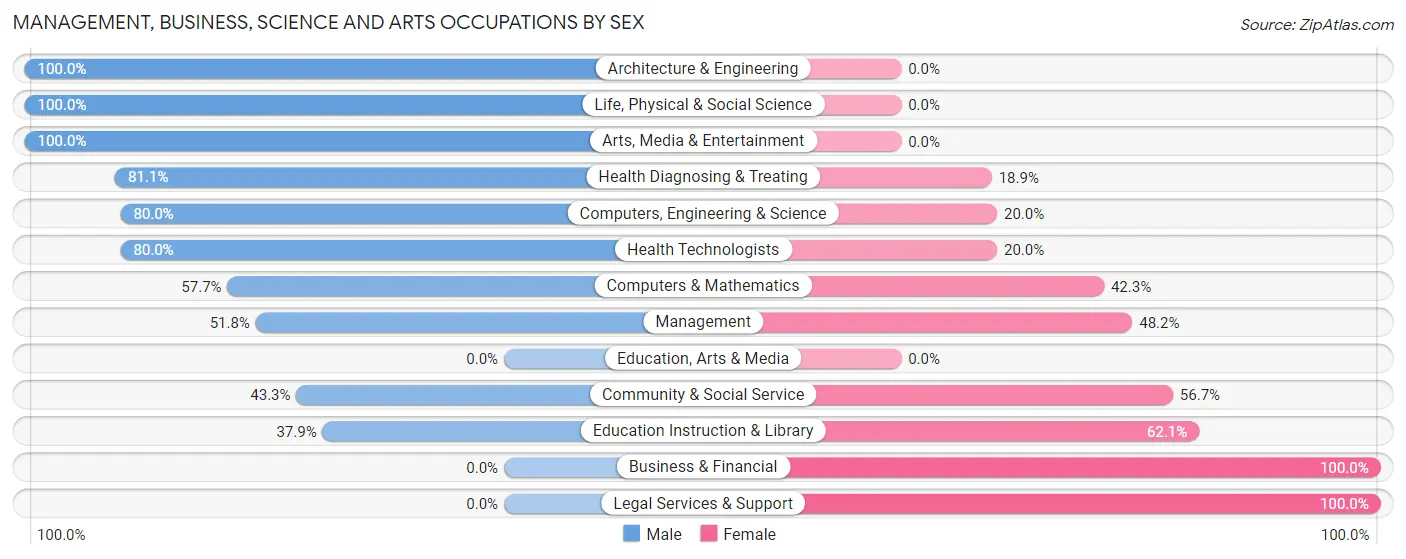
Management, Business, Science and Arts Occupations by Sex
Within the Management, Business, Science and Arts occupations in East Syracuse, the most male-oriented occupations are Architecture & Engineering (100.0%), Life, Physical & Social Science (100.0%), and Arts, Media & Entertainment (100.0%), while the most female-oriented occupations are Business & Financial (100.0%), Legal Services & Support (100.0%), and Education Instruction & Library (62.1%).
| Occupation | Male | Female |
| Management | 58 (51.8%) | 54 (48.2%) |
| Business & Financial | 0 (0.0%) | 22 (100.0%) |
| Computers, Engineering & Science | 44 (80.0%) | 11 (20.0%) |
| Computers & Mathematics | 15 (57.7%) | 11 (42.3%) |
| Architecture & Engineering | 18 (100.0%) | 0 (0.0%) |
| Life, Physical & Social Science | 11 (100.0%) | 0 (0.0%) |
| Community & Social Service | 55 (43.3%) | 72 (56.7%) |
| Education, Arts & Media | 0 (0.0%) | 0 (0.0%) |
| Legal Services & Support | 0 (0.0%) | 8 (100.0%) |
| Education Instruction & Library | 39 (37.9%) | 64 (62.1%) |
| Arts, Media & Entertainment | 16 (100.0%) | 0 (0.0%) |
| Health Diagnosing & Treating | 146 (81.1%) | 34 (18.9%) |
| Health Technologists | 136 (80.0%) | 34 (20.0%) |
| Total (Category) | 303 (61.1%) | 193 (38.9%) |
| Total (Overall) | 958 (57.2%) | 717 (42.8%) |
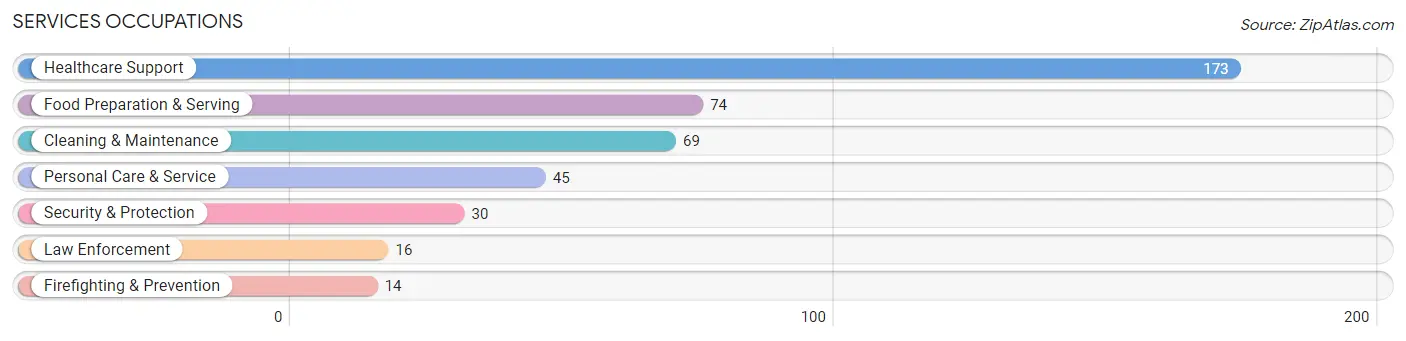
Services Occupations
The most common Services occupations in East Syracuse are Healthcare Support (173 | 10.3%), Food Preparation & Serving (74 | 4.4%), Cleaning & Maintenance (69 | 4.1%), Personal Care & Service (45 | 2.7%), and Security & Protection (30 | 1.8%).
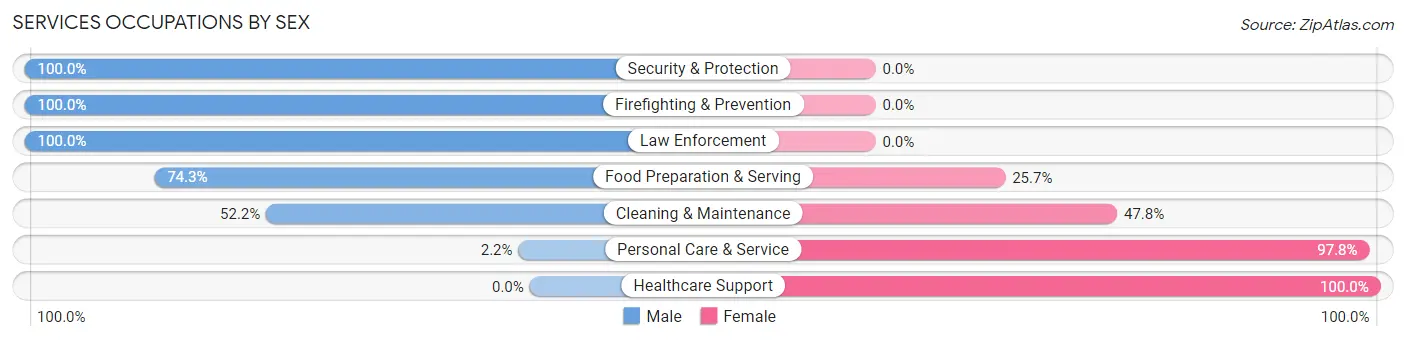
Services Occupations by Sex
Within the Services occupations in East Syracuse, the most male-oriented occupations are Security & Protection (100.0%), Firefighting & Prevention (100.0%), and Law Enforcement (100.0%), while the most female-oriented occupations are Healthcare Support (100.0%), Personal Care & Service (97.8%), and Cleaning & Maintenance (47.8%).
| Occupation | Male | Female |
| Healthcare Support | 0 (0.0%) | 173 (100.0%) |
| Security & Protection | 30 (100.0%) | 0 (0.0%) |
| Firefighting & Prevention | 14 (100.0%) | 0 (0.0%) |
| Law Enforcement | 16 (100.0%) | 0 (0.0%) |
| Food Preparation & Serving | 55 (74.3%) | 19 (25.7%) |
| Cleaning & Maintenance | 36 (52.2%) | 33 (47.8%) |
| Personal Care & Service | 1 (2.2%) | 44 (97.8%) |
| Total (Category) | 122 (31.2%) | 269 (68.8%) |
| Total (Overall) | 958 (57.2%) | 717 (42.8%) |
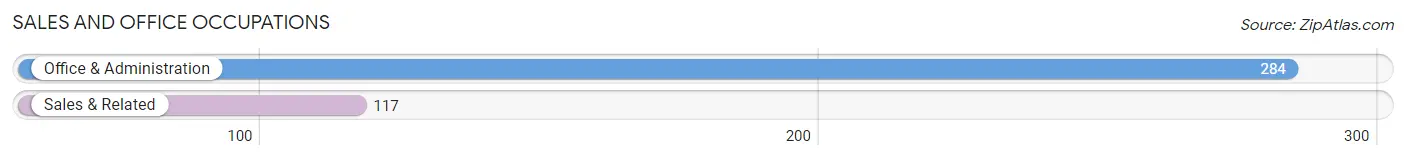
Sales and Office Occupations
The most common Sales and Office occupations in East Syracuse are Office & Administration (284 | 17.0%), and Sales & Related (117 | 7.0%).
Sales and Office Occupations by Sex
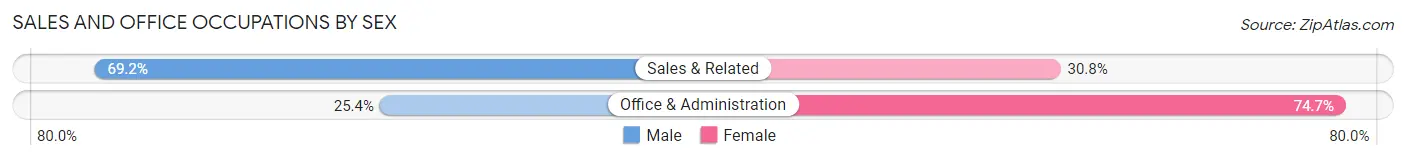
| Occupation | Male | Female |
| Sales & Related | 81 (69.2%) | 36 (30.8%) |
| Office & Administration | 72 (25.4%) | 212 (74.7%) |
| Total (Category) | 153 (38.2%) | 248 (61.9%) |
| Total (Overall) | 958 (57.2%) | 717 (42.8%) |
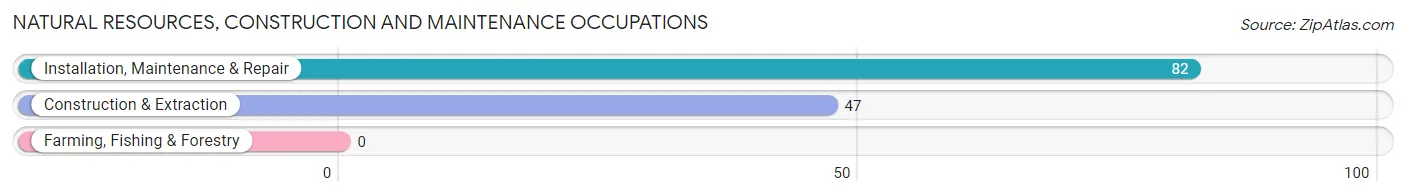
Natural Resources, Construction and Maintenance Occupations
The most common Natural Resources, Construction and Maintenance occupations in East Syracuse are Installation, Maintenance & Repair (82 | 4.9%), and Construction & Extraction (47 | 2.8%).
Natural Resources, Construction and Maintenance Occupations by Sex
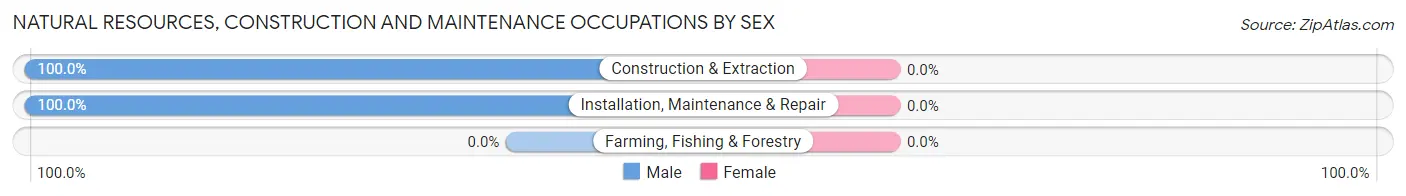
| Occupation | Male | Female |
| Farming, Fishing & Forestry | 0 (0.0%) | 0 (0.0%) |
| Construction & Extraction | 47 (100.0%) | 0 (0.0%) |
| Installation, Maintenance & Repair | 82 (100.0%) | 0 (0.0%) |
| Total (Category) | 129 (100.0%) | 0 (0.0%) |
| Total (Overall) | 958 (57.2%) | 717 (42.8%) |
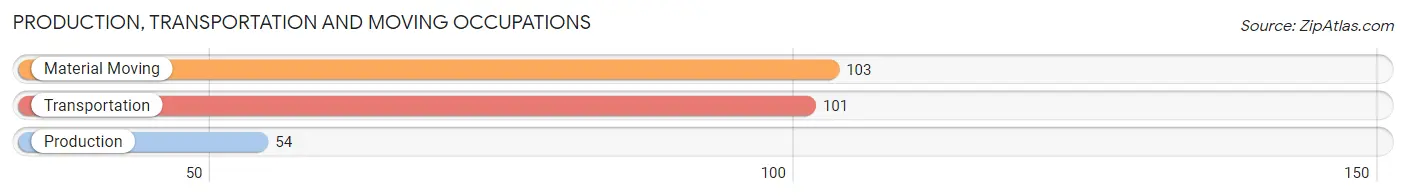
Production, Transportation and Moving Occupations
The most common Production, Transportation and Moving occupations in East Syracuse are Material Moving (103 | 6.1%), Transportation (101 | 6.0%), and Production (54 | 3.2%).
Production, Transportation and Moving Occupations by Sex
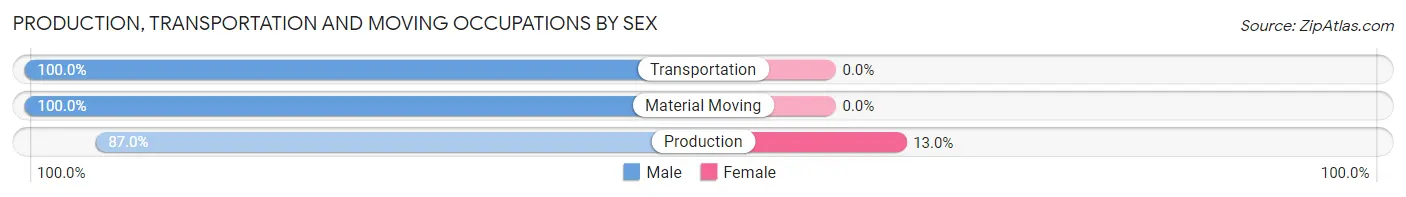
| Occupation | Male | Female |
| Production | 47 (87.0%) | 7 (13.0%) |
| Transportation | 101 (100.0%) | 0 (0.0%) |
| Material Moving | 103 (100.0%) | 0 (0.0%) |
| Total (Category) | 251 (97.3%) | 7 (2.7%) |
| Total (Overall) | 958 (57.2%) | 717 (42.8%) |
Employment Industries by Sex in East Syracuse
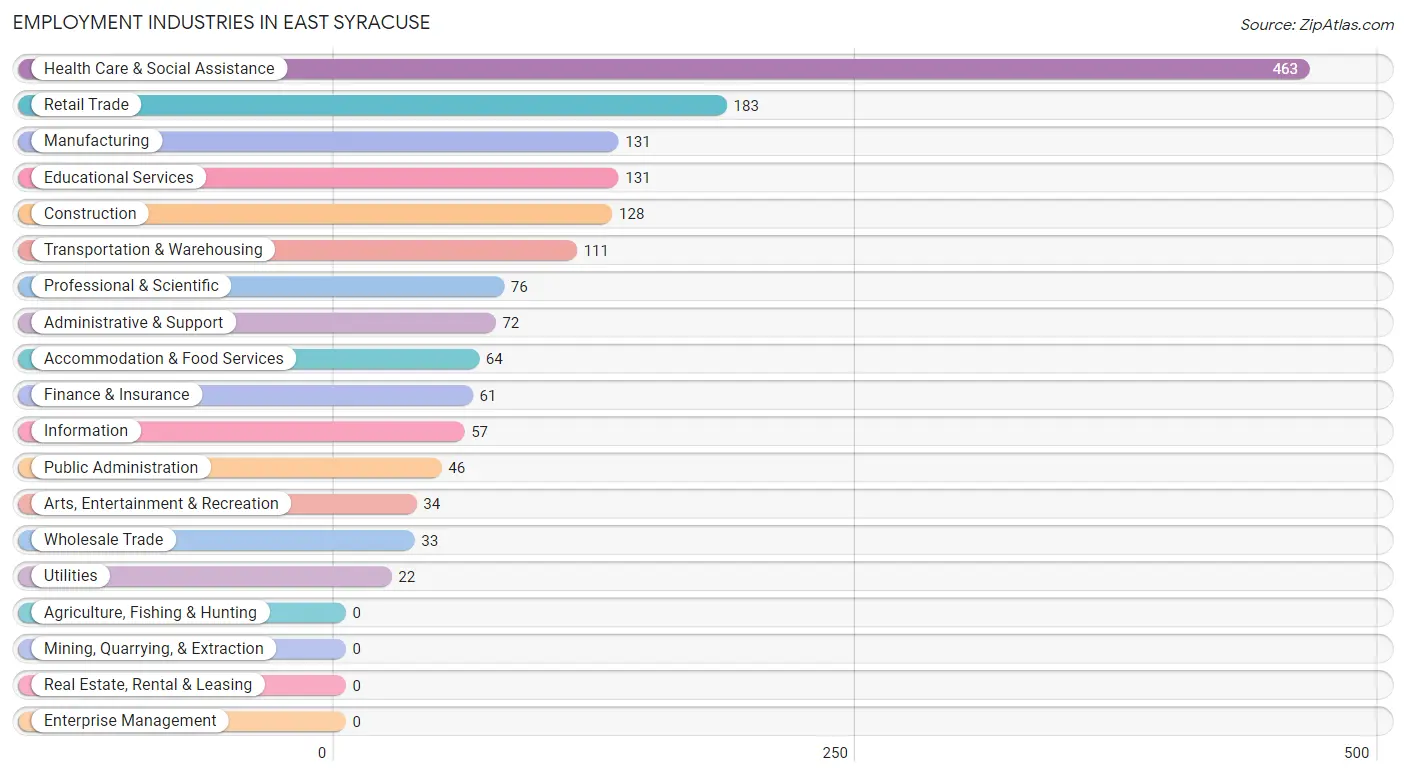
Employment Industries in East Syracuse
The major employment industries in East Syracuse include Health Care & Social Assistance (463 | 27.6%), Retail Trade (183 | 10.9%), Manufacturing (131 | 7.8%), Educational Services (131 | 7.8%), and Construction (128 | 7.6%).
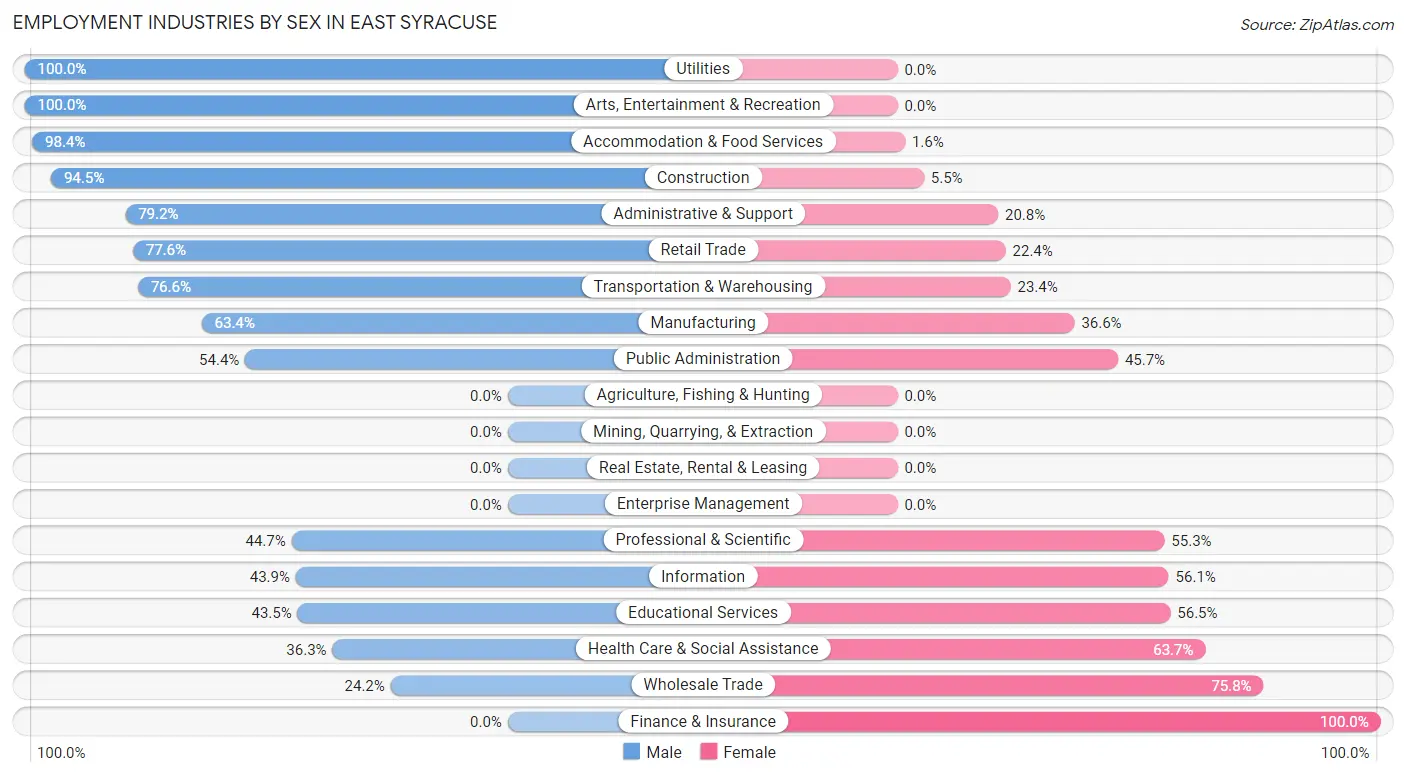
Employment Industries by Sex in East Syracuse
The East Syracuse industries that see more men than women are Utilities (100.0%), Arts, Entertainment & Recreation (100.0%), and Accommodation & Food Services (98.4%), whereas the industries that tend to have a higher number of women are Finance & Insurance (100.0%), Wholesale Trade (75.8%), and Health Care & Social Assistance (63.7%).
| Industry | Male | Female |
| Agriculture, Fishing & Hunting | 0 (0.0%) | 0 (0.0%) |
| Mining, Quarrying, & Extraction | 0 (0.0%) | 0 (0.0%) |
| Construction | 121 (94.5%) | 7 (5.5%) |
| Manufacturing | 83 (63.4%) | 48 (36.6%) |
| Wholesale Trade | 8 (24.2%) | 25 (75.8%) |
| Retail Trade | 142 (77.6%) | 41 (22.4%) |
| Transportation & Warehousing | 85 (76.6%) | 26 (23.4%) |
| Utilities | 22 (100.0%) | 0 (0.0%) |
| Information | 25 (43.9%) | 32 (56.1%) |
| Finance & Insurance | 0 (0.0%) | 61 (100.0%) |
| Real Estate, Rental & Leasing | 0 (0.0%) | 0 (0.0%) |
| Professional & Scientific | 34 (44.7%) | 42 (55.3%) |
| Enterprise Management | 0 (0.0%) | 0 (0.0%) |
| Administrative & Support | 57 (79.2%) | 15 (20.8%) |
| Educational Services | 57 (43.5%) | 74 (56.5%) |
| Health Care & Social Assistance | 168 (36.3%) | 295 (63.7%) |
| Arts, Entertainment & Recreation | 34 (100.0%) | 0 (0.0%) |
| Accommodation & Food Services | 63 (98.4%) | 1 (1.6%) |
| Public Administration | 25 (54.3%) | 21 (45.7%) |
| Total | 958 (57.2%) | 717 (42.8%) |
Education in East Syracuse
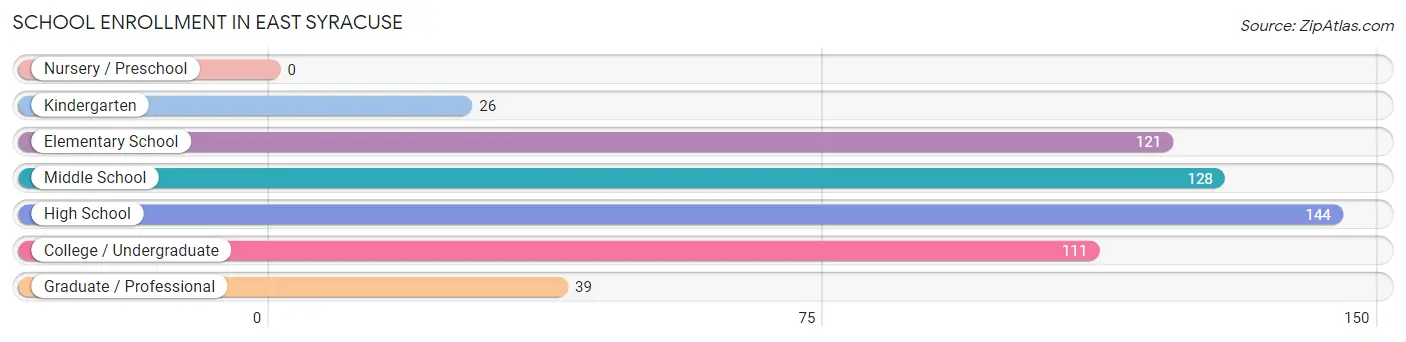
School Enrollment in East Syracuse
The most common levels of schooling among the 569 students in East Syracuse are high school (144 | 25.3%), middle school (128 | 22.5%), and elementary school (121 | 21.3%).
| School Level | # Students | % Students |
| Nursery / Preschool | 0 | 0.0% |
| Kindergarten | 26 | 4.6% |
| Elementary School | 121 | 21.3% |
| Middle School | 128 | 22.5% |
| High School | 144 | 25.3% |
| College / Undergraduate | 111 | 19.5% |
| Graduate / Professional | 39 | 6.9% |
| Total | 569 | 100.0% |
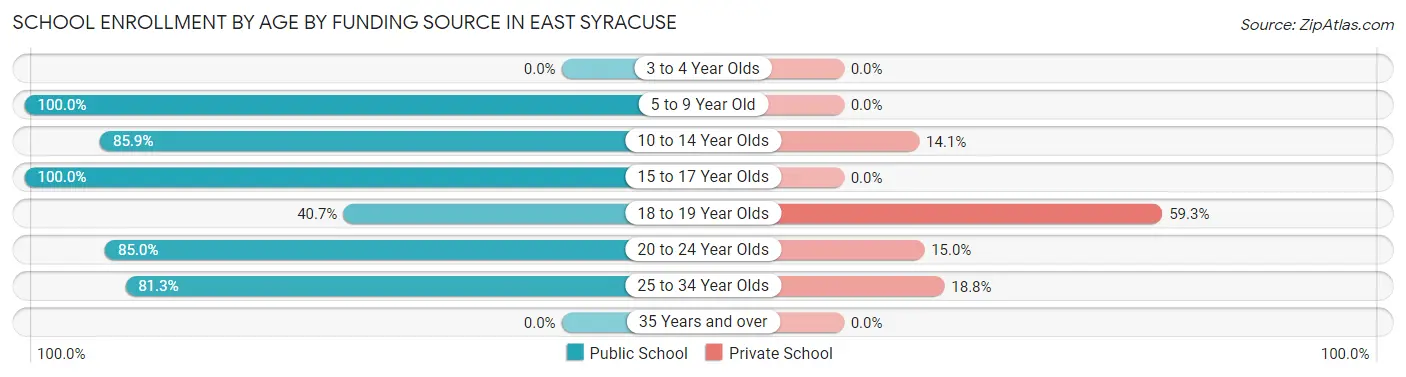
School Enrollment by Age by Funding Source in East Syracuse
Out of a total of 569 students who are enrolled in schools in East Syracuse, 84 (14.8%) attend a private institution, while the remaining 485 (85.2%) are enrolled in public schools. The age group of 18 to 19 year olds has the highest likelihood of being enrolled in private schools, with 54 (59.3% in the age bracket) enrolled. Conversely, the age group of 5 to 9 year old has the lowest likelihood of being enrolled in a private school, with 147 (100.0% in the age bracket) attending a public institution.
| Age Bracket | Public School | Private School |
| 3 to 4 Year Olds | 0 (0.0%) | 0 (0.0%) |
| 5 to 9 Year Old | 147 (100.0%) | 0 (0.0%) |
| 10 to 14 Year Olds | 110 (85.9%) | 18 (14.1%) |
| 15 to 17 Year Olds | 135 (100.0%) | 0 (0.0%) |
| 18 to 19 Year Olds | 37 (40.7%) | 54 (59.3%) |
| 20 to 24 Year Olds | 17 (85.0%) | 3 (15.0%) |
| 25 to 34 Year Olds | 39 (81.2%) | 9 (18.8%) |
| 35 Years and over | 0 (0.0%) | 0 (0.0%) |
| Total | 485 (85.2%) | 84 (14.8%) |
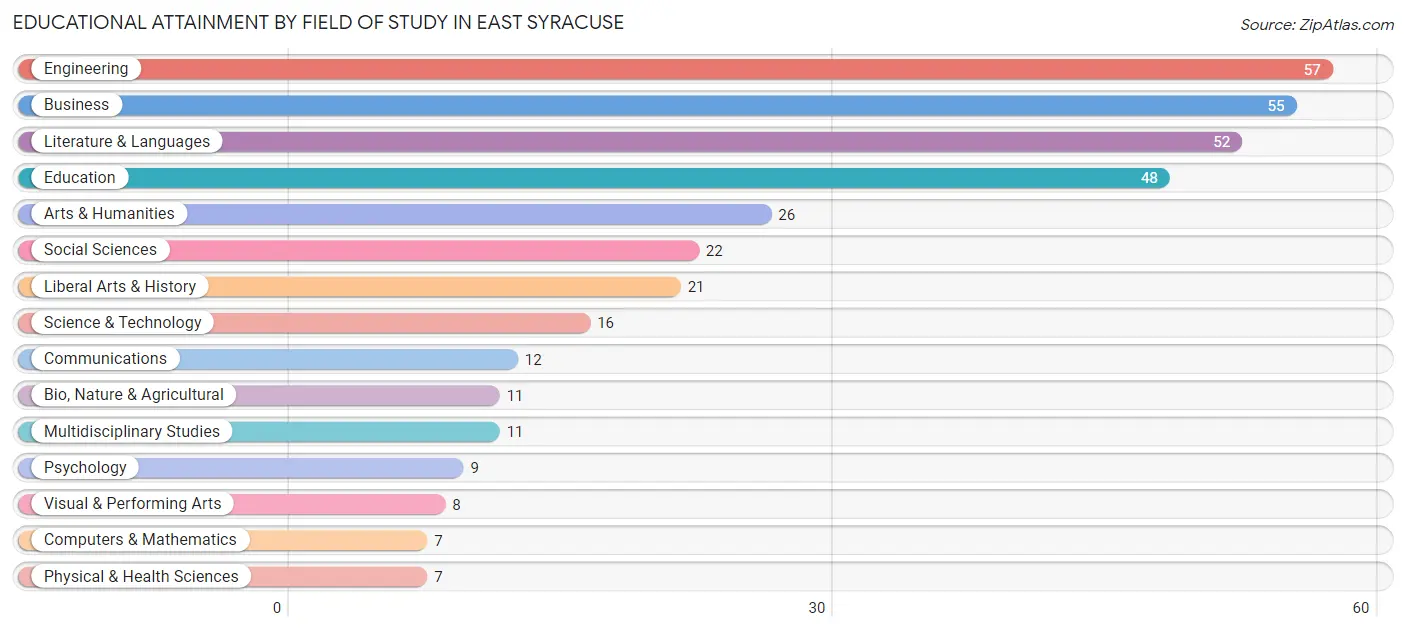
Educational Attainment by Field of Study in East Syracuse
Engineering (57 | 15.8%), business (55 | 15.2%), literature & languages (52 | 14.4%), education (48 | 13.3%), and arts & humanities (26 | 7.2%) are the most common fields of study among 362 individuals in East Syracuse who have obtained a bachelor's degree or higher.
| Field of Study | # Graduates | % Graduates |
| Computers & Mathematics | 7 | 1.9% |
| Bio, Nature & Agricultural | 11 | 3.0% |
| Physical & Health Sciences | 7 | 1.9% |
| Psychology | 9 | 2.5% |
| Social Sciences | 22 | 6.1% |
| Engineering | 57 | 15.8% |
| Multidisciplinary Studies | 11 | 3.0% |
| Science & Technology | 16 | 4.4% |
| Business | 55 | 15.2% |
| Education | 48 | 13.3% |
| Literature & Languages | 52 | 14.4% |
| Liberal Arts & History | 21 | 5.8% |
| Visual & Performing Arts | 8 | 2.2% |
| Communications | 12 | 3.3% |
| Arts & Humanities | 26 | 7.2% |
| Total | 362 | 100.0% |
Transportation & Commute in East Syracuse
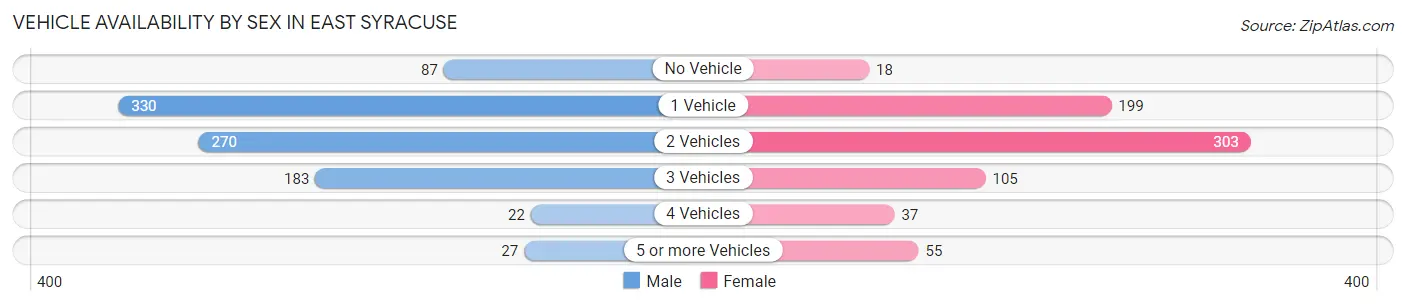
Vehicle Availability by Sex in East Syracuse
The most prevalent vehicle ownership categories in East Syracuse are males with 1 vehicle (330, accounting for 35.9%) and females with 1 vehicle (199, making up 46.0%).
| Vehicles Available | Male | Female |
| No Vehicle | 87 (9.5%) | 18 (2.5%) |
| 1 Vehicle | 330 (35.9%) | 199 (27.8%) |
| 2 Vehicles | 270 (29.4%) | 303 (42.3%) |
| 3 Vehicles | 183 (19.9%) | 105 (14.6%) |
| 4 Vehicles | 22 (2.4%) | 37 (5.2%) |
| 5 or more Vehicles | 27 (2.9%) | 55 (7.7%) |
| Total | 919 (100.0%) | 717 (100.0%) |
Commute Time in East Syracuse
The most frequently occuring commute durations in East Syracuse are 10 to 14 minutes (470 commuters, 31.2%), 20 to 24 minutes (242 commuters, 16.1%), and 5 to 9 minutes (232 commuters, 15.4%).
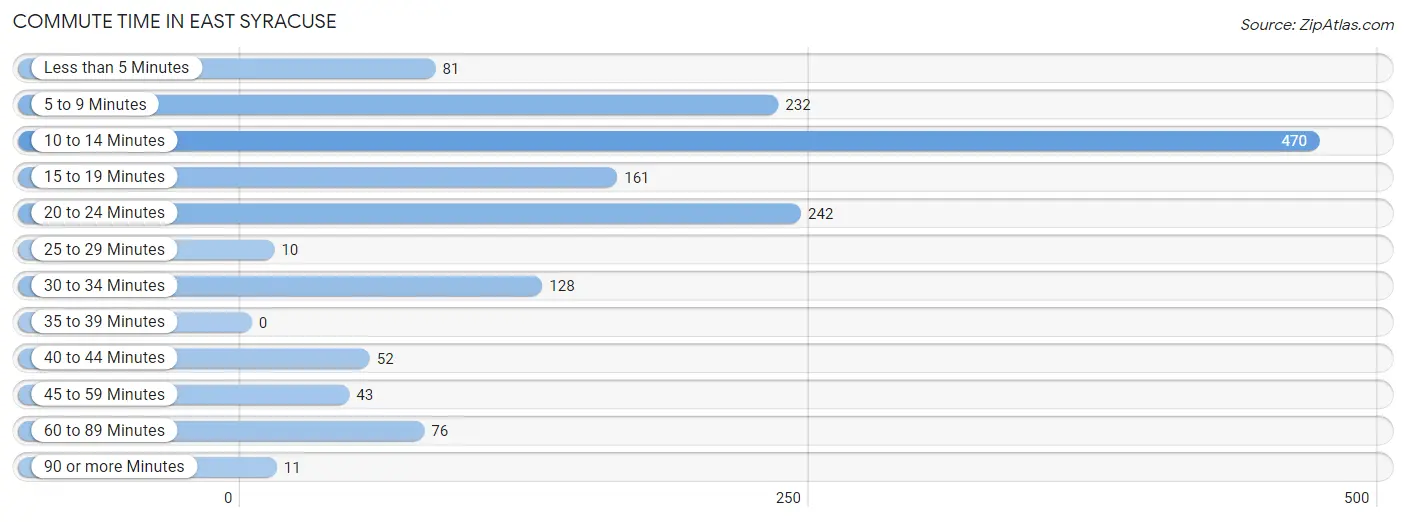
| Commute Time | # Commuters | % Commuters |
| Less than 5 Minutes | 81 | 5.4% |
| 5 to 9 Minutes | 232 | 15.4% |
| 10 to 14 Minutes | 470 | 31.2% |
| 15 to 19 Minutes | 161 | 10.7% |
| 20 to 24 Minutes | 242 | 16.1% |
| 25 to 29 Minutes | 10 | 0.7% |
| 30 to 34 Minutes | 128 | 8.5% |
| 35 to 39 Minutes | 0 | 0.0% |
| 40 to 44 Minutes | 52 | 3.5% |
| 45 to 59 Minutes | 43 | 2.9% |
| 60 to 89 Minutes | 76 | 5.1% |
| 90 or more Minutes | 11 | 0.7% |
Commute Time by Sex in East Syracuse
The most common commute times in East Syracuse are 10 to 14 minutes (331 commuters, 40.0%) for males and 20 to 24 minutes (169 commuters, 24.9%) for females.
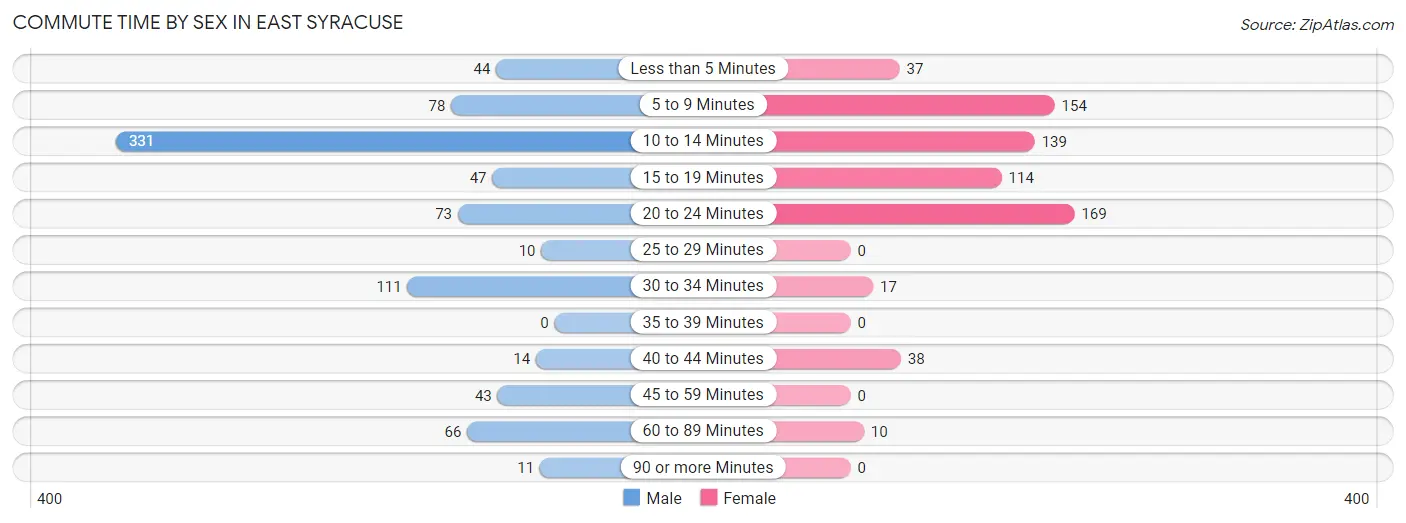
| Commute Time | Male | Female |
| Less than 5 Minutes | 44 (5.3%) | 37 (5.5%) |
| 5 to 9 Minutes | 78 (9.4%) | 154 (22.7%) |
| 10 to 14 Minutes | 331 (40.0%) | 139 (20.5%) |
| 15 to 19 Minutes | 47 (5.7%) | 114 (16.8%) |
| 20 to 24 Minutes | 73 (8.8%) | 169 (24.9%) |
| 25 to 29 Minutes | 10 (1.2%) | 0 (0.0%) |
| 30 to 34 Minutes | 111 (13.4%) | 17 (2.5%) |
| 35 to 39 Minutes | 0 (0.0%) | 0 (0.0%) |
| 40 to 44 Minutes | 14 (1.7%) | 38 (5.6%) |
| 45 to 59 Minutes | 43 (5.2%) | 0 (0.0%) |
| 60 to 89 Minutes | 66 (8.0%) | 10 (1.5%) |
| 90 or more Minutes | 11 (1.3%) | 0 (0.0%) |
Time of Departure to Work by Sex in East Syracuse
The most frequent times of departure to work in East Syracuse are 10:00 AM to 10:59 AM (150, 18.1%) for males and 8:00 AM to 8:29 AM (202, 29.8%) for females.
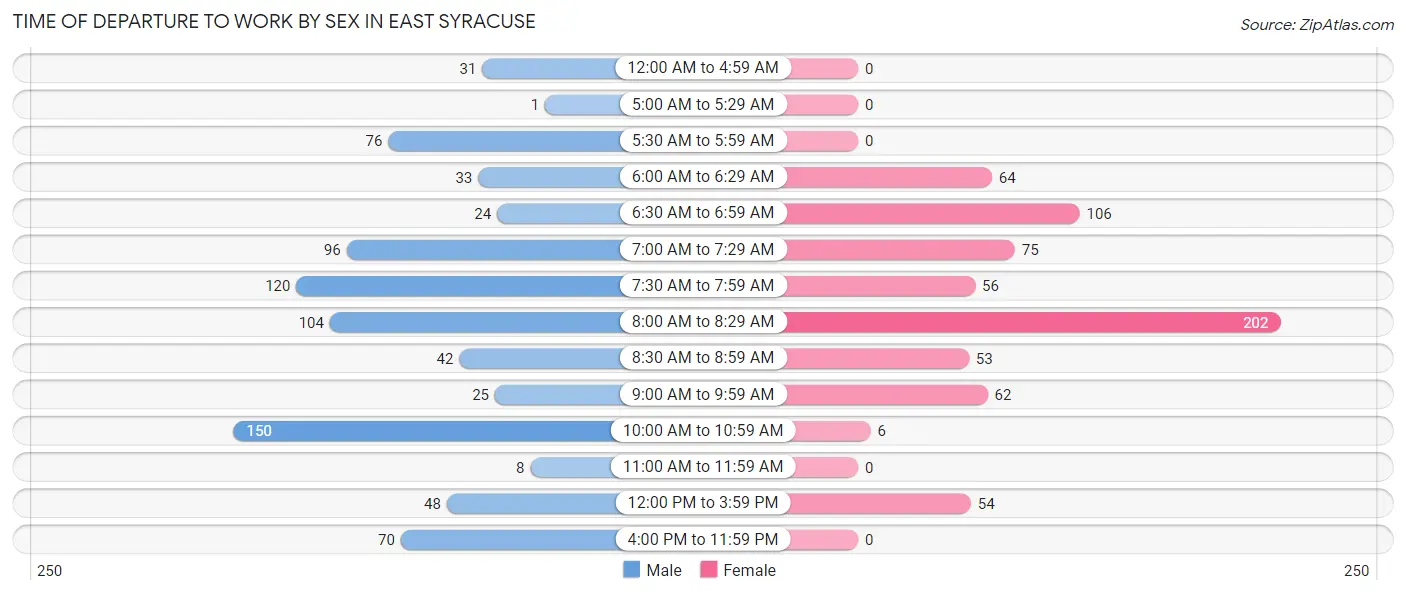
| Time of Departure | Male | Female |
| 12:00 AM to 4:59 AM | 31 (3.7%) | 0 (0.0%) |
| 5:00 AM to 5:29 AM | 1 (0.1%) | 0 (0.0%) |
| 5:30 AM to 5:59 AM | 76 (9.2%) | 0 (0.0%) |
| 6:00 AM to 6:29 AM | 33 (4.0%) | 64 (9.4%) |
| 6:30 AM to 6:59 AM | 24 (2.9%) | 106 (15.6%) |
| 7:00 AM to 7:29 AM | 96 (11.6%) | 75 (11.1%) |
| 7:30 AM to 7:59 AM | 120 (14.5%) | 56 (8.3%) |
| 8:00 AM to 8:29 AM | 104 (12.6%) | 202 (29.8%) |
| 8:30 AM to 8:59 AM | 42 (5.1%) | 53 (7.8%) |
| 9:00 AM to 9:59 AM | 25 (3.0%) | 62 (9.1%) |
| 10:00 AM to 10:59 AM | 150 (18.1%) | 6 (0.9%) |
| 11:00 AM to 11:59 AM | 8 (1.0%) | 0 (0.0%) |
| 12:00 PM to 3:59 PM | 48 (5.8%) | 54 (8.0%) |
| 4:00 PM to 11:59 PM | 70 (8.5%) | 0 (0.0%) |
| Total | 828 (100.0%) | 678 (100.0%) |
Housing Occupancy in East Syracuse
Occupancy by Ownership in East Syracuse
Of the total 1,412 dwellings in East Syracuse, owner-occupied units account for 549 (38.9%), while renter-occupied units make up 863 (61.1%).
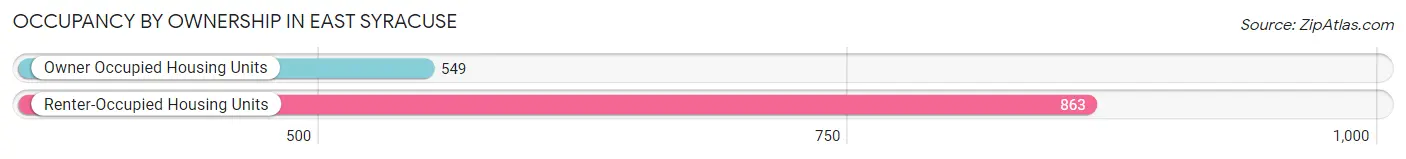
| Occupancy | # Housing Units | % Housing Units |
| Owner Occupied Housing Units | 549 | 38.9% |
| Renter-Occupied Housing Units | 863 | 61.1% |
| Total Occupied Housing Units | 1,412 | 100.0% |
Occupancy by Household Size in East Syracuse
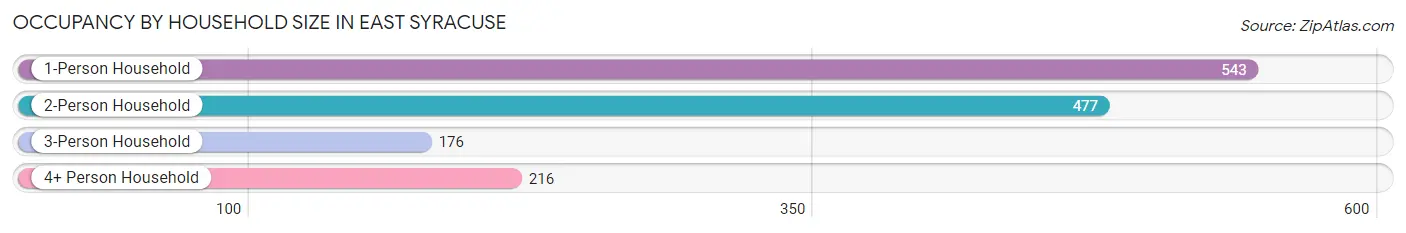
| Household Size | # Housing Units | % Housing Units |
| 1-Person Household | 543 | 38.5% |
| 2-Person Household | 477 | 33.8% |
| 3-Person Household | 176 | 12.5% |
| 4+ Person Household | 216 | 15.3% |
| Total Housing Units | 1,412 | 100.0% |
Occupancy by Ownership by Household Size in East Syracuse
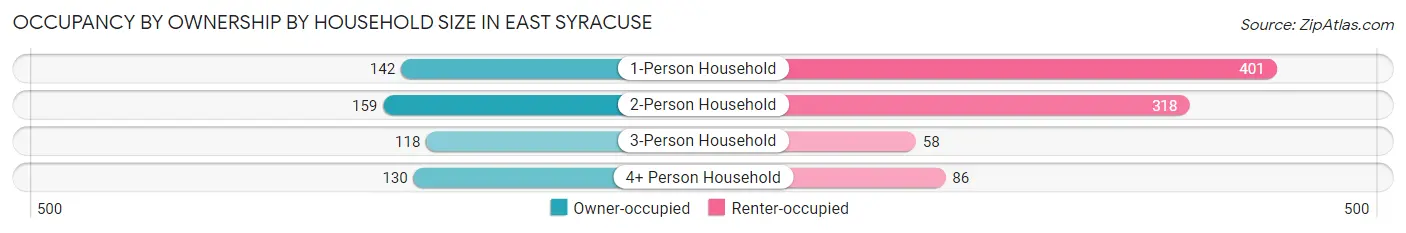
| Household Size | Owner-occupied | Renter-occupied |
| 1-Person Household | 142 (26.2%) | 401 (73.9%) |
| 2-Person Household | 159 (33.3%) | 318 (66.7%) |
| 3-Person Household | 118 (67.0%) | 58 (33.0%) |
| 4+ Person Household | 130 (60.2%) | 86 (39.8%) |
| Total Housing Units | 549 (38.9%) | 863 (61.1%) |
Occupancy by Educational Attainment in East Syracuse
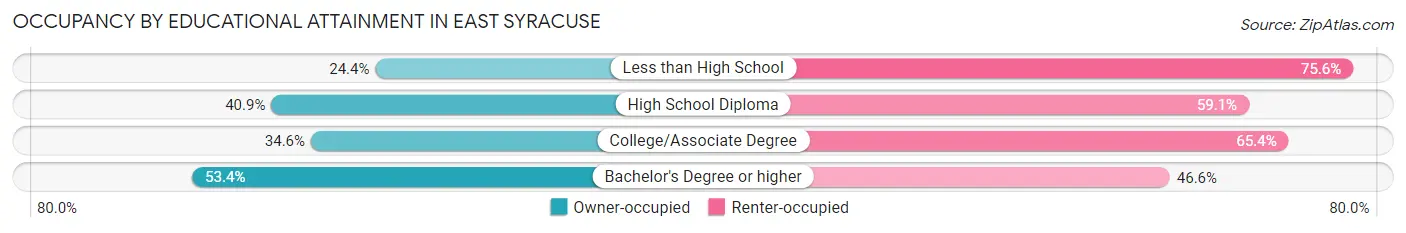
| Household Size | Owner-occupied | Renter-occupied |
| Less than High School | 29 (24.4%) | 90 (75.6%) |
| High School Diploma | 186 (40.9%) | 269 (59.1%) |
| College/Associate Degree | 209 (34.6%) | 395 (65.4%) |
| Bachelor's Degree or higher | 125 (53.4%) | 109 (46.6%) |
Occupancy by Age of Householder in East Syracuse
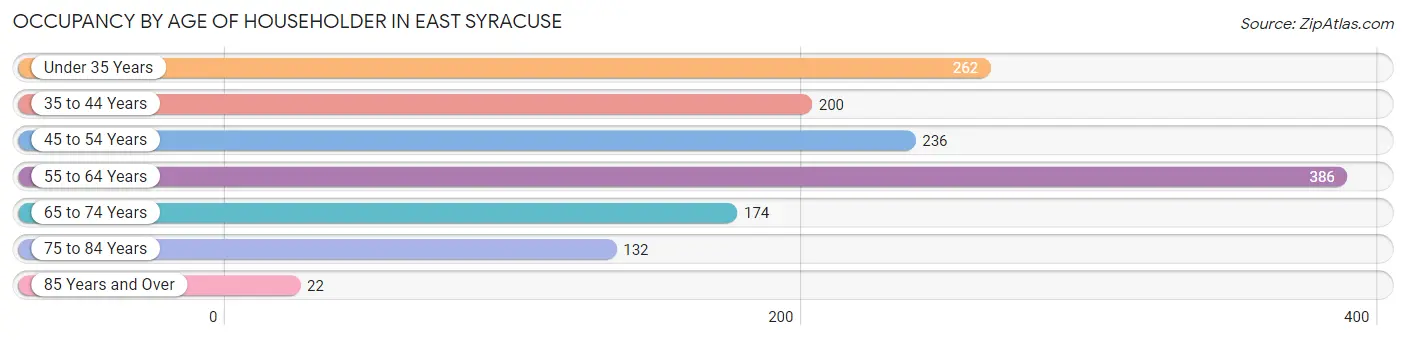
| Age Bracket | # Households | % Households |
| Under 35 Years | 262 | 18.6% |
| 35 to 44 Years | 200 | 14.2% |
| 45 to 54 Years | 236 | 16.7% |
| 55 to 64 Years | 386 | 27.3% |
| 65 to 74 Years | 174 | 12.3% |
| 75 to 84 Years | 132 | 9.3% |
| 85 Years and Over | 22 | 1.6% |
| Total | 1,412 | 100.0% |
Housing Finances in East Syracuse
Median Income by Occupancy in East Syracuse
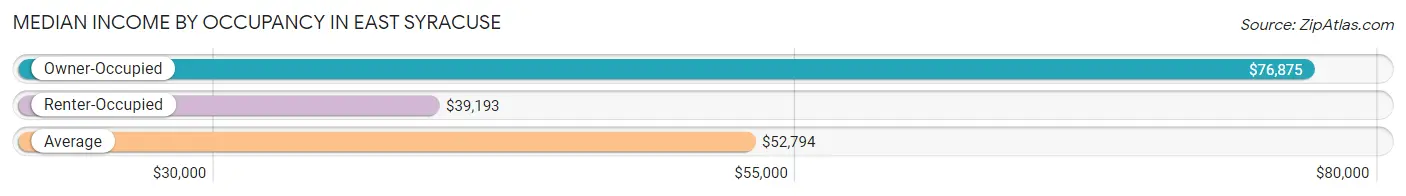
| Occupancy Type | # Households | Median Income |
| Owner-Occupied | 549 (38.9%) | $76,875 |
| Renter-Occupied | 863 (61.1%) | $39,193 |
| Average | 1,412 (100.0%) | $52,794 |
Occupancy by Householder Income Bracket in East Syracuse
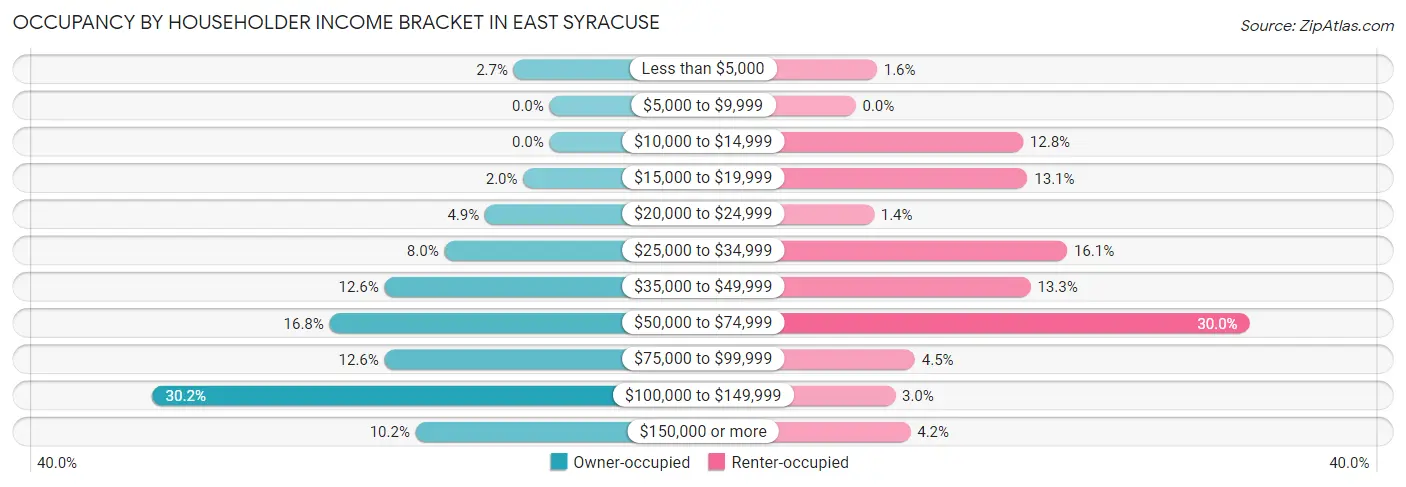
| Income Bracket | Owner-occupied | Renter-occupied |
| Less than $5,000 | 15 (2.7%) | 14 (1.6%) |
| $5,000 to $9,999 | 0 (0.0%) | 0 (0.0%) |
| $10,000 to $14,999 | 0 (0.0%) | 110 (12.8%) |
| $15,000 to $19,999 | 11 (2.0%) | 113 (13.1%) |
| $20,000 to $24,999 | 27 (4.9%) | 12 (1.4%) |
| $25,000 to $34,999 | 44 (8.0%) | 139 (16.1%) |
| $35,000 to $49,999 | 69 (12.6%) | 115 (13.3%) |
| $50,000 to $74,999 | 92 (16.8%) | 259 (30.0%) |
| $75,000 to $99,999 | 69 (12.6%) | 39 (4.5%) |
| $100,000 to $149,999 | 166 (30.2%) | 26 (3.0%) |
| $150,000 or more | 56 (10.2%) | 36 (4.2%) |
| Total | 549 (100.0%) | 863 (100.0%) |
Monthly Housing Cost Tiers in East Syracuse
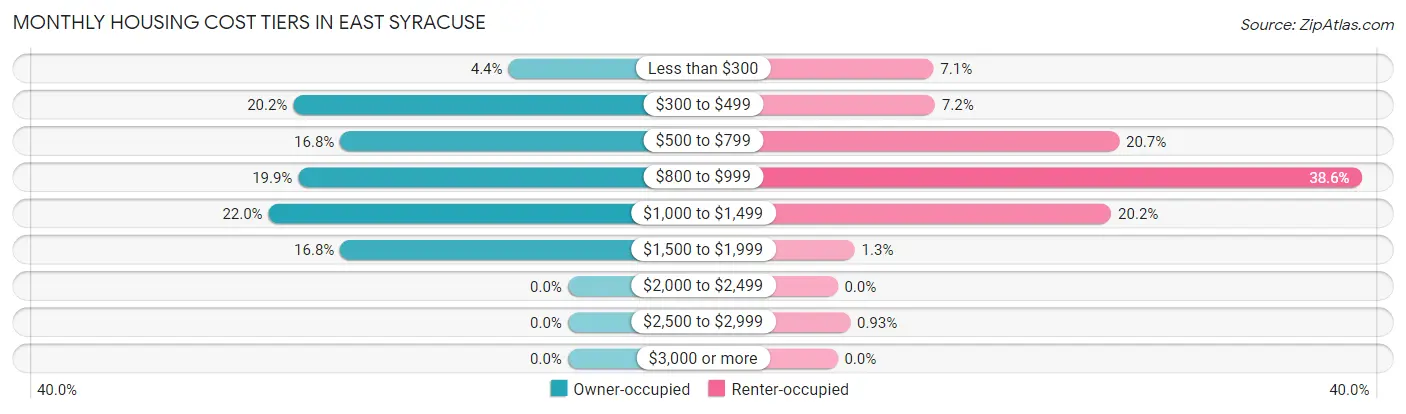
| Monthly Cost | Owner-occupied | Renter-occupied |
| Less than $300 | 24 (4.4%) | 61 (7.1%) |
| $300 to $499 | 111 (20.2%) | 62 (7.2%) |
| $500 to $799 | 92 (16.8%) | 179 (20.7%) |
| $800 to $999 | 109 (19.9%) | 333 (38.6%) |
| $1,000 to $1,499 | 121 (22.0%) | 174 (20.2%) |
| $1,500 to $1,999 | 92 (16.8%) | 11 (1.3%) |
| $2,000 to $2,499 | 0 (0.0%) | 0 (0.0%) |
| $2,500 to $2,999 | 0 (0.0%) | 8 (0.9%) |
| $3,000 or more | 0 (0.0%) | 0 (0.0%) |
| Total | 549 (100.0%) | 863 (100.0%) |
Physical Housing Characteristics in East Syracuse
Housing Structures in East Syracuse
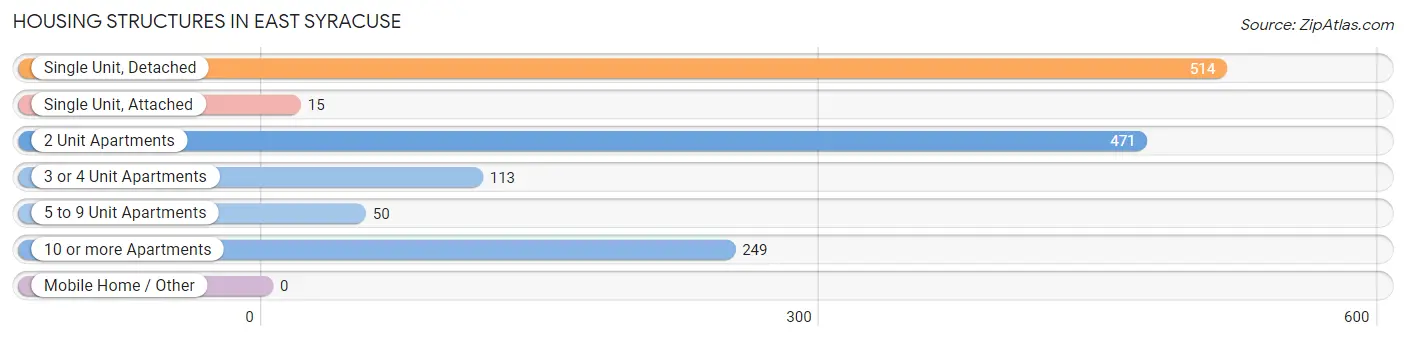
| Structure Type | # Housing Units | % Housing Units |
| Single Unit, Detached | 514 | 36.4% |
| Single Unit, Attached | 15 | 1.1% |
| 2 Unit Apartments | 471 | 33.4% |
| 3 or 4 Unit Apartments | 113 | 8.0% |
| 5 to 9 Unit Apartments | 50 | 3.5% |
| 10 or more Apartments | 249 | 17.6% |
| Mobile Home / Other | 0 | 0.0% |
| Total | 1,412 | 100.0% |
Housing Structures by Occupancy in East Syracuse
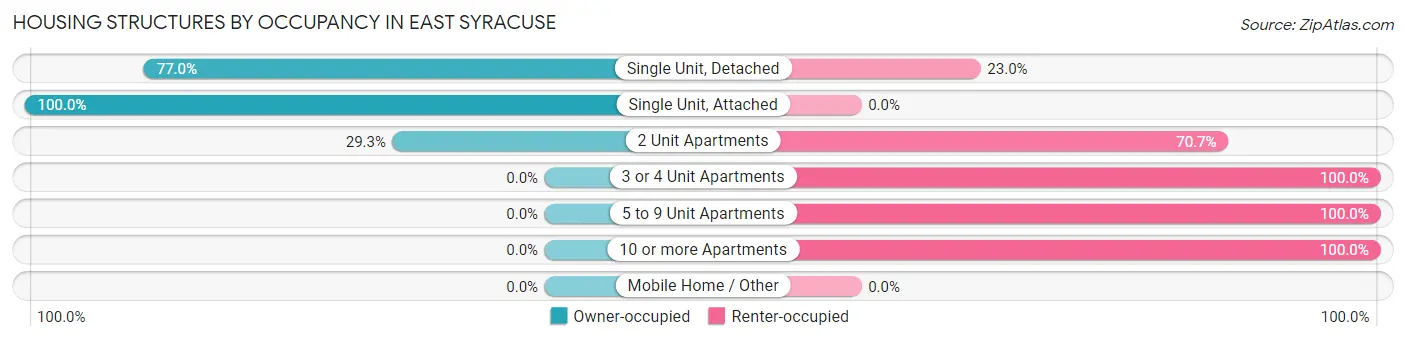
| Structure Type | Owner-occupied | Renter-occupied |
| Single Unit, Detached | 396 (77.0%) | 118 (23.0%) |
| Single Unit, Attached | 15 (100.0%) | 0 (0.0%) |
| 2 Unit Apartments | 138 (29.3%) | 333 (70.7%) |
| 3 or 4 Unit Apartments | 0 (0.0%) | 113 (100.0%) |
| 5 to 9 Unit Apartments | 0 (0.0%) | 50 (100.0%) |
| 10 or more Apartments | 0 (0.0%) | 249 (100.0%) |
| Mobile Home / Other | 0 (0.0%) | 0 (0.0%) |
| Total | 549 (38.9%) | 863 (61.1%) |
Housing Structures by Number of Rooms in East Syracuse
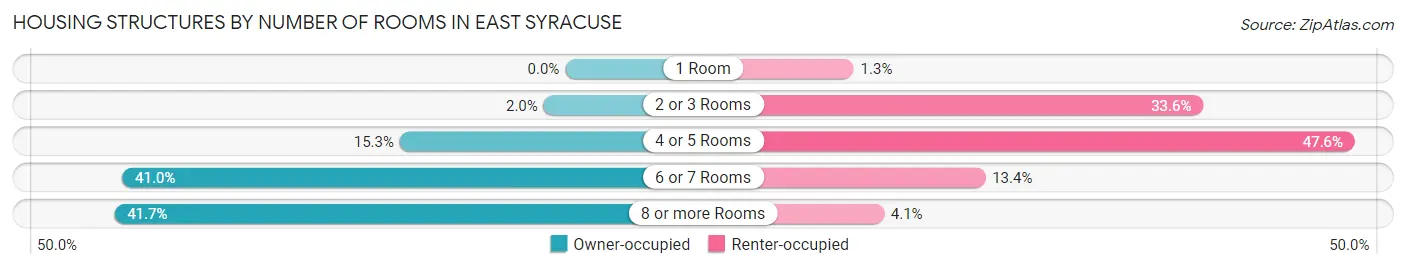
| Number of Rooms | Owner-occupied | Renter-occupied |
| 1 Room | 0 (0.0%) | 11 (1.3%) |
| 2 or 3 Rooms | 11 (2.0%) | 290 (33.6%) |
| 4 or 5 Rooms | 84 (15.3%) | 411 (47.6%) |
| 6 or 7 Rooms | 225 (41.0%) | 116 (13.4%) |
| 8 or more Rooms | 229 (41.7%) | 35 (4.1%) |
| Total | 549 (100.0%) | 863 (100.0%) |
Housing Structure by Heating Type in East Syracuse
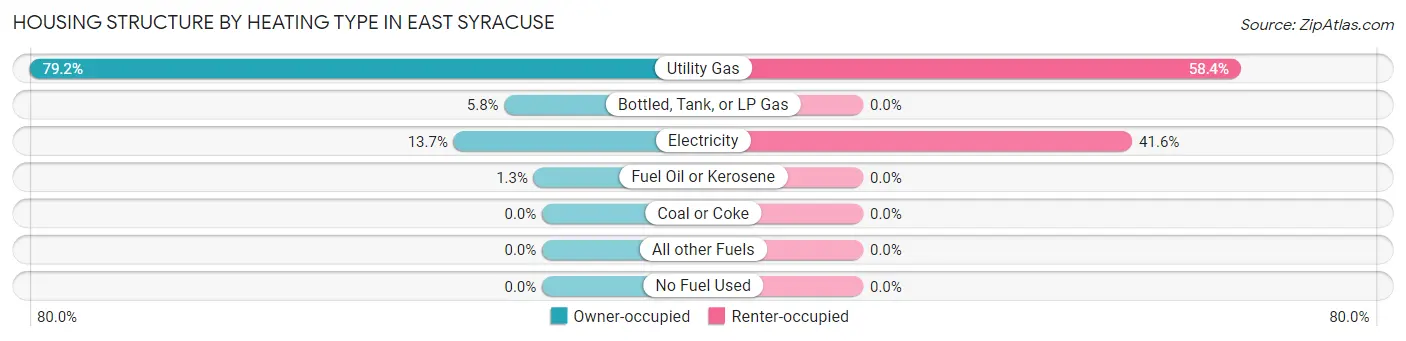
| Heating Type | Owner-occupied | Renter-occupied |
| Utility Gas | 435 (79.2%) | 504 (58.4%) |
| Bottled, Tank, or LP Gas | 32 (5.8%) | 0 (0.0%) |
| Electricity | 75 (13.7%) | 359 (41.6%) |
| Fuel Oil or Kerosene | 7 (1.3%) | 0 (0.0%) |
| Coal or Coke | 0 (0.0%) | 0 (0.0%) |
| All other Fuels | 0 (0.0%) | 0 (0.0%) |
| No Fuel Used | 0 (0.0%) | 0 (0.0%) |
| Total | 549 (100.0%) | 863 (100.0%) |
Household Vehicle Usage in East Syracuse
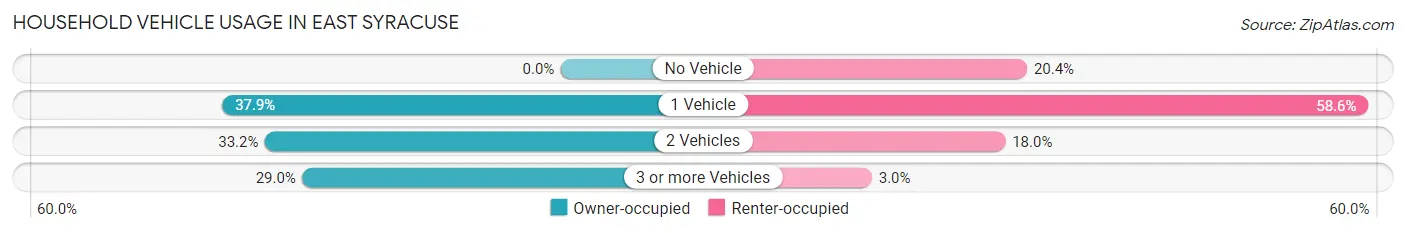
| Vehicles per Household | Owner-occupied | Renter-occupied |
| No Vehicle | 0 (0.0%) | 176 (20.4%) |
| 1 Vehicle | 208 (37.9%) | 506 (58.6%) |
| 2 Vehicles | 182 (33.2%) | 155 (18.0%) |
| 3 or more Vehicles | 159 (29.0%) | 26 (3.0%) |
| Total | 549 (100.0%) | 863 (100.0%) |
Real Estate & Mortgages in East Syracuse
Real Estate and Mortgage Overview in East Syracuse
| Characteristic | Without Mortgage | With Mortgage |
| Housing Units | 270 | 279 |
| Median Property Value | $102,400 | $119,600 |
| Median Household Income | $64,063 | $38 |
| Monthly Housing Costs | $500 | $0 |
| Real Estate Taxes | $3,285 | $0 |
Property Value by Mortgage Status in East Syracuse
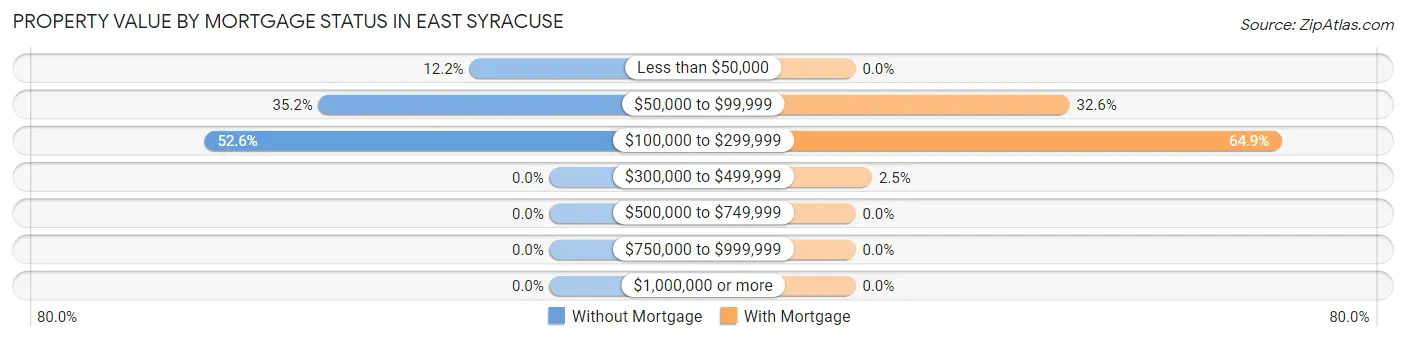
| Property Value | Without Mortgage | With Mortgage |
| Less than $50,000 | 33 (12.2%) | 0 (0.0%) |
| $50,000 to $99,999 | 95 (35.2%) | 91 (32.6%) |
| $100,000 to $299,999 | 142 (52.6%) | 181 (64.9%) |
| $300,000 to $499,999 | 0 (0.0%) | 7 (2.5%) |
| $500,000 to $749,999 | 0 (0.0%) | 0 (0.0%) |
| $750,000 to $999,999 | 0 (0.0%) | 0 (0.0%) |
| $1,000,000 or more | 0 (0.0%) | 0 (0.0%) |
| Total | 270 (100.0%) | 279 (100.0%) |
Household Income by Mortgage Status in East Syracuse
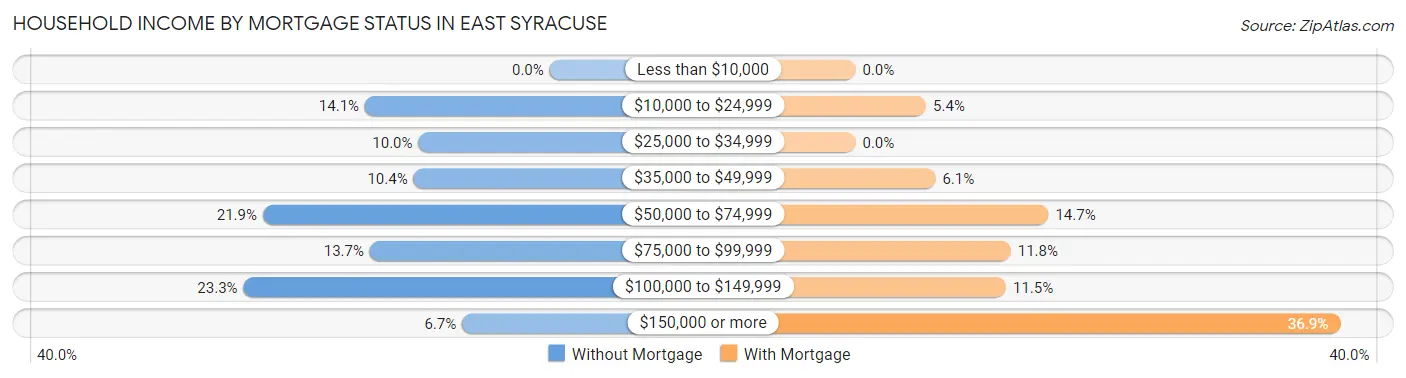
| Household Income | Without Mortgage | With Mortgage |
| Less than $10,000 | 0 (0.0%) | 0 (0.0%) |
| $10,000 to $24,999 | 38 (14.1%) | 15 (5.4%) |
| $25,000 to $34,999 | 27 (10.0%) | 0 (0.0%) |
| $35,000 to $49,999 | 28 (10.4%) | 17 (6.1%) |
| $50,000 to $74,999 | 59 (21.8%) | 41 (14.7%) |
| $75,000 to $99,999 | 37 (13.7%) | 33 (11.8%) |
| $100,000 to $149,999 | 63 (23.3%) | 32 (11.5%) |
| $150,000 or more | 18 (6.7%) | 103 (36.9%) |
| Total | 270 (100.0%) | 279 (100.0%) |
Property Value to Household Income Ratio in East Syracuse
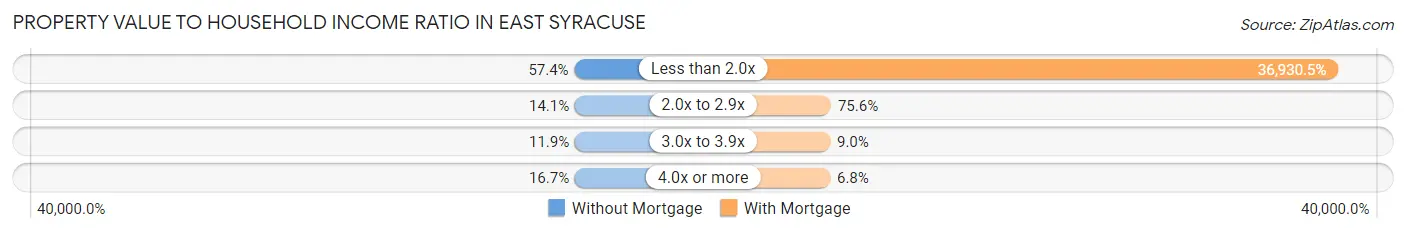
| Value-to-Income Ratio | Without Mortgage | With Mortgage |
| Less than 2.0x | 155 (57.4%) | 103,036 (36,930.5%) |
| 2.0x to 2.9x | 38 (14.1%) | 211 (75.6%) |
| 3.0x to 3.9x | 32 (11.8%) | 25 (9.0%) |
| 4.0x or more | 45 (16.7%) | 19 (6.8%) |
| Total | 270 (100.0%) | 279 (100.0%) |
Real Estate Taxes by Mortgage Status in East Syracuse
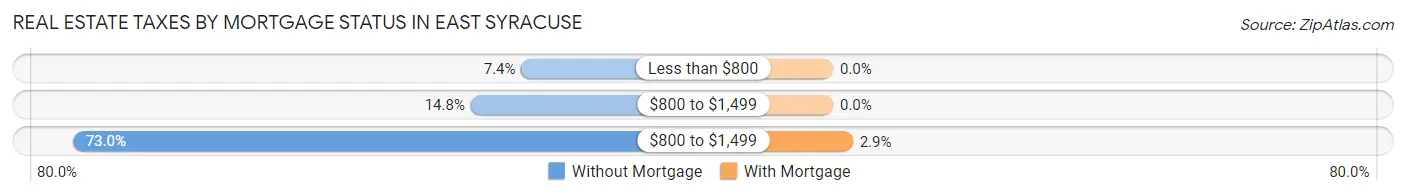
| Property Taxes | Without Mortgage | With Mortgage |
| Less than $800 | 20 (7.4%) | 0 (0.0%) |
| $800 to $1,499 | 40 (14.8%) | 0 (0.0%) |
| $800 to $1,499 | 197 (73.0%) | 8 (2.9%) |
| Total | 270 (100.0%) | 279 (100.0%) |
Health & Disability in East Syracuse
Health Insurance Coverage by Age in East Syracuse
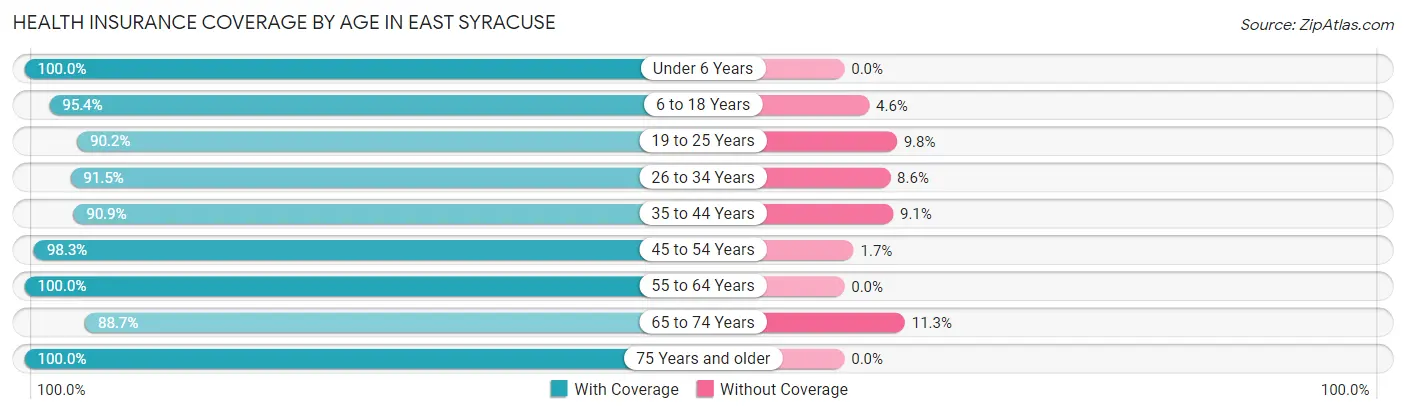
| Age Bracket | With Coverage | Without Coverage |
| Under 6 Years | 108 (100.0%) | 0 (0.0%) |
| 6 to 18 Years | 434 (95.4%) | 21 (4.6%) |
| 19 to 25 Years | 166 (90.2%) | 18 (9.8%) |
| 26 to 34 Years | 417 (91.4%) | 39 (8.6%) |
| 35 to 44 Years | 330 (90.9%) | 33 (9.1%) |
| 45 to 54 Years | 396 (98.3%) | 7 (1.7%) |
| 55 to 64 Years | 664 (100.0%) | 0 (0.0%) |
| 65 to 74 Years | 228 (88.7%) | 29 (11.3%) |
| 75 Years and older | 175 (100.0%) | 0 (0.0%) |
| Total | 2,918 (95.2%) | 147 (4.8%) |
Health Insurance Coverage by Citizenship Status in East Syracuse
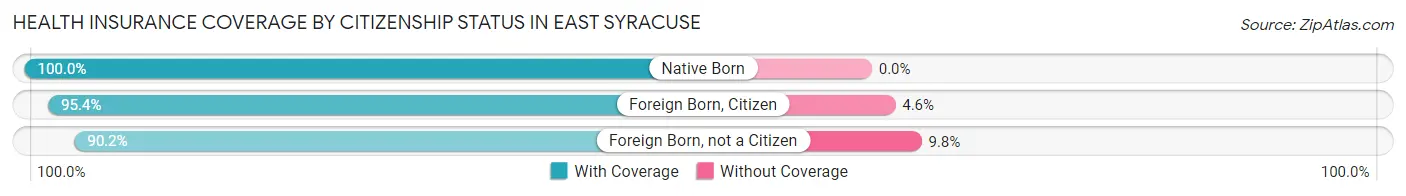
| Citizenship Status | With Coverage | Without Coverage |
| Native Born | 108 (100.0%) | 0 (0.0%) |
| Foreign Born, Citizen | 434 (95.4%) | 21 (4.6%) |
| Foreign Born, not a Citizen | 166 (90.2%) | 18 (9.8%) |
Health Insurance Coverage by Household Income in East Syracuse
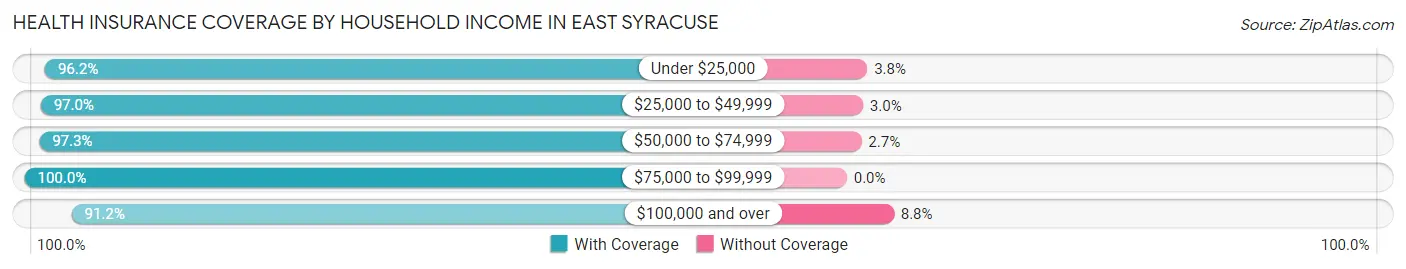
| Household Income | With Coverage | Without Coverage |
| Under $25,000 | 377 (96.2%) | 15 (3.8%) |
| $25,000 to $49,999 | 578 (97.0%) | 18 (3.0%) |
| $50,000 to $74,999 | 782 (97.3%) | 22 (2.7%) |
| $75,000 to $99,999 | 221 (100.0%) | 0 (0.0%) |
| $100,000 and over | 954 (91.2%) | 92 (8.8%) |
Public vs Private Health Insurance Coverage by Age in East Syracuse
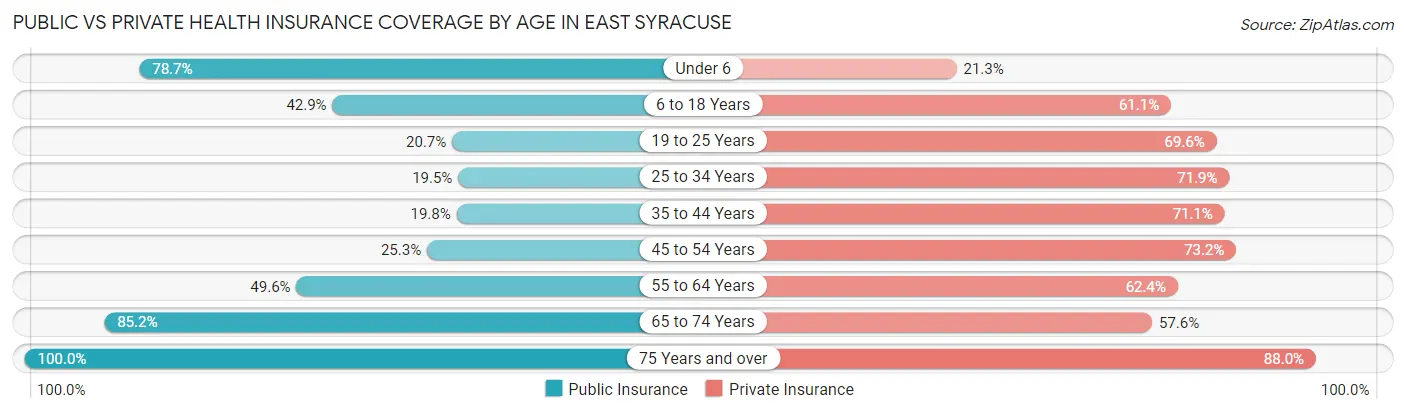
| Age Bracket | Public Insurance | Private Insurance |
| Under 6 | 85 (78.7%) | 23 (21.3%) |
| 6 to 18 Years | 195 (42.9%) | 278 (61.1%) |
| 19 to 25 Years | 38 (20.6%) | 128 (69.6%) |
| 25 to 34 Years | 89 (19.5%) | 328 (71.9%) |
| 35 to 44 Years | 72 (19.8%) | 258 (71.1%) |
| 45 to 54 Years | 102 (25.3%) | 295 (73.2%) |
| 55 to 64 Years | 329 (49.5%) | 414 (62.4%) |
| 65 to 74 Years | 219 (85.2%) | 148 (57.6%) |
| 75 Years and over | 175 (100.0%) | 154 (88.0%) |
| Total | 1,304 (42.5%) | 2,026 (66.1%) |
Disability Status by Sex by Age in East Syracuse
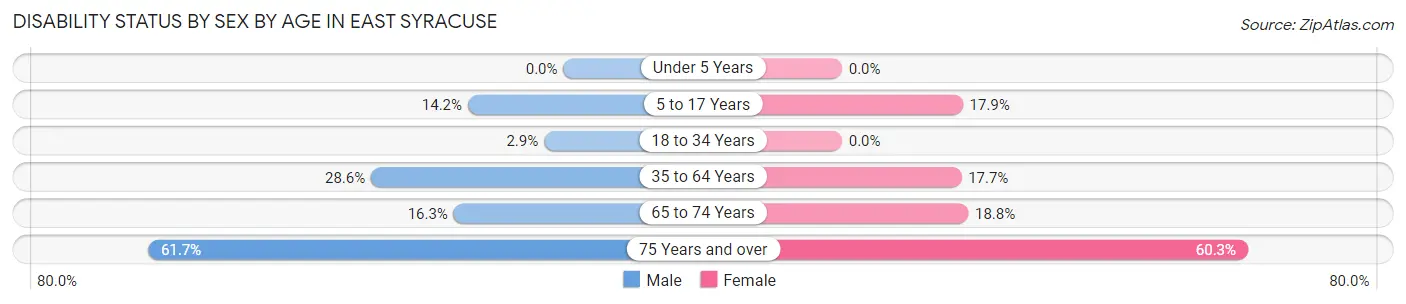
| Age Bracket | Male | Female |
| Under 5 Years | 0 (0.0%) | 0 (0.0%) |
| 5 to 17 Years | 40 (14.2%) | 26 (17.9%) |
| 18 to 34 Years | 10 (2.9%) | 0 (0.0%) |
| 35 to 64 Years | 215 (28.5%) | 120 (17.7%) |
| 65 to 74 Years | 21 (16.3%) | 24 (18.8%) |
| 75 Years and over | 66 (61.7%) | 41 (60.3%) |
Disability Class by Sex by Age in East Syracuse
Disability Class: Hearing Difficulty
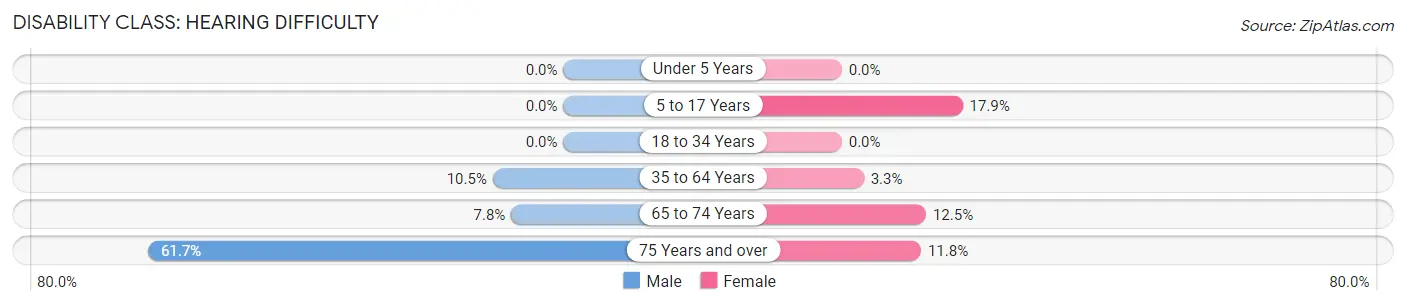
| Age Bracket | Male | Female |
| Under 5 Years | 0 (0.0%) | 0 (0.0%) |
| 5 to 17 Years | 0 (0.0%) | 26 (17.9%) |
| 18 to 34 Years | 0 (0.0%) | 0 (0.0%) |
| 35 to 64 Years | 79 (10.5%) | 22 (3.3%) |
| 65 to 74 Years | 10 (7.7%) | 16 (12.5%) |
| 75 Years and over | 66 (61.7%) | 8 (11.8%) |
Disability Class: Vision Difficulty
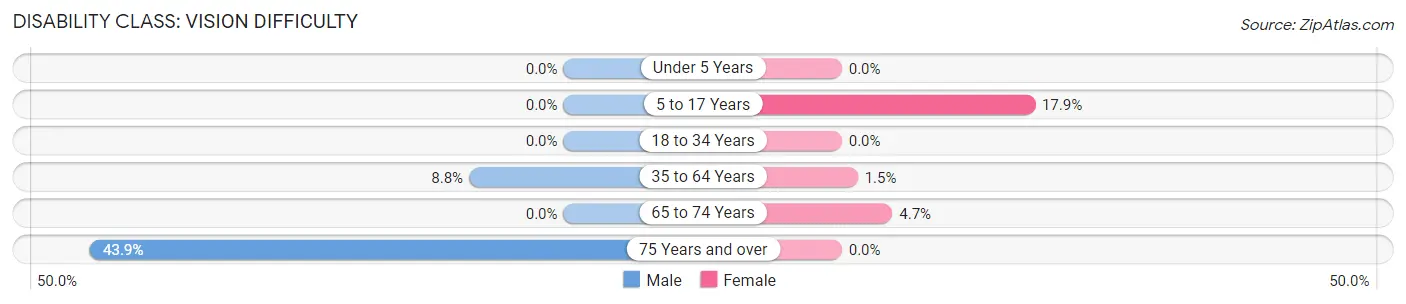
| Age Bracket | Male | Female |
| Under 5 Years | 0 (0.0%) | 0 (0.0%) |
| 5 to 17 Years | 0 (0.0%) | 26 (17.9%) |
| 18 to 34 Years | 0 (0.0%) | 0 (0.0%) |
| 35 to 64 Years | 66 (8.8%) | 10 (1.5%) |
| 65 to 74 Years | 0 (0.0%) | 6 (4.7%) |
| 75 Years and over | 47 (43.9%) | 0 (0.0%) |
Disability Class: Cognitive Difficulty
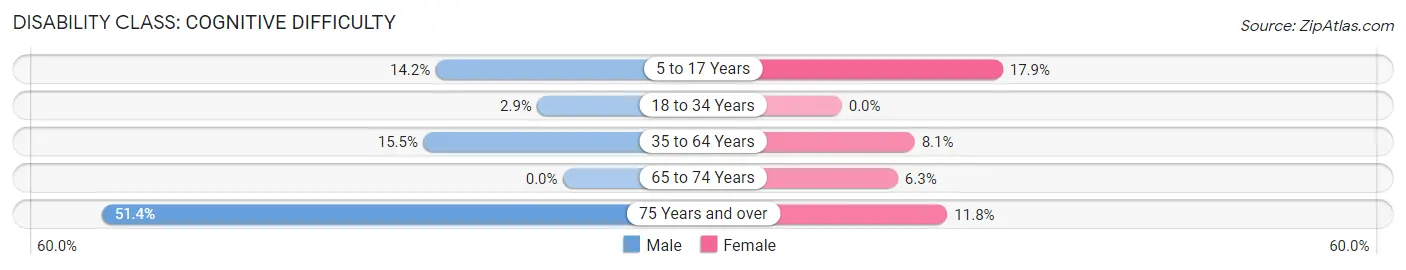
| Age Bracket | Male | Female |
| 5 to 17 Years | 40 (14.2%) | 26 (17.9%) |
| 18 to 34 Years | 10 (2.9%) | 0 (0.0%) |
| 35 to 64 Years | 117 (15.5%) | 55 (8.1%) |
| 65 to 74 Years | 0 (0.0%) | 8 (6.2%) |
| 75 Years and over | 55 (51.4%) | 8 (11.8%) |
Disability Class: Ambulatory Difficulty
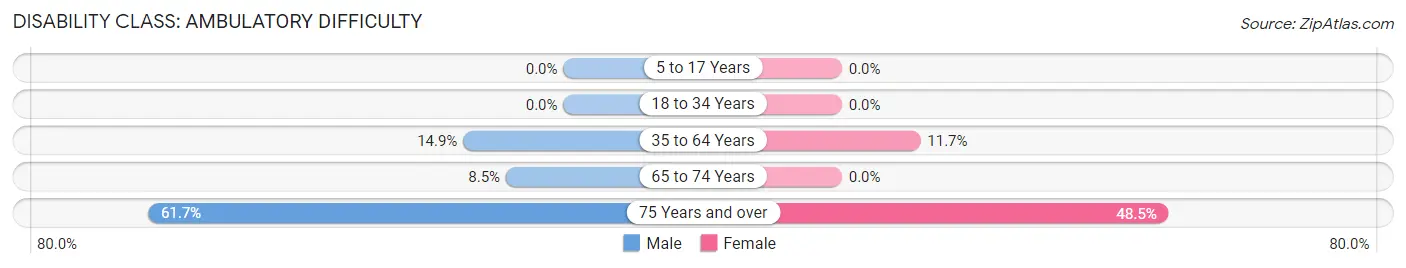
| Age Bracket | Male | Female |
| 5 to 17 Years | 0 (0.0%) | 0 (0.0%) |
| 18 to 34 Years | 0 (0.0%) | 0 (0.0%) |
| 35 to 64 Years | 112 (14.9%) | 79 (11.7%) |
| 65 to 74 Years | 11 (8.5%) | 0 (0.0%) |
| 75 Years and over | 66 (61.7%) | 33 (48.5%) |
Disability Class: Self-Care Difficulty
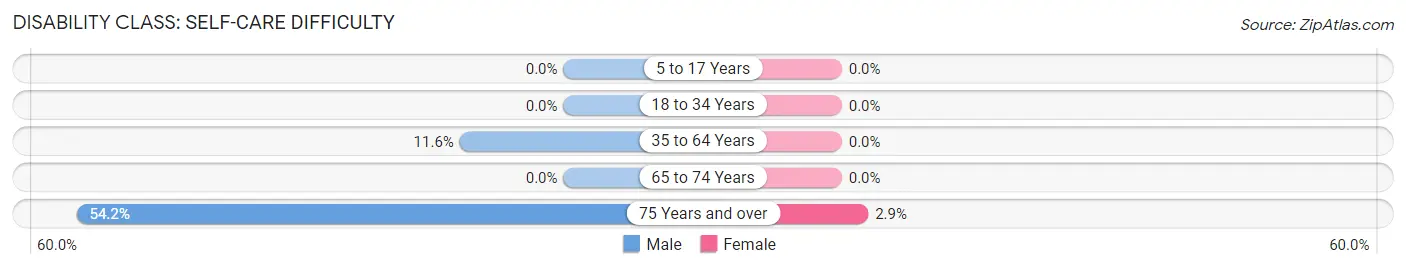
| Age Bracket | Male | Female |
| 5 to 17 Years | 0 (0.0%) | 0 (0.0%) |
| 18 to 34 Years | 0 (0.0%) | 0 (0.0%) |
| 35 to 64 Years | 87 (11.6%) | 0 (0.0%) |
| 65 to 74 Years | 0 (0.0%) | 0 (0.0%) |
| 75 Years and over | 58 (54.2%) | 2 (2.9%) |
Technology Access in East Syracuse
Computing Device Access in East Syracuse
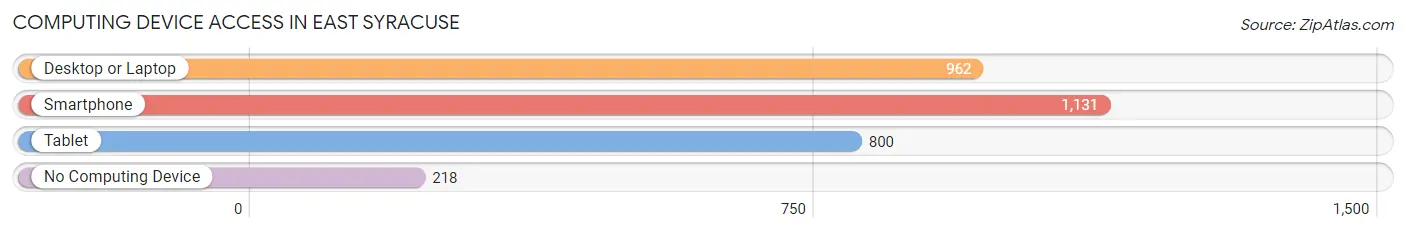
| Device Type | # Households | % Households |
| Desktop or Laptop | 962 | 68.1% |
| Smartphone | 1,131 | 80.1% |
| Tablet | 800 | 56.7% |
| No Computing Device | 218 | 15.4% |
| Total | 1,412 | 100.0% |
Internet Access in East Syracuse
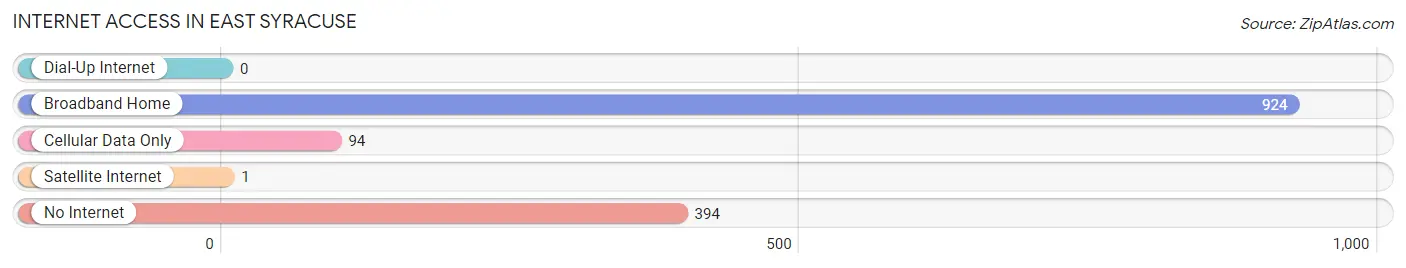
| Internet Type | # Households | % Households |
| Dial-Up Internet | 0 | 0.0% |
| Broadband Home | 924 | 65.4% |
| Cellular Data Only | 94 | 6.7% |
| Satellite Internet | 1 | 0.1% |
| No Internet | 394 | 27.9% |
| Total | 1,412 | 100.0% |
East Syracuse Summary
History
East Syracuse is a village located in Onondaga County, New York. It is part of the Syracuse metropolitan area and is located just east of the city of Syracuse. The village was first settled in the early 19th century and was incorporated in 1848.
The area was originally inhabited by the Onondaga Nation, a member of the Iroquois Confederacy. The Onondaga were a powerful and influential tribe in the region and were known for their agricultural and trading skills. The first European settlers arrived in the area in the late 1700s and early 1800s. The village was originally known as "East Syracuse" and was part of the town of Manlius.
In 1848, the village was officially incorporated as the Village of East Syracuse. The village was a popular stop for travelers on the Erie Canal, which ran through the village. The village was also home to several factories, including a paper mill, a flour mill, and a tannery.
In the late 19th century, the village began to grow rapidly. The population increased from 1,000 in 1880 to over 4,000 by 1900. The village was also home to several churches, schools, and businesses.
In the early 20th century, the village continued to grow and prosper. The population increased to over 8,000 by 1930. The village was also home to several large companies, including the Syracuse China Company, the Syracuse Stove Company, and the Syracuse Foundry Company.
In the late 20th century, the village began to decline. The population decreased to just over 5,000 by 2000. The village has since seen a resurgence in recent years, with the population increasing to over 6,000 by 2018.
Geography
East Syracuse is located in Onondaga County, New York. It is part of the Syracuse metropolitan area and is located just east of the city of Syracuse. The village is situated on the northern shore of Onondaga Lake. The village is bordered by the towns of Manlius, DeWitt, and Salina.
The village has a total area of 2.2 square miles, all of which is land. The village is located in the Finger Lakes region of New York and is part of the Finger Lakes National Forest. The village is located in the Finger Lakes region of New York and is part of the Finger Lakes National Forest.
Economy
East Syracuse is a small village with a population of just over 6,000. The village is home to several small businesses, including restaurants, retail stores, and professional services. The village is also home to several large employers, including the Syracuse China Company, the Syracuse Stove Company, and the Syracuse Foundry Company.
The village is also home to several educational institutions, including Le Moyne College and Onondaga Community College. The village is also home to several healthcare facilities, including Upstate University Hospital and St. Joseph's Hospital.
Demographics
As of the 2010 census, the village had a population of 6,072. The racial makeup of the village was 94.2% White, 2.2% African American, 0.3% Native American, 1.2% Asian, 0.1% Pacific Islander, 0.7% from other races, and 1.3% from two or more races. Hispanic or Latino of any race were 2.7% of the population.
The median household income in the village was $45,938 and the median family income was $54,844. The per capita income for the village was $22,945. About 8.2% of families and 10.3% of the population were below the poverty line, including 14.2% of those under age 18 and 5.2% of those age 65 or over.
Common Questions
What is Per Capita Income in East Syracuse?
Per Capita income in East Syracuse is $30,029.
What is the Median Family Income in East Syracuse?
Median Family Income in East Syracuse is $66,875.
What is the Median Household income in East Syracuse?
Median Household Income in East Syracuse is $52,794.
What is Income or Wage Gap in East Syracuse?
Income or Wage Gap in East Syracuse is 2.8%.
Women in East Syracuse earn 97.2 cents for every dollar earned by a man.
What is Inequality or Gini Index in East Syracuse?
Inequality or Gini Index in East Syracuse is 0.41.
What is the Total Population of East Syracuse?
Total Population of East Syracuse is 3,065.
What is the Total Male Population of East Syracuse?
Total Male Population of East Syracuse is 1,648.
What is the Total Female Population of East Syracuse?
Total Female Population of East Syracuse is 1,417.
What is the Ratio of Males per 100 Females in East Syracuse?
There are 116.30 Males per 100 Females in East Syracuse.
What is the Ratio of Females per 100 Males in East Syracuse?
There are 85.98 Females per 100 Males in East Syracuse.
What is the Median Population Age in East Syracuse?
Median Population Age in East Syracuse is 43.8 Years.
What is the Average Family Size in East Syracuse
Average Family Size in East Syracuse is 3.0 People.
What is the Average Household Size in East Syracuse
Average Household Size in East Syracuse is 2.2 People.
How Large is the Labor Force in East Syracuse?
There are 1,703 People in the Labor Forcein in East Syracuse.
What is the Percentage of People in the Labor Force in East Syracuse?
63.6% of People are in the Labor Force in East Syracuse.
What is the Unemployment Rate in East Syracuse?
Unemployment Rate in East Syracuse is 1.6%.