McGraw, NY Map & Demographics
McGraw Map
McGraw Overview
$22,736
PER CAPITA INCOME
$55,833
AVG FAMILY INCOME
$60,781
AVG HOUSEHOLD INCOME
24.1%
WAGE / INCOME GAP [ % ]
75.9¢/ $1
WAGE / INCOME GAP [ $ ]
0.38
INEQUALITY / GINI INDEX
1,261
TOTAL POPULATION
727
MALE POPULATION
534
FEMALE POPULATION
136.14
MALES / 100 FEMALES
73.45
FEMALES / 100 MALES
32.0
MEDIAN AGE
3.2
AVG FAMILY SIZE
2.8
AVG HOUSEHOLD SIZE
562
LABOR FORCE [ PEOPLE ]
65.2%
PERCENT IN LABOR FORCE
7.7%
UNEMPLOYMENT RATE
Income in McGraw
Income Overview in McGraw
Per Capita Income in McGraw is $22,736, while median incomes of families and households are $55,833 and $60,781 respectively.
| Characteristic | Number | Measure |
| Per Capita Income | 1,261 | $22,736 |
| Median Family Income | 292 | $55,833 |
| Mean Family Income | 292 | $62,816 |
| Median Household Income | 452 | $60,781 |
| Mean Household Income | 452 | $64,414 |
| Income Deficit | 292 | $0 |
| Wage / Income Gap (%) | 1,261 | 24.14% |
| Wage / Income Gap ($) | 1,261 | 75.86¢ per $1 |
| Gini / Inequality Index | 1,261 | 0.38 |
Earnings by Sex in McGraw
Average Earnings in McGraw are $34,613, $41,607 for men and $31,563 for women, a difference of 24.1%.
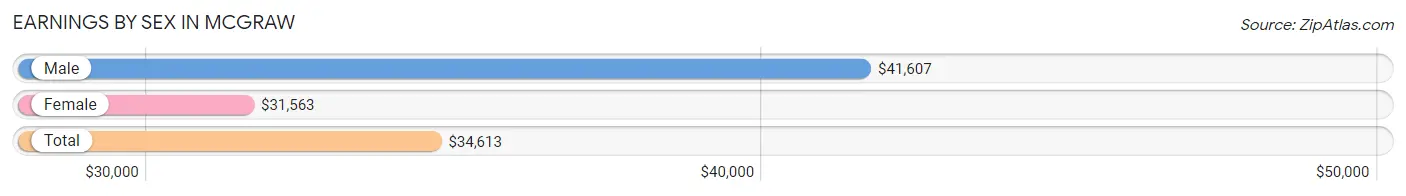
| Sex | Number | Average Earnings |
| Male | 299 (51.5%) | $41,607 |
| Female | 282 (48.5%) | $31,563 |
| Total | 581 (100.0%) | $34,613 |
Earnings by Sex by Income Bracket in McGraw
The most common earnings brackets in McGraw are $55,000 to $64,999 for men (79 | 26.4%) and $40,000 to $44,999 for women (44 | 15.6%).
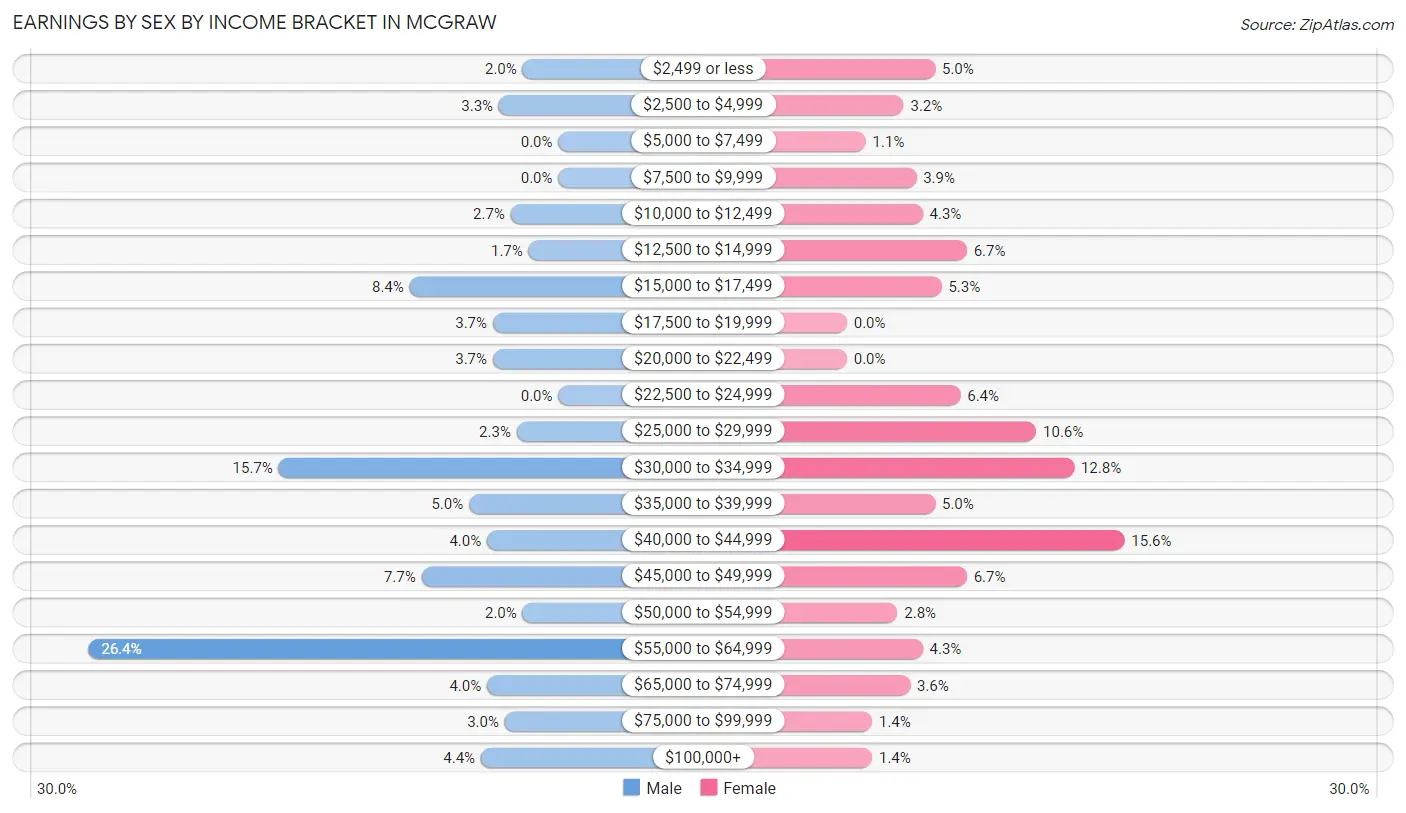
| Income | Male | Female |
| $2,499 or less | 6 (2.0%) | 14 (5.0%) |
| $2,500 to $4,999 | 10 (3.3%) | 9 (3.2%) |
| $5,000 to $7,499 | 0 (0.0%) | 3 (1.1%) |
| $7,500 to $9,999 | 0 (0.0%) | 11 (3.9%) |
| $10,000 to $12,499 | 8 (2.7%) | 12 (4.3%) |
| $12,500 to $14,999 | 5 (1.7%) | 19 (6.7%) |
| $15,000 to $17,499 | 25 (8.4%) | 15 (5.3%) |
| $17,500 to $19,999 | 11 (3.7%) | 0 (0.0%) |
| $20,000 to $22,499 | 11 (3.7%) | 0 (0.0%) |
| $22,500 to $24,999 | 0 (0.0%) | 18 (6.4%) |
| $25,000 to $29,999 | 7 (2.3%) | 30 (10.6%) |
| $30,000 to $34,999 | 47 (15.7%) | 36 (12.8%) |
| $35,000 to $39,999 | 15 (5.0%) | 14 (5.0%) |
| $40,000 to $44,999 | 12 (4.0%) | 44 (15.6%) |
| $45,000 to $49,999 | 23 (7.7%) | 19 (6.7%) |
| $50,000 to $54,999 | 6 (2.0%) | 8 (2.8%) |
| $55,000 to $64,999 | 79 (26.4%) | 12 (4.3%) |
| $65,000 to $74,999 | 12 (4.0%) | 10 (3.5%) |
| $75,000 to $99,999 | 9 (3.0%) | 4 (1.4%) |
| $100,000+ | 13 (4.3%) | 4 (1.4%) |
| Total | 299 (100.0%) | 282 (100.0%) |
Earnings by Sex by Educational Attainment in McGraw
Average earnings in McGraw are $46,630 for men and $32,031 for women, a difference of 31.3%. Men with an educational attainment of bachelor's degree enjoy the highest average annual earnings of $60,104, while those with high school diploma education earn the least with $40,536. Women with an educational attainment of graduate degree earn the most with the average annual earnings of $76,250, while those with high school diploma education have the smallest earnings of $28,882.
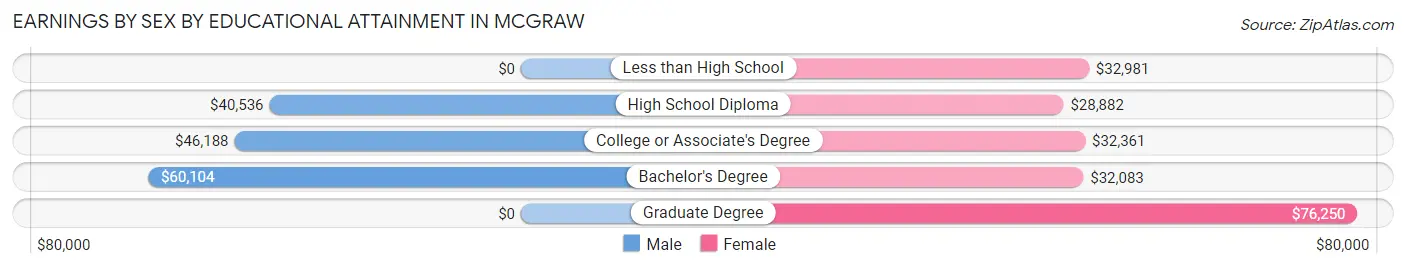
| Educational Attainment | Male Income | Female Income |
| Less than High School | - | - |
| High School Diploma | $40,536 | $28,882 |
| College or Associate's Degree | $46,188 | $32,361 |
| Bachelor's Degree | $60,104 | $32,083 |
| Graduate Degree | - | - |
| Total | $46,630 | $32,031 |
Family Income in McGraw
Family Income Brackets in McGraw
According to the McGraw family income data, there are 90 families falling into the $50,000 to $74,999 income range, which is the most common income bracket and makes up 30.8% of all families.
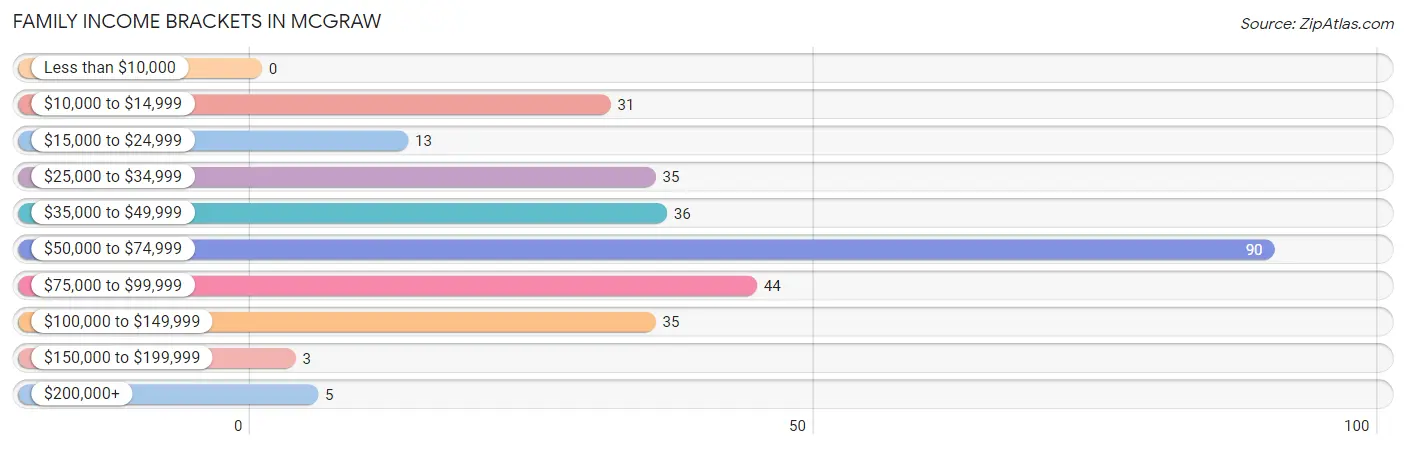
| Income Bracket | # Families | % Families |
| Less than $10,000 | 0 | 0.0% |
| $10,000 to $14,999 | 31 | 10.6% |
| $15,000 to $24,999 | 13 | 4.5% |
| $25,000 to $34,999 | 35 | 12.0% |
| $35,000 to $49,999 | 36 | 12.3% |
| $50,000 to $74,999 | 90 | 30.8% |
| $75,000 to $99,999 | 44 | 15.1% |
| $100,000 to $149,999 | 35 | 12.0% |
| $150,000 to $199,999 | 3 | 1.0% |
| $200,000+ | 5 | 1.7% |
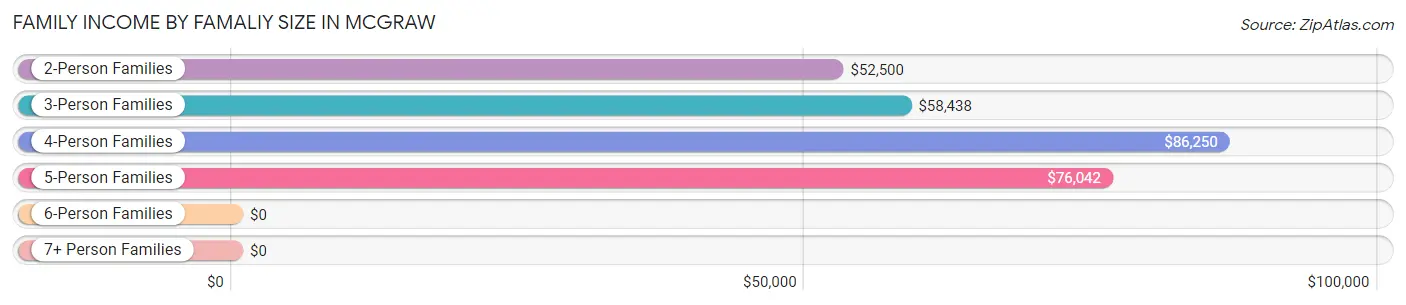
Family Income by Famaliy Size in McGraw
4-person families (47 | 16.1%) account for the highest median family income in McGraw with $86,250 per family, while 2-person families (158 | 54.1%) have the highest median income of $26,250 per family member.
| Income Bracket | # Families | Median Income |
| 2-Person Families | 158 (54.1%) | $52,500 |
| 3-Person Families | 31 (10.6%) | $58,438 |
| 4-Person Families | 47 (16.1%) | $86,250 |
| 5-Person Families | 44 (15.1%) | $76,042 |
| 6-Person Families | 10 (3.4%) | $0 |
| 7+ Person Families | 2 (0.7%) | $0 |
| Total | 292 (100.0%) | $55,833 |
Family Income by Number of Earners in McGraw
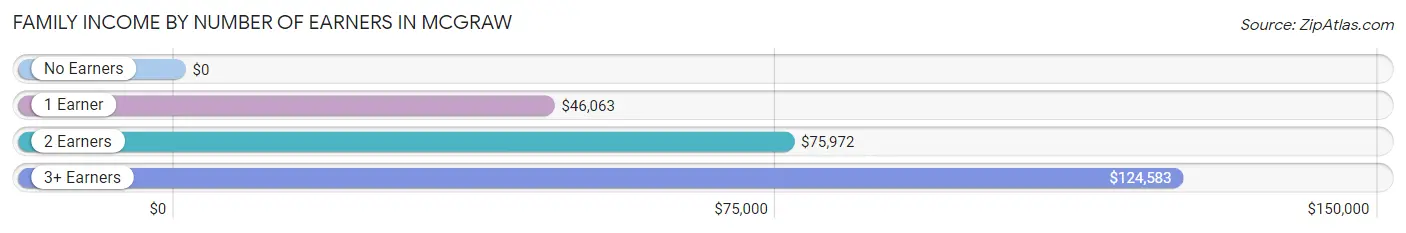
| Number of Earners | # Families | Median Income |
| No Earners | 48 (16.4%) | $0 |
| 1 Earner | 127 (43.5%) | $46,063 |
| 2 Earners | 94 (32.2%) | $75,972 |
| 3+ Earners | 23 (7.9%) | $124,583 |
| Total | 292 (100.0%) | $55,833 |
Household Income in McGraw
Household Income Brackets in McGraw
With 155 households falling in the category, the $50,000 to $74,999 income range is the most frequent in McGraw, accounting for 34.3% of all households. In contrast, only 2 households (0.4%) fall into the less than $10,000 income bracket, making it the least populous group.
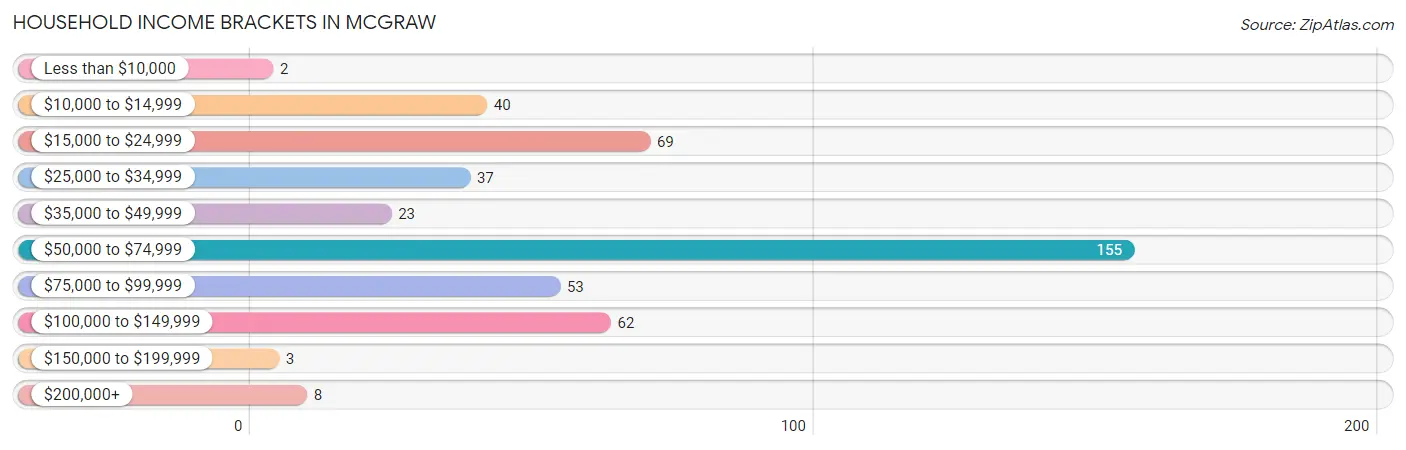
| Income Bracket | # Households | % Households |
| Less than $10,000 | 2 | 0.4% |
| $10,000 to $14,999 | 40 | 8.8% |
| $15,000 to $24,999 | 69 | 15.3% |
| $25,000 to $34,999 | 37 | 8.2% |
| $35,000 to $49,999 | 23 | 5.1% |
| $50,000 to $74,999 | 155 | 34.3% |
| $75,000 to $99,999 | 53 | 11.7% |
| $100,000 to $149,999 | 62 | 13.7% |
| $150,000 to $199,999 | 3 | 0.7% |
| $200,000+ | 8 | 1.8% |
Household Income by Householder Age in McGraw
The median household income in McGraw is $60,781, with the highest median household income of $69,531 found in the 25 to 44 years age bracket for the primary householder. A total of 150 households (33.2%) fall into this category. Meanwhile, the 15 to 24 years age bracket for the primary householder has the lowest median household income of $0, with 63 households (13.9%) in this group.
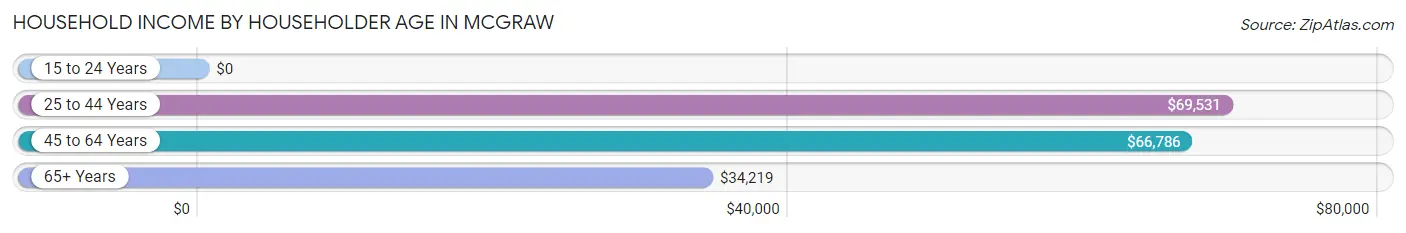
| Income Bracket | # Households | Median Income |
| 15 to 24 Years | 63 (13.9%) | $0 |
| 25 to 44 Years | 150 (33.2%) | $69,531 |
| 45 to 64 Years | 122 (27.0%) | $66,786 |
| 65+ Years | 117 (25.9%) | $34,219 |
| Total | 452 (100.0%) | $60,781 |
Poverty in McGraw
Income Below Poverty by Sex and Age in McGraw
With 9.1% poverty level for males and 10.5% for females among the residents of McGraw, 65 to 74 year old males and 55 to 64 year old females are the most vulnerable to poverty, with 13 males (28.9%) and 18 females (36.0%) in their respective age groups living below the poverty level.
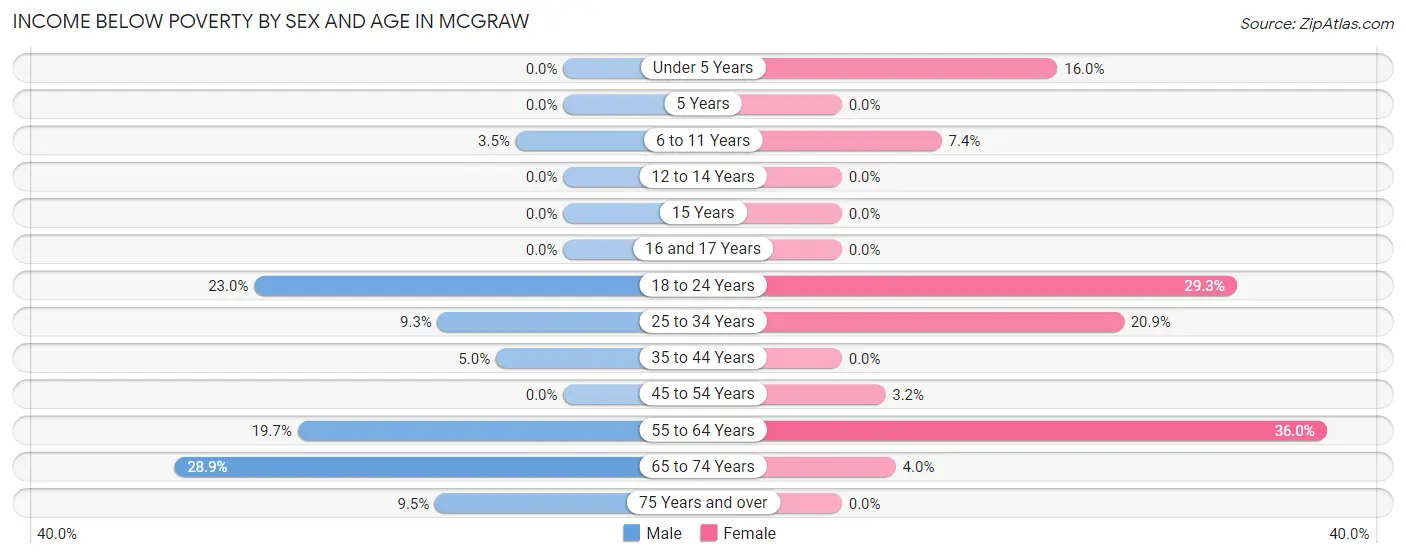
| Age Bracket | Male | Female |
| Under 5 Years | 0 (0.0%) | 4 (16.0%) |
| 5 Years | 0 (0.0%) | 0 (0.0%) |
| 6 to 11 Years | 4 (3.5%) | 4 (7.4%) |
| 12 to 14 Years | 0 (0.0%) | 0 (0.0%) |
| 15 Years | 0 (0.0%) | 0 (0.0%) |
| 16 and 17 Years | 0 (0.0%) | 0 (0.0%) |
| 18 to 24 Years | 14 (23.0%) | 17 (29.3%) |
| 25 to 34 Years | 7 (9.3%) | 9 (20.9%) |
| 35 to 44 Years | 5 (5.0%) | 0 (0.0%) |
| 45 to 54 Years | 0 (0.0%) | 2 (3.2%) |
| 55 to 64 Years | 14 (19.7%) | 18 (36.0%) |
| 65 to 74 Years | 13 (28.9%) | 2 (4.0%) |
| 75 Years and over | 4 (9.5%) | 0 (0.0%) |
| Total | 61 (9.1%) | 56 (10.5%) |
Income Above Poverty by Sex and Age in McGraw
According to the poverty statistics in McGraw, males aged under 5 years and females aged 5 years are the age groups that are most secure financially, with 100.0% of males and 100.0% of females in these age groups living above the poverty line.
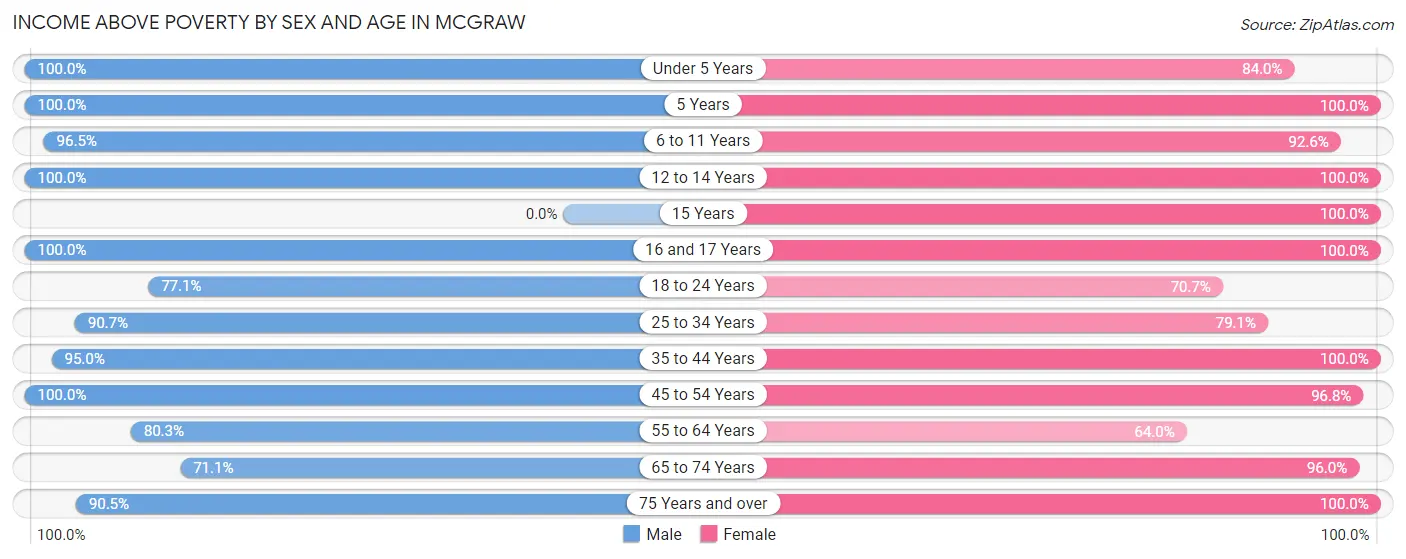
| Age Bracket | Male | Female |
| Under 5 Years | 17 (100.0%) | 21 (84.0%) |
| 5 Years | 28 (100.0%) | 8 (100.0%) |
| 6 to 11 Years | 109 (96.5%) | 50 (92.6%) |
| 12 to 14 Years | 66 (100.0%) | 30 (100.0%) |
| 15 Years | 0 (0.0%) | 1 (100.0%) |
| 16 and 17 Years | 10 (100.0%) | 18 (100.0%) |
| 18 to 24 Years | 47 (77.0%) | 41 (70.7%) |
| 25 to 34 Years | 68 (90.7%) | 34 (79.1%) |
| 35 to 44 Years | 95 (95.0%) | 92 (100.0%) |
| 45 to 54 Years | 42 (100.0%) | 60 (96.8%) |
| 55 to 64 Years | 57 (80.3%) | 32 (64.0%) |
| 65 to 74 Years | 32 (71.1%) | 48 (96.0%) |
| 75 Years and over | 38 (90.5%) | 43 (100.0%) |
| Total | 609 (90.9%) | 478 (89.5%) |
Income Below Poverty Among Married-Couple Families in McGraw
The poverty statistics for married-couple families in McGraw show that 10.1% or 18 of the total 178 families live below the poverty line. Families with 3 or 4 children have the highest poverty rate of 19.1%, comprising of 4 families. On the other hand, families with 1 or 2 children have the lowest poverty rate of 0.0%, which includes 0 families.
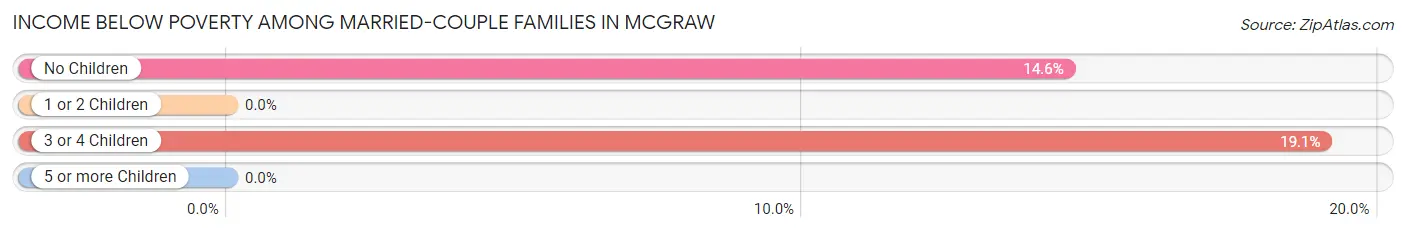
| Children | Above Poverty | Below Poverty |
| No Children | 82 (85.4%) | 14 (14.6%) |
| 1 or 2 Children | 59 (100.0%) | 0 (0.0%) |
| 3 or 4 Children | 17 (80.9%) | 4 (19.1%) |
| 5 or more Children | 2 (100.0%) | 0 (0.0%) |
| Total | 160 (89.9%) | 18 (10.1%) |
Income Below Poverty Among Single-Parent Households in McGraw
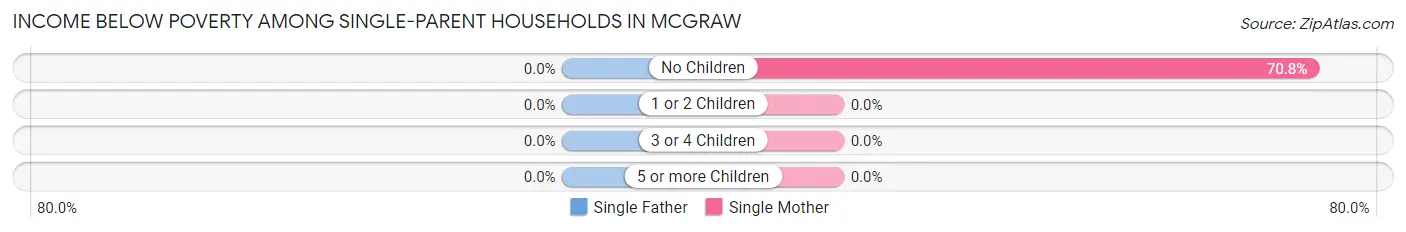
| Children | Single Father | Single Mother |
| No Children | 0 (0.0%) | 17 (70.8%) |
| 1 or 2 Children | 0 (0.0%) | 0 (0.0%) |
| 3 or 4 Children | 0 (0.0%) | 0 (0.0%) |
| 5 or more Children | 0 (0.0%) | 0 (0.0%) |
| Total | 0 (0.0%) | 17 (22.7%) |
Income Below Poverty Among Married-Couple vs Single-Parent Households in McGraw
The poverty data for McGraw shows that 18 of the married-couple family households (10.1%) and 17 of the single-parent households (14.9%) are living below the poverty level. Within the married-couple family households, those with 3 or 4 children have the highest poverty rate, with 4 households (19.1%) falling below the poverty line. Among the single-parent households, those with no children have the highest poverty rate, with 17 household (51.5%) living below poverty.

| Children | Married-Couple Families | Single-Parent Households |
| No Children | 14 (14.6%) | 17 (51.5%) |
| 1 or 2 Children | 0 (0.0%) | 0 (0.0%) |
| 3 or 4 Children | 4 (19.1%) | 0 (0.0%) |
| 5 or more Children | 0 (0.0%) | 0 (0.0%) |
| Total | 18 (10.1%) | 17 (14.9%) |
Race in McGraw
The most populous races in McGraw are White / Caucasian (1,143 | 90.6%), Two or more Races (84 | 6.7%), and Hispanic or Latino (41 | 3.3%).
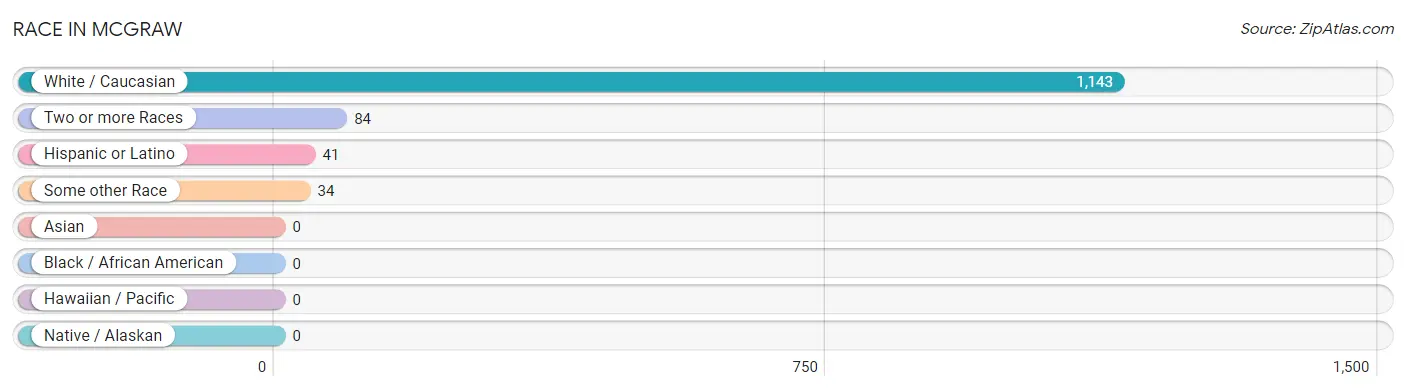
| Race | # Population | % Population |
| Asian | 0 | 0.0% |
| Black / African American | 0 | 0.0% |
| Hawaiian / Pacific | 0 | 0.0% |
| Hispanic or Latino | 41 | 3.3% |
| Native / Alaskan | 0 | 0.0% |
| White / Caucasian | 1,143 | 90.6% |
| Two or more Races | 84 | 6.7% |
| Some other Race | 34 | 2.7% |
| Total | 1,261 | 100.0% |
Ancestry in McGraw
The most populous ancestries reported in McGraw are Irish (289 | 22.9%), English (243 | 19.3%), German (145 | 11.5%), Italian (141 | 11.2%), and American (129 | 10.2%), together accounting for 75.1% of all McGraw residents.
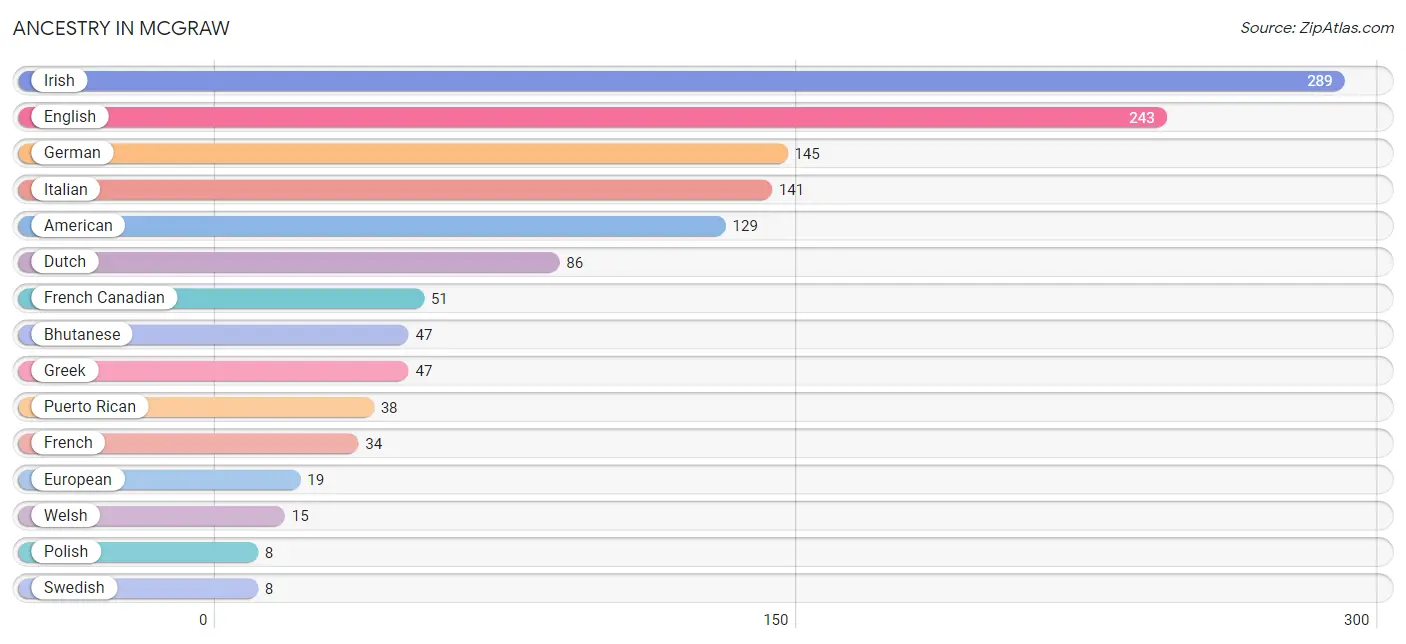
| Ancestry | # Population | % Population |
| American | 129 | 10.2% |
| Bhutanese | 47 | 3.7% |
| Colombian | 3 | 0.2% |
| Czech | 4 | 0.3% |
| Dutch | 86 | 6.8% |
| English | 243 | 19.3% |
| European | 19 | 1.5% |
| Finnish | 2 | 0.2% |
| French | 34 | 2.7% |
| French Canadian | 51 | 4.0% |
| German | 145 | 11.5% |
| Greek | 47 | 3.7% |
| Irish | 289 | 22.9% |
| Italian | 141 | 11.2% |
| Polish | 8 | 0.6% |
| Puerto Rican | 38 | 3.0% |
| Russian | 3 | 0.2% |
| Scandinavian | 4 | 0.3% |
| Scotch-Irish | 2 | 0.2% |
| Scottish | 5 | 0.4% |
| South American | 3 | 0.2% |
| Swedish | 8 | 0.6% |
| Welsh | 15 | 1.2% | View All 23 Rows |
Immigrants in McGraw
The most numerous immigrant groups reported in McGraw came from Canada (4 | 0.3%), Colombia (3 | 0.2%), Latin America (3 | 0.2%), and South America (3 | 0.2%), together accounting for 1.0% of all McGraw residents.
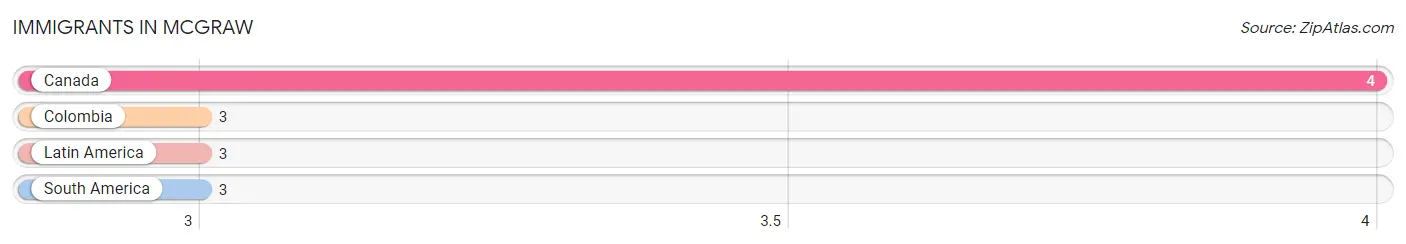
| Immigration Origin | # Population | % Population |
| Canada | 4 | 0.3% |
| Colombia | 3 | 0.2% |
| Latin America | 3 | 0.2% |
| South America | 3 | 0.2% | View All 4 Rows |
Sex and Age in McGraw
Sex and Age in McGraw
The most populous age groups in McGraw are 5 to 9 Years (165 | 22.7%) for men and 10 to 14 Years (60 | 11.2%) for women.
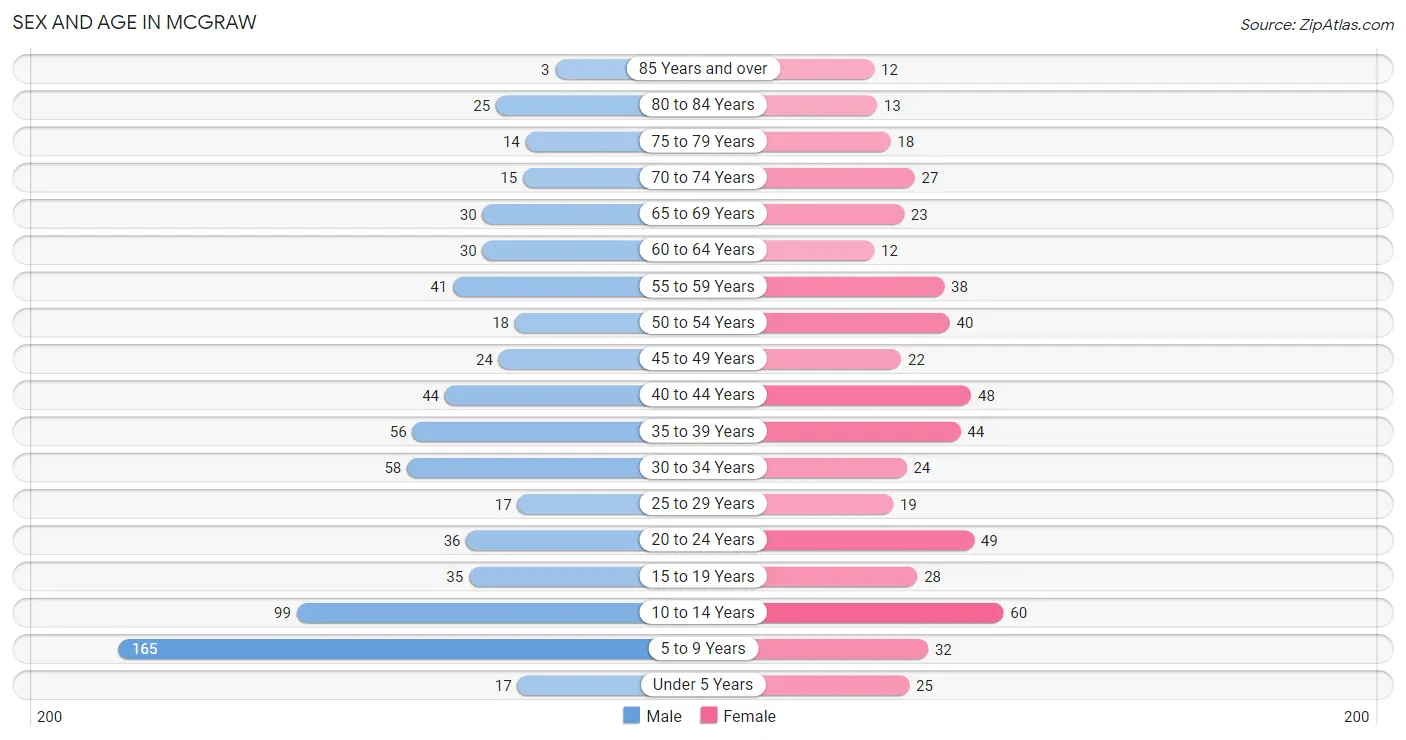
| Age Bracket | Male | Female |
| Under 5 Years | 17 (2.3%) | 25 (4.7%) |
| 5 to 9 Years | 165 (22.7%) | 32 (6.0%) |
| 10 to 14 Years | 99 (13.6%) | 60 (11.2%) |
| 15 to 19 Years | 35 (4.8%) | 28 (5.2%) |
| 20 to 24 Years | 36 (5.0%) | 49 (9.2%) |
| 25 to 29 Years | 17 (2.3%) | 19 (3.6%) |
| 30 to 34 Years | 58 (8.0%) | 24 (4.5%) |
| 35 to 39 Years | 56 (7.7%) | 44 (8.2%) |
| 40 to 44 Years | 44 (6.0%) | 48 (9.0%) |
| 45 to 49 Years | 24 (3.3%) | 22 (4.1%) |
| 50 to 54 Years | 18 (2.5%) | 40 (7.5%) |
| 55 to 59 Years | 41 (5.6%) | 38 (7.1%) |
| 60 to 64 Years | 30 (4.1%) | 12 (2.2%) |
| 65 to 69 Years | 30 (4.1%) | 23 (4.3%) |
| 70 to 74 Years | 15 (2.1%) | 27 (5.1%) |
| 75 to 79 Years | 14 (1.9%) | 18 (3.4%) |
| 80 to 84 Years | 25 (3.4%) | 13 (2.4%) |
| 85 Years and over | 3 (0.4%) | 12 (2.2%) |
| Total | 727 (100.0%) | 534 (100.0%) |
Families and Households in McGraw
Median Family Size in McGraw
The median family size in McGraw is 3.16 persons per family, with married-couple families (178 | 61.0%) accounting for the largest median family size of 3.49 persons per family. On the other hand, single male/father families (39 | 13.4%) represent the smallest median family size with 2.33 persons per family.
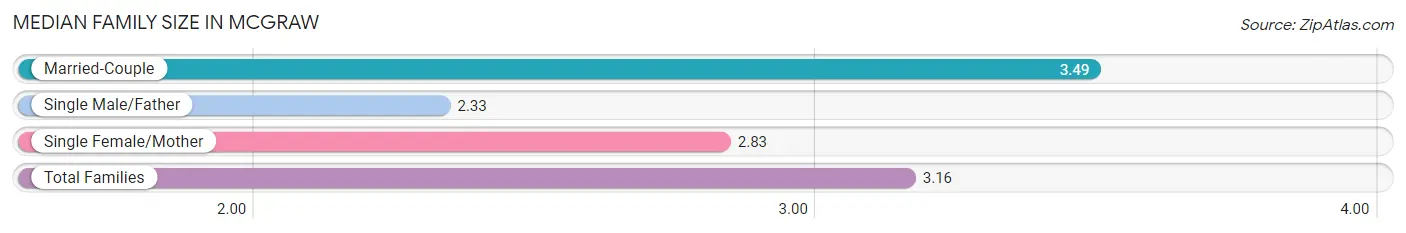
| Family Type | # Families | Family Size |
| Married-Couple | 178 (61.0%) | 3.49 |
| Single Male/Father | 39 (13.4%) | 2.33 |
| Single Female/Mother | 75 (25.7%) | 2.83 |
| Total Families | 292 (100.0%) | 3.16 |
Median Household Size in McGraw
The median household size in McGraw is 2.77 persons per household, with single male/father households (39 | 8.6%) accounting for the largest median household size of 4.56 persons per household. non-family households (160 | 35.4%) represent the smallest median household size with 1.26 persons per household.
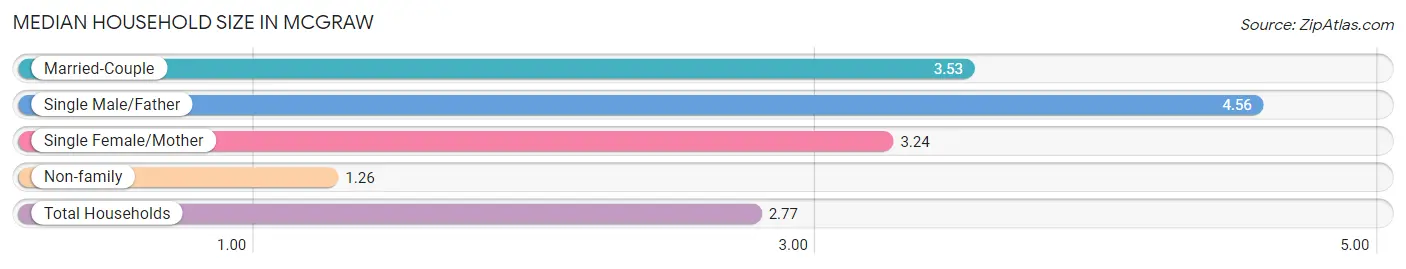
| Household Type | # Households | Household Size |
| Married-Couple | 178 (39.4%) | 3.53 |
| Single Male/Father | 39 (8.6%) | 4.56 |
| Single Female/Mother | 75 (16.6%) | 3.24 |
| Non-family | 160 (35.4%) | 1.26 |
| Total Households | 452 (100.0%) | 2.77 |
Household Size by Marriage Status in McGraw
Out of a total of 452 households in McGraw, 292 (64.6%) are family households, while 160 (35.4%) are nonfamily households. The most numerous type of family households are 2-person households, comprising 125, and the most common type of nonfamily households are 1-person households, comprising 105.
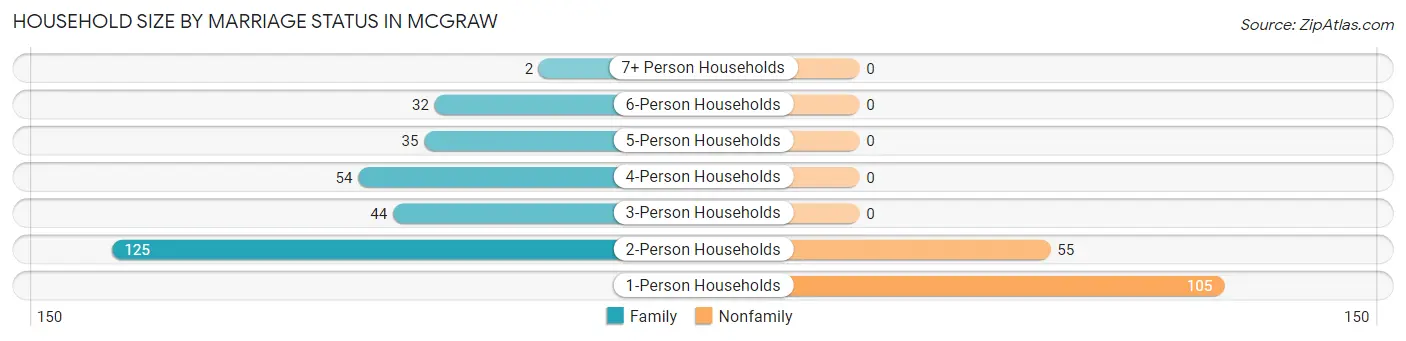
| Household Size | Family Households | Nonfamily Households |
| 1-Person Households | - | 105 (23.2%) |
| 2-Person Households | 125 (27.7%) | 55 (12.2%) |
| 3-Person Households | 44 (9.7%) | 0 (0.0%) |
| 4-Person Households | 54 (11.9%) | 0 (0.0%) |
| 5-Person Households | 35 (7.7%) | 0 (0.0%) |
| 6-Person Households | 32 (7.1%) | 0 (0.0%) |
| 7+ Person Households | 2 (0.4%) | 0 (0.0%) |
| Total | 292 (64.6%) | 160 (35.4%) |
Female Fertility in McGraw
Fertility by Age in McGraw
Average fertility rate in McGraw is 21.0 births per 1,000 women. Women in the age bracket of 20 to 34 years have the highest fertility rate with 54.0 births per 1,000 women. Women in the age bracket of 20 to 34 years acount for 100.0% of all women with births.
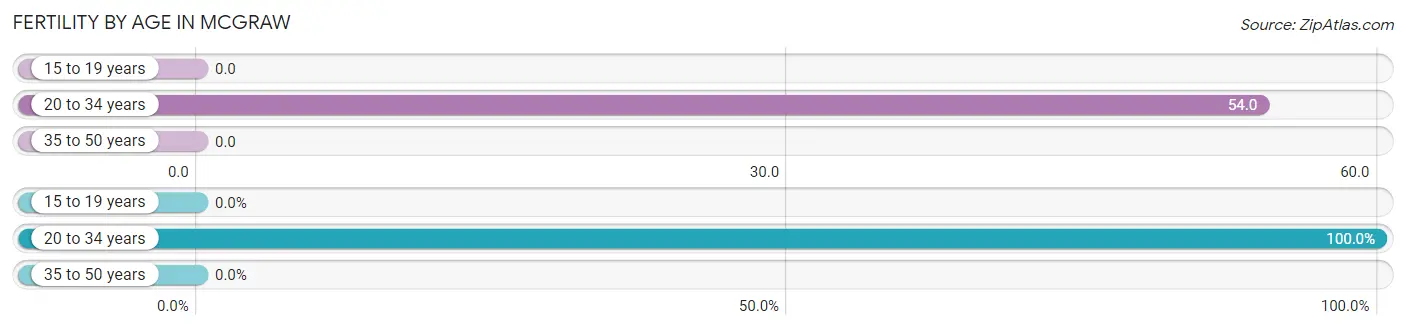
| Age Bracket | Women with Births | Births / 1,000 Women |
| 15 to 19 years | 0 (0.0%) | 0.0 |
| 20 to 34 years | 5 (100.0%) | 54.0 |
| 35 to 50 years | 0 (0.0%) | 0.0 |
| Total | 5 (100.0%) | 21.0 |
Fertility by Age by Marriage Status in McGraw
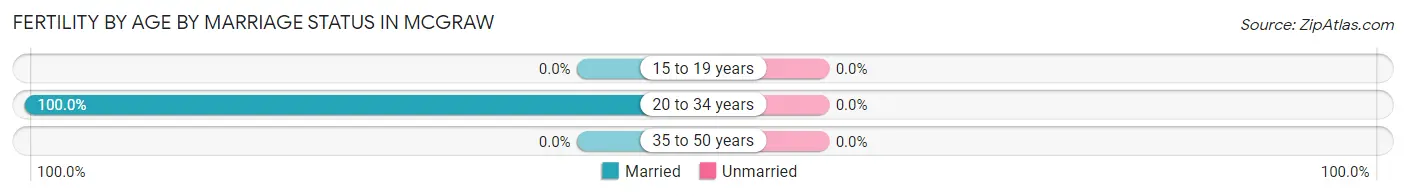
| Age Bracket | Married | Unmarried |
| 15 to 19 years | 0 (0.0%) | 0 (0.0%) |
| 20 to 34 years | 5 (100.0%) | 0 (0.0%) |
| 35 to 50 years | 0 (0.0%) | 0 (0.0%) |
| Total | 5 (100.0%) | 0 (0.0%) |
Fertility by Education in McGraw
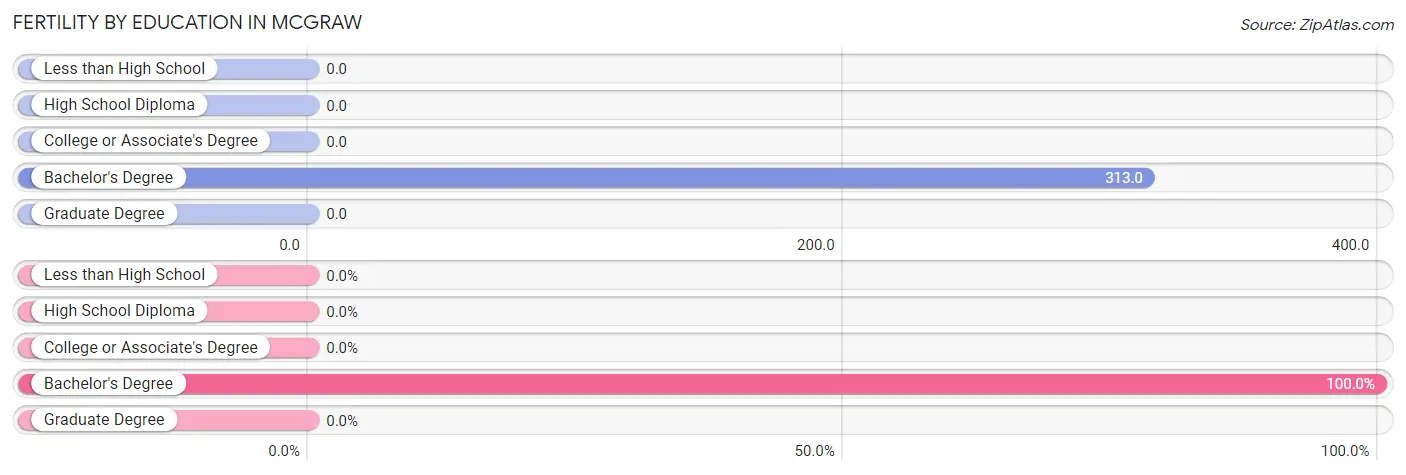
| Educational Attainment | Women with Births | Births / 1,000 Women |
| Less than High School | 0 (0.0%) | 0.0 |
| High School Diploma | 0 (0.0%) | 0.0 |
| College or Associate's Degree | 0 (0.0%) | 0.0 |
| Bachelor's Degree | 5 (100.0%) | 313.0 |
| Graduate Degree | 0 (0.0%) | 0.0 |
| Total | 5 (100.0%) | 21.0 |
Fertility by Education by Marriage Status in McGraw
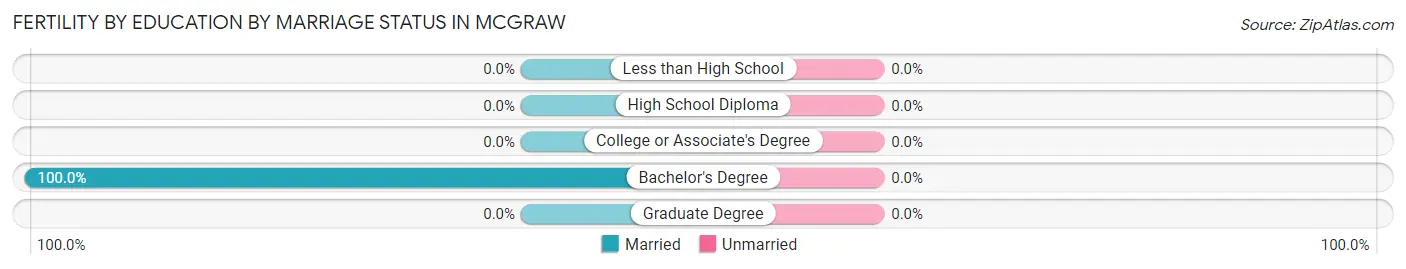
| Educational Attainment | Married | Unmarried |
| Less than High School | 0 (0.0%) | 0 (0.0%) |
| High School Diploma | 0 (0.0%) | 0 (0.0%) |
| College or Associate's Degree | 0 (0.0%) | 0 (0.0%) |
| Bachelor's Degree | 5 (100.0%) | 0 (0.0%) |
| Graduate Degree | 0 (0.0%) | 0 (0.0%) |
| Total | 5 (100.0%) | 0 (0.0%) |
Employment Characteristics in McGraw
Employment by Class of Employer in McGraw
Among the 487 employed individuals in McGraw, private company employees (308 | 63.2%), not-for-profit organizations (55 | 11.3%), and state government employees (39 | 8.0%) make up the most common classes of employment.
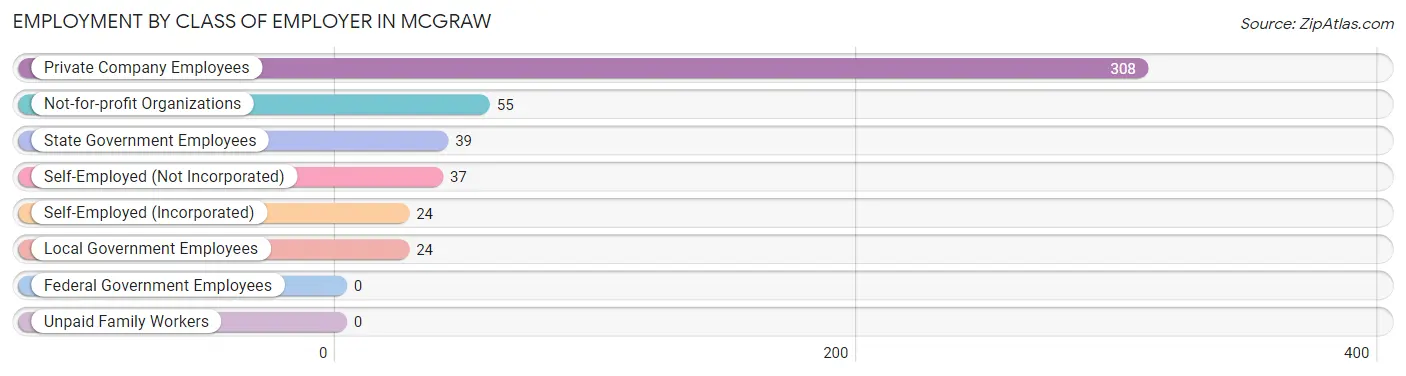
| Employer Class | # Employees | % Employees |
| Private Company Employees | 308 | 63.2% |
| Self-Employed (Incorporated) | 24 | 4.9% |
| Self-Employed (Not Incorporated) | 37 | 7.6% |
| Not-for-profit Organizations | 55 | 11.3% |
| Local Government Employees | 24 | 4.9% |
| State Government Employees | 39 | 8.0% |
| Federal Government Employees | 0 | 0.0% |
| Unpaid Family Workers | 0 | 0.0% |
| Total | 487 | 100.0% |
Employment Status by Age in McGraw
According to the labor force statistics for McGraw, out of the total population over 16 years of age (862), 65.2% or 562 individuals are in the labor force, with 7.7% or 43 of them unemployed. The age group with the highest labor force participation rate is 20 to 24 years, with 95.3% or 81 individuals in the labor force. Within the labor force, the 55 to 59 years age range has the highest percentage of unemployed individuals, with 32.4% or 11 of them being unemployed.
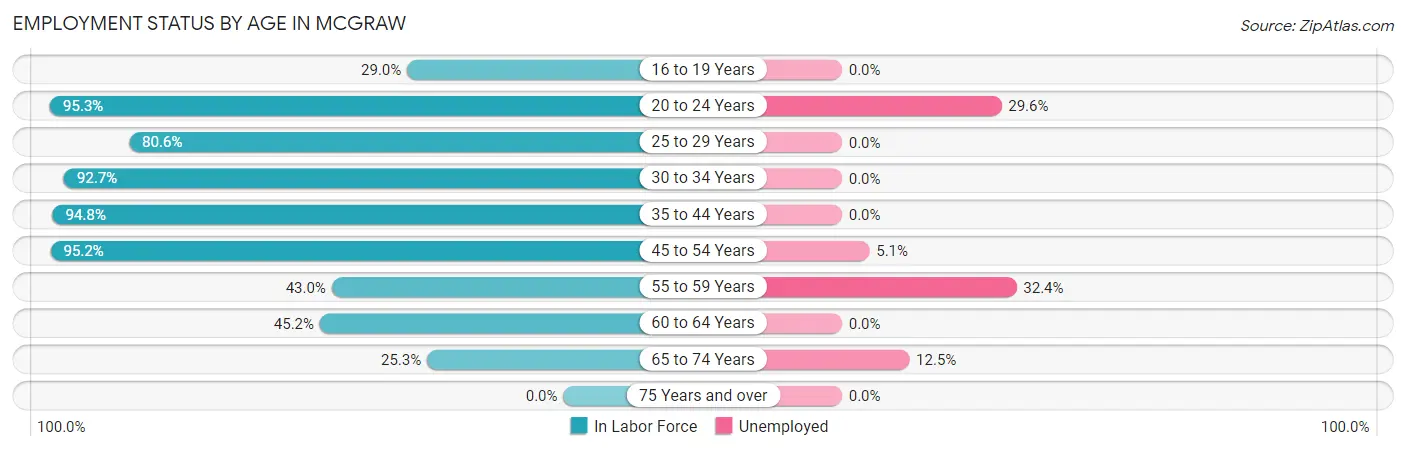
| Age Bracket | In Labor Force | Unemployed |
| 16 to 19 Years | 18 (29.0%) | 0 (0.0%) |
| 20 to 24 Years | 81 (95.3%) | 24 (29.6%) |
| 25 to 29 Years | 29 (80.6%) | 0 (0.0%) |
| 30 to 34 Years | 76 (92.7%) | 0 (0.0%) |
| 35 to 44 Years | 182 (94.8%) | 0 (0.0%) |
| 45 to 54 Years | 99 (95.2%) | 5 (5.1%) |
| 55 to 59 Years | 34 (43.0%) | 11 (32.4%) |
| 60 to 64 Years | 19 (45.2%) | 0 (0.0%) |
| 65 to 74 Years | 24 (25.3%) | 3 (12.5%) |
| 75 Years and over | 0 (0.0%) | 0 (0.0%) |
| Total | 562 (65.2%) | 43 (7.7%) |
Employment Status by Educational Attainment in McGraw
According to labor force statistics for McGraw, 82.1% of individuals (439) out of the total population between 25 and 64 years of age (535) are in the labor force, with 3.6% or 16 of them being unemployed. The group with the highest labor force participation rate are those with the educational attainment of bachelor's degree or higher, with 92.2% or 71 individuals in the labor force. Within the labor force, individuals with high school diploma education have the highest percentage of unemployment, with 5.8% or 11 of them being unemployed.
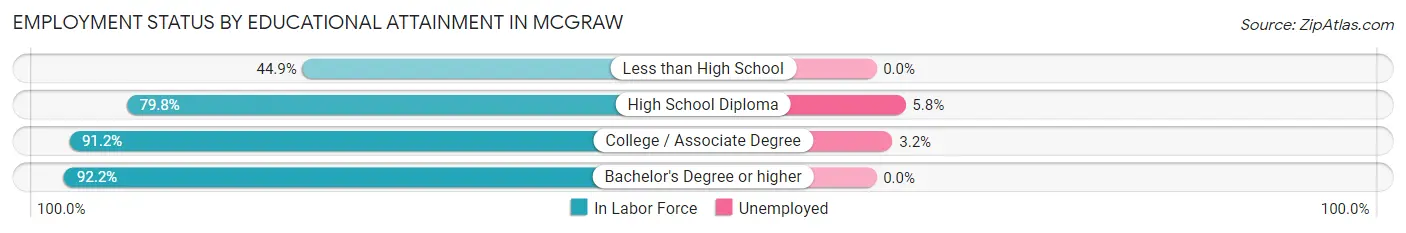
| Educational Attainment | In Labor Force | Unemployed |
| Less than High School | 22 (44.9%) | 0 (0.0%) |
| High School Diploma | 190 (79.8%) | 14 (5.8%) |
| College / Associate Degree | 156 (91.2%) | 5 (3.2%) |
| Bachelor's Degree or higher | 71 (92.2%) | 0 (0.0%) |
| Total | 439 (82.1%) | 19 (3.6%) |
Employment Occupations by Sex in McGraw
Management, Business, Science and Arts Occupations
The most common Management, Business, Science and Arts occupations in McGraw are Community & Social Service (60 | 11.6%), Management (40 | 7.7%), Education Instruction & Library (32 | 6.2%), Arts, Media & Entertainment (24 | 4.6%), and Health Diagnosing & Treating (17 | 3.3%).
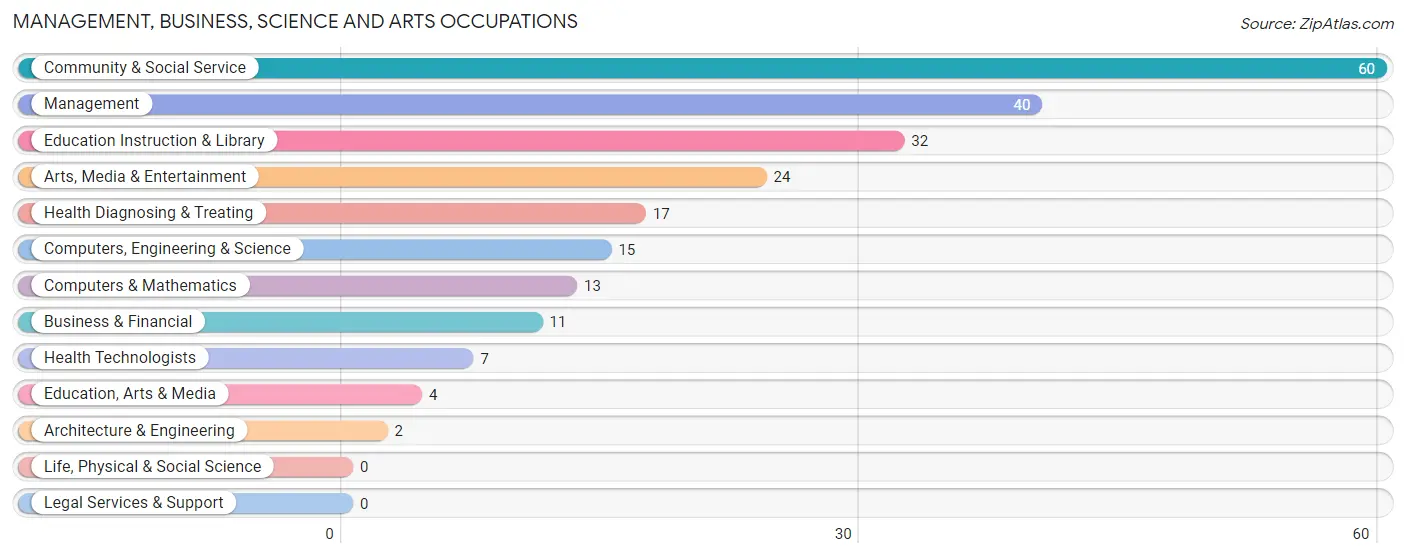
Management, Business, Science and Arts Occupations by Sex
Within the Management, Business, Science and Arts occupations in McGraw, the most male-oriented occupations are Architecture & Engineering (100.0%), Education, Arts & Media (100.0%), and Computers, Engineering & Science (80.0%), while the most female-oriented occupations are Arts, Media & Entertainment (100.0%), Health Diagnosing & Treating (100.0%), and Health Technologists (100.0%).
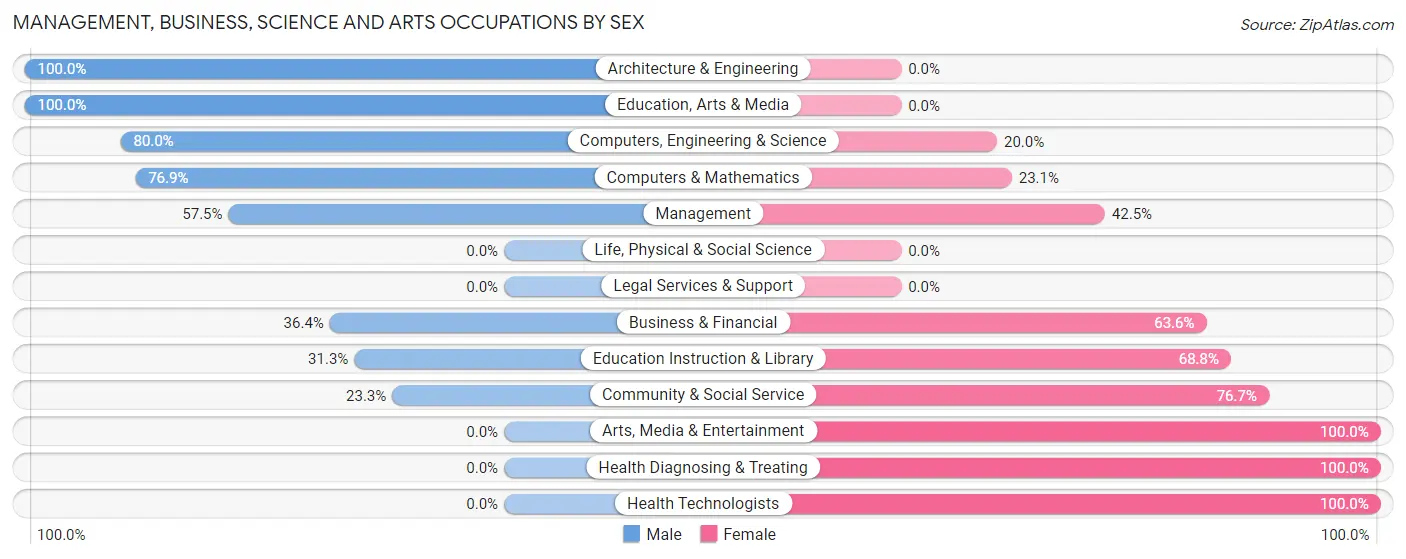
| Occupation | Male | Female |
| Management | 23 (57.5%) | 17 (42.5%) |
| Business & Financial | 4 (36.4%) | 7 (63.6%) |
| Computers, Engineering & Science | 12 (80.0%) | 3 (20.0%) |
| Computers & Mathematics | 10 (76.9%) | 3 (23.1%) |
| Architecture & Engineering | 2 (100.0%) | 0 (0.0%) |
| Life, Physical & Social Science | 0 (0.0%) | 0 (0.0%) |
| Community & Social Service | 14 (23.3%) | 46 (76.7%) |
| Education, Arts & Media | 4 (100.0%) | 0 (0.0%) |
| Legal Services & Support | 0 (0.0%) | 0 (0.0%) |
| Education Instruction & Library | 10 (31.2%) | 22 (68.8%) |
| Arts, Media & Entertainment | 0 (0.0%) | 24 (100.0%) |
| Health Diagnosing & Treating | 0 (0.0%) | 17 (100.0%) |
| Health Technologists | 0 (0.0%) | 7 (100.0%) |
| Total (Category) | 53 (37.1%) | 90 (62.9%) |
| Total (Overall) | 252 (48.5%) | 267 (51.4%) |
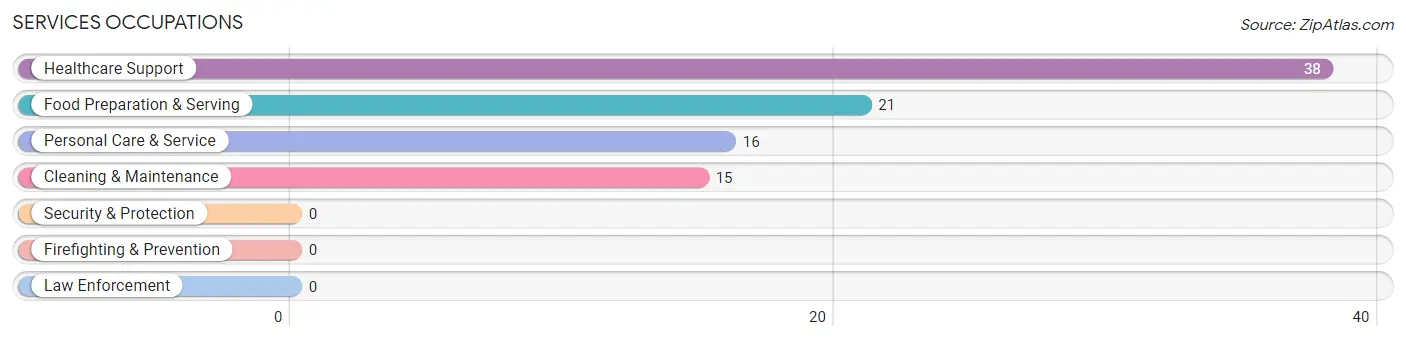
Services Occupations
The most common Services occupations in McGraw are Healthcare Support (38 | 7.3%), Food Preparation & Serving (21 | 4.1%), Personal Care & Service (16 | 3.1%), and Cleaning & Maintenance (15 | 2.9%).
Services Occupations by Sex
Within the Services occupations in McGraw, the most male-oriented occupations are Cleaning & Maintenance (26.7%), Personal Care & Service (25.0%), and Food Preparation & Serving (14.3%), while the most female-oriented occupations are Healthcare Support (100.0%), Food Preparation & Serving (85.7%), and Personal Care & Service (75.0%).
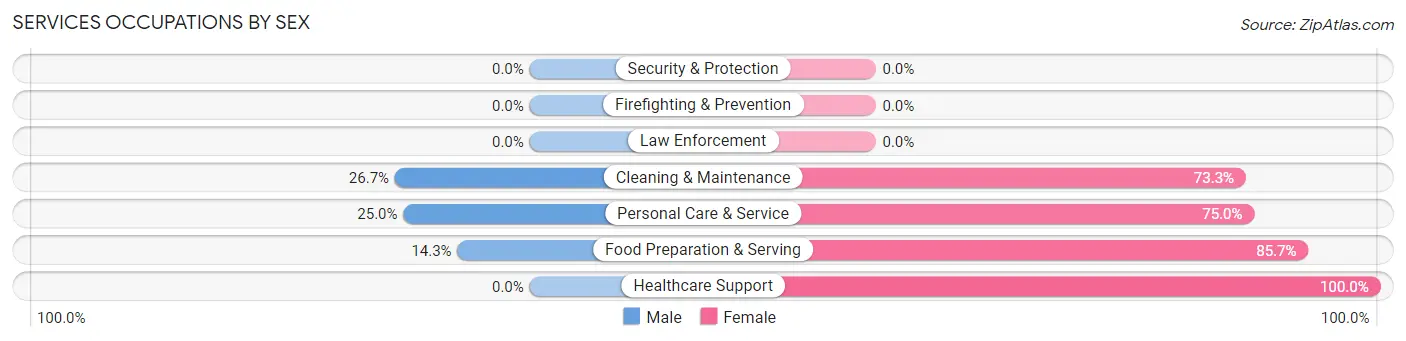
| Occupation | Male | Female |
| Healthcare Support | 0 (0.0%) | 38 (100.0%) |
| Security & Protection | 0 (0.0%) | 0 (0.0%) |
| Firefighting & Prevention | 0 (0.0%) | 0 (0.0%) |
| Law Enforcement | 0 (0.0%) | 0 (0.0%) |
| Food Preparation & Serving | 3 (14.3%) | 18 (85.7%) |
| Cleaning & Maintenance | 4 (26.7%) | 11 (73.3%) |
| Personal Care & Service | 4 (25.0%) | 12 (75.0%) |
| Total (Category) | 11 (12.2%) | 79 (87.8%) |
| Total (Overall) | 252 (48.5%) | 267 (51.4%) |
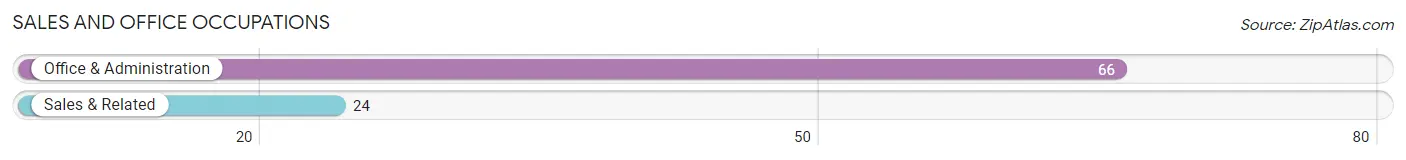
Sales and Office Occupations
The most common Sales and Office occupations in McGraw are Office & Administration (66 | 12.7%), and Sales & Related (24 | 4.6%).
Sales and Office Occupations by Sex
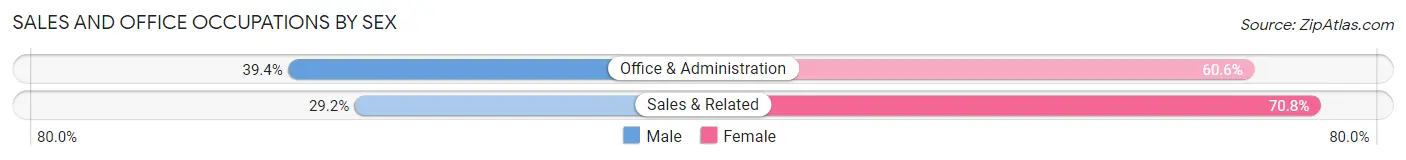
| Occupation | Male | Female |
| Sales & Related | 7 (29.2%) | 17 (70.8%) |
| Office & Administration | 26 (39.4%) | 40 (60.6%) |
| Total (Category) | 33 (36.7%) | 57 (63.3%) |
| Total (Overall) | 252 (48.5%) | 267 (51.4%) |
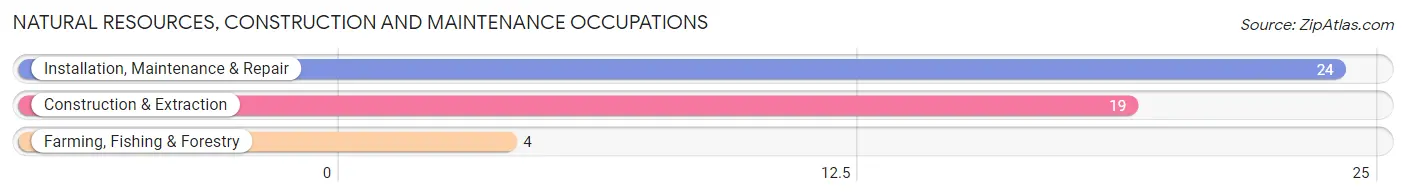
Natural Resources, Construction and Maintenance Occupations
The most common Natural Resources, Construction and Maintenance occupations in McGraw are Installation, Maintenance & Repair (24 | 4.6%), Construction & Extraction (19 | 3.7%), and Farming, Fishing & Forestry (4 | 0.8%).
Natural Resources, Construction and Maintenance Occupations by Sex
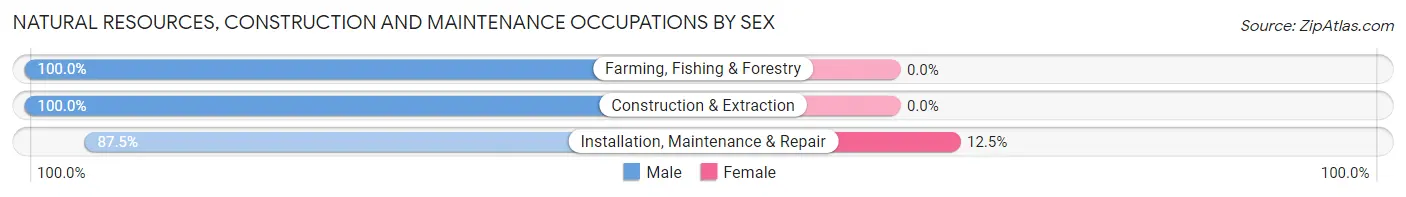
| Occupation | Male | Female |
| Farming, Fishing & Forestry | 4 (100.0%) | 0 (0.0%) |
| Construction & Extraction | 19 (100.0%) | 0 (0.0%) |
| Installation, Maintenance & Repair | 21 (87.5%) | 3 (12.5%) |
| Total (Category) | 44 (93.6%) | 3 (6.4%) |
| Total (Overall) | 252 (48.5%) | 267 (51.4%) |
Production, Transportation and Moving Occupations
The most common Production, Transportation and Moving occupations in McGraw are Production (97 | 18.7%), Transportation (28 | 5.4%), and Material Moving (24 | 4.6%).
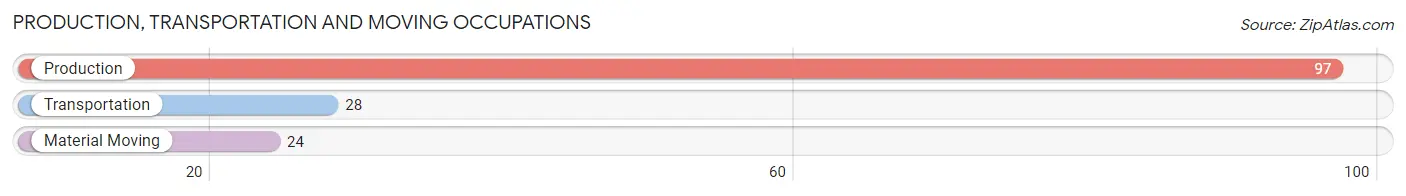
Production, Transportation and Moving Occupations by Sex
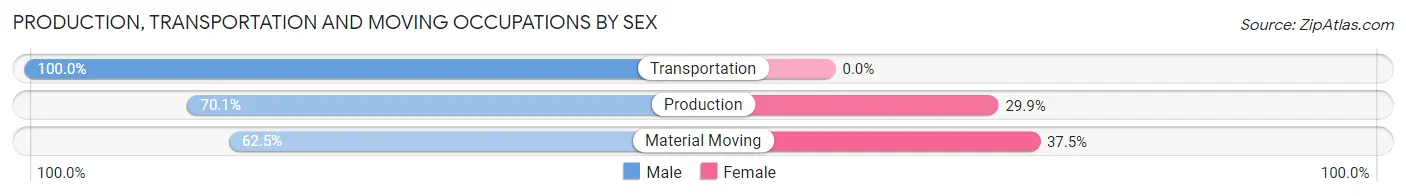
| Occupation | Male | Female |
| Production | 68 (70.1%) | 29 (29.9%) |
| Transportation | 28 (100.0%) | 0 (0.0%) |
| Material Moving | 15 (62.5%) | 9 (37.5%) |
| Total (Category) | 111 (74.5%) | 38 (25.5%) |
| Total (Overall) | 252 (48.5%) | 267 (51.4%) |
Employment Industries by Sex in McGraw
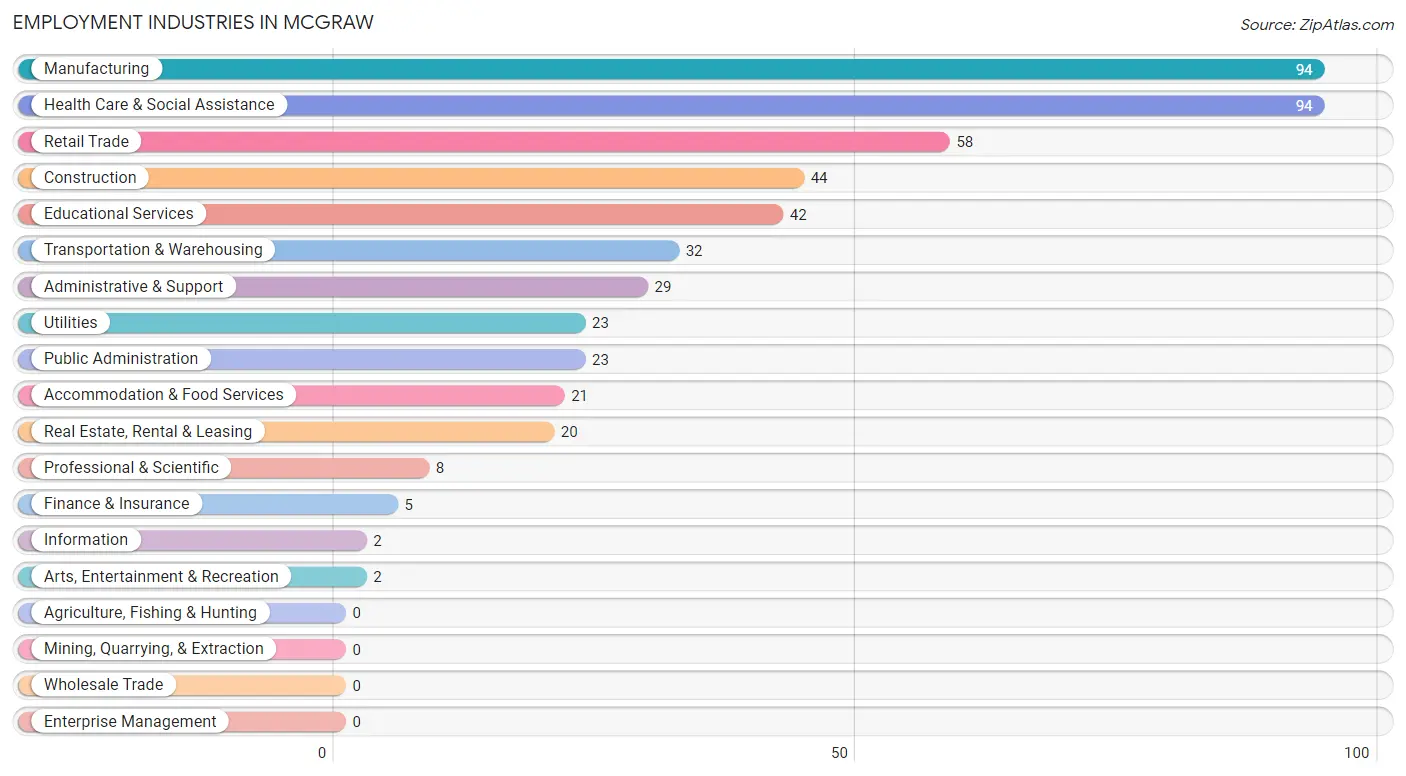
Employment Industries in McGraw
The major employment industries in McGraw include Manufacturing (94 | 18.1%), Health Care & Social Assistance (94 | 18.1%), Retail Trade (58 | 11.2%), Construction (44 | 8.5%), and Educational Services (42 | 8.1%).
Employment Industries by Sex in McGraw
The McGraw industries that see more men than women are Utilities (100.0%), Professional & Scientific (100.0%), and Arts, Entertainment & Recreation (100.0%), whereas the industries that tend to have a higher number of women are Information (100.0%), Finance & Insurance (100.0%), and Health Care & Social Assistance (91.5%).
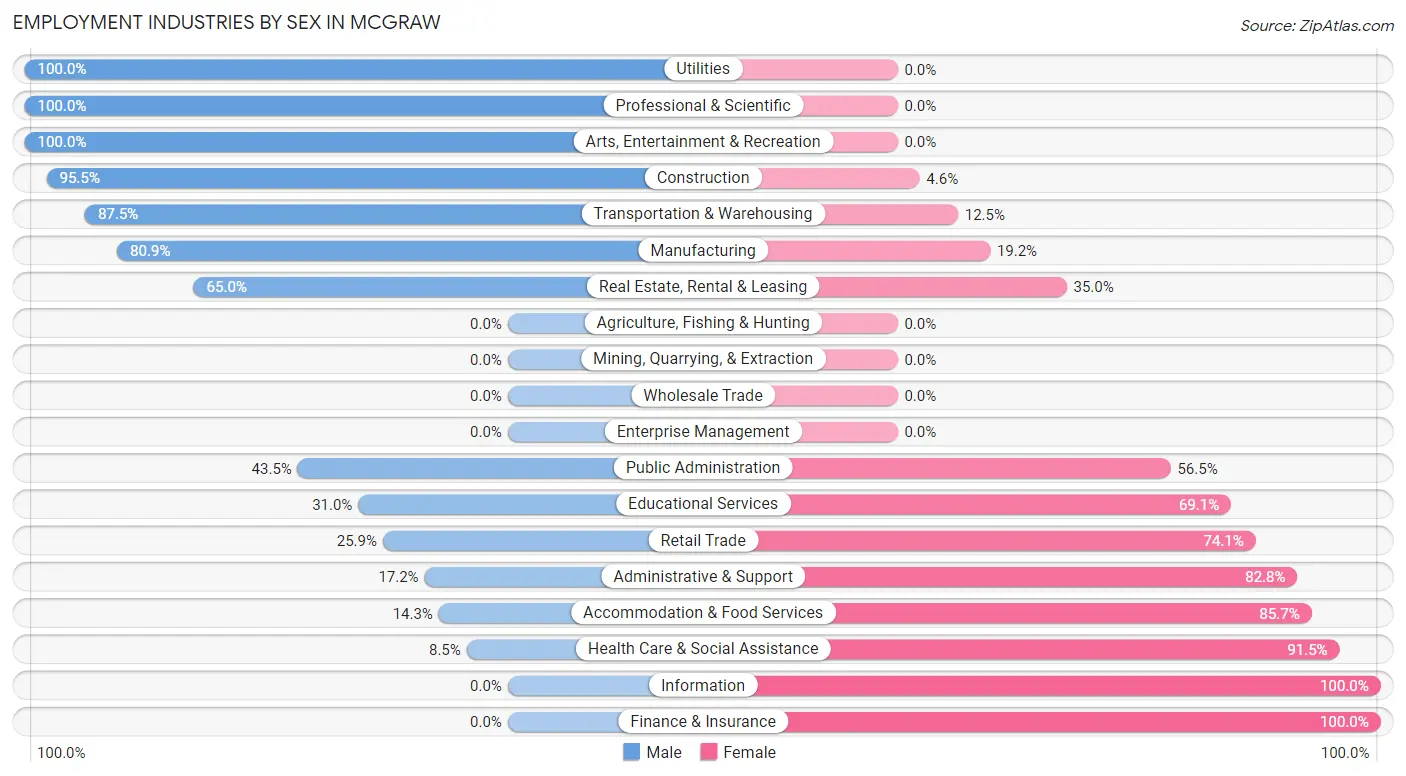
| Industry | Male | Female |
| Agriculture, Fishing & Hunting | 0 (0.0%) | 0 (0.0%) |
| Mining, Quarrying, & Extraction | 0 (0.0%) | 0 (0.0%) |
| Construction | 42 (95.5%) | 2 (4.5%) |
| Manufacturing | 76 (80.8%) | 18 (19.2%) |
| Wholesale Trade | 0 (0.0%) | 0 (0.0%) |
| Retail Trade | 15 (25.9%) | 43 (74.1%) |
| Transportation & Warehousing | 28 (87.5%) | 4 (12.5%) |
| Utilities | 23 (100.0%) | 0 (0.0%) |
| Information | 0 (0.0%) | 2 (100.0%) |
| Finance & Insurance | 0 (0.0%) | 5 (100.0%) |
| Real Estate, Rental & Leasing | 13 (65.0%) | 7 (35.0%) |
| Professional & Scientific | 8 (100.0%) | 0 (0.0%) |
| Enterprise Management | 0 (0.0%) | 0 (0.0%) |
| Administrative & Support | 5 (17.2%) | 24 (82.8%) |
| Educational Services | 13 (30.9%) | 29 (69.1%) |
| Health Care & Social Assistance | 8 (8.5%) | 86 (91.5%) |
| Arts, Entertainment & Recreation | 2 (100.0%) | 0 (0.0%) |
| Accommodation & Food Services | 3 (14.3%) | 18 (85.7%) |
| Public Administration | 10 (43.5%) | 13 (56.5%) |
| Total | 252 (48.5%) | 267 (51.4%) |
Education in McGraw
School Enrollment in McGraw
The most common levels of schooling among the 440 students in McGraw are elementary school (164 | 37.3%), middle school (137 | 31.1%), and high school (68 | 15.4%).
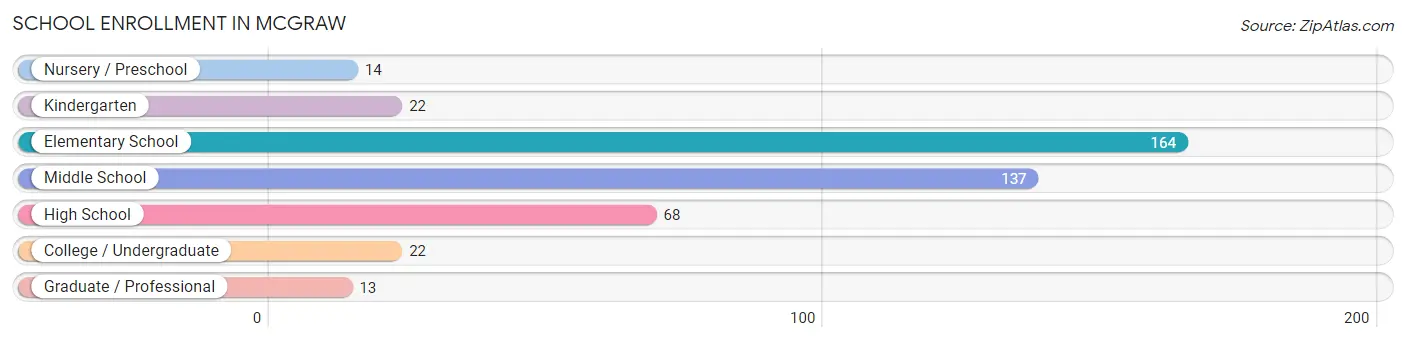
| School Level | # Students | % Students |
| Nursery / Preschool | 14 | 3.2% |
| Kindergarten | 22 | 5.0% |
| Elementary School | 164 | 37.3% |
| Middle School | 137 | 31.1% |
| High School | 68 | 15.4% |
| College / Undergraduate | 22 | 5.0% |
| Graduate / Professional | 13 | 2.9% |
| Total | 440 | 100.0% |
School Enrollment by Age by Funding Source in McGraw
Out of a total of 440 students who are enrolled in schools in McGraw, 7 (1.6%) attend a private institution, while the remaining 433 (98.4%) are enrolled in public schools. The age group of 35 years and over has the highest likelihood of being enrolled in private schools, with 3 (37.5% in the age bracket) enrolled. Conversely, the age group of 5 to 9 year old has the lowest likelihood of being enrolled in a private school, with 193 (100.0% in the age bracket) attending a public institution.
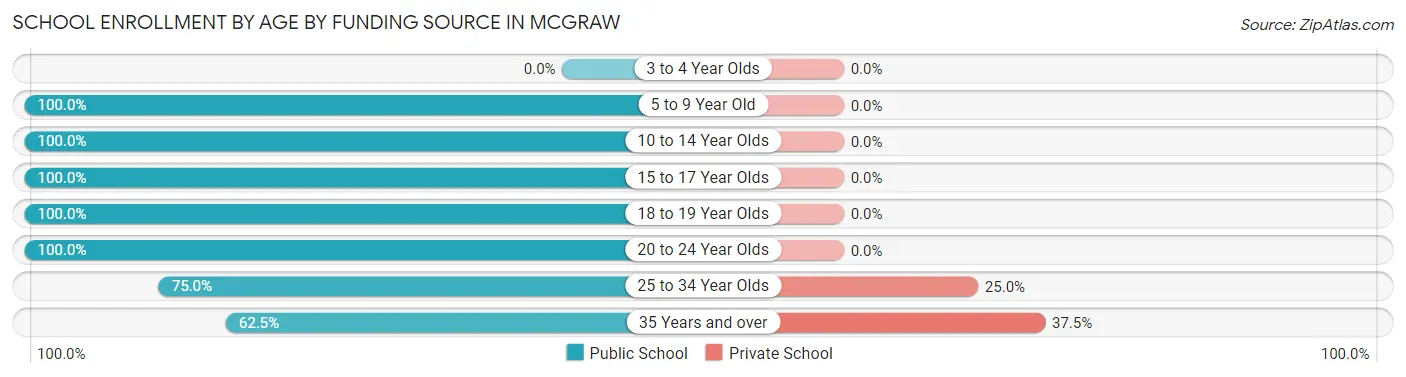
| Age Bracket | Public School | Private School |
| 3 to 4 Year Olds | 0 (0.0%) | 0 (0.0%) |
| 5 to 9 Year Old | 193 (100.0%) | 0 (0.0%) |
| 10 to 14 Year Olds | 159 (100.0%) | 0 (0.0%) |
| 15 to 17 Year Olds | 28 (100.0%) | 0 (0.0%) |
| 18 to 19 Year Olds | 28 (100.0%) | 0 (0.0%) |
| 20 to 24 Year Olds | 8 (100.0%) | 0 (0.0%) |
| 25 to 34 Year Olds | 12 (75.0%) | 4 (25.0%) |
| 35 Years and over | 5 (62.5%) | 3 (37.5%) |
| Total | 433 (98.4%) | 7 (1.6%) |
Educational Attainment by Field of Study in McGraw
Education (23 | 22.8%), visual & performing arts (16 | 15.8%), physical & health sciences (14 | 13.9%), arts & humanities (11 | 10.9%), and science & technology (6 | 5.9%) are the most common fields of study among 101 individuals in McGraw who have obtained a bachelor's degree or higher.
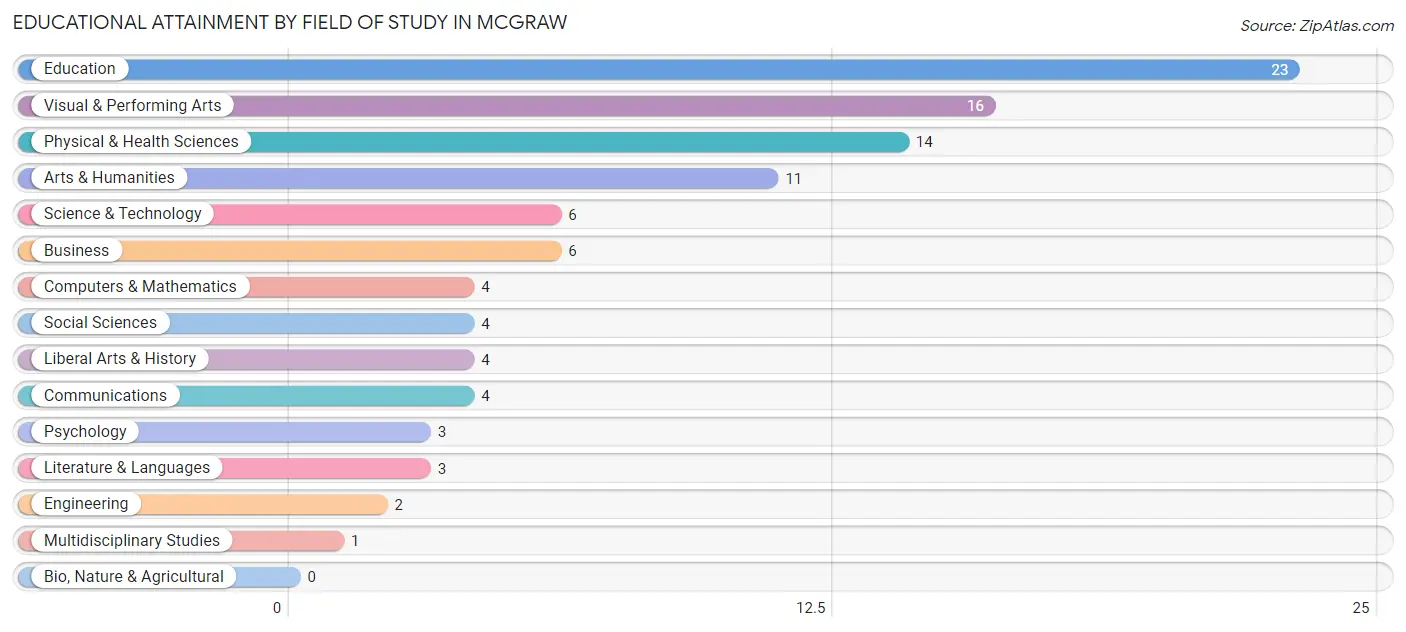
| Field of Study | # Graduates | % Graduates |
| Computers & Mathematics | 4 | 4.0% |
| Bio, Nature & Agricultural | 0 | 0.0% |
| Physical & Health Sciences | 14 | 13.9% |
| Psychology | 3 | 3.0% |
| Social Sciences | 4 | 4.0% |
| Engineering | 2 | 2.0% |
| Multidisciplinary Studies | 1 | 1.0% |
| Science & Technology | 6 | 5.9% |
| Business | 6 | 5.9% |
| Education | 23 | 22.8% |
| Literature & Languages | 3 | 3.0% |
| Liberal Arts & History | 4 | 4.0% |
| Visual & Performing Arts | 16 | 15.8% |
| Communications | 4 | 4.0% |
| Arts & Humanities | 11 | 10.9% |
| Total | 101 | 100.0% |
Transportation & Commute in McGraw
Vehicle Availability by Sex in McGraw
The most prevalent vehicle ownership categories in McGraw are males with 2 vehicles (117, accounting for 51.5%) and females with 2 vehicles (134, making up 45.0%).
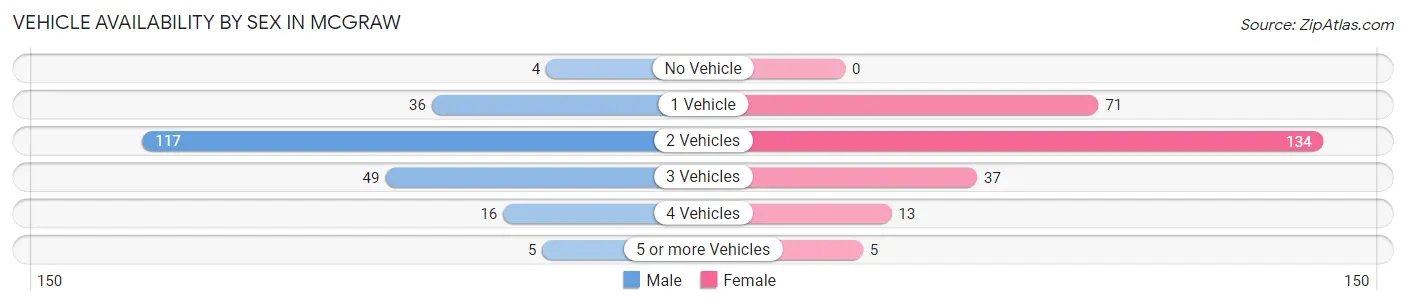
| Vehicles Available | Male | Female |
| No Vehicle | 4 (1.8%) | 0 (0.0%) |
| 1 Vehicle | 36 (15.9%) | 71 (27.3%) |
| 2 Vehicles | 117 (51.5%) | 134 (51.5%) |
| 3 Vehicles | 49 (21.6%) | 37 (14.2%) |
| 4 Vehicles | 16 (7.0%) | 13 (5.0%) |
| 5 or more Vehicles | 5 (2.2%) | 5 (1.9%) |
| Total | 227 (100.0%) | 260 (100.0%) |
Commute Time in McGraw
The most frequently occuring commute durations in McGraw are 15 to 19 minutes (140 commuters, 29.8%), 10 to 14 minutes (77 commuters, 16.4%), and 5 to 9 minutes (73 commuters, 15.5%).
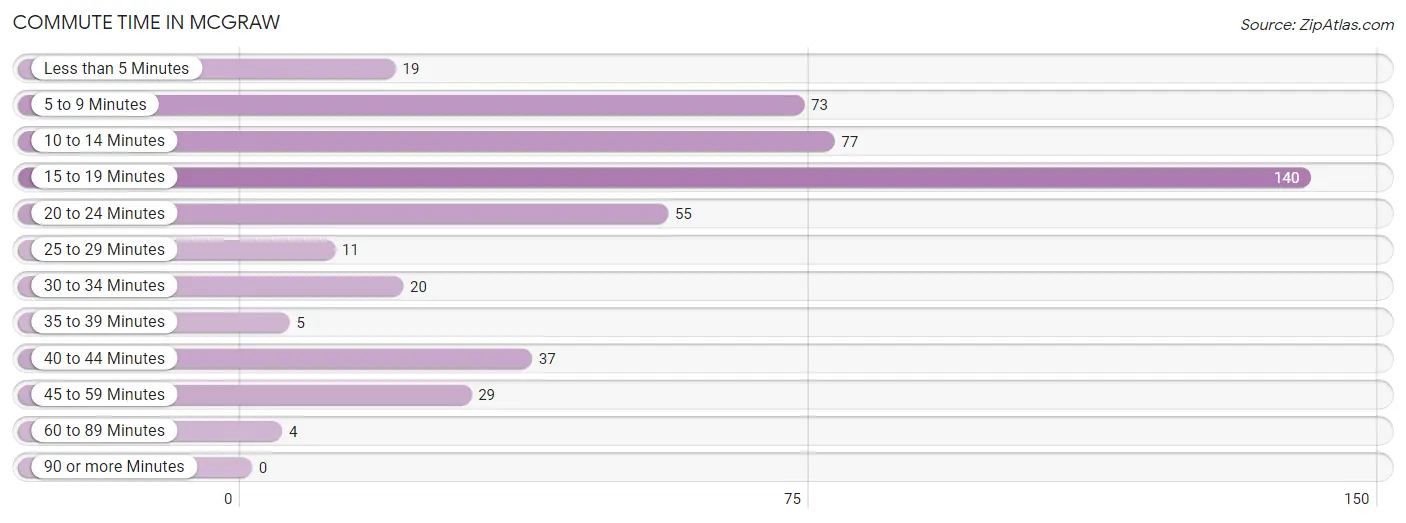
| Commute Time | # Commuters | % Commuters |
| Less than 5 Minutes | 19 | 4.0% |
| 5 to 9 Minutes | 73 | 15.5% |
| 10 to 14 Minutes | 77 | 16.4% |
| 15 to 19 Minutes | 140 | 29.8% |
| 20 to 24 Minutes | 55 | 11.7% |
| 25 to 29 Minutes | 11 | 2.3% |
| 30 to 34 Minutes | 20 | 4.3% |
| 35 to 39 Minutes | 5 | 1.1% |
| 40 to 44 Minutes | 37 | 7.9% |
| 45 to 59 Minutes | 29 | 6.2% |
| 60 to 89 Minutes | 4 | 0.9% |
| 90 or more Minutes | 0 | 0.0% |
Commute Time by Sex in McGraw
The most common commute times in McGraw are 15 to 19 minutes (68 commuters, 30.4%) for males and 15 to 19 minutes (72 commuters, 29.3%) for females.
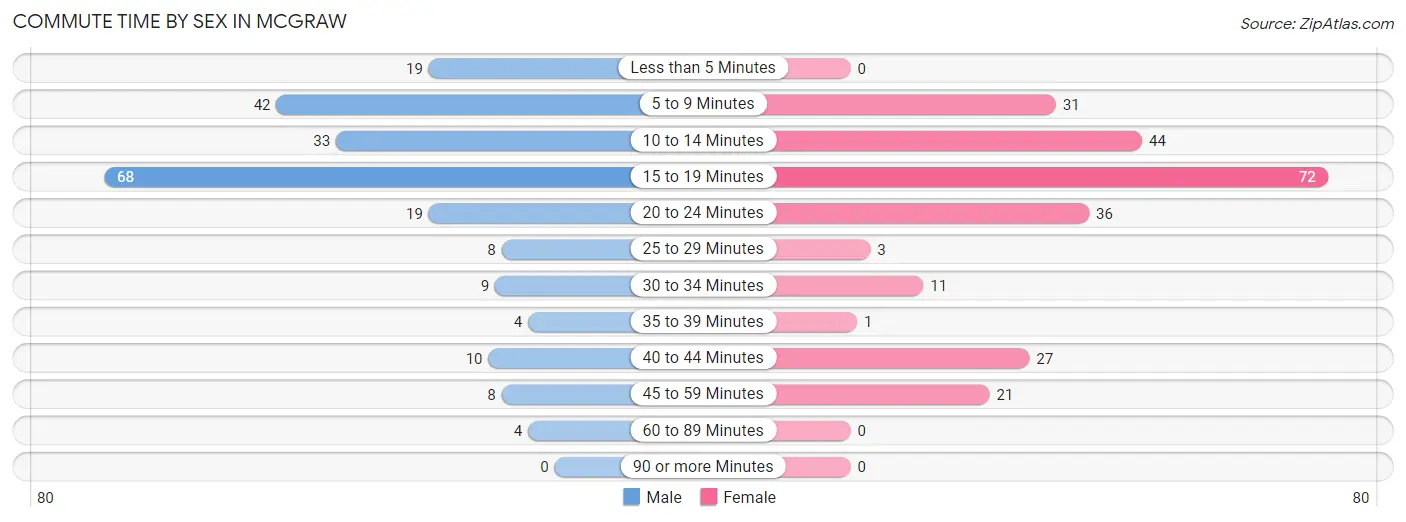
| Commute Time | Male | Female |
| Less than 5 Minutes | 19 (8.5%) | 0 (0.0%) |
| 5 to 9 Minutes | 42 (18.8%) | 31 (12.6%) |
| 10 to 14 Minutes | 33 (14.7%) | 44 (17.9%) |
| 15 to 19 Minutes | 68 (30.4%) | 72 (29.3%) |
| 20 to 24 Minutes | 19 (8.5%) | 36 (14.6%) |
| 25 to 29 Minutes | 8 (3.6%) | 3 (1.2%) |
| 30 to 34 Minutes | 9 (4.0%) | 11 (4.5%) |
| 35 to 39 Minutes | 4 (1.8%) | 1 (0.4%) |
| 40 to 44 Minutes | 10 (4.5%) | 27 (11.0%) |
| 45 to 59 Minutes | 8 (3.6%) | 21 (8.5%) |
| 60 to 89 Minutes | 4 (1.8%) | 0 (0.0%) |
| 90 or more Minutes | 0 (0.0%) | 0 (0.0%) |
Time of Departure to Work by Sex in McGraw
The most frequent times of departure to work in McGraw are 7:00 AM to 7:29 AM (56, 25.0%) for males and 7:00 AM to 7:29 AM (62, 25.2%) for females.
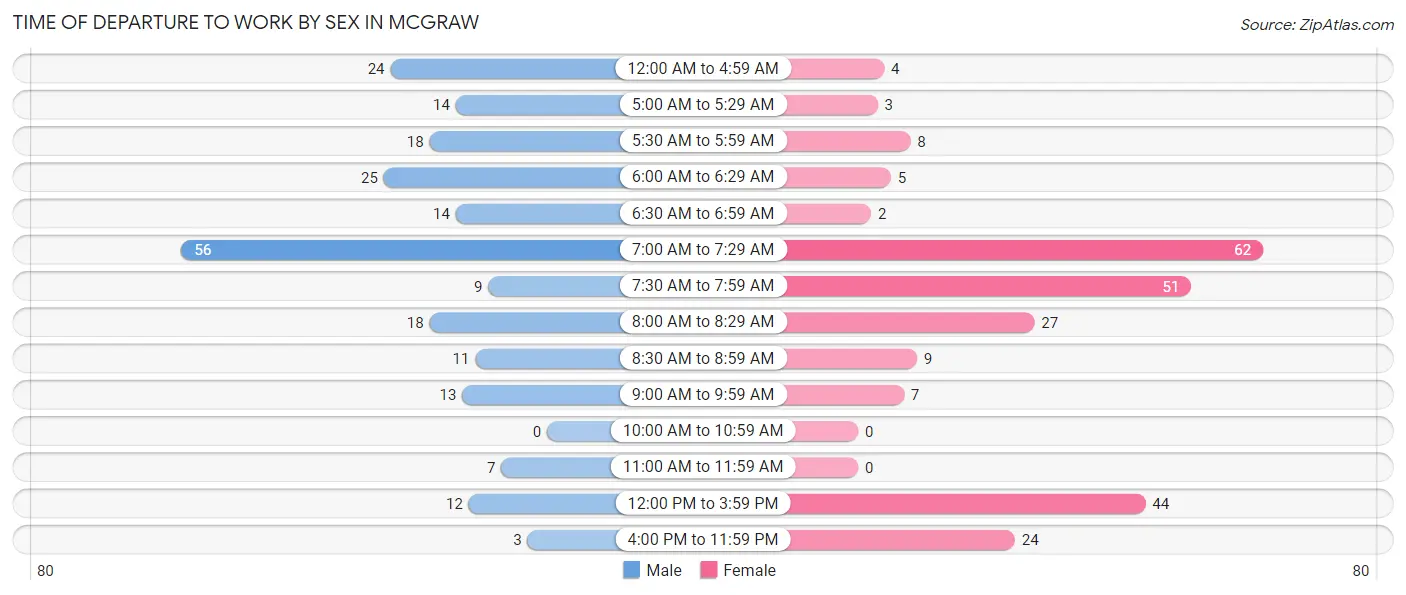
| Time of Departure | Male | Female |
| 12:00 AM to 4:59 AM | 24 (10.7%) | 4 (1.6%) |
| 5:00 AM to 5:29 AM | 14 (6.2%) | 3 (1.2%) |
| 5:30 AM to 5:59 AM | 18 (8.0%) | 8 (3.3%) |
| 6:00 AM to 6:29 AM | 25 (11.2%) | 5 (2.0%) |
| 6:30 AM to 6:59 AM | 14 (6.2%) | 2 (0.8%) |
| 7:00 AM to 7:29 AM | 56 (25.0%) | 62 (25.2%) |
| 7:30 AM to 7:59 AM | 9 (4.0%) | 51 (20.7%) |
| 8:00 AM to 8:29 AM | 18 (8.0%) | 27 (11.0%) |
| 8:30 AM to 8:59 AM | 11 (4.9%) | 9 (3.7%) |
| 9:00 AM to 9:59 AM | 13 (5.8%) | 7 (2.9%) |
| 10:00 AM to 10:59 AM | 0 (0.0%) | 0 (0.0%) |
| 11:00 AM to 11:59 AM | 7 (3.1%) | 0 (0.0%) |
| 12:00 PM to 3:59 PM | 12 (5.4%) | 44 (17.9%) |
| 4:00 PM to 11:59 PM | 3 (1.3%) | 24 (9.8%) |
| Total | 224 (100.0%) | 246 (100.0%) |
Housing Occupancy in McGraw
Occupancy by Ownership in McGraw
Of the total 452 dwellings in McGraw, owner-occupied units account for 250 (55.3%), while renter-occupied units make up 202 (44.7%).
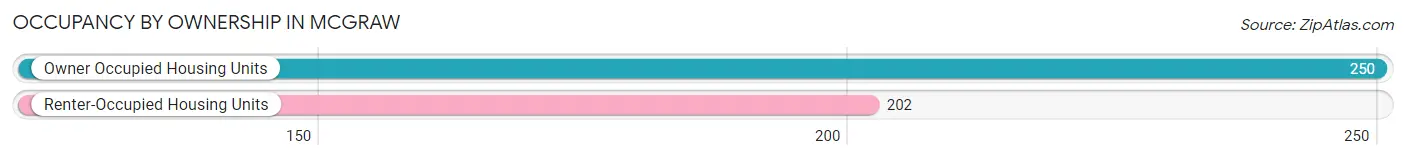
| Occupancy | # Housing Units | % Housing Units |
| Owner Occupied Housing Units | 250 | 55.3% |
| Renter-Occupied Housing Units | 202 | 44.7% |
| Total Occupied Housing Units | 452 | 100.0% |
Occupancy by Household Size in McGraw
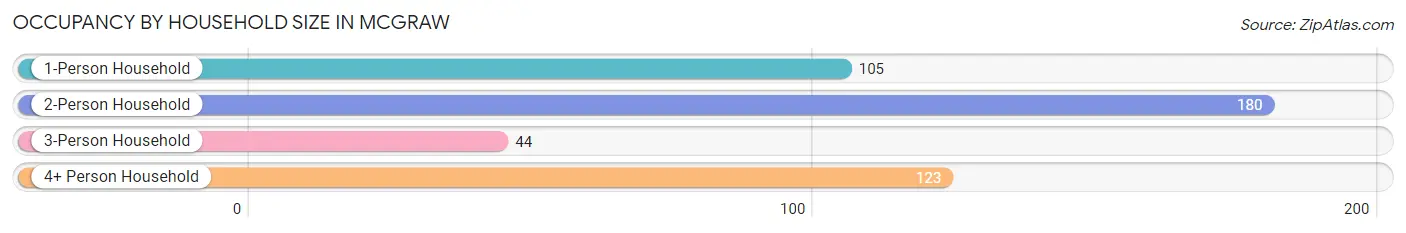
| Household Size | # Housing Units | % Housing Units |
| 1-Person Household | 105 | 23.2% |
| 2-Person Household | 180 | 39.8% |
| 3-Person Household | 44 | 9.7% |
| 4+ Person Household | 123 | 27.2% |
| Total Housing Units | 452 | 100.0% |
Occupancy by Ownership by Household Size in McGraw
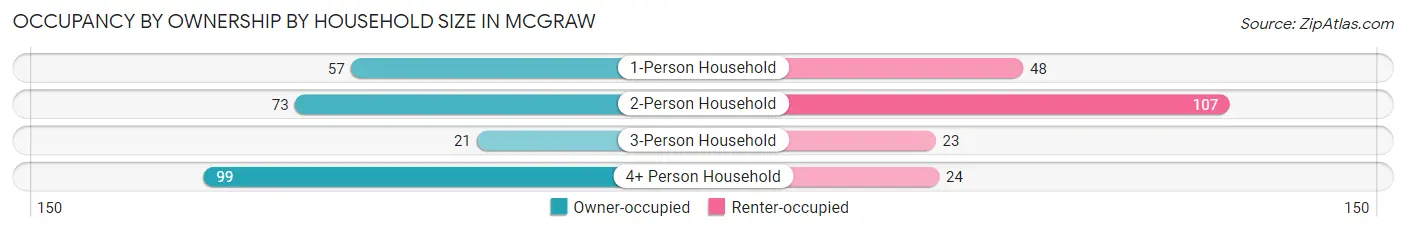
| Household Size | Owner-occupied | Renter-occupied |
| 1-Person Household | 57 (54.3%) | 48 (45.7%) |
| 2-Person Household | 73 (40.6%) | 107 (59.4%) |
| 3-Person Household | 21 (47.7%) | 23 (52.3%) |
| 4+ Person Household | 99 (80.5%) | 24 (19.5%) |
| Total Housing Units | 250 (55.3%) | 202 (44.7%) |
Occupancy by Educational Attainment in McGraw
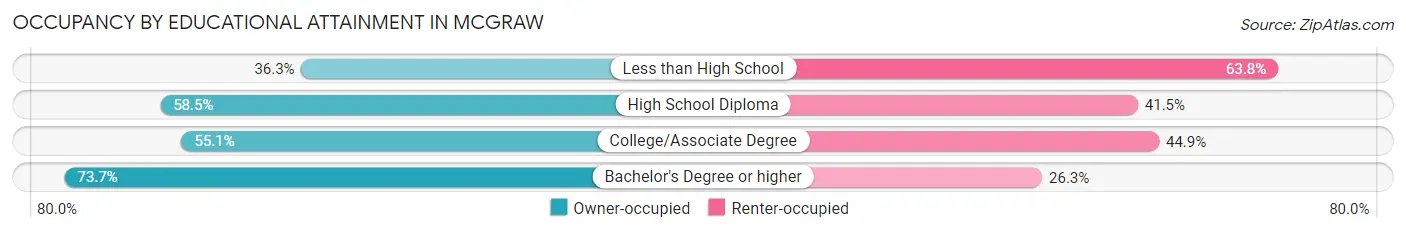
| Household Size | Owner-occupied | Renter-occupied |
| Less than High School | 29 (36.2%) | 51 (63.7%) |
| High School Diploma | 93 (58.5%) | 66 (41.5%) |
| College/Associate Degree | 86 (55.1%) | 70 (44.9%) |
| Bachelor's Degree or higher | 42 (73.7%) | 15 (26.3%) |
Occupancy by Age of Householder in McGraw
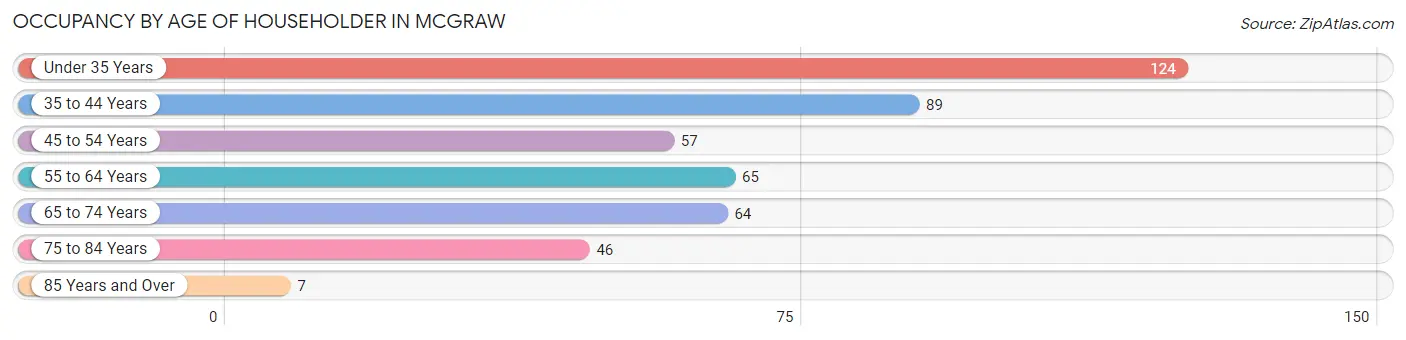
| Age Bracket | # Households | % Households |
| Under 35 Years | 124 | 27.4% |
| 35 to 44 Years | 89 | 19.7% |
| 45 to 54 Years | 57 | 12.6% |
| 55 to 64 Years | 65 | 14.4% |
| 65 to 74 Years | 64 | 14.2% |
| 75 to 84 Years | 46 | 10.2% |
| 85 Years and Over | 7 | 1.5% |
| Total | 452 | 100.0% |
Housing Finances in McGraw
Median Income by Occupancy in McGraw
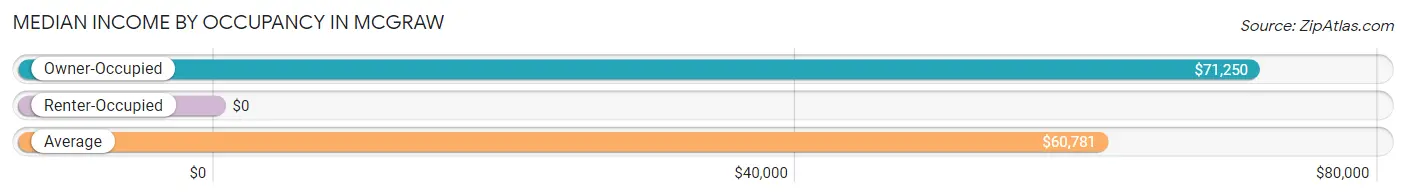
| Occupancy Type | # Households | Median Income |
| Owner-Occupied | 250 (55.3%) | $71,250 |
| Renter-Occupied | 202 (44.7%) | $0 |
| Average | 452 (100.0%) | $60,781 |
Occupancy by Householder Income Bracket in McGraw
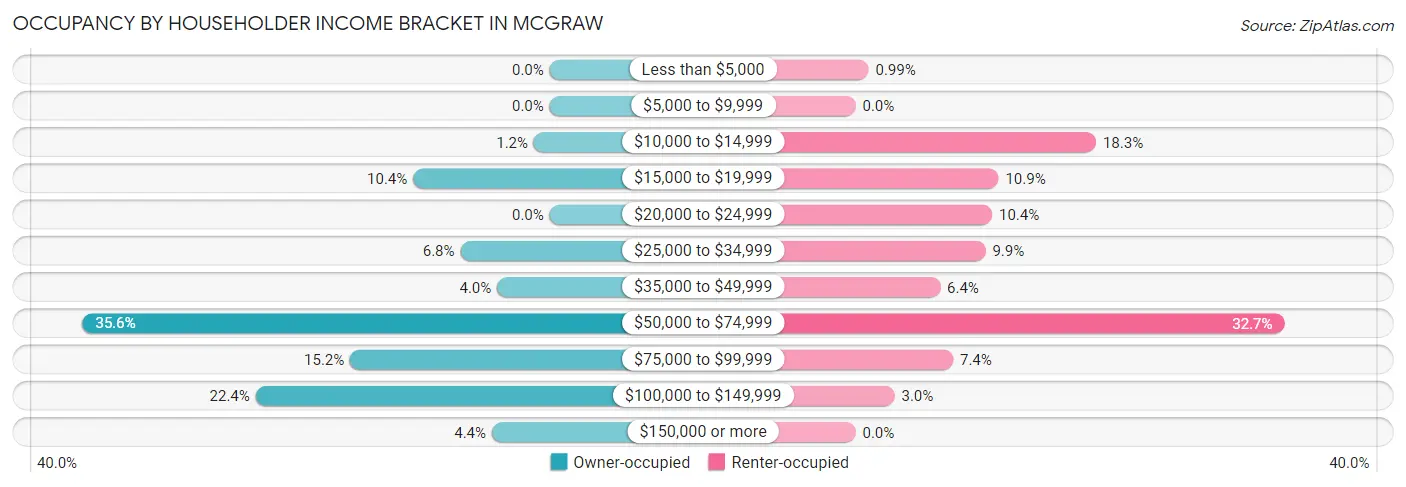
| Income Bracket | Owner-occupied | Renter-occupied |
| Less than $5,000 | 0 (0.0%) | 2 (1.0%) |
| $5,000 to $9,999 | 0 (0.0%) | 0 (0.0%) |
| $10,000 to $14,999 | 3 (1.2%) | 37 (18.3%) |
| $15,000 to $19,999 | 26 (10.4%) | 22 (10.9%) |
| $20,000 to $24,999 | 0 (0.0%) | 21 (10.4%) |
| $25,000 to $34,999 | 17 (6.8%) | 20 (9.9%) |
| $35,000 to $49,999 | 10 (4.0%) | 13 (6.4%) |
| $50,000 to $74,999 | 89 (35.6%) | 66 (32.7%) |
| $75,000 to $99,999 | 38 (15.2%) | 15 (7.4%) |
| $100,000 to $149,999 | 56 (22.4%) | 6 (3.0%) |
| $150,000 or more | 11 (4.4%) | 0 (0.0%) |
| Total | 250 (100.0%) | 202 (100.0%) |
Monthly Housing Cost Tiers in McGraw
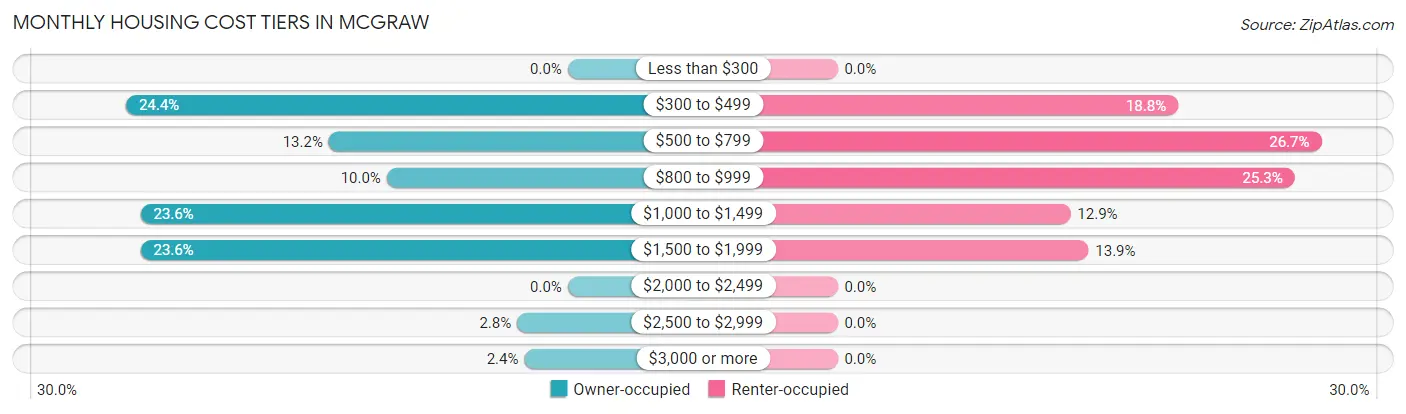
| Monthly Cost | Owner-occupied | Renter-occupied |
| Less than $300 | 0 (0.0%) | 0 (0.0%) |
| $300 to $499 | 61 (24.4%) | 38 (18.8%) |
| $500 to $799 | 33 (13.2%) | 54 (26.7%) |
| $800 to $999 | 25 (10.0%) | 51 (25.3%) |
| $1,000 to $1,499 | 59 (23.6%) | 26 (12.9%) |
| $1,500 to $1,999 | 59 (23.6%) | 28 (13.9%) |
| $2,000 to $2,499 | 0 (0.0%) | 0 (0.0%) |
| $2,500 to $2,999 | 7 (2.8%) | 0 (0.0%) |
| $3,000 or more | 6 (2.4%) | 0 (0.0%) |
| Total | 250 (100.0%) | 202 (100.0%) |
Physical Housing Characteristics in McGraw
Housing Structures in McGraw
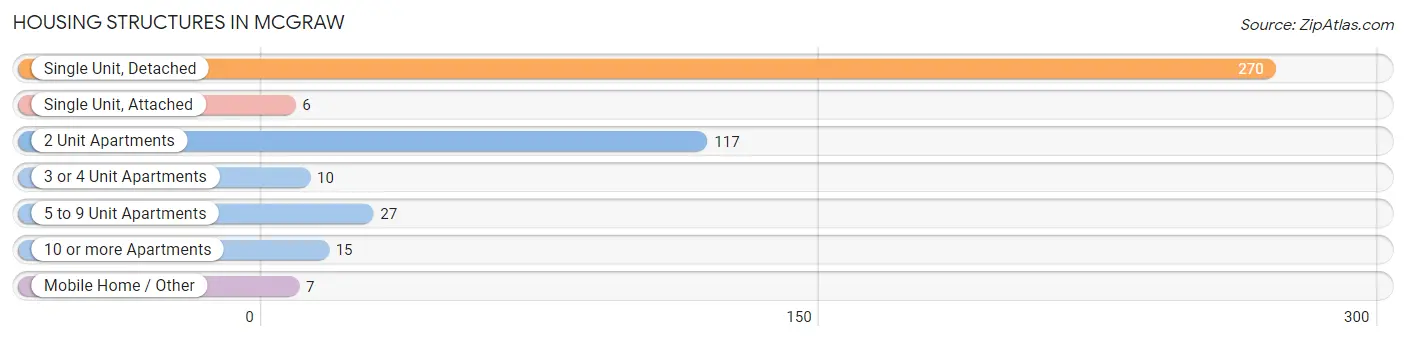
| Structure Type | # Housing Units | % Housing Units |
| Single Unit, Detached | 270 | 59.7% |
| Single Unit, Attached | 6 | 1.3% |
| 2 Unit Apartments | 117 | 25.9% |
| 3 or 4 Unit Apartments | 10 | 2.2% |
| 5 to 9 Unit Apartments | 27 | 6.0% |
| 10 or more Apartments | 15 | 3.3% |
| Mobile Home / Other | 7 | 1.5% |
| Total | 452 | 100.0% |
Housing Structures by Occupancy in McGraw
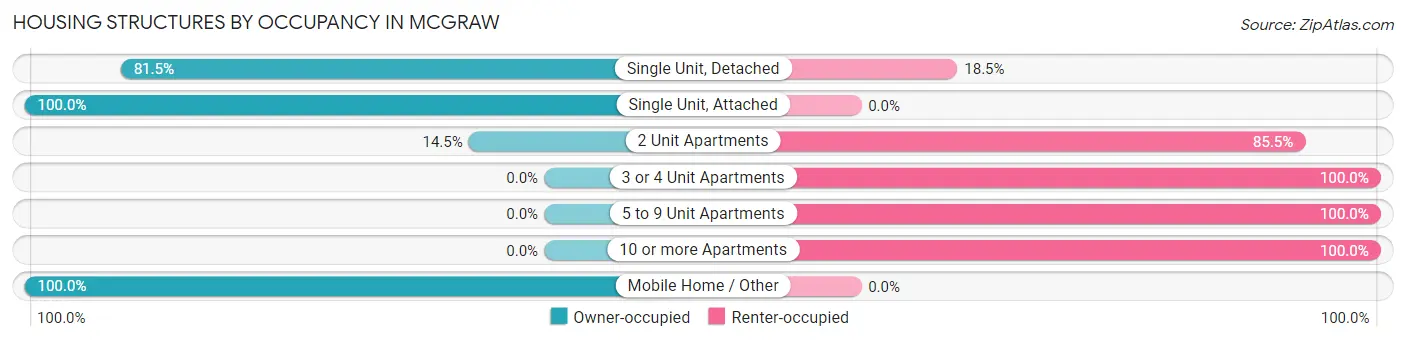
| Structure Type | Owner-occupied | Renter-occupied |
| Single Unit, Detached | 220 (81.5%) | 50 (18.5%) |
| Single Unit, Attached | 6 (100.0%) | 0 (0.0%) |
| 2 Unit Apartments | 17 (14.5%) | 100 (85.5%) |
| 3 or 4 Unit Apartments | 0 (0.0%) | 10 (100.0%) |
| 5 to 9 Unit Apartments | 0 (0.0%) | 27 (100.0%) |
| 10 or more Apartments | 0 (0.0%) | 15 (100.0%) |
| Mobile Home / Other | 7 (100.0%) | 0 (0.0%) |
| Total | 250 (55.3%) | 202 (44.7%) |
Housing Structures by Number of Rooms in McGraw
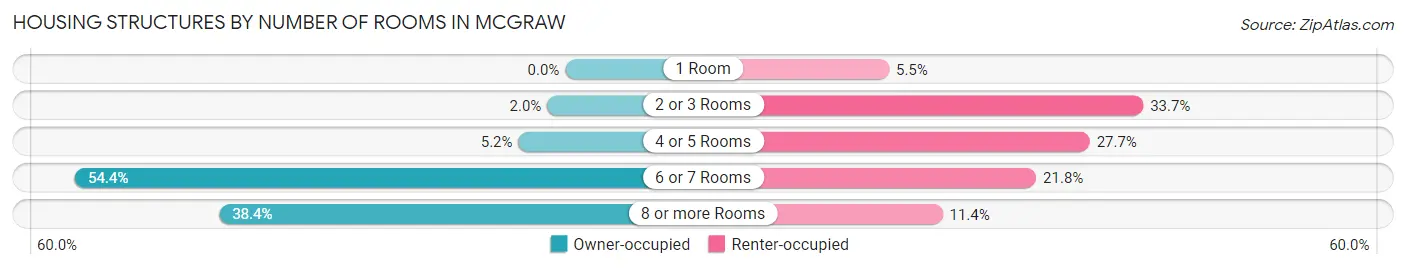
| Number of Rooms | Owner-occupied | Renter-occupied |
| 1 Room | 0 (0.0%) | 11 (5.4%) |
| 2 or 3 Rooms | 5 (2.0%) | 68 (33.7%) |
| 4 or 5 Rooms | 13 (5.2%) | 56 (27.7%) |
| 6 or 7 Rooms | 136 (54.4%) | 44 (21.8%) |
| 8 or more Rooms | 96 (38.4%) | 23 (11.4%) |
| Total | 250 (100.0%) | 202 (100.0%) |
Housing Structure by Heating Type in McGraw
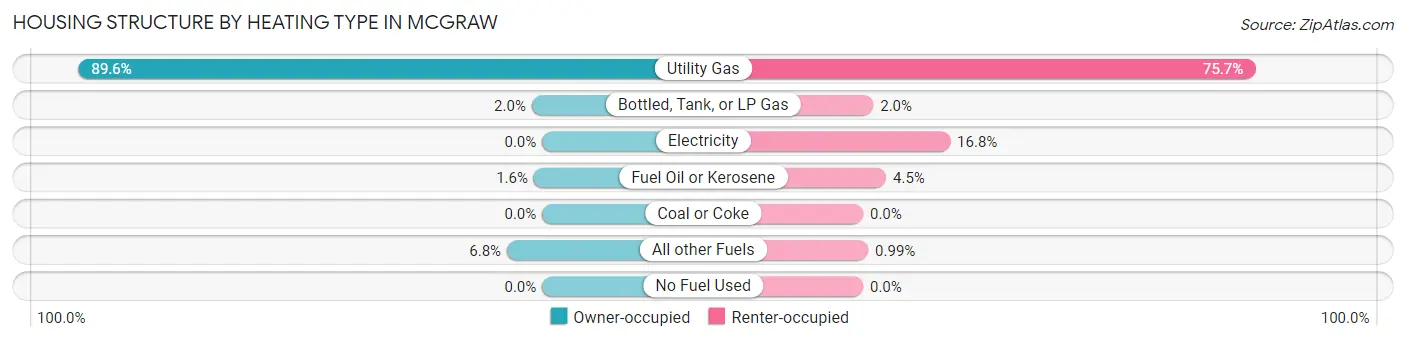
| Heating Type | Owner-occupied | Renter-occupied |
| Utility Gas | 224 (89.6%) | 153 (75.7%) |
| Bottled, Tank, or LP Gas | 5 (2.0%) | 4 (2.0%) |
| Electricity | 0 (0.0%) | 34 (16.8%) |
| Fuel Oil or Kerosene | 4 (1.6%) | 9 (4.5%) |
| Coal or Coke | 0 (0.0%) | 0 (0.0%) |
| All other Fuels | 17 (6.8%) | 2 (1.0%) |
| No Fuel Used | 0 (0.0%) | 0 (0.0%) |
| Total | 250 (100.0%) | 202 (100.0%) |
Household Vehicle Usage in McGraw
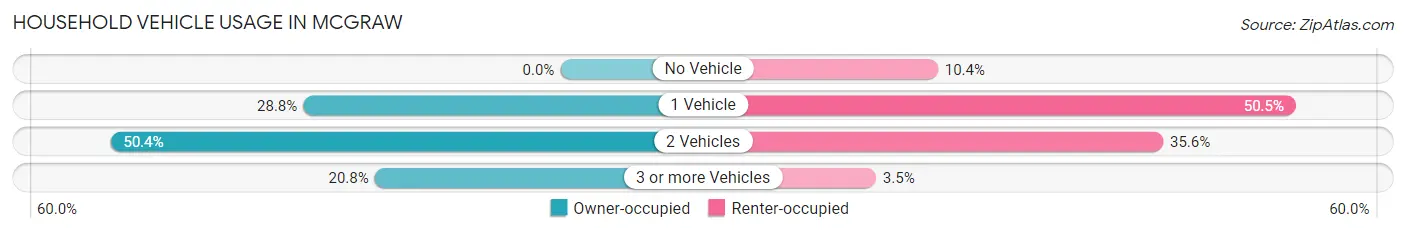
| Vehicles per Household | Owner-occupied | Renter-occupied |
| No Vehicle | 0 (0.0%) | 21 (10.4%) |
| 1 Vehicle | 72 (28.8%) | 102 (50.5%) |
| 2 Vehicles | 126 (50.4%) | 72 (35.6%) |
| 3 or more Vehicles | 52 (20.8%) | 7 (3.5%) |
| Total | 250 (100.0%) | 202 (100.0%) |
Real Estate & Mortgages in McGraw
Real Estate and Mortgage Overview in McGraw
| Characteristic | Without Mortgage | With Mortgage |
| Housing Units | 106 | 144 |
| Median Property Value | $83,300 | $116,100 |
| Median Household Income | $53,333 | $3 |
| Monthly Housing Costs | $482 | $6 |
| Real Estate Taxes | $3,047 | $1 |
Property Value by Mortgage Status in McGraw
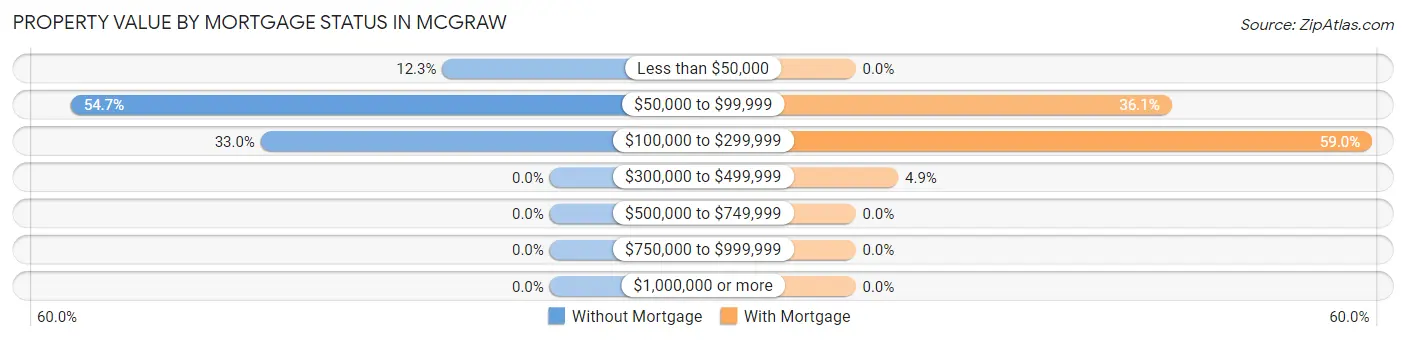
| Property Value | Without Mortgage | With Mortgage |
| Less than $50,000 | 13 (12.3%) | 0 (0.0%) |
| $50,000 to $99,999 | 58 (54.7%) | 52 (36.1%) |
| $100,000 to $299,999 | 35 (33.0%) | 85 (59.0%) |
| $300,000 to $499,999 | 0 (0.0%) | 7 (4.9%) |
| $500,000 to $749,999 | 0 (0.0%) | 0 (0.0%) |
| $750,000 to $999,999 | 0 (0.0%) | 0 (0.0%) |
| $1,000,000 or more | 0 (0.0%) | 0 (0.0%) |
| Total | 106 (100.0%) | 144 (100.0%) |
Household Income by Mortgage Status in McGraw
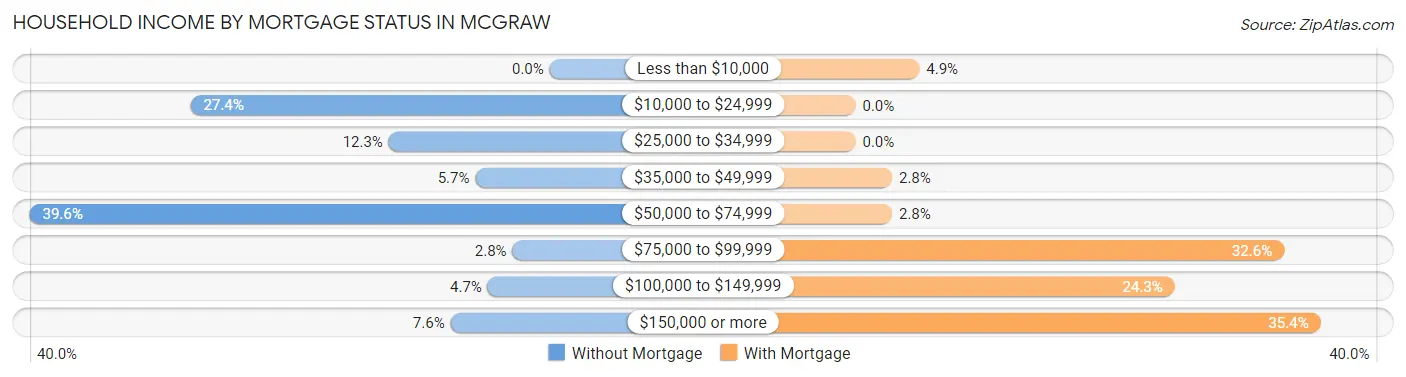
| Household Income | Without Mortgage | With Mortgage |
| Less than $10,000 | 0 (0.0%) | 7 (4.9%) |
| $10,000 to $24,999 | 29 (27.4%) | 0 (0.0%) |
| $25,000 to $34,999 | 13 (12.3%) | 0 (0.0%) |
| $35,000 to $49,999 | 6 (5.7%) | 4 (2.8%) |
| $50,000 to $74,999 | 42 (39.6%) | 4 (2.8%) |
| $75,000 to $99,999 | 3 (2.8%) | 47 (32.6%) |
| $100,000 to $149,999 | 5 (4.7%) | 35 (24.3%) |
| $150,000 or more | 8 (7.5%) | 51 (35.4%) |
| Total | 106 (100.0%) | 144 (100.0%) |
Property Value to Household Income Ratio in McGraw
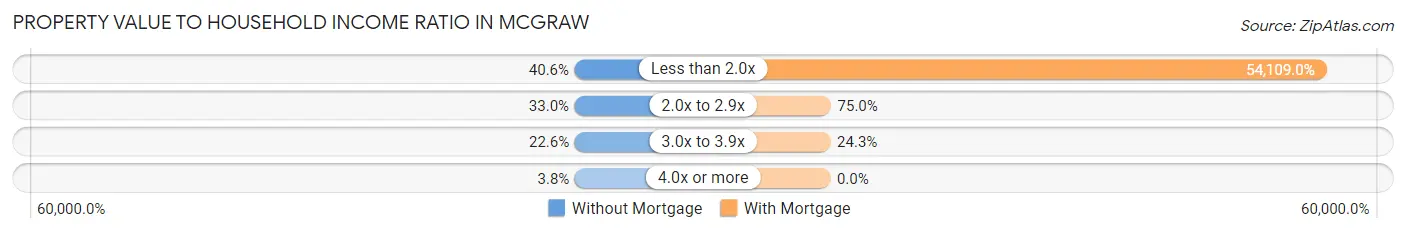
| Value-to-Income Ratio | Without Mortgage | With Mortgage |
| Less than 2.0x | 43 (40.6%) | 77,917 (54,109.0%) |
| 2.0x to 2.9x | 35 (33.0%) | 108 (75.0%) |
| 3.0x to 3.9x | 24 (22.6%) | 35 (24.3%) |
| 4.0x or more | 4 (3.8%) | 0 (0.0%) |
| Total | 106 (100.0%) | 144 (100.0%) |
Real Estate Taxes by Mortgage Status in McGraw
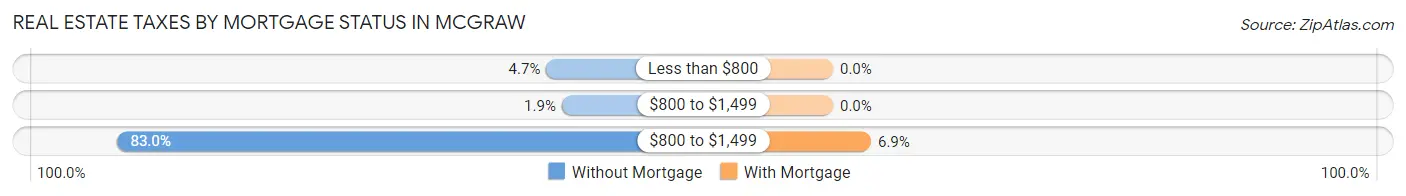
| Property Taxes | Without Mortgage | With Mortgage |
| Less than $800 | 5 (4.7%) | 0 (0.0%) |
| $800 to $1,499 | 2 (1.9%) | 0 (0.0%) |
| $800 to $1,499 | 88 (83.0%) | 10 (6.9%) |
| Total | 106 (100.0%) | 144 (100.0%) |
Health & Disability in McGraw
Health Insurance Coverage by Age in McGraw
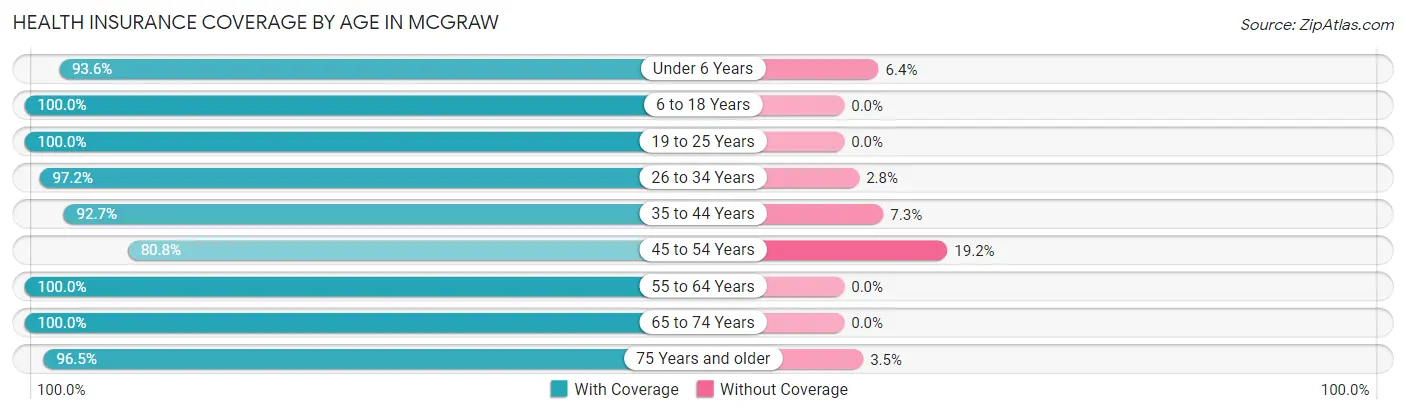
| Age Bracket | With Coverage | Without Coverage |
| Under 6 Years | 73 (93.6%) | 5 (6.4%) |
| 6 to 18 Years | 378 (100.0%) | 0 (0.0%) |
| 19 to 25 Years | 100 (100.0%) | 0 (0.0%) |
| 26 to 34 Years | 105 (97.2%) | 3 (2.8%) |
| 35 to 44 Years | 178 (92.7%) | 14 (7.3%) |
| 45 to 54 Years | 84 (80.8%) | 20 (19.2%) |
| 55 to 64 Years | 121 (100.0%) | 0 (0.0%) |
| 65 to 74 Years | 95 (100.0%) | 0 (0.0%) |
| 75 Years and older | 82 (96.5%) | 3 (3.5%) |
| Total | 1,216 (96.4%) | 45 (3.6%) |
Health Insurance Coverage by Citizenship Status in McGraw
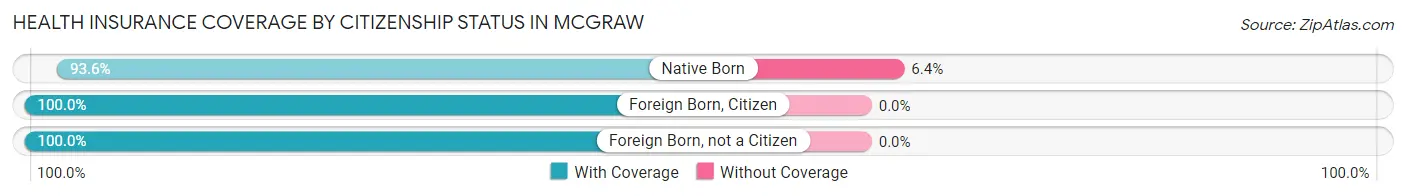
| Citizenship Status | With Coverage | Without Coverage |
| Native Born | 73 (93.6%) | 5 (6.4%) |
| Foreign Born, Citizen | 378 (100.0%) | 0 (0.0%) |
| Foreign Born, not a Citizen | 100 (100.0%) | 0 (0.0%) |
Health Insurance Coverage by Household Income in McGraw
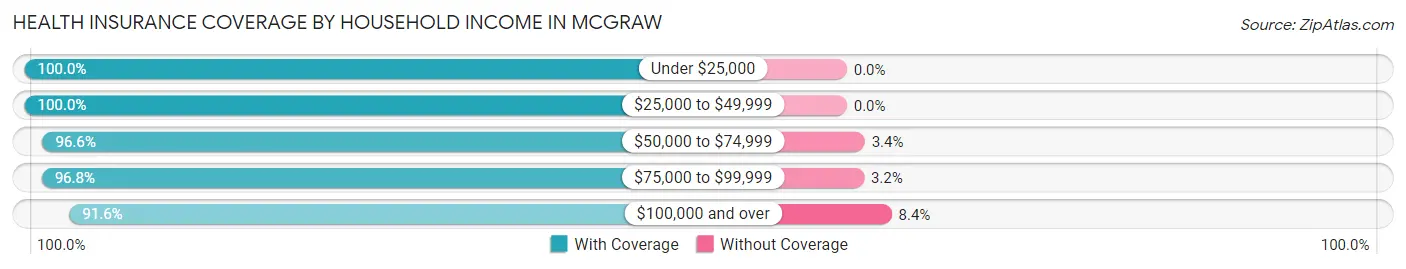
| Household Income | With Coverage | Without Coverage |
| Under $25,000 | 165 (100.0%) | 0 (0.0%) |
| $25,000 to $49,999 | 132 (100.0%) | 0 (0.0%) |
| $50,000 to $74,999 | 517 (96.6%) | 18 (3.4%) |
| $75,000 to $99,999 | 151 (96.8%) | 5 (3.2%) |
| $100,000 and over | 240 (91.6%) | 22 (8.4%) |
Public vs Private Health Insurance Coverage by Age in McGraw
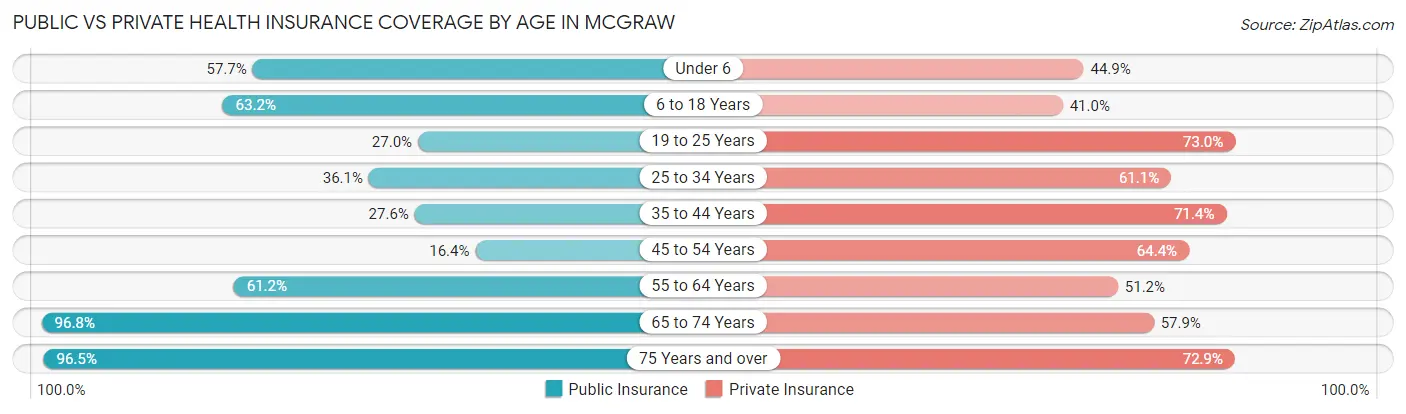
| Age Bracket | Public Insurance | Private Insurance |
| Under 6 | 45 (57.7%) | 35 (44.9%) |
| 6 to 18 Years | 239 (63.2%) | 155 (41.0%) |
| 19 to 25 Years | 27 (27.0%) | 73 (73.0%) |
| 25 to 34 Years | 39 (36.1%) | 66 (61.1%) |
| 35 to 44 Years | 53 (27.6%) | 137 (71.4%) |
| 45 to 54 Years | 17 (16.4%) | 67 (64.4%) |
| 55 to 64 Years | 74 (61.2%) | 62 (51.2%) |
| 65 to 74 Years | 92 (96.8%) | 55 (57.9%) |
| 75 Years and over | 82 (96.5%) | 62 (72.9%) |
| Total | 668 (53.0%) | 712 (56.5%) |
Disability Status by Sex by Age in McGraw
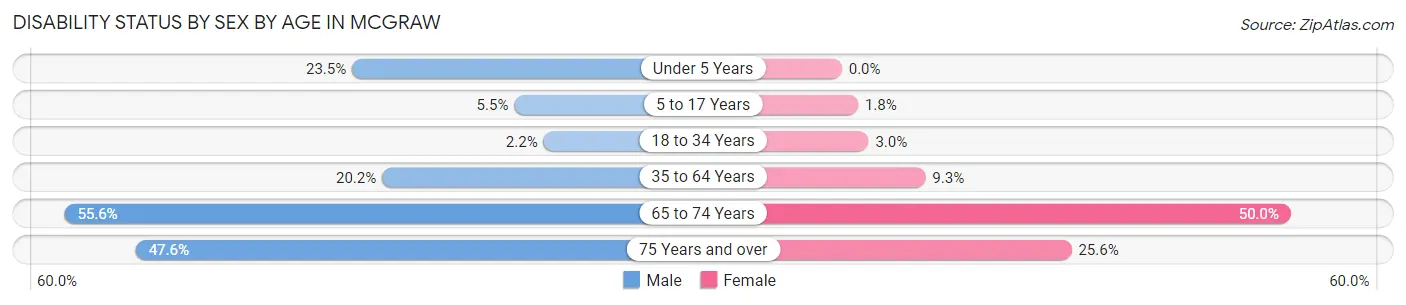
| Age Bracket | Male | Female |
| Under 5 Years | 4 (23.5%) | 0 (0.0%) |
| 5 to 17 Years | 15 (5.5%) | 2 (1.8%) |
| 18 to 34 Years | 3 (2.2%) | 3 (3.0%) |
| 35 to 64 Years | 43 (20.2%) | 19 (9.3%) |
| 65 to 74 Years | 25 (55.6%) | 25 (50.0%) |
| 75 Years and over | 20 (47.6%) | 11 (25.6%) |
Disability Class by Sex by Age in McGraw
Disability Class: Hearing Difficulty
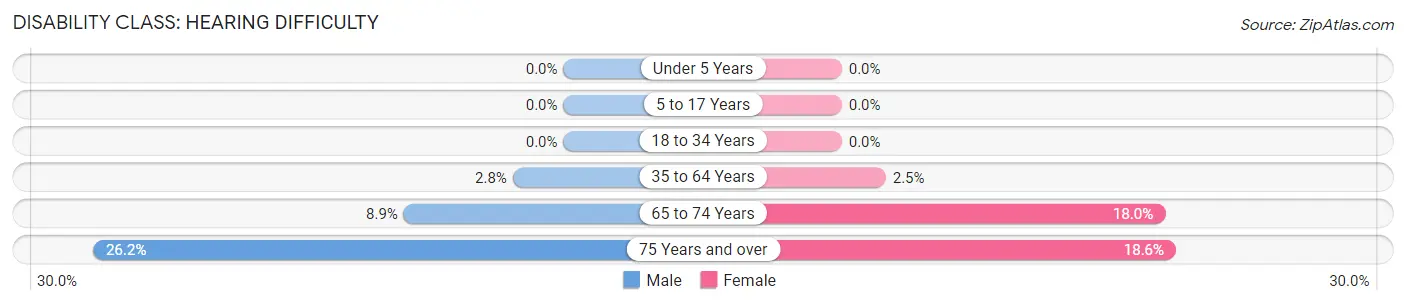
| Age Bracket | Male | Female |
| Under 5 Years | 0 (0.0%) | 0 (0.0%) |
| 5 to 17 Years | 0 (0.0%) | 0 (0.0%) |
| 18 to 34 Years | 0 (0.0%) | 0 (0.0%) |
| 35 to 64 Years | 6 (2.8%) | 5 (2.5%) |
| 65 to 74 Years | 4 (8.9%) | 9 (18.0%) |
| 75 Years and over | 11 (26.2%) | 8 (18.6%) |
Disability Class: Vision Difficulty
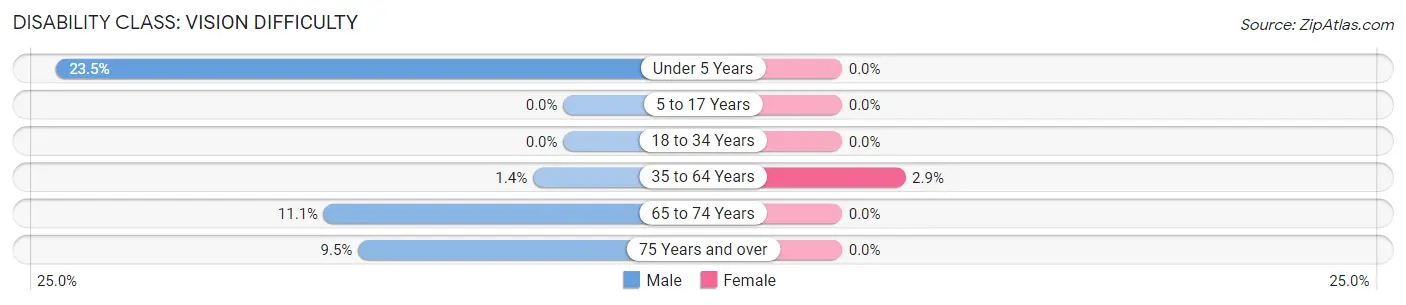
| Age Bracket | Male | Female |
| Under 5 Years | 4 (23.5%) | 0 (0.0%) |
| 5 to 17 Years | 0 (0.0%) | 0 (0.0%) |
| 18 to 34 Years | 0 (0.0%) | 0 (0.0%) |
| 35 to 64 Years | 3 (1.4%) | 6 (2.9%) |
| 65 to 74 Years | 5 (11.1%) | 0 (0.0%) |
| 75 Years and over | 4 (9.5%) | 0 (0.0%) |
Disability Class: Cognitive Difficulty
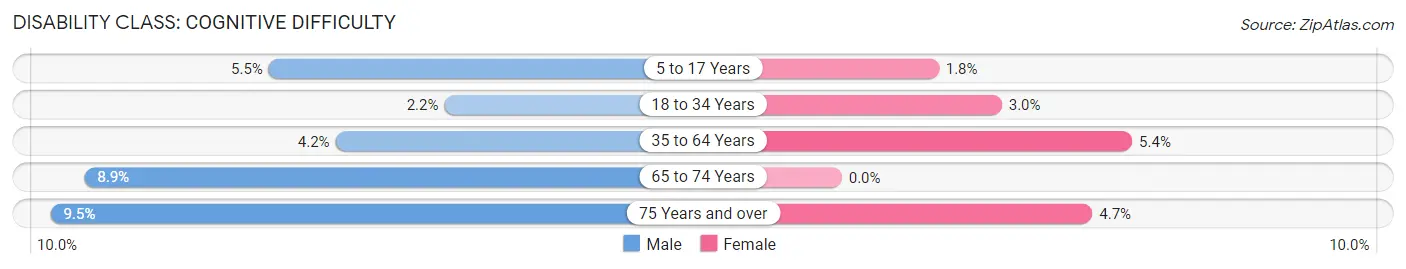
| Age Bracket | Male | Female |
| 5 to 17 Years | 15 (5.5%) | 2 (1.8%) |
| 18 to 34 Years | 3 (2.2%) | 3 (3.0%) |
| 35 to 64 Years | 9 (4.2%) | 11 (5.4%) |
| 65 to 74 Years | 4 (8.9%) | 0 (0.0%) |
| 75 Years and over | 4 (9.5%) | 2 (4.6%) |
Disability Class: Ambulatory Difficulty
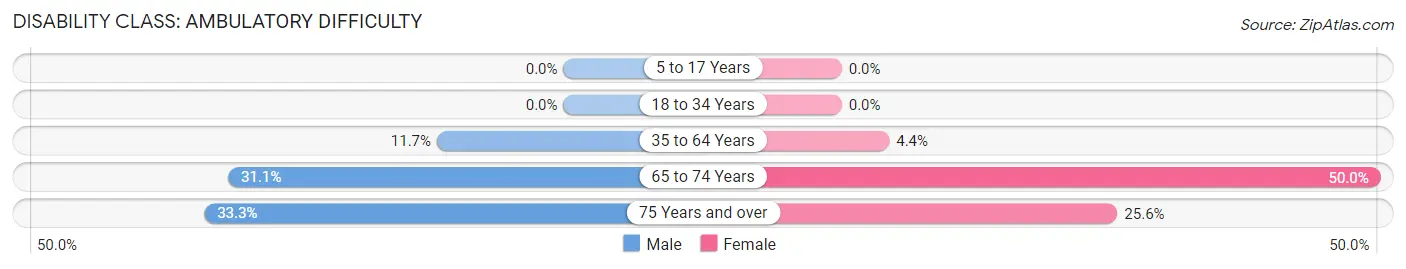
| Age Bracket | Male | Female |
| 5 to 17 Years | 0 (0.0%) | 0 (0.0%) |
| 18 to 34 Years | 0 (0.0%) | 0 (0.0%) |
| 35 to 64 Years | 25 (11.7%) | 9 (4.4%) |
| 65 to 74 Years | 14 (31.1%) | 25 (50.0%) |
| 75 Years and over | 14 (33.3%) | 11 (25.6%) |
Disability Class: Self-Care Difficulty
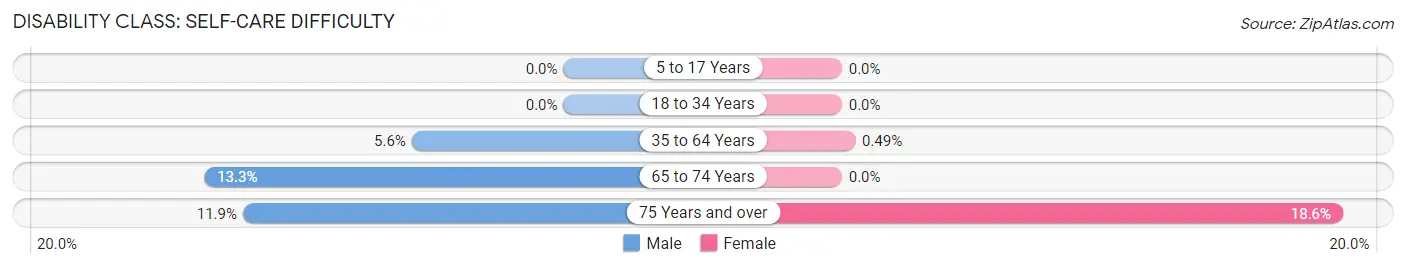
| Age Bracket | Male | Female |
| 5 to 17 Years | 0 (0.0%) | 0 (0.0%) |
| 18 to 34 Years | 0 (0.0%) | 0 (0.0%) |
| 35 to 64 Years | 12 (5.6%) | 1 (0.5%) |
| 65 to 74 Years | 6 (13.3%) | 0 (0.0%) |
| 75 Years and over | 5 (11.9%) | 8 (18.6%) |
Technology Access in McGraw
Computing Device Access in McGraw
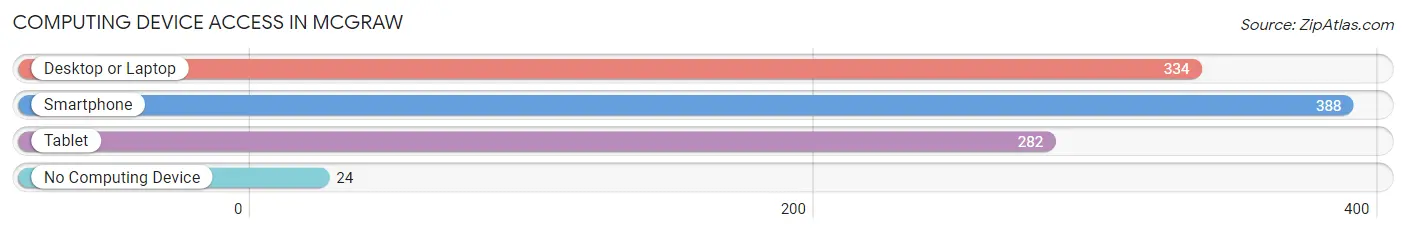
| Device Type | # Households | % Households |
| Desktop or Laptop | 334 | 73.9% |
| Smartphone | 388 | 85.8% |
| Tablet | 282 | 62.4% |
| No Computing Device | 24 | 5.3% |
| Total | 452 | 100.0% |
Internet Access in McGraw
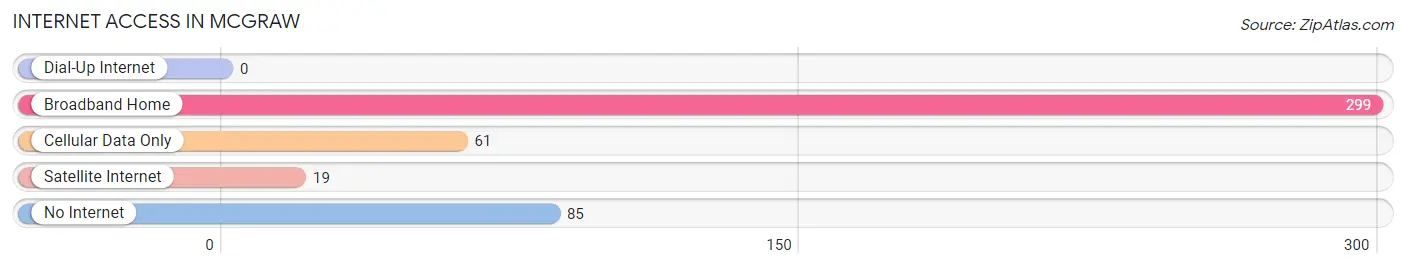
| Internet Type | # Households | % Households |
| Dial-Up Internet | 0 | 0.0% |
| Broadband Home | 299 | 66.1% |
| Cellular Data Only | 61 | 13.5% |
| Satellite Internet | 19 | 4.2% |
| No Internet | 85 | 18.8% |
| Total | 452 | 100.0% |
McGraw Summary
McGraw is a small village located in Cortland County, New York. It is situated in the Finger Lakes region of the state, and is part of the larger city of Cortland. The village has a population of 1,845 people, according to the 2010 census.
History
McGraw was first settled in 1794 by a group of settlers from Connecticut. The village was originally known as “McGrawville”, and was named after the McGraw family, who were among the first settlers. The village was incorporated in 1848, and has remained relatively unchanged since then.
Geography
McGraw is located in the Finger Lakes region of New York, and is situated in the town of Cortland. The village is located on the east side of the Tioughnioga River, and is bordered by the towns of Homer and Marathon. The village is located at an elevation of 1,068 feet above sea level.
Economy
McGraw’s economy is largely based on agriculture and tourism. The village is home to several farms, which produce a variety of crops, including corn, soybeans, and hay. The village also has several small businesses, including a grocery store, a hardware store, and a few restaurants. Tourism is also an important part of the local economy, as the village is located near several popular attractions, including the Finger Lakes National Forest and the Greek Peak Mountain Resort.
Demographics
According to the 2010 census, the population of McGraw was 1,845 people. The racial makeup of the village was 97.3% White, 0.7% African American, 0.2% Native American, 0.3% Asian, and 1.5% from other races. The median household income was $41,250, and the median family income was $50,000. The per capita income was $20,845.
McGraw is a small village with a rich history and a vibrant economy. The village is home to a diverse population, and is a popular destination for tourists. The village is a great place to live, work, and play, and is a great example of the Finger Lakes region of New York.
Common Questions
What is Per Capita Income in McGraw?
Per Capita income in McGraw is $22,736.
What is the Median Family Income in McGraw?
Median Family Income in McGraw is $55,833.
What is the Median Household income in McGraw?
Median Household Income in McGraw is $60,781.
What is Income or Wage Gap in McGraw?
Income or Wage Gap in McGraw is 24.1%.
Women in McGraw earn 75.9 cents for every dollar earned by a man.
What is Inequality or Gini Index in McGraw?
Inequality or Gini Index in McGraw is 0.38.
What is the Total Population of McGraw?
Total Population of McGraw is 1,261.
What is the Total Male Population of McGraw?
Total Male Population of McGraw is 727.
What is the Total Female Population of McGraw?
Total Female Population of McGraw is 534.
What is the Ratio of Males per 100 Females in McGraw?
There are 136.14 Males per 100 Females in McGraw.
What is the Ratio of Females per 100 Males in McGraw?
There are 73.45 Females per 100 Males in McGraw.
What is the Median Population Age in McGraw?
Median Population Age in McGraw is 32.0 Years.
What is the Average Family Size in McGraw
Average Family Size in McGraw is 3.2 People.
What is the Average Household Size in McGraw
Average Household Size in McGraw is 2.8 People.
How Large is the Labor Force in McGraw?
There are 562 People in the Labor Forcein in McGraw.
What is the Percentage of People in the Labor Force in McGraw?
65.2% of People are in the Labor Force in McGraw.
What is the Unemployment Rate in McGraw?
Unemployment Rate in McGraw is 7.7%.