Pistakee Highlands, IL Map & Demographics
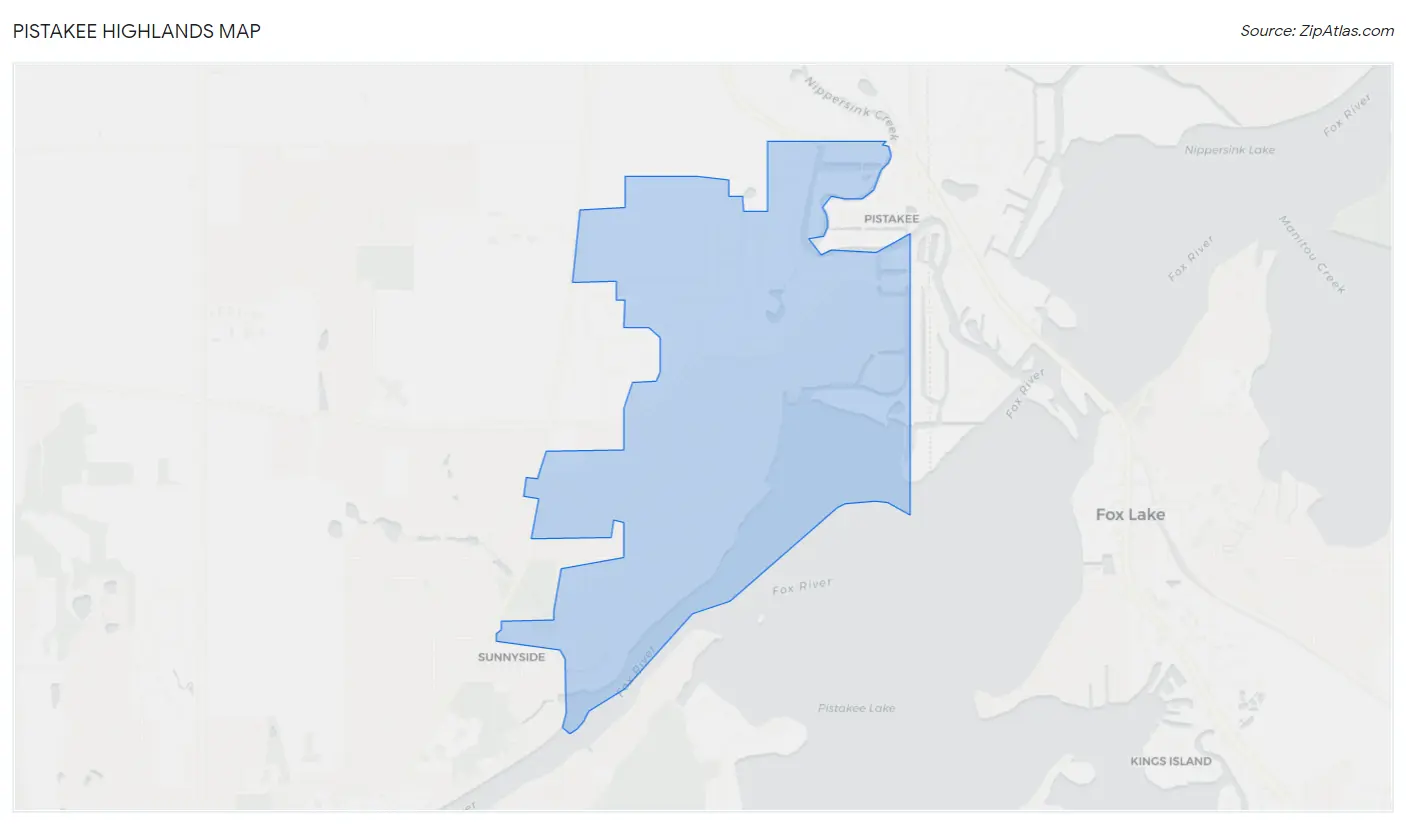
Pistakee Highlands Map
Pistakee Highlands Overview
$46,951
PER CAPITA INCOME
$107,953
AVG FAMILY INCOME
$91,406
AVG HOUSEHOLD INCOME
26.7%
WAGE / INCOME GAP [ % ]
73.3¢/ $1
WAGE / INCOME GAP [ $ ]
0.44
INEQUALITY / GINI INDEX
3,292
TOTAL POPULATION
1,786
MALE POPULATION
1,506
FEMALE POPULATION
118.59
MALES / 100 FEMALES
84.32
FEMALES / 100 MALES
45.6
MEDIAN AGE
2.9
AVG FAMILY SIZE
2.6
AVG HOUSEHOLD SIZE
2,125
LABOR FORCE [ PEOPLE ]
75.4%
PERCENT IN LABOR FORCE
3.6%
UNEMPLOYMENT RATE
Income in Pistakee Highlands
Income Overview in Pistakee Highlands
Per Capita Income in Pistakee Highlands is $46,951, while median incomes of families and households are $107,953 and $91,406 respectively.
| Characteristic | Number | Measure |
| Per Capita Income | 3,292 | $46,951 |
| Median Family Income | 953 | $107,953 |
| Mean Family Income | 953 | $130,725 |
| Median Household Income | 1,270 | $91,406 |
| Mean Household Income | 1,270 | $120,273 |
| Income Deficit | 953 | $0 |
| Wage / Income Gap (%) | 3,292 | 26.67% |
| Wage / Income Gap ($) | 3,292 | 73.33¢ per $1 |
| Gini / Inequality Index | 3,292 | 0.44 |
Earnings by Sex in Pistakee Highlands
Average Earnings in Pistakee Highlands are $42,500, $47,207 for men and $34,617 for women, a difference of 26.7%.
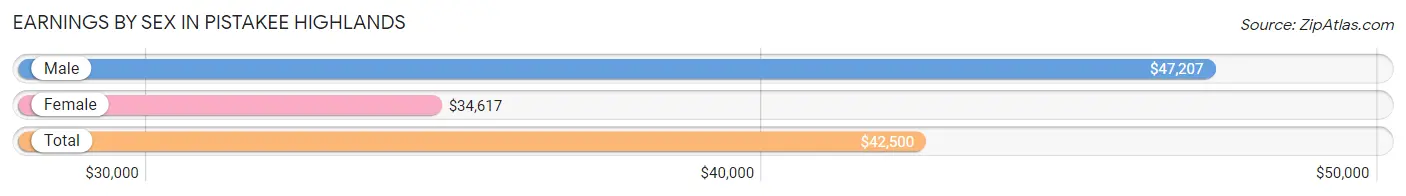
| Sex | Number | Average Earnings |
| Male | 1,269 (59.7%) | $47,207 |
| Female | 857 (40.3%) | $34,617 |
| Total | 2,126 (100.0%) | $42,500 |
Earnings by Sex by Income Bracket in Pistakee Highlands
The most common earnings brackets in Pistakee Highlands are $75,000 to $99,999 for men (221 | 17.4%) and $30,000 to $34,999 for women (107 | 12.5%).
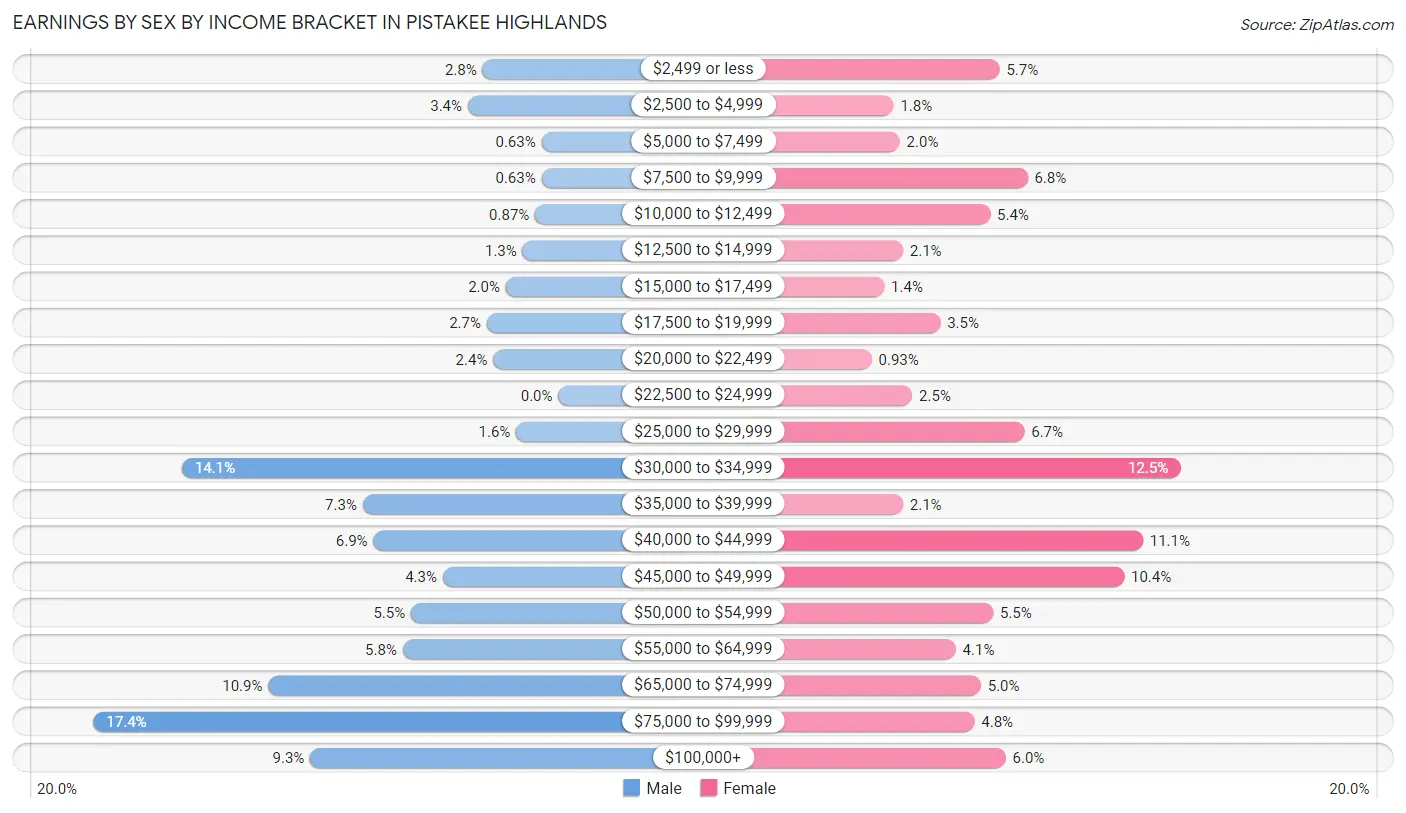
| Income | Male | Female |
| $2,499 or less | 36 (2.8%) | 49 (5.7%) |
| $2,500 to $4,999 | 43 (3.4%) | 15 (1.8%) |
| $5,000 to $7,499 | 8 (0.6%) | 17 (2.0%) |
| $7,500 to $9,999 | 8 (0.6%) | 58 (6.8%) |
| $10,000 to $12,499 | 11 (0.9%) | 46 (5.4%) |
| $12,500 to $14,999 | 17 (1.3%) | 18 (2.1%) |
| $15,000 to $17,499 | 25 (2.0%) | 12 (1.4%) |
| $17,500 to $19,999 | 34 (2.7%) | 30 (3.5%) |
| $20,000 to $22,499 | 31 (2.4%) | 8 (0.9%) |
| $22,500 to $24,999 | 0 (0.0%) | 21 (2.5%) |
| $25,000 to $29,999 | 20 (1.6%) | 57 (6.7%) |
| $30,000 to $34,999 | 179 (14.1%) | 107 (12.5%) |
| $35,000 to $39,999 | 93 (7.3%) | 18 (2.1%) |
| $40,000 to $44,999 | 88 (6.9%) | 95 (11.1%) |
| $45,000 to $49,999 | 55 (4.3%) | 89 (10.4%) |
| $50,000 to $54,999 | 70 (5.5%) | 47 (5.5%) |
| $55,000 to $64,999 | 74 (5.8%) | 35 (4.1%) |
| $65,000 to $74,999 | 138 (10.9%) | 43 (5.0%) |
| $75,000 to $99,999 | 221 (17.4%) | 41 (4.8%) |
| $100,000+ | 118 (9.3%) | 51 (5.9%) |
| Total | 1,269 (100.0%) | 857 (100.0%) |
Earnings by Sex by Educational Attainment in Pistakee Highlands
Average earnings in Pistakee Highlands are $54,797 for men and $40,602 for women, a difference of 25.9%. Men with an educational attainment of bachelor's degree enjoy the highest average annual earnings of $65,781, while those with less than high school education earn the least with $44,837. Women with an educational attainment of graduate degree earn the most with the average annual earnings of $67,935, while those with college or associate's degree education have the smallest earnings of $36,875.
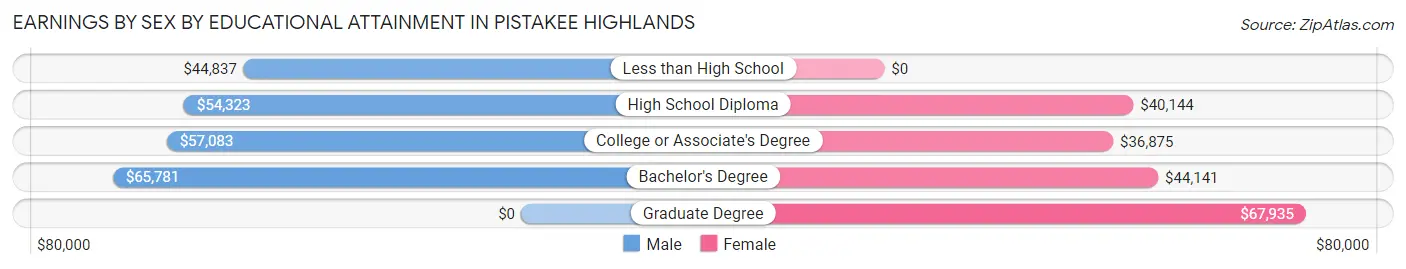
| Educational Attainment | Male Income | Female Income |
| Less than High School | $44,837 | $0 |
| High School Diploma | $54,323 | $40,144 |
| College or Associate's Degree | $57,083 | $36,875 |
| Bachelor's Degree | $65,781 | $44,141 |
| Graduate Degree | - | - |
| Total | $54,797 | $40,602 |
Family Income in Pistakee Highlands
Family Income Brackets in Pistakee Highlands
According to the Pistakee Highlands family income data, there are 379 families falling into the $100,000 to $149,999 income range, which is the most common income bracket and makes up 39.8% of all families.
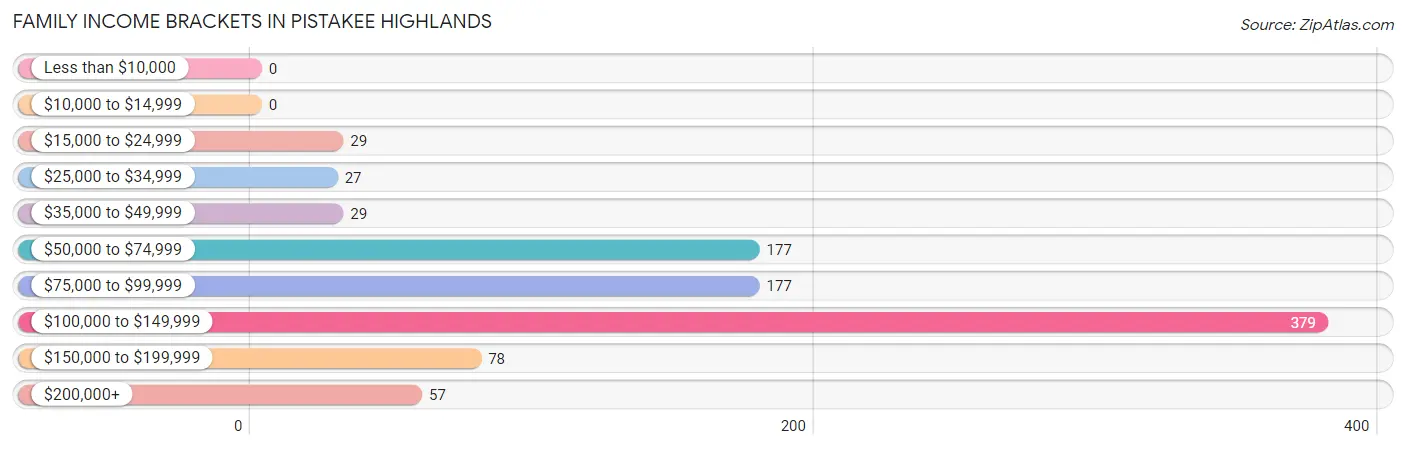
| Income Bracket | # Families | % Families |
| Less than $10,000 | 0 | 0.0% |
| $10,000 to $14,999 | 0 | 0.0% |
| $15,000 to $24,999 | 29 | 3.0% |
| $25,000 to $34,999 | 27 | 2.8% |
| $35,000 to $49,999 | 29 | 3.0% |
| $50,000 to $74,999 | 177 | 18.6% |
| $75,000 to $99,999 | 177 | 18.6% |
| $100,000 to $149,999 | 379 | 39.8% |
| $150,000 to $199,999 | 78 | 8.2% |
| $200,000+ | 57 | 6.0% |
Family Income by Famaliy Size in Pistakee Highlands
4-person families (144 | 15.1%) account for the highest median family income in Pistakee Highlands with $135,375 per family, while 2-person families (475 | 49.8%) have the highest median income of $43,125 per family member.
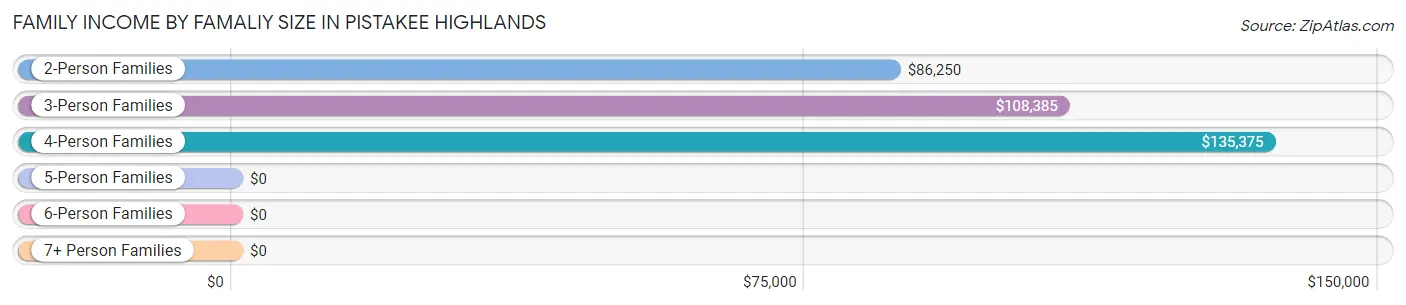
| Income Bracket | # Families | Median Income |
| 2-Person Families | 475 (49.8%) | $86,250 |
| 3-Person Families | 272 (28.5%) | $108,385 |
| 4-Person Families | 144 (15.1%) | $135,375 |
| 5-Person Families | 44 (4.6%) | $0 |
| 6-Person Families | 12 (1.3%) | $0 |
| 7+ Person Families | 6 (0.6%) | $0 |
| Total | 953 (100.0%) | $107,953 |
Family Income by Number of Earners in Pistakee Highlands
The median family income in Pistakee Highlands is $107,953, with families comprising 3+ earners (189) having the highest median family income of $133,875, while families with no earners (104) have the lowest median family income of $69,444, accounting for 19.8% and 10.9% of families, respectively.
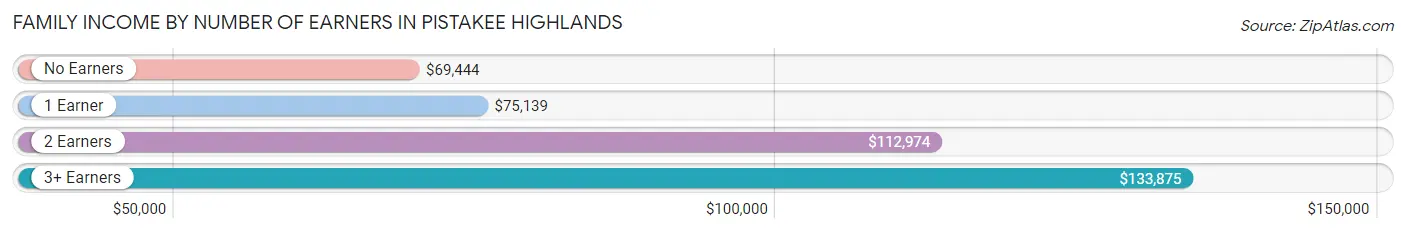
| Number of Earners | # Families | Median Income |
| No Earners | 104 (10.9%) | $69,444 |
| 1 Earner | 233 (24.4%) | $75,139 |
| 2 Earners | 427 (44.8%) | $112,974 |
| 3+ Earners | 189 (19.8%) | $133,875 |
| Total | 953 (100.0%) | $107,953 |
Household Income in Pistakee Highlands
Household Income Brackets in Pistakee Highlands
With 436 households falling in the category, the $100,000 to $149,999 income range is the most frequent in Pistakee Highlands, accounting for 34.3% of all households. In contrast, only 10 households (0.8%) fall into the less than $10,000 income bracket, making it the least populous group.
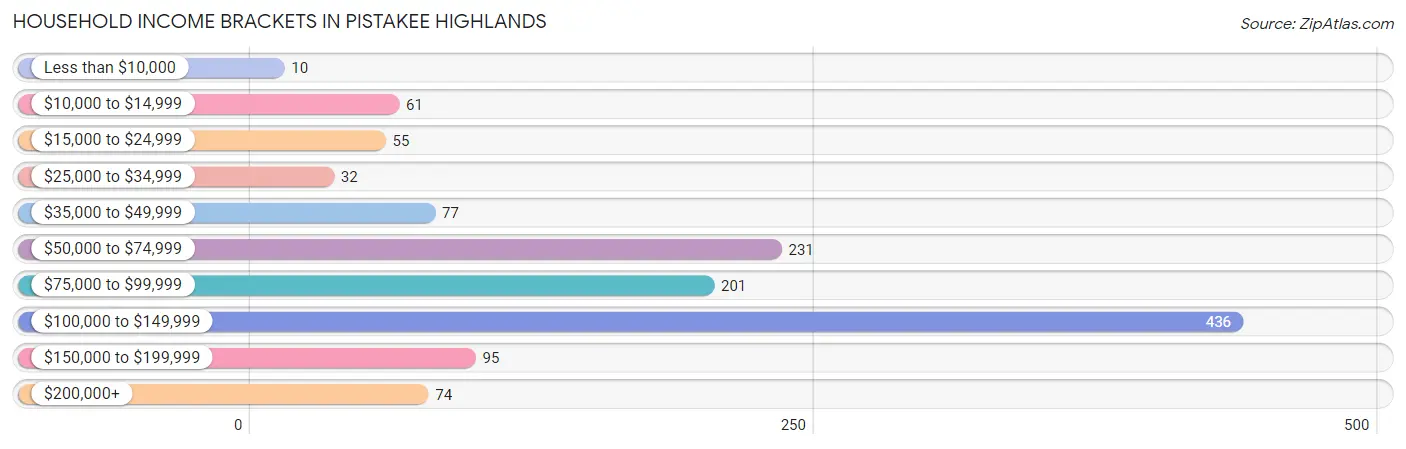
| Income Bracket | # Households | % Households |
| Less than $10,000 | 10 | 0.8% |
| $10,000 to $14,999 | 61 | 4.8% |
| $15,000 to $24,999 | 55 | 4.3% |
| $25,000 to $34,999 | 32 | 2.5% |
| $35,000 to $49,999 | 77 | 6.1% |
| $50,000 to $74,999 | 231 | 18.2% |
| $75,000 to $99,999 | 201 | 15.8% |
| $100,000 to $149,999 | 436 | 34.3% |
| $150,000 to $199,999 | 95 | 7.5% |
| $200,000+ | 74 | 5.8% |
Household Income by Householder Age in Pistakee Highlands
The median household income in Pistakee Highlands is $91,406, with the highest median household income of $112,547 found in the 25 to 44 years age bracket for the primary householder. A total of 380 households (29.9%) fall into this category.
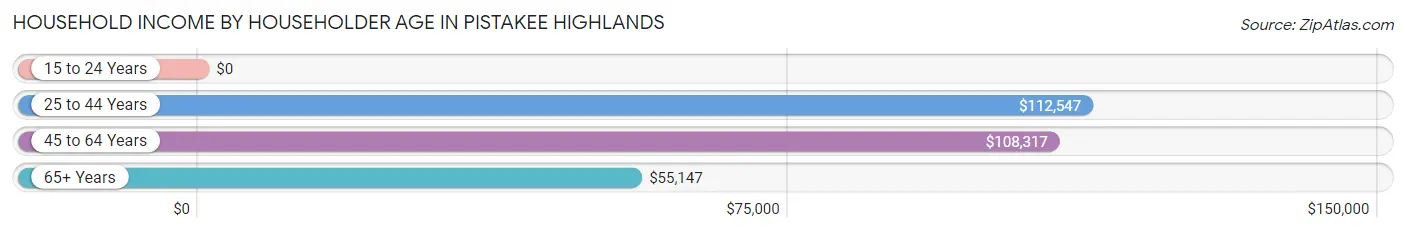
| Income Bracket | # Households | Median Income |
| 15 to 24 Years | 0 (0.0%) | $0 |
| 25 to 44 Years | 380 (29.9%) | $112,547 |
| 45 to 64 Years | 560 (44.1%) | $108,317 |
| 65+ Years | 330 (26.0%) | $55,147 |
| Total | 1,270 (100.0%) | $91,406 |
Poverty in Pistakee Highlands
Income Below Poverty by Sex and Age in Pistakee Highlands
With 7.4% poverty level for males and 4.8% for females among the residents of Pistakee Highlands, under 5 year old males and 65 to 74 year old females are the most vulnerable to poverty, with 11 males (32.4%) and 25 females (14.4%) in their respective age groups living below the poverty level.
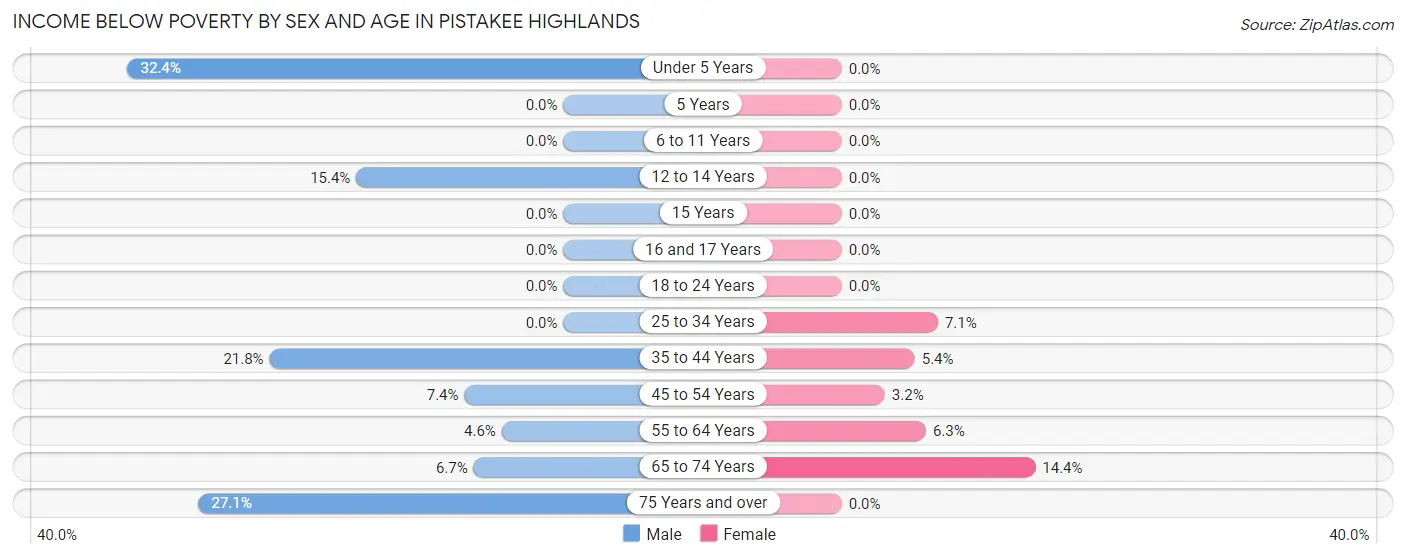
| Age Bracket | Male | Female |
| Under 5 Years | 11 (32.4%) | 0 (0.0%) |
| 5 Years | 0 (0.0%) | 0 (0.0%) |
| 6 to 11 Years | 0 (0.0%) | 0 (0.0%) |
| 12 to 14 Years | 12 (15.4%) | 0 (0.0%) |
| 15 Years | 0 (0.0%) | 0 (0.0%) |
| 16 and 17 Years | 0 (0.0%) | 0 (0.0%) |
| 18 to 24 Years | 0 (0.0%) | 0 (0.0%) |
| 25 to 34 Years | 0 (0.0%) | 12 (7.1%) |
| 35 to 44 Years | 36 (21.8%) | 11 (5.4%) |
| 45 to 54 Years | 20 (7.3%) | 8 (3.2%) |
| 55 to 64 Years | 18 (4.6%) | 16 (6.2%) |
| 65 to 74 Years | 10 (6.7%) | 25 (14.4%) |
| 75 Years and over | 26 (27.1%) | 0 (0.0%) |
| Total | 133 (7.4%) | 72 (4.8%) |
Income Above Poverty by Sex and Age in Pistakee Highlands
According to the poverty statistics in Pistakee Highlands, males aged 6 to 11 years and females aged under 5 years are the age groups that are most secure financially, with 100.0% of males and 100.0% of females in these age groups living above the poverty line.
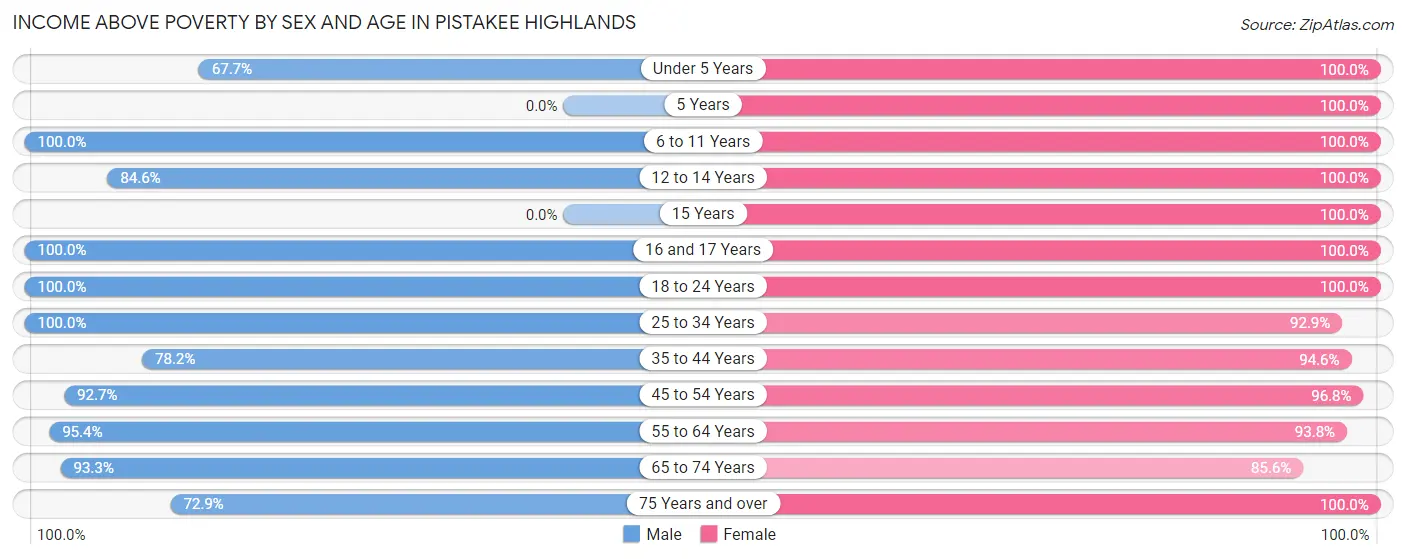
| Age Bracket | Male | Female |
| Under 5 Years | 23 (67.6%) | 72 (100.0%) |
| 5 Years | 0 (0.0%) | 8 (100.0%) |
| 6 to 11 Years | 122 (100.0%) | 65 (100.0%) |
| 12 to 14 Years | 66 (84.6%) | 71 (100.0%) |
| 15 Years | 0 (0.0%) | 24 (100.0%) |
| 16 and 17 Years | 19 (100.0%) | 60 (100.0%) |
| 18 to 24 Years | 141 (100.0%) | 71 (100.0%) |
| 25 to 34 Years | 316 (100.0%) | 156 (92.9%) |
| 35 to 44 Years | 129 (78.2%) | 192 (94.6%) |
| 45 to 54 Years | 252 (92.6%) | 242 (96.8%) |
| 55 to 64 Years | 375 (95.4%) | 240 (93.8%) |
| 65 to 74 Years | 140 (93.3%) | 149 (85.6%) |
| 75 Years and over | 70 (72.9%) | 84 (100.0%) |
| Total | 1,653 (92.5%) | 1,434 (95.2%) |
Income Below Poverty Among Married-Couple Families in Pistakee Highlands
The poverty statistics for married-couple families in Pistakee Highlands show that 1.1% or 8 of the total 704 families live below the poverty line. Families with no children have the highest poverty rate of 1.5%, comprising of 8 families. On the other hand, families with 1 or 2 children have the lowest poverty rate of 0.0%, which includes 0 families.
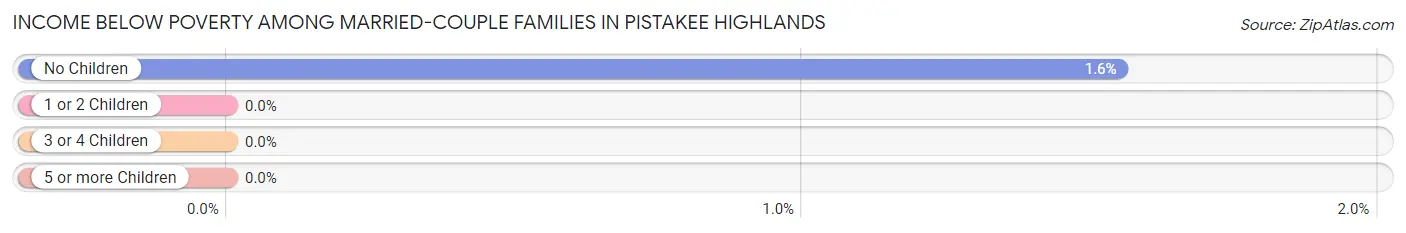
| Children | Above Poverty | Below Poverty |
| No Children | 509 (98.5%) | 8 (1.5%) |
| 1 or 2 Children | 131 (100.0%) | 0 (0.0%) |
| 3 or 4 Children | 56 (100.0%) | 0 (0.0%) |
| 5 or more Children | 0 (0.0%) | 0 (0.0%) |
| Total | 696 (98.9%) | 8 (1.1%) |
Income Below Poverty Among Single-Parent Households in Pistakee Highlands
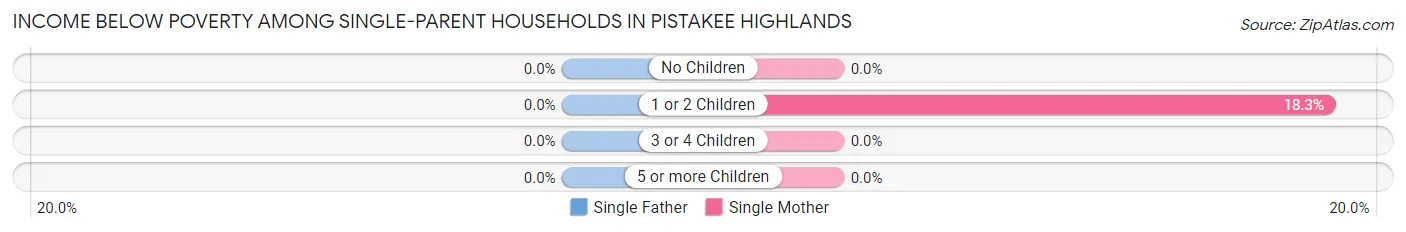
| Children | Single Father | Single Mother |
| No Children | 0 (0.0%) | 0 (0.0%) |
| 1 or 2 Children | 0 (0.0%) | 11 (18.3%) |
| 3 or 4 Children | 0 (0.0%) | 0 (0.0%) |
| 5 or more Children | 0 (0.0%) | 0 (0.0%) |
| Total | 0 (0.0%) | 11 (12.2%) |
Income Below Poverty Among Married-Couple vs Single-Parent Households in Pistakee Highlands
The poverty data for Pistakee Highlands shows that 8 of the married-couple family households (1.1%) and 11 of the single-parent households (4.4%) are living below the poverty level. Within the married-couple family households, those with no children have the highest poverty rate, with 8 households (1.5%) falling below the poverty line. Among the single-parent households, those with 1 or 2 children have the highest poverty rate, with 11 household (8.0%) living below poverty.
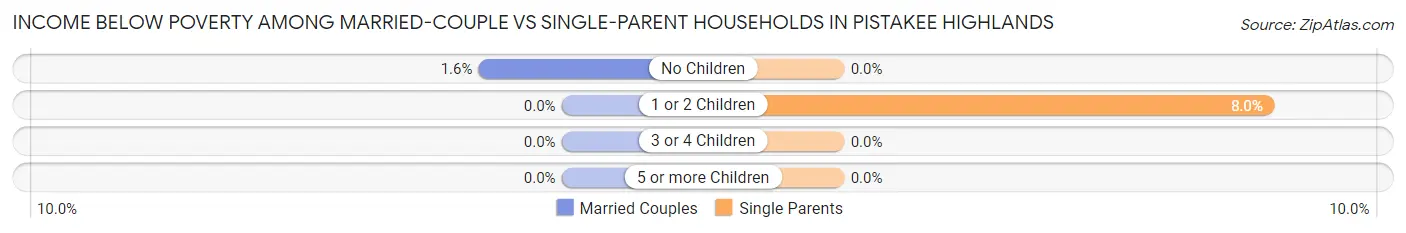
| Children | Married-Couple Families | Single-Parent Households |
| No Children | 8 (1.5%) | 0 (0.0%) |
| 1 or 2 Children | 0 (0.0%) | 11 (8.0%) |
| 3 or 4 Children | 0 (0.0%) | 0 (0.0%) |
| 5 or more Children | 0 (0.0%) | 0 (0.0%) |
| Total | 8 (1.1%) | 11 (4.4%) |
Race in Pistakee Highlands
The most populous races in Pistakee Highlands are White / Caucasian (3,123 | 94.9%), Hispanic or Latino (210 | 6.4%), and Two or more Races (161 | 4.9%).
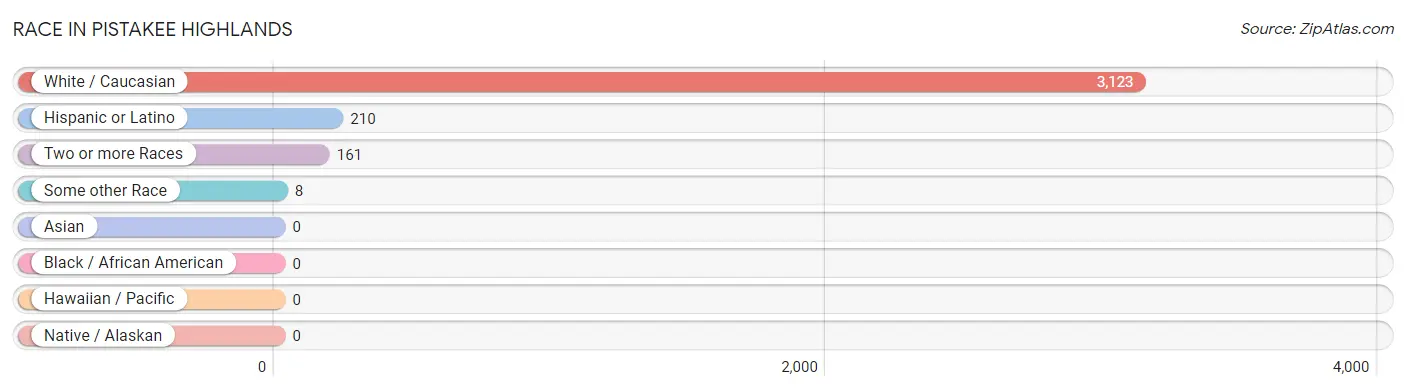
| Race | # Population | % Population |
| Asian | 0 | 0.0% |
| Black / African American | 0 | 0.0% |
| Hawaiian / Pacific | 0 | 0.0% |
| Hispanic or Latino | 210 | 6.4% |
| Native / Alaskan | 0 | 0.0% |
| White / Caucasian | 3,123 | 94.9% |
| Two or more Races | 161 | 4.9% |
| Some other Race | 8 | 0.2% |
| Total | 3,292 | 100.0% |
Ancestry in Pistakee Highlands
The most populous ancestries reported in Pistakee Highlands are German (970 | 29.5%), Irish (719 | 21.8%), Polish (586 | 17.8%), English (228 | 6.9%), and Italian (196 | 5.9%), together accounting for 82.0% of all Pistakee Highlands residents.
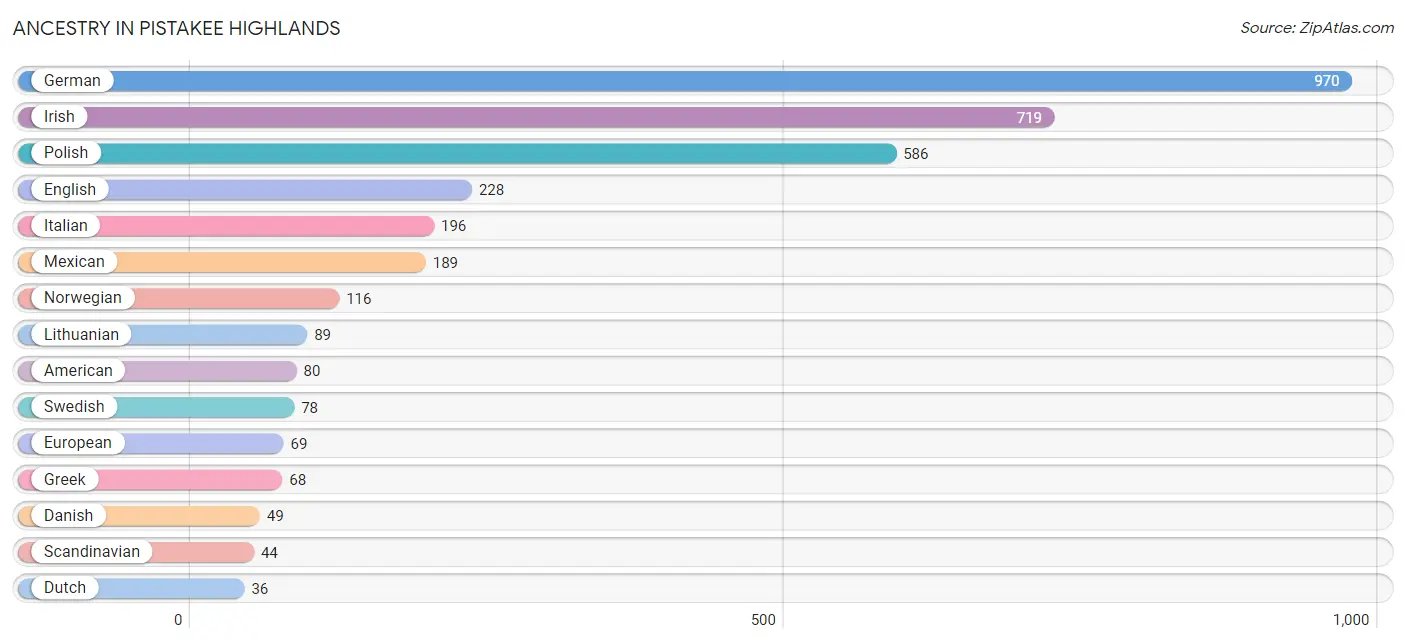
| Ancestry | # Population | % Population |
| American | 80 | 2.4% |
| Austrian | 9 | 0.3% |
| Belgian | 17 | 0.5% |
| British | 8 | 0.2% |
| Czech | 8 | 0.2% |
| Czechoslovakian | 23 | 0.7% |
| Danish | 49 | 1.5% |
| Dutch | 36 | 1.1% |
| Eastern European | 6 | 0.2% |
| English | 228 | 6.9% |
| European | 69 | 2.1% |
| Finnish | 15 | 0.5% |
| French | 16 | 0.5% |
| French Canadian | 21 | 0.6% |
| German | 970 | 29.5% |
| Greek | 68 | 2.1% |
| Hungarian | 22 | 0.7% |
| Indian (Asian) | 14 | 0.4% |
| Irish | 719 | 21.8% |
| Italian | 196 | 5.9% |
| Lithuanian | 89 | 2.7% |
| Mexican | 189 | 5.7% |
| Norwegian | 116 | 3.5% |
| Peruvian | 8 | 0.2% |
| Polish | 586 | 17.8% |
| Puerto Rican | 13 | 0.4% |
| Romanian | 7 | 0.2% |
| Scandinavian | 44 | 1.3% |
| Scotch-Irish | 7 | 0.2% |
| Scottish | 13 | 0.4% |
| South American | 8 | 0.2% |
| Swedish | 78 | 2.4% | View All 32 Rows |
Immigrants in Pistakee Highlands
The most numerous immigrant groups reported in Pistakee Highlands came from Latin America (58 | 1.8%), Central America (50 | 1.5%), Europe (50 | 1.5%), Mexico (50 | 1.5%), and England (27 | 0.8%), together accounting for 7.1% of all Pistakee Highlands residents.
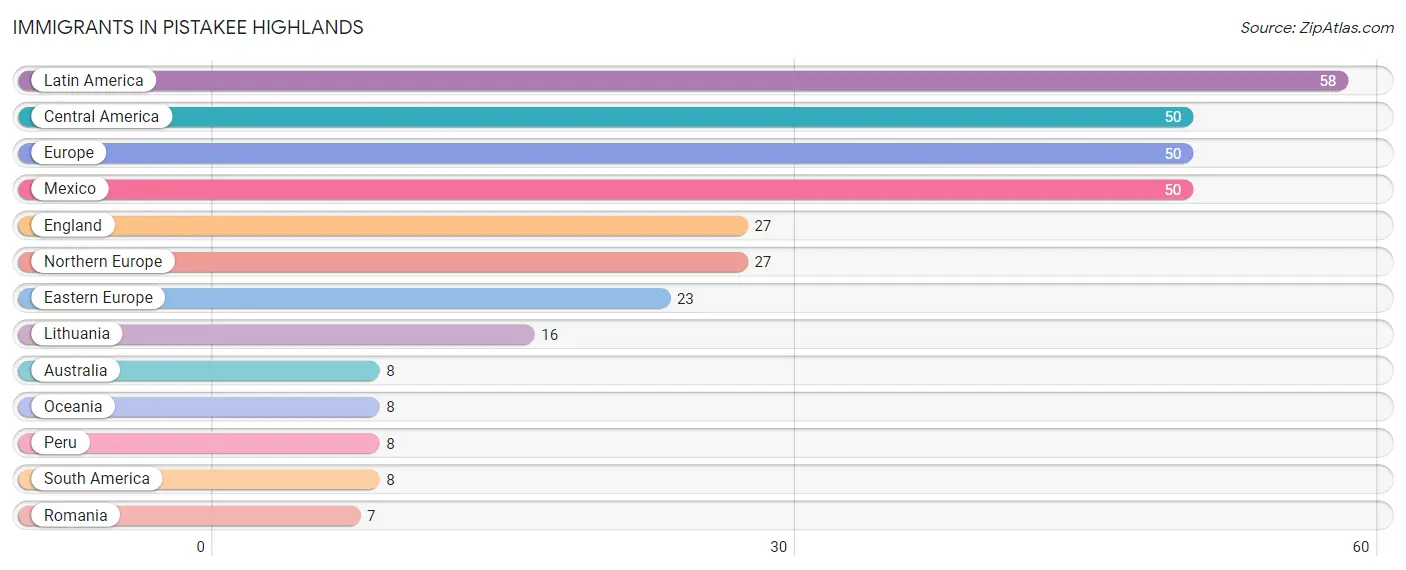
| Immigration Origin | # Population | % Population |
| Australia | 8 | 0.2% |
| Central America | 50 | 1.5% |
| Eastern Europe | 23 | 0.7% |
| England | 27 | 0.8% |
| Europe | 50 | 1.5% |
| Latin America | 58 | 1.8% |
| Lithuania | 16 | 0.5% |
| Mexico | 50 | 1.5% |
| Northern Europe | 27 | 0.8% |
| Oceania | 8 | 0.2% |
| Peru | 8 | 0.2% |
| Romania | 7 | 0.2% |
| South America | 8 | 0.2% | View All 13 Rows |
Sex and Age in Pistakee Highlands
Sex and Age in Pistakee Highlands
The most populous age groups in Pistakee Highlands are 55 to 59 Years (264 | 14.8%) for men and 35 to 39 Years (157 | 10.4%) for women.
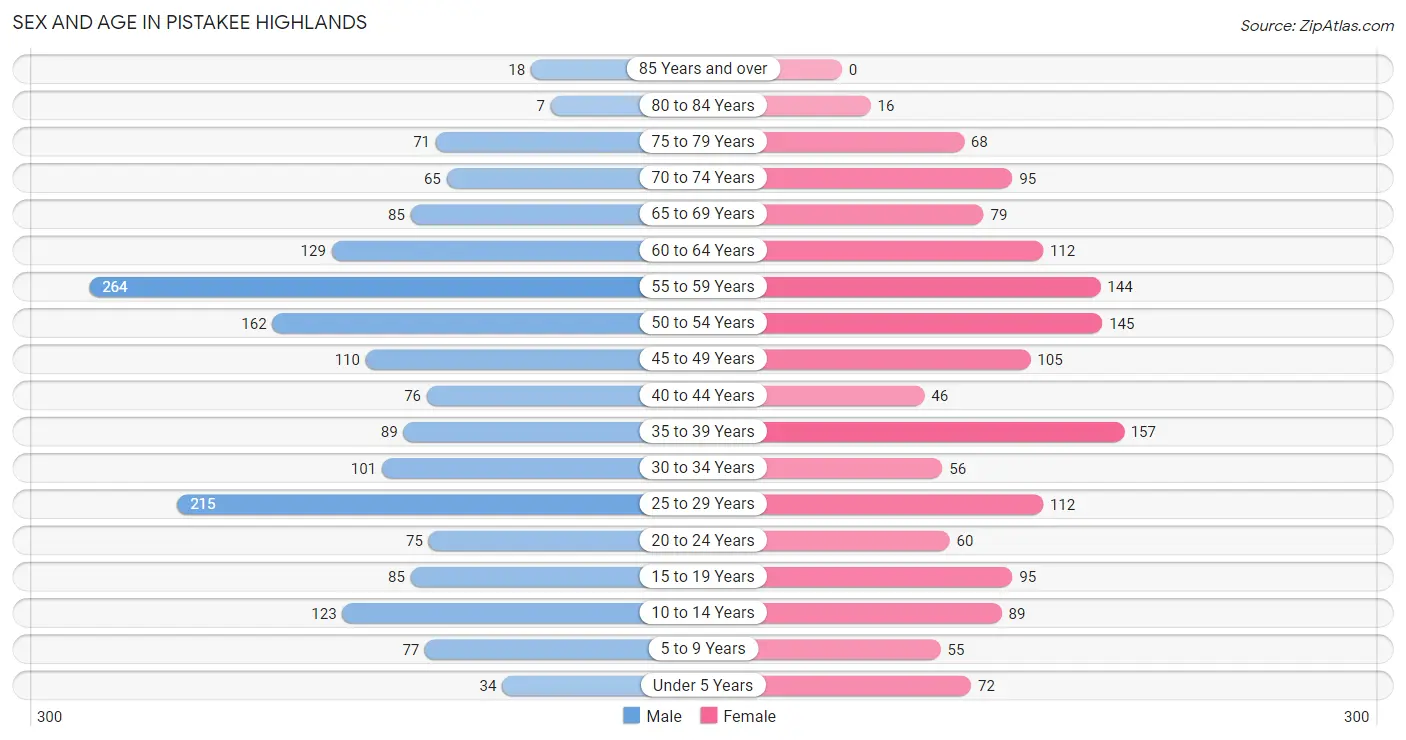
| Age Bracket | Male | Female |
| Under 5 Years | 34 (1.9%) | 72 (4.8%) |
| 5 to 9 Years | 77 (4.3%) | 55 (3.6%) |
| 10 to 14 Years | 123 (6.9%) | 89 (5.9%) |
| 15 to 19 Years | 85 (4.8%) | 95 (6.3%) |
| 20 to 24 Years | 75 (4.2%) | 60 (4.0%) |
| 25 to 29 Years | 215 (12.0%) | 112 (7.4%) |
| 30 to 34 Years | 101 (5.7%) | 56 (3.7%) |
| 35 to 39 Years | 89 (5.0%) | 157 (10.4%) |
| 40 to 44 Years | 76 (4.3%) | 46 (3.0%) |
| 45 to 49 Years | 110 (6.2%) | 105 (7.0%) |
| 50 to 54 Years | 162 (9.1%) | 145 (9.6%) |
| 55 to 59 Years | 264 (14.8%) | 144 (9.6%) |
| 60 to 64 Years | 129 (7.2%) | 112 (7.4%) |
| 65 to 69 Years | 85 (4.8%) | 79 (5.2%) |
| 70 to 74 Years | 65 (3.6%) | 95 (6.3%) |
| 75 to 79 Years | 71 (4.0%) | 68 (4.5%) |
| 80 to 84 Years | 7 (0.4%) | 16 (1.1%) |
| 85 Years and over | 18 (1.0%) | 0 (0.0%) |
| Total | 1,786 (100.0%) | 1,506 (100.0%) |
Families and Households in Pistakee Highlands
Median Family Size in Pistakee Highlands
The median family size in Pistakee Highlands is 2.90 persons per family, with married-couple families (704 | 73.9%) accounting for the largest median family size of 2.98 persons per family. On the other hand, single female/mother families (90 | 9.4%) represent the smallest median family size with 2.43 persons per family.
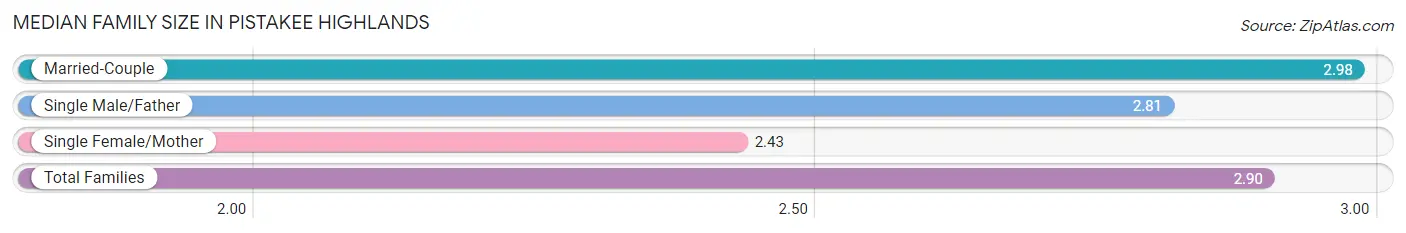
| Family Type | # Families | Family Size |
| Married-Couple | 704 (73.9%) | 2.98 |
| Single Male/Father | 159 (16.7%) | 2.81 |
| Single Female/Mother | 90 (9.4%) | 2.43 |
| Total Families | 953 (100.0%) | 2.90 |
Median Household Size in Pistakee Highlands
The median household size in Pistakee Highlands is 2.59 persons per household, with single male/father households (159 | 12.5%) accounting for the largest median household size of 3.17 persons per household. non-family households (317 | 25.0%) represent the smallest median household size with 1.27 persons per household.
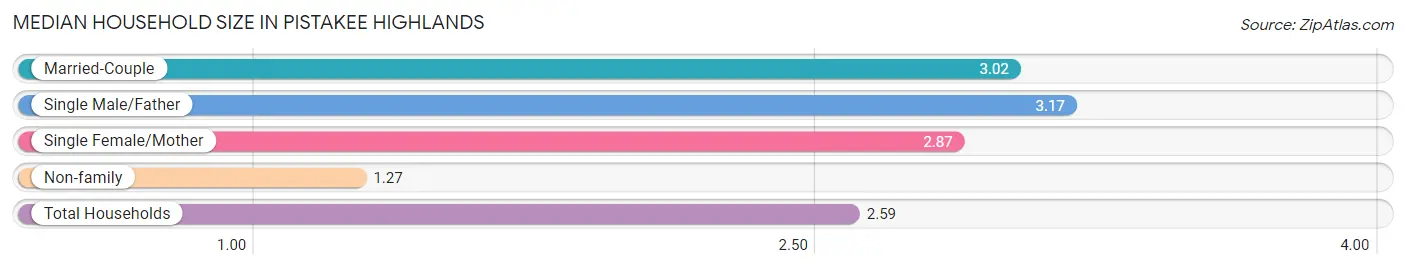
| Household Type | # Households | Household Size |
| Married-Couple | 704 (55.4%) | 3.02 |
| Single Male/Father | 159 (12.5%) | 3.17 |
| Single Female/Mother | 90 (7.1%) | 2.87 |
| Non-family | 317 (25.0%) | 1.27 |
| Total Households | 1,270 (100.0%) | 2.59 |
Household Size by Marriage Status in Pistakee Highlands
Out of a total of 1,270 households in Pistakee Highlands, 953 (75.0%) are family households, while 317 (25.0%) are nonfamily households. The most numerous type of family households are 2-person households, comprising 442, and the most common type of nonfamily households are 1-person households, comprising 241.
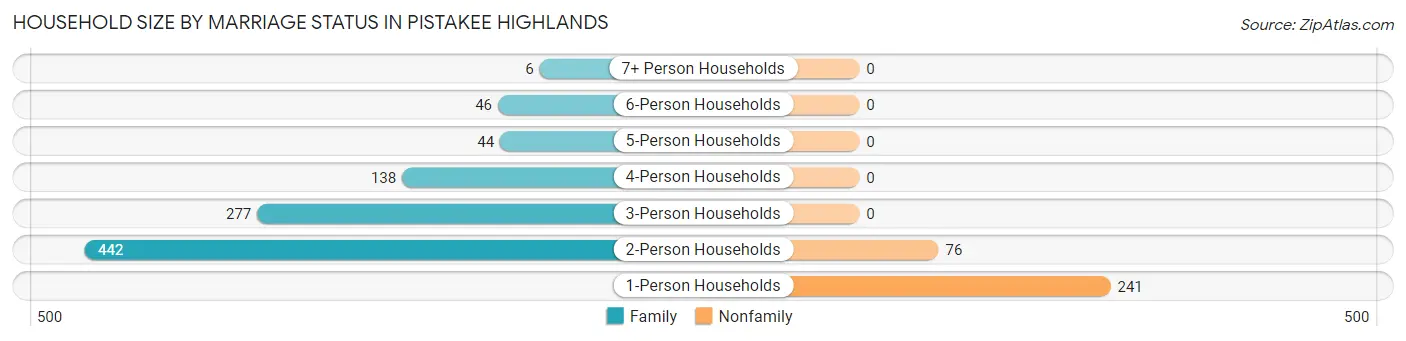
| Household Size | Family Households | Nonfamily Households |
| 1-Person Households | - | 241 (19.0%) |
| 2-Person Households | 442 (34.8%) | 76 (6.0%) |
| 3-Person Households | 277 (21.8%) | 0 (0.0%) |
| 4-Person Households | 138 (10.9%) | 0 (0.0%) |
| 5-Person Households | 44 (3.5%) | 0 (0.0%) |
| 6-Person Households | 46 (3.6%) | 0 (0.0%) |
| 7+ Person Households | 6 (0.5%) | 0 (0.0%) |
| Total | 953 (75.0%) | 317 (25.0%) |
Female Fertility in Pistakee Highlands
Fertility by Age in Pistakee Highlands
Average fertility rate in Pistakee Highlands is 31.0 births per 1,000 women. Women in the age bracket of 20 to 34 years have the highest fertility rate with 70.0 births per 1,000 women. Women in the age bracket of 20 to 34 years acount for 76.2% of all women with births.
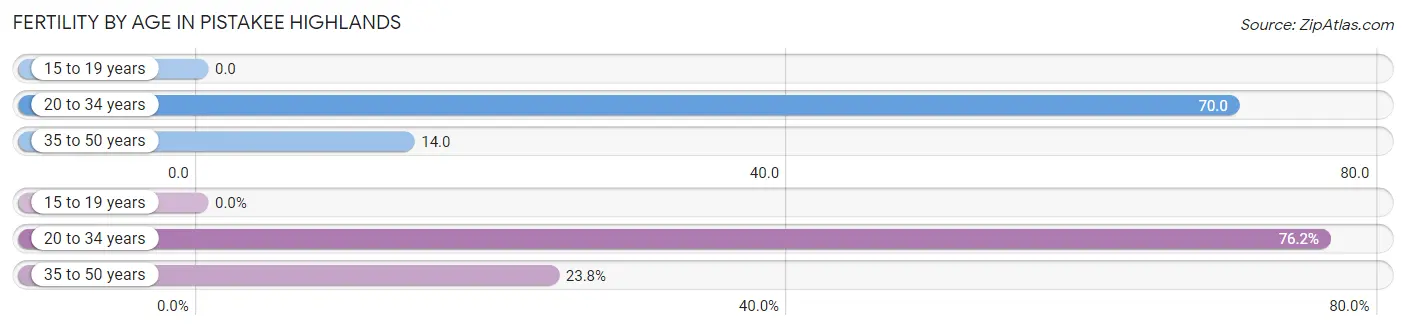
| Age Bracket | Women with Births | Births / 1,000 Women |
| 15 to 19 years | 0 (0.0%) | 0.0 |
| 20 to 34 years | 16 (76.2%) | 70.0 |
| 35 to 50 years | 5 (23.8%) | 14.0 |
| Total | 21 (100.0%) | 31.0 |
Fertility by Age by Marriage Status in Pistakee Highlands
23.8% of women with births (21) in Pistakee Highlands are married. The highest percentage of unmarried women with births falls into 20 to 34 years age bracket with 100.0% of them unmarried at the time of birth, while the lowest percentage of unmarried women with births belong to 35 to 50 years age bracket with 0.0% of them unmarried.
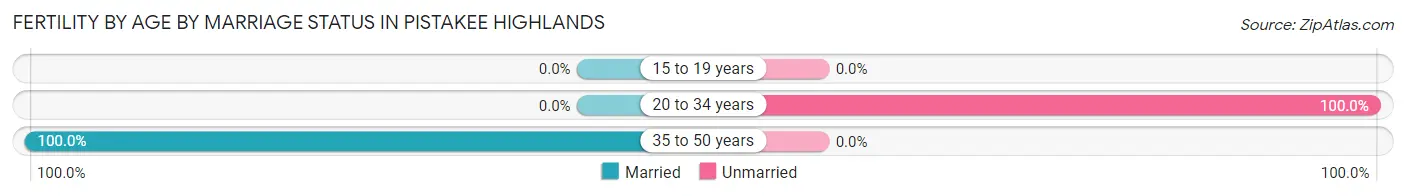
| Age Bracket | Married | Unmarried |
| 15 to 19 years | 0 (0.0%) | 0 (0.0%) |
| 20 to 34 years | 0 (0.0%) | 16 (100.0%) |
| 35 to 50 years | 5 (100.0%) | 0 (0.0%) |
| Total | 5 (23.8%) | 16 (76.2%) |
Fertility by Education in Pistakee Highlands
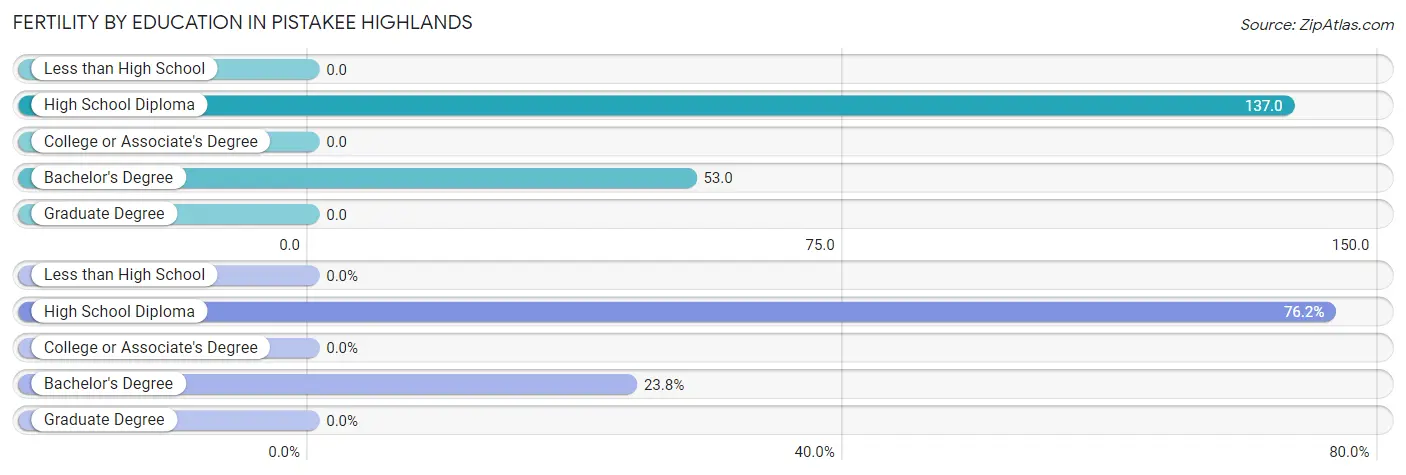
| Educational Attainment | Women with Births | Births / 1,000 Women |
| Less than High School | 0 (0.0%) | 0.0 |
| High School Diploma | 16 (76.2%) | 137.0 |
| College or Associate's Degree | 0 (0.0%) | 0.0 |
| Bachelor's Degree | 5 (23.8%) | 53.0 |
| Graduate Degree | 0 (0.0%) | 0.0 |
| Total | 21 (100.0%) | 31.0 |
Fertility by Education by Marriage Status in Pistakee Highlands
76.2% of women with births in Pistakee Highlands are unmarried. Women with the educational attainment of bachelor's degree are most likely to be married with 100.0% of them married at childbirth, while women with the educational attainment of high school diploma are least likely to be married with 100.0% of them unmarried at childbirth.
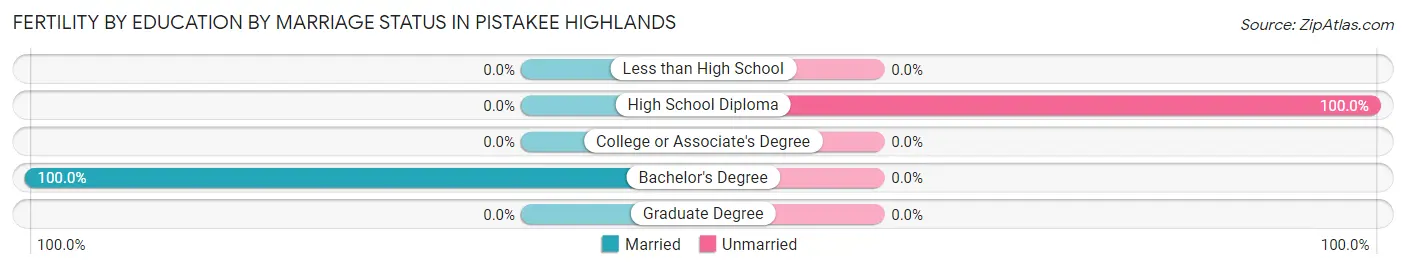
| Educational Attainment | Married | Unmarried |
| Less than High School | 0 (0.0%) | 0 (0.0%) |
| High School Diploma | 0 (0.0%) | 16 (100.0%) |
| College or Associate's Degree | 0 (0.0%) | 0 (0.0%) |
| Bachelor's Degree | 5 (100.0%) | 0 (0.0%) |
| Graduate Degree | 0 (0.0%) | 0 (0.0%) |
| Total | 5 (23.8%) | 16 (76.2%) |
Employment Characteristics in Pistakee Highlands
Employment by Class of Employer in Pistakee Highlands
Among the 1,962 employed individuals in Pistakee Highlands, private company employees (1,438 | 73.3%), local government employees (158 | 8.1%), and self-employed (not incorporated) (143 | 7.3%) make up the most common classes of employment.
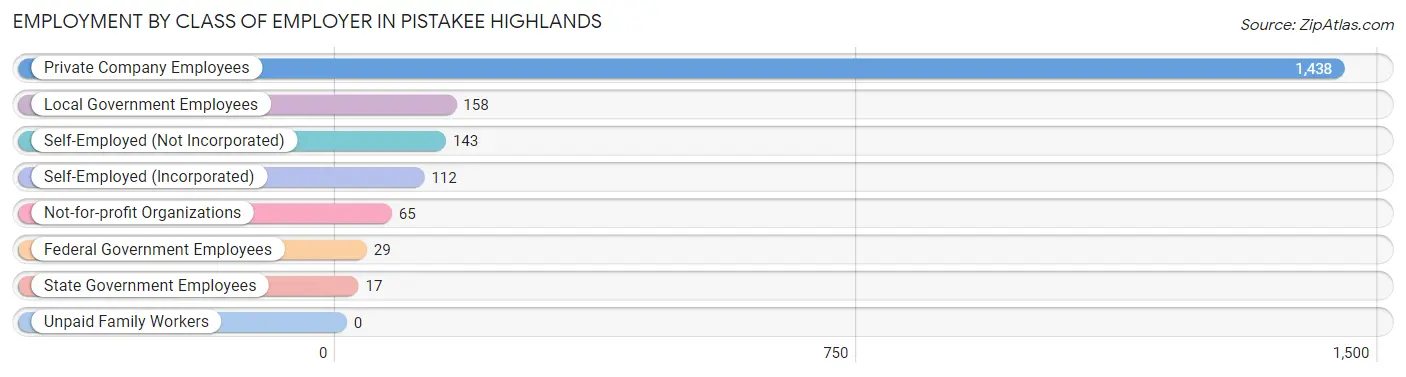
| Employer Class | # Employees | % Employees |
| Private Company Employees | 1,438 | 73.3% |
| Self-Employed (Incorporated) | 112 | 5.7% |
| Self-Employed (Not Incorporated) | 143 | 7.3% |
| Not-for-profit Organizations | 65 | 3.3% |
| Local Government Employees | 158 | 8.1% |
| State Government Employees | 17 | 0.9% |
| Federal Government Employees | 29 | 1.5% |
| Unpaid Family Workers | 0 | 0.0% |
| Total | 1,962 | 100.0% |
Employment Status by Age in Pistakee Highlands
According to the labor force statistics for Pistakee Highlands, out of the total population over 16 years of age (2,818), 75.4% or 2,125 individuals are in the labor force, with 3.6% or 76 of them unemployed. The age group with the highest labor force participation rate is 20 to 24 years, with 100.0% or 135 individuals in the labor force. Within the labor force, the 16 to 19 years age range has the highest percentage of unemployed individuals, with 10.1% or 11 of them being unemployed.
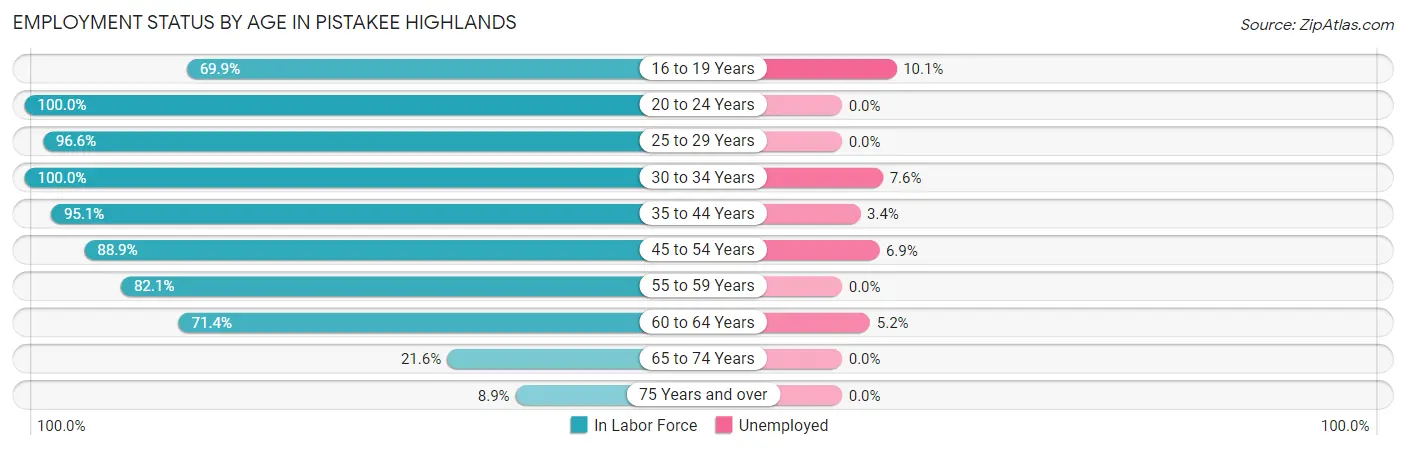
| Age Bracket | In Labor Force | Unemployed |
| 16 to 19 Years | 109 (69.9%) | 11 (10.1%) |
| 20 to 24 Years | 135 (100.0%) | 0 (0.0%) |
| 25 to 29 Years | 316 (96.6%) | 0 (0.0%) |
| 30 to 34 Years | 157 (100.0%) | 12 (7.6%) |
| 35 to 44 Years | 350 (95.1%) | 12 (3.4%) |
| 45 to 54 Years | 464 (88.9%) | 32 (6.9%) |
| 55 to 59 Years | 335 (82.1%) | 0 (0.0%) |
| 60 to 64 Years | 172 (71.4%) | 9 (5.2%) |
| 65 to 74 Years | 70 (21.6%) | 0 (0.0%) |
| 75 Years and over | 16 (8.9%) | 0 (0.0%) |
| Total | 2,125 (75.4%) | 76 (3.6%) |
Employment Status by Educational Attainment in Pistakee Highlands
According to labor force statistics for Pistakee Highlands, 88.7% of individuals (1,794) out of the total population between 25 and 64 years of age (2,023) are in the labor force, with 3.6% or 65 of them being unemployed. The group with the highest labor force participation rate are those with the educational attainment of bachelor's degree or higher, with 100.0% or 358 individuals in the labor force. Within the labor force, individuals with college / associate degree education have the highest percentage of unemployment, with 4.3% or 33 of them being unemployed.
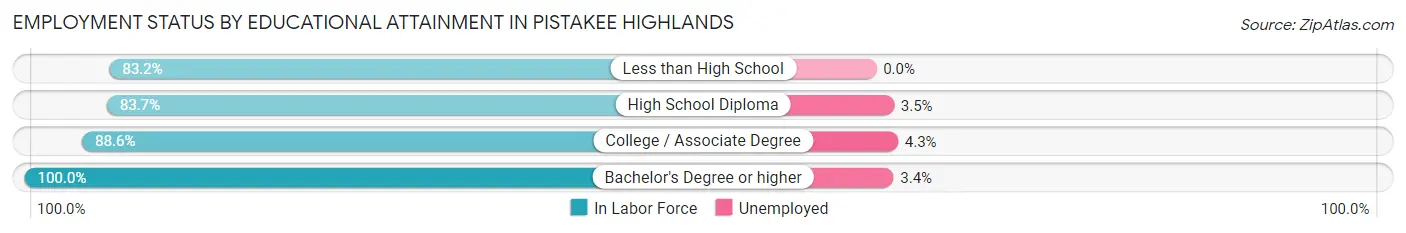
| Educational Attainment | In Labor Force | Unemployed |
| Less than High School | 89 (83.2%) | 0 (0.0%) |
| High School Diploma | 574 (83.7%) | 24 (3.5%) |
| College / Associate Degree | 773 (88.6%) | 37 (4.3%) |
| Bachelor's Degree or higher | 358 (100.0%) | 12 (3.4%) |
| Total | 1,794 (88.7%) | 73 (3.6%) |
Employment Occupations by Sex in Pistakee Highlands
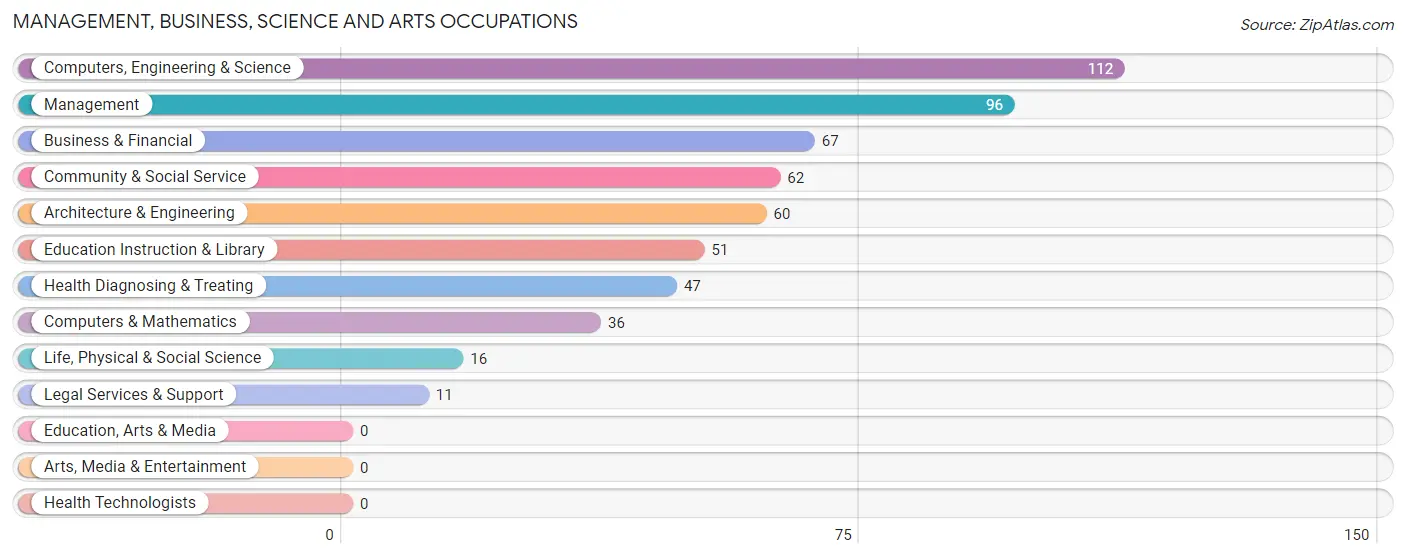
Management, Business, Science and Arts Occupations
The most common Management, Business, Science and Arts occupations in Pistakee Highlands are Computers, Engineering & Science (112 | 5.5%), Management (96 | 4.7%), Business & Financial (67 | 3.3%), Community & Social Service (62 | 3.0%), and Architecture & Engineering (60 | 2.9%).
Management, Business, Science and Arts Occupations by Sex
Within the Management, Business, Science and Arts occupations in Pistakee Highlands, the most male-oriented occupations are Architecture & Engineering (100.0%), Computers, Engineering & Science (83.9%), and Computers & Mathematics (72.2%), while the most female-oriented occupations are Legal Services & Support (100.0%), Health Diagnosing & Treating (100.0%), and Business & Financial (80.6%).
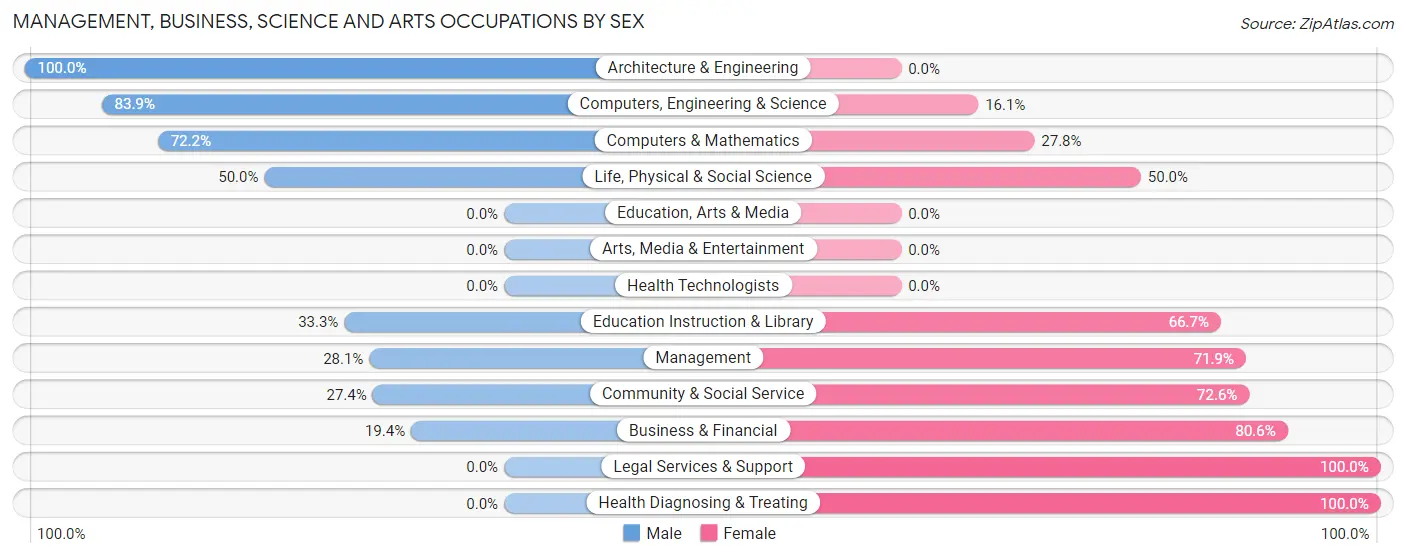
| Occupation | Male | Female |
| Management | 27 (28.1%) | 69 (71.9%) |
| Business & Financial | 13 (19.4%) | 54 (80.6%) |
| Computers, Engineering & Science | 94 (83.9%) | 18 (16.1%) |
| Computers & Mathematics | 26 (72.2%) | 10 (27.8%) |
| Architecture & Engineering | 60 (100.0%) | 0 (0.0%) |
| Life, Physical & Social Science | 8 (50.0%) | 8 (50.0%) |
| Community & Social Service | 17 (27.4%) | 45 (72.6%) |
| Education, Arts & Media | 0 (0.0%) | 0 (0.0%) |
| Legal Services & Support | 0 (0.0%) | 11 (100.0%) |
| Education Instruction & Library | 17 (33.3%) | 34 (66.7%) |
| Arts, Media & Entertainment | 0 (0.0%) | 0 (0.0%) |
| Health Diagnosing & Treating | 0 (0.0%) | 47 (100.0%) |
| Health Technologists | 0 (0.0%) | 0 (0.0%) |
| Total (Category) | 151 (39.3%) | 233 (60.7%) |
| Total (Overall) | 1,229 (60.0%) | 819 (40.0%) |
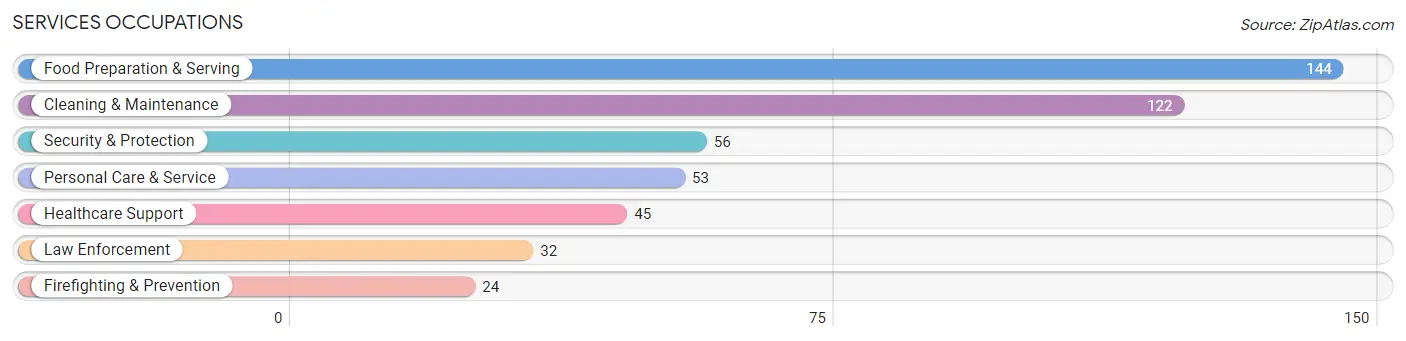
Services Occupations
The most common Services occupations in Pistakee Highlands are Food Preparation & Serving (144 | 7.0%), Cleaning & Maintenance (122 | 6.0%), Security & Protection (56 | 2.7%), Personal Care & Service (53 | 2.6%), and Healthcare Support (45 | 2.2%).
Services Occupations by Sex
Within the Services occupations in Pistakee Highlands, the most male-oriented occupations are Security & Protection (100.0%), Firefighting & Prevention (100.0%), and Law Enforcement (100.0%), while the most female-oriented occupations are Personal Care & Service (100.0%), Healthcare Support (64.4%), and Food Preparation & Serving (59.7%).
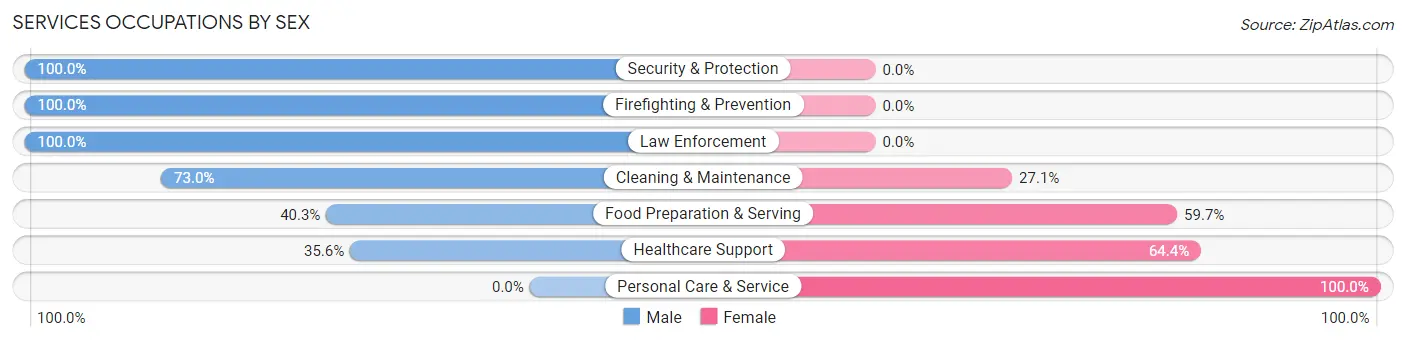
| Occupation | Male | Female |
| Healthcare Support | 16 (35.6%) | 29 (64.4%) |
| Security & Protection | 56 (100.0%) | 0 (0.0%) |
| Firefighting & Prevention | 24 (100.0%) | 0 (0.0%) |
| Law Enforcement | 32 (100.0%) | 0 (0.0%) |
| Food Preparation & Serving | 58 (40.3%) | 86 (59.7%) |
| Cleaning & Maintenance | 89 (73.0%) | 33 (27.1%) |
| Personal Care & Service | 0 (0.0%) | 53 (100.0%) |
| Total (Category) | 219 (52.1%) | 201 (47.9%) |
| Total (Overall) | 1,229 (60.0%) | 819 (40.0%) |
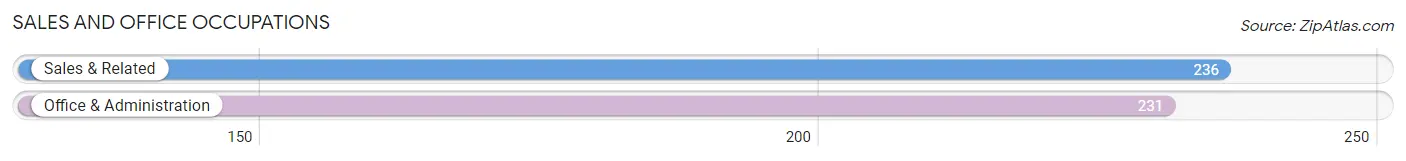
Sales and Office Occupations
The most common Sales and Office occupations in Pistakee Highlands are Sales & Related (236 | 11.5%), and Office & Administration (231 | 11.3%).
Sales and Office Occupations by Sex
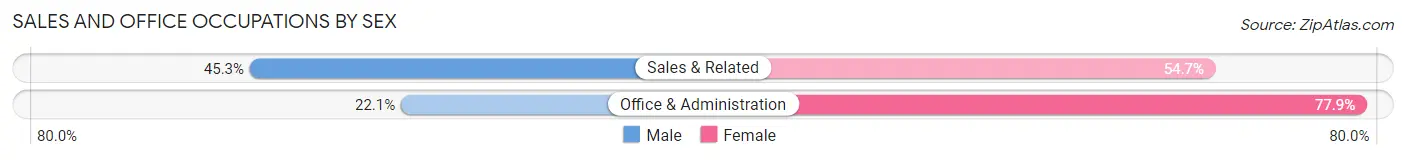
| Occupation | Male | Female |
| Sales & Related | 107 (45.3%) | 129 (54.7%) |
| Office & Administration | 51 (22.1%) | 180 (77.9%) |
| Total (Category) | 158 (33.8%) | 309 (66.2%) |
| Total (Overall) | 1,229 (60.0%) | 819 (40.0%) |
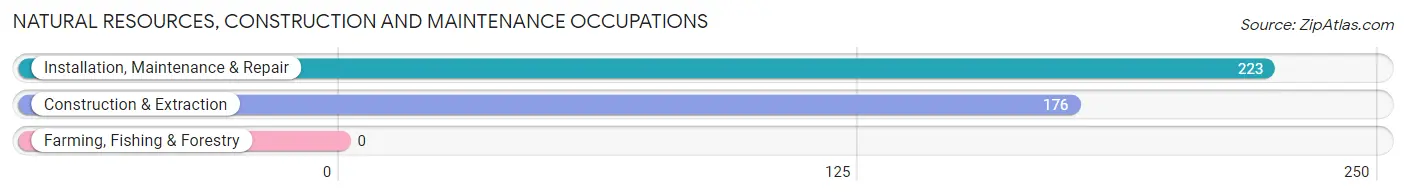
Natural Resources, Construction and Maintenance Occupations
The most common Natural Resources, Construction and Maintenance occupations in Pistakee Highlands are Installation, Maintenance & Repair (223 | 10.9%), and Construction & Extraction (176 | 8.6%).
Natural Resources, Construction and Maintenance Occupations by Sex
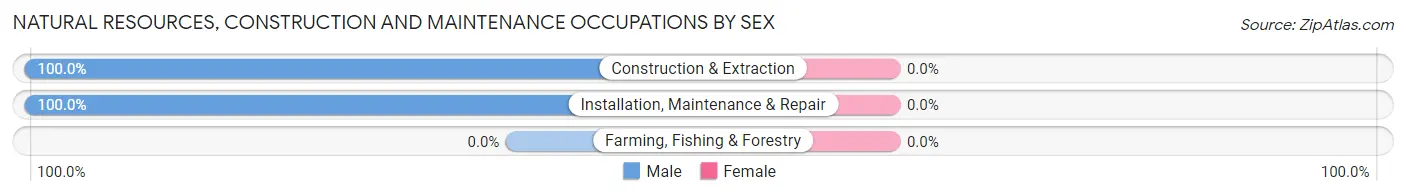
| Occupation | Male | Female |
| Farming, Fishing & Forestry | 0 (0.0%) | 0 (0.0%) |
| Construction & Extraction | 176 (100.0%) | 0 (0.0%) |
| Installation, Maintenance & Repair | 223 (100.0%) | 0 (0.0%) |
| Total (Category) | 399 (100.0%) | 0 (0.0%) |
| Total (Overall) | 1,229 (60.0%) | 819 (40.0%) |
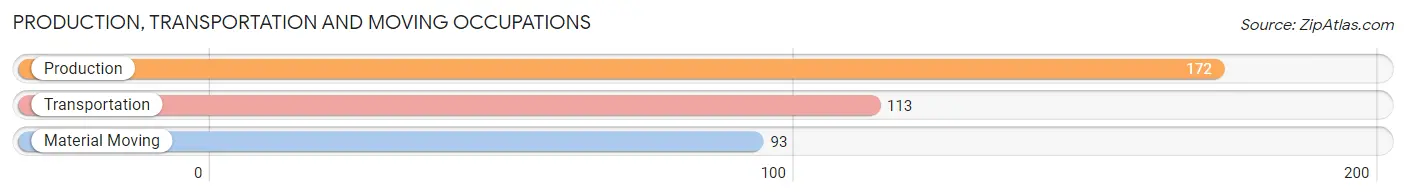
Production, Transportation and Moving Occupations
The most common Production, Transportation and Moving occupations in Pistakee Highlands are Production (172 | 8.4%), Transportation (113 | 5.5%), and Material Moving (93 | 4.5%).
Production, Transportation and Moving Occupations by Sex
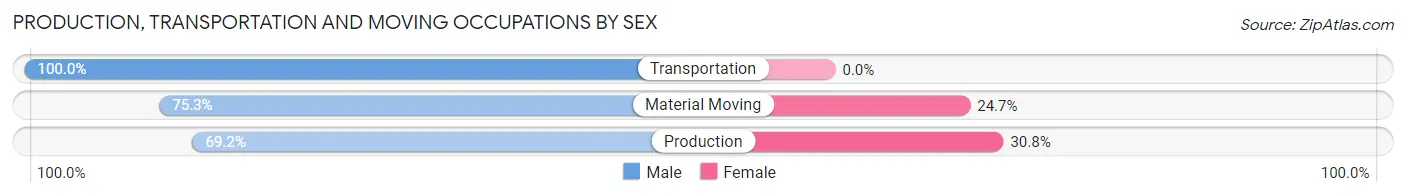
| Occupation | Male | Female |
| Production | 119 (69.2%) | 53 (30.8%) |
| Transportation | 113 (100.0%) | 0 (0.0%) |
| Material Moving | 70 (75.3%) | 23 (24.7%) |
| Total (Category) | 302 (79.9%) | 76 (20.1%) |
| Total (Overall) | 1,229 (60.0%) | 819 (40.0%) |
Employment Industries by Sex in Pistakee Highlands
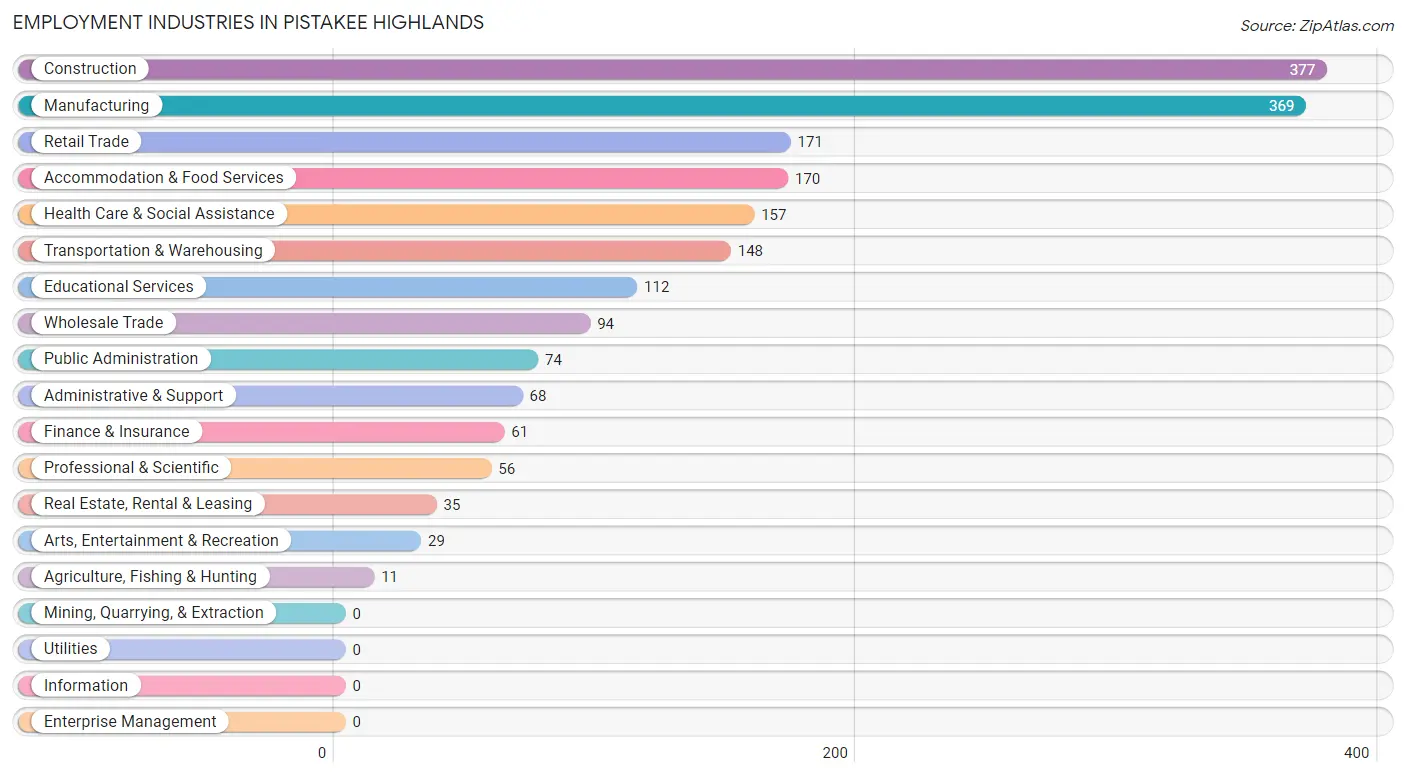
Employment Industries in Pistakee Highlands
The major employment industries in Pistakee Highlands include Construction (377 | 18.4%), Manufacturing (369 | 18.0%), Retail Trade (171 | 8.4%), Accommodation & Food Services (170 | 8.3%), and Health Care & Social Assistance (157 | 7.7%).
Employment Industries by Sex in Pistakee Highlands
The Pistakee Highlands industries that see more men than women are Administrative & Support (100.0%), Construction (90.7%), and Accommodation & Food Services (76.5%), whereas the industries that tend to have a higher number of women are Agriculture, Fishing & Hunting (100.0%), Finance & Insurance (100.0%), and Health Care & Social Assistance (89.8%).
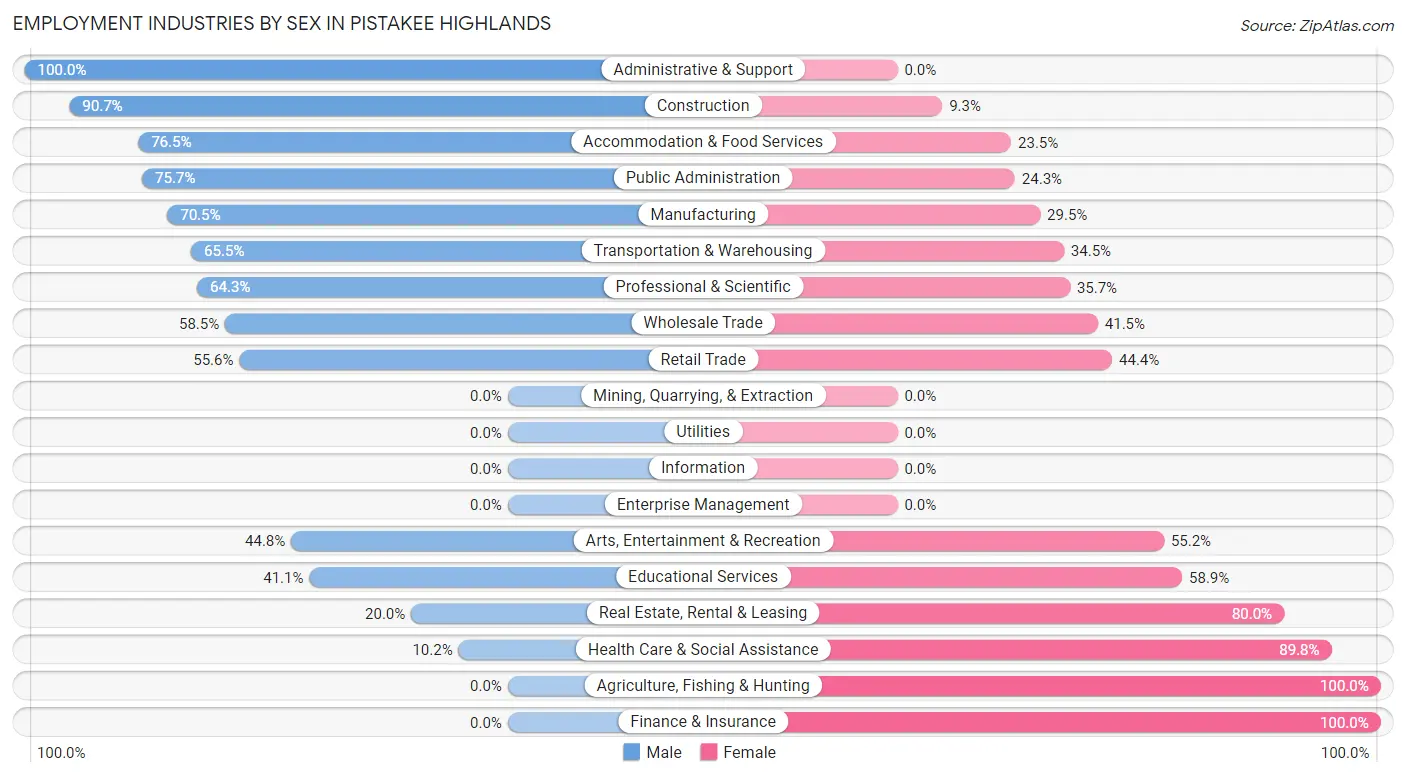
| Industry | Male | Female |
| Agriculture, Fishing & Hunting | 0 (0.0%) | 11 (100.0%) |
| Mining, Quarrying, & Extraction | 0 (0.0%) | 0 (0.0%) |
| Construction | 342 (90.7%) | 35 (9.3%) |
| Manufacturing | 260 (70.5%) | 109 (29.5%) |
| Wholesale Trade | 55 (58.5%) | 39 (41.5%) |
| Retail Trade | 95 (55.6%) | 76 (44.4%) |
| Transportation & Warehousing | 97 (65.5%) | 51 (34.5%) |
| Utilities | 0 (0.0%) | 0 (0.0%) |
| Information | 0 (0.0%) | 0 (0.0%) |
| Finance & Insurance | 0 (0.0%) | 61 (100.0%) |
| Real Estate, Rental & Leasing | 7 (20.0%) | 28 (80.0%) |
| Professional & Scientific | 36 (64.3%) | 20 (35.7%) |
| Enterprise Management | 0 (0.0%) | 0 (0.0%) |
| Administrative & Support | 68 (100.0%) | 0 (0.0%) |
| Educational Services | 46 (41.1%) | 66 (58.9%) |
| Health Care & Social Assistance | 16 (10.2%) | 141 (89.8%) |
| Arts, Entertainment & Recreation | 13 (44.8%) | 16 (55.2%) |
| Accommodation & Food Services | 130 (76.5%) | 40 (23.5%) |
| Public Administration | 56 (75.7%) | 18 (24.3%) |
| Total | 1,229 (60.0%) | 819 (40.0%) |
Education in Pistakee Highlands
School Enrollment in Pistakee Highlands
The most common levels of schooling among the 632 students in Pistakee Highlands are middle school (180 | 28.5%), high school (148 | 23.4%), and elementary school (124 | 19.6%).
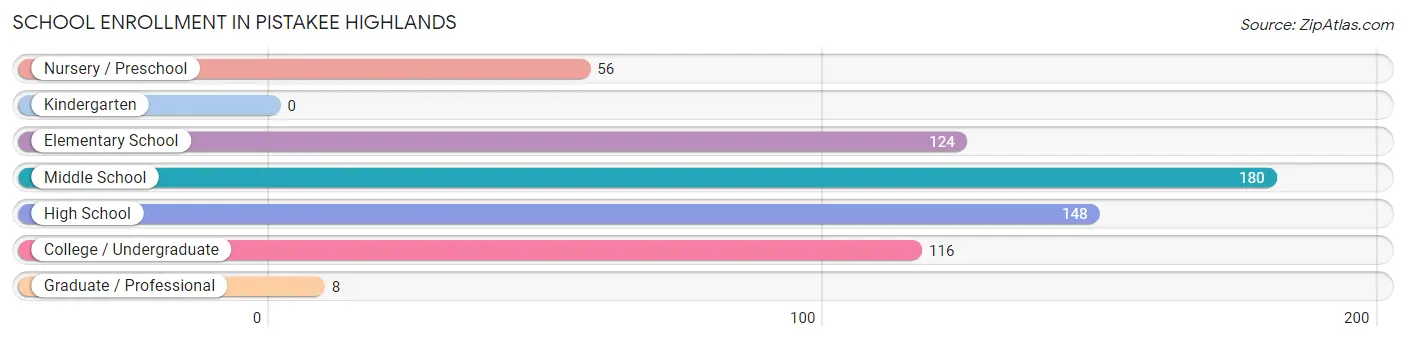
| School Level | # Students | % Students |
| Nursery / Preschool | 56 | 8.9% |
| Kindergarten | 0 | 0.0% |
| Elementary School | 124 | 19.6% |
| Middle School | 180 | 28.5% |
| High School | 148 | 23.4% |
| College / Undergraduate | 116 | 18.3% |
| Graduate / Professional | 8 | 1.3% |
| Total | 632 | 100.0% |
School Enrollment by Age by Funding Source in Pistakee Highlands
Out of a total of 632 students who are enrolled in schools in Pistakee Highlands, 43 (6.8%) attend a private institution, while the remaining 589 (93.2%) are enrolled in public schools. The age group of 35 years and over has the highest likelihood of being enrolled in private schools, with 34 (75.6% in the age bracket) enrolled. Conversely, the age group of 5 to 9 year old has the lowest likelihood of being enrolled in a private school, with 132 (100.0% in the age bracket) attending a public institution.
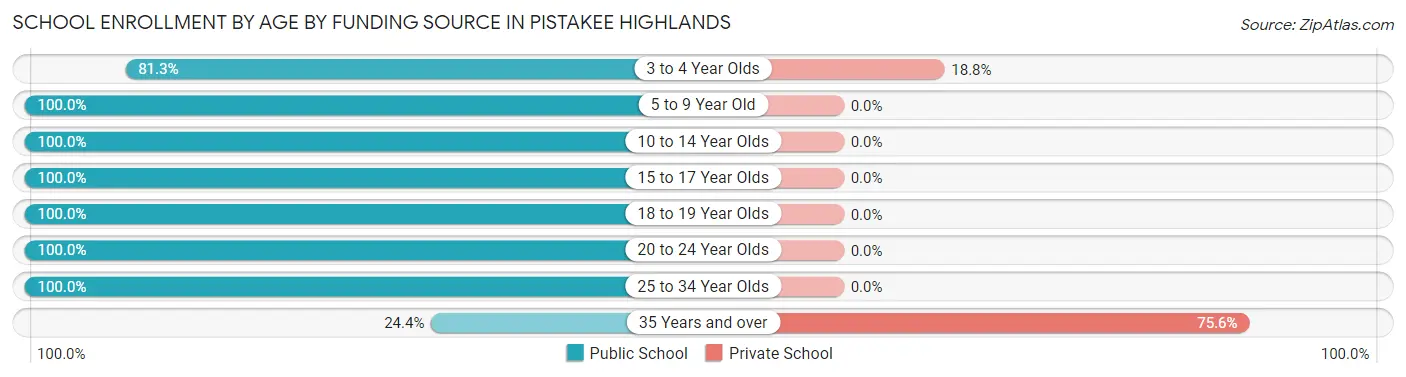
| Age Bracket | Public School | Private School |
| 3 to 4 Year Olds | 39 (81.2%) | 9 (18.8%) |
| 5 to 9 Year Old | 132 (100.0%) | 0 (0.0%) |
| 10 to 14 Year Olds | 202 (100.0%) | 0 (0.0%) |
| 15 to 17 Year Olds | 103 (100.0%) | 0 (0.0%) |
| 18 to 19 Year Olds | 34 (100.0%) | 0 (0.0%) |
| 20 to 24 Year Olds | 41 (100.0%) | 0 (0.0%) |
| 25 to 34 Year Olds | 27 (100.0%) | 0 (0.0%) |
| 35 Years and over | 11 (24.4%) | 34 (75.6%) |
| Total | 589 (93.2%) | 43 (6.8%) |
Educational Attainment by Field of Study in Pistakee Highlands
Engineering (80 | 16.8%), education (57 | 12.0%), bio, nature & agricultural (47 | 9.9%), communications (45 | 9.5%), and business (43 | 9.0%) are the most common fields of study among 476 individuals in Pistakee Highlands who have obtained a bachelor's degree or higher.
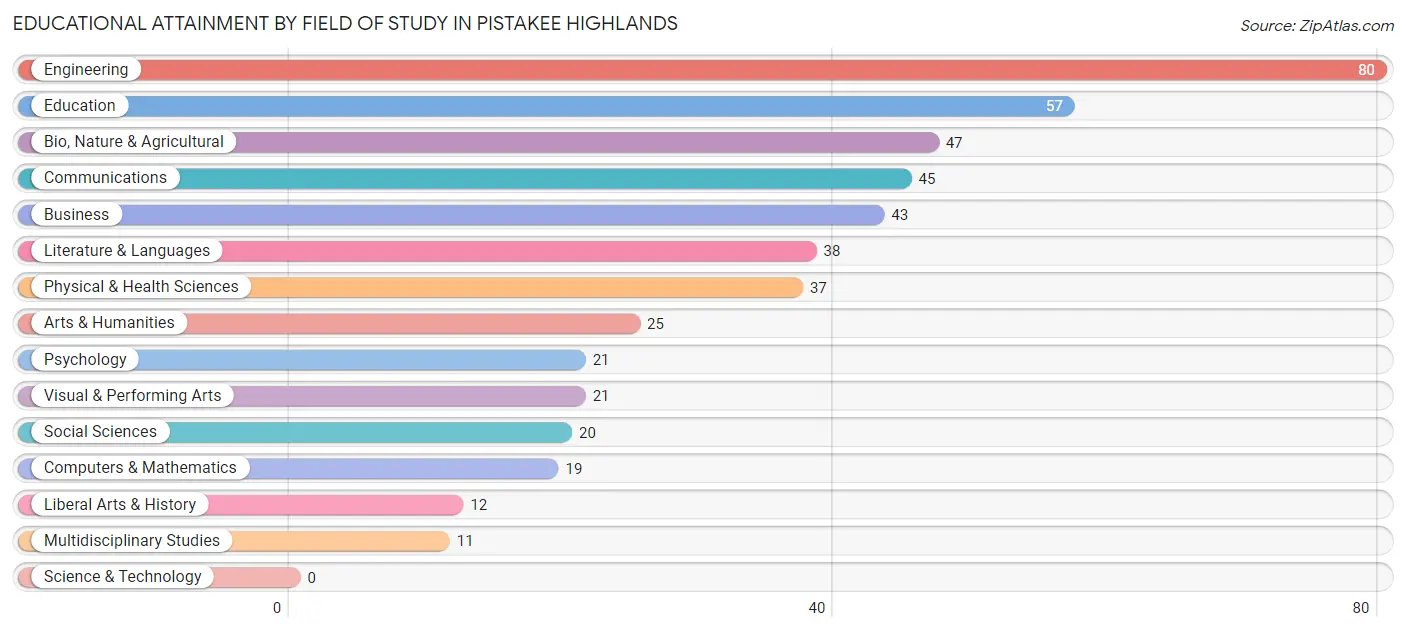
| Field of Study | # Graduates | % Graduates |
| Computers & Mathematics | 19 | 4.0% |
| Bio, Nature & Agricultural | 47 | 9.9% |
| Physical & Health Sciences | 37 | 7.8% |
| Psychology | 21 | 4.4% |
| Social Sciences | 20 | 4.2% |
| Engineering | 80 | 16.8% |
| Multidisciplinary Studies | 11 | 2.3% |
| Science & Technology | 0 | 0.0% |
| Business | 43 | 9.0% |
| Education | 57 | 12.0% |
| Literature & Languages | 38 | 8.0% |
| Liberal Arts & History | 12 | 2.5% |
| Visual & Performing Arts | 21 | 4.4% |
| Communications | 45 | 9.5% |
| Arts & Humanities | 25 | 5.2% |
| Total | 476 | 100.0% |
Transportation & Commute in Pistakee Highlands
Vehicle Availability by Sex in Pistakee Highlands
The most prevalent vehicle ownership categories in Pistakee Highlands are males with 2 vehicles (428, accounting for 37.0%) and females with 2 vehicles (368, making up 53.1%).
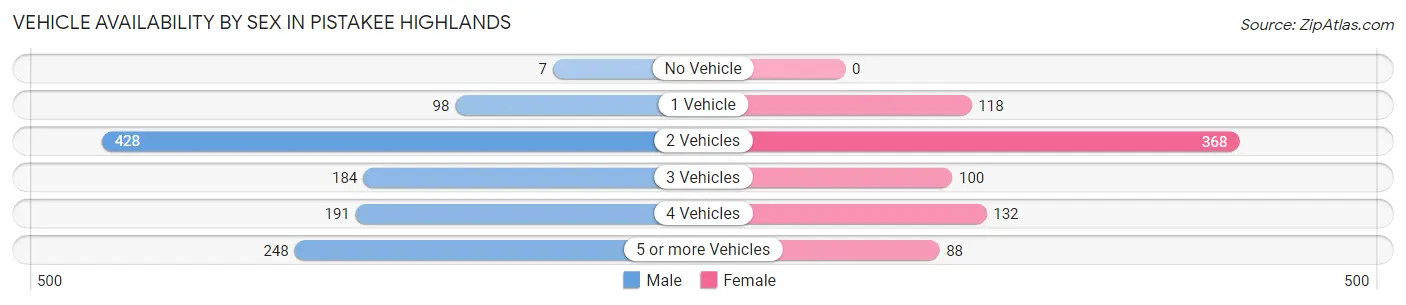
| Vehicles Available | Male | Female |
| No Vehicle | 7 (0.6%) | 0 (0.0%) |
| 1 Vehicle | 98 (8.5%) | 118 (14.6%) |
| 2 Vehicles | 428 (37.0%) | 368 (45.7%) |
| 3 Vehicles | 184 (15.9%) | 100 (12.4%) |
| 4 Vehicles | 191 (16.5%) | 132 (16.4%) |
| 5 or more Vehicles | 248 (21.4%) | 88 (10.9%) |
| Total | 1,156 (100.0%) | 806 (100.0%) |
Commute Time in Pistakee Highlands
The most frequently occuring commute durations in Pistakee Highlands are 20 to 24 minutes (296 commuters, 16.3%), 60 to 89 minutes (295 commuters, 16.2%), and 15 to 19 minutes (190 commuters, 10.4%).
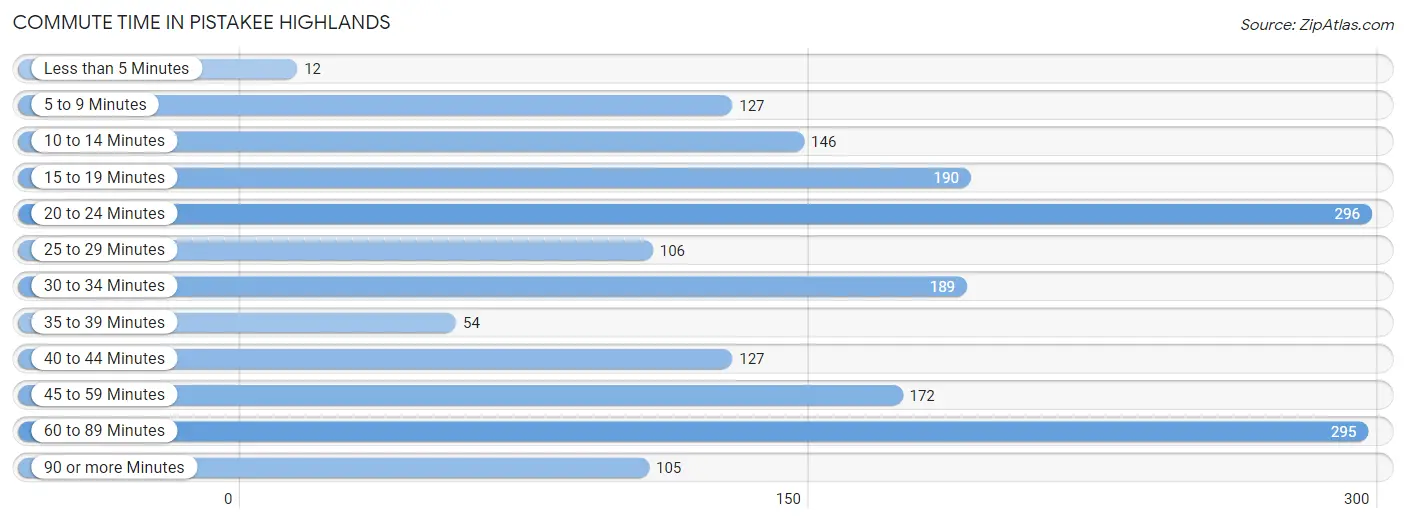
| Commute Time | # Commuters | % Commuters |
| Less than 5 Minutes | 12 | 0.7% |
| 5 to 9 Minutes | 127 | 7.0% |
| 10 to 14 Minutes | 146 | 8.0% |
| 15 to 19 Minutes | 190 | 10.4% |
| 20 to 24 Minutes | 296 | 16.3% |
| 25 to 29 Minutes | 106 | 5.8% |
| 30 to 34 Minutes | 189 | 10.4% |
| 35 to 39 Minutes | 54 | 3.0% |
| 40 to 44 Minutes | 127 | 7.0% |
| 45 to 59 Minutes | 172 | 9.5% |
| 60 to 89 Minutes | 295 | 16.2% |
| 90 or more Minutes | 105 | 5.8% |
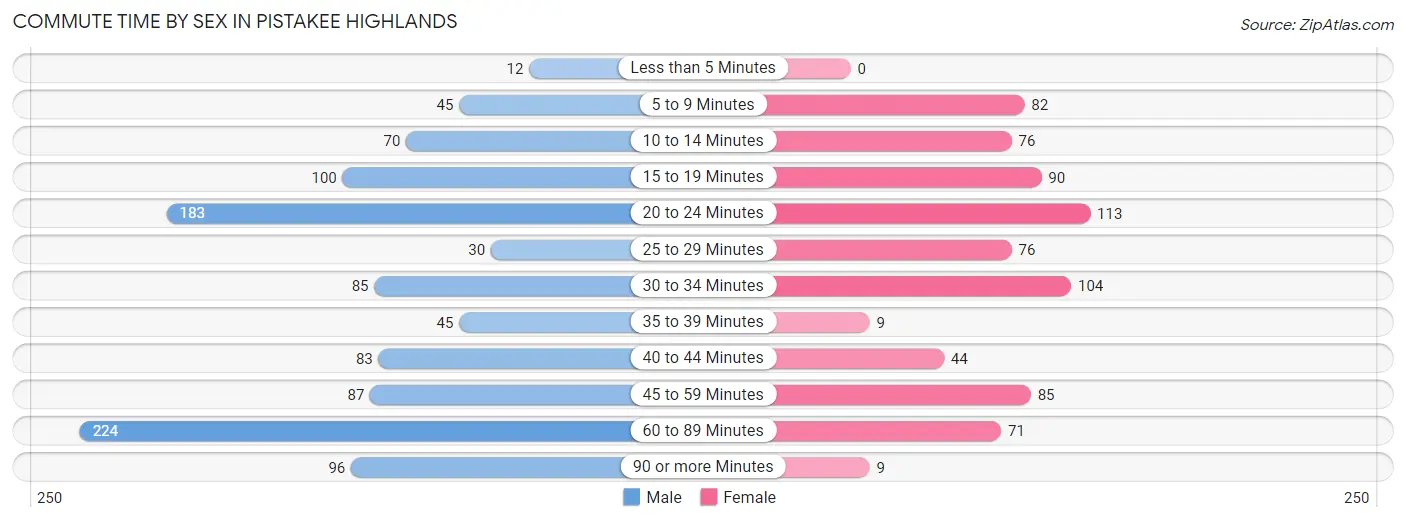
Commute Time by Sex in Pistakee Highlands
The most common commute times in Pistakee Highlands are 60 to 89 minutes (224 commuters, 21.1%) for males and 20 to 24 minutes (113 commuters, 14.9%) for females.
| Commute Time | Male | Female |
| Less than 5 Minutes | 12 (1.1%) | 0 (0.0%) |
| 5 to 9 Minutes | 45 (4.3%) | 82 (10.8%) |
| 10 to 14 Minutes | 70 (6.6%) | 76 (10.0%) |
| 15 to 19 Minutes | 100 (9.4%) | 90 (11.9%) |
| 20 to 24 Minutes | 183 (17.3%) | 113 (14.9%) |
| 25 to 29 Minutes | 30 (2.8%) | 76 (10.0%) |
| 30 to 34 Minutes | 85 (8.0%) | 104 (13.7%) |
| 35 to 39 Minutes | 45 (4.3%) | 9 (1.2%) |
| 40 to 44 Minutes | 83 (7.8%) | 44 (5.8%) |
| 45 to 59 Minutes | 87 (8.2%) | 85 (11.2%) |
| 60 to 89 Minutes | 224 (21.1%) | 71 (9.3%) |
| 90 or more Minutes | 96 (9.1%) | 9 (1.2%) |
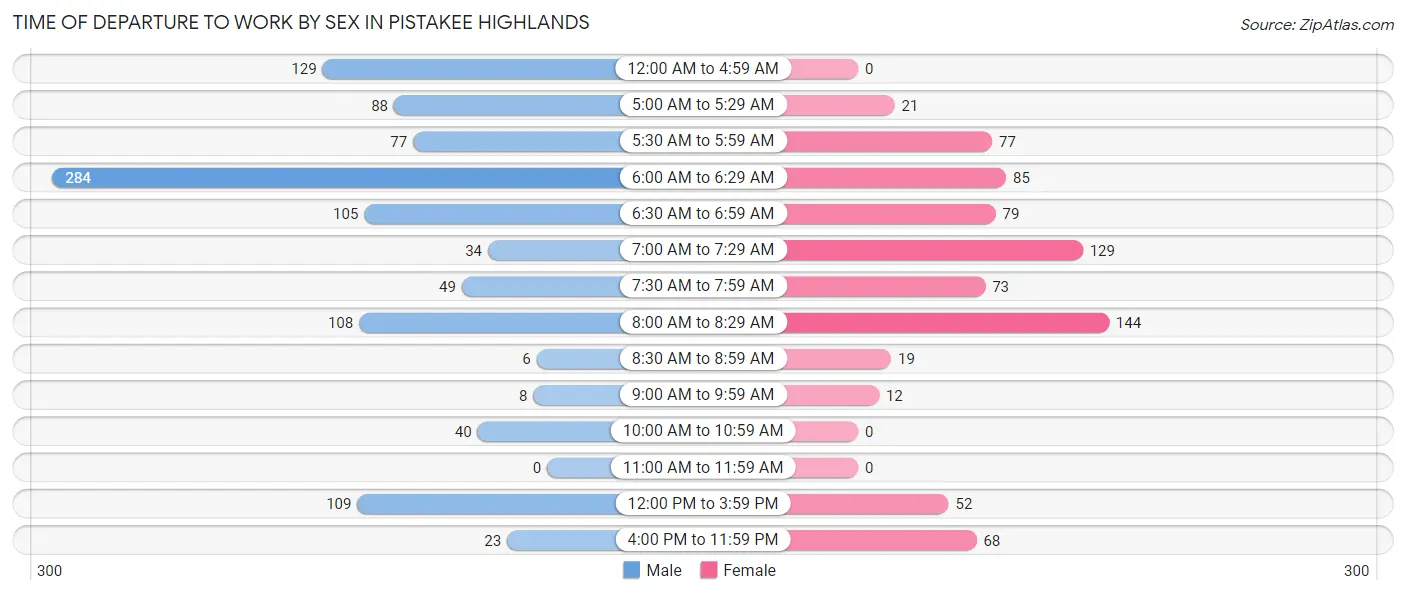
Time of Departure to Work by Sex in Pistakee Highlands
The most frequent times of departure to work in Pistakee Highlands are 6:00 AM to 6:29 AM (284, 26.8%) for males and 8:00 AM to 8:29 AM (144, 19.0%) for females.
| Time of Departure | Male | Female |
| 12:00 AM to 4:59 AM | 129 (12.2%) | 0 (0.0%) |
| 5:00 AM to 5:29 AM | 88 (8.3%) | 21 (2.8%) |
| 5:30 AM to 5:59 AM | 77 (7.3%) | 77 (10.1%) |
| 6:00 AM to 6:29 AM | 284 (26.8%) | 85 (11.2%) |
| 6:30 AM to 6:59 AM | 105 (9.9%) | 79 (10.4%) |
| 7:00 AM to 7:29 AM | 34 (3.2%) | 129 (17.0%) |
| 7:30 AM to 7:59 AM | 49 (4.6%) | 73 (9.6%) |
| 8:00 AM to 8:29 AM | 108 (10.2%) | 144 (19.0%) |
| 8:30 AM to 8:59 AM | 6 (0.6%) | 19 (2.5%) |
| 9:00 AM to 9:59 AM | 8 (0.7%) | 12 (1.6%) |
| 10:00 AM to 10:59 AM | 40 (3.8%) | 0 (0.0%) |
| 11:00 AM to 11:59 AM | 0 (0.0%) | 0 (0.0%) |
| 12:00 PM to 3:59 PM | 109 (10.3%) | 52 (6.9%) |
| 4:00 PM to 11:59 PM | 23 (2.2%) | 68 (9.0%) |
| Total | 1,060 (100.0%) | 759 (100.0%) |
Housing Occupancy in Pistakee Highlands
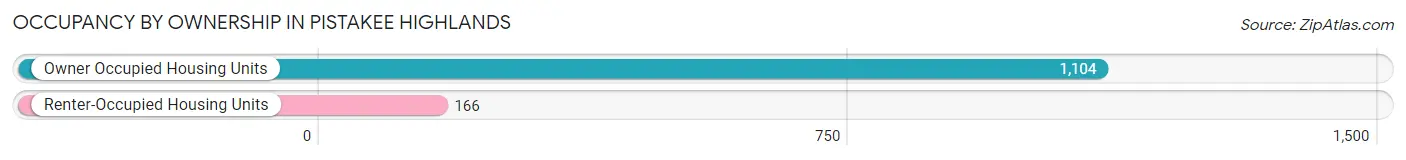
Occupancy by Ownership in Pistakee Highlands
Of the total 1,270 dwellings in Pistakee Highlands, owner-occupied units account for 1,104 (86.9%), while renter-occupied units make up 166 (13.1%).
| Occupancy | # Housing Units | % Housing Units |
| Owner Occupied Housing Units | 1,104 | 86.9% |
| Renter-Occupied Housing Units | 166 | 13.1% |
| Total Occupied Housing Units | 1,270 | 100.0% |
Occupancy by Household Size in Pistakee Highlands
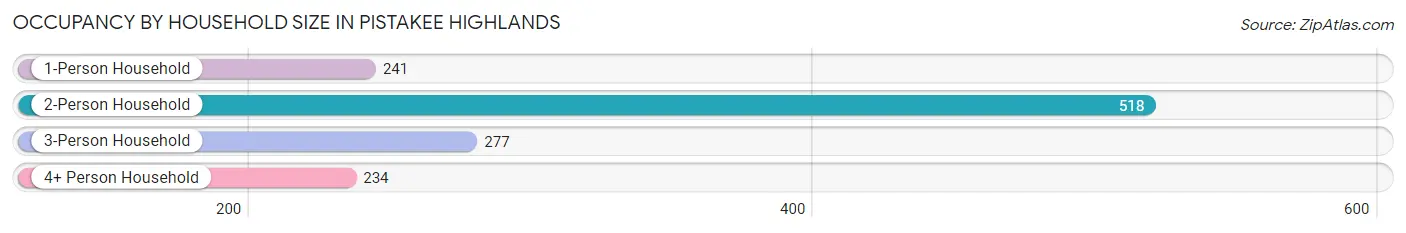
| Household Size | # Housing Units | % Housing Units |
| 1-Person Household | 241 | 19.0% |
| 2-Person Household | 518 | 40.8% |
| 3-Person Household | 277 | 21.8% |
| 4+ Person Household | 234 | 18.4% |
| Total Housing Units | 1,270 | 100.0% |
Occupancy by Ownership by Household Size in Pistakee Highlands
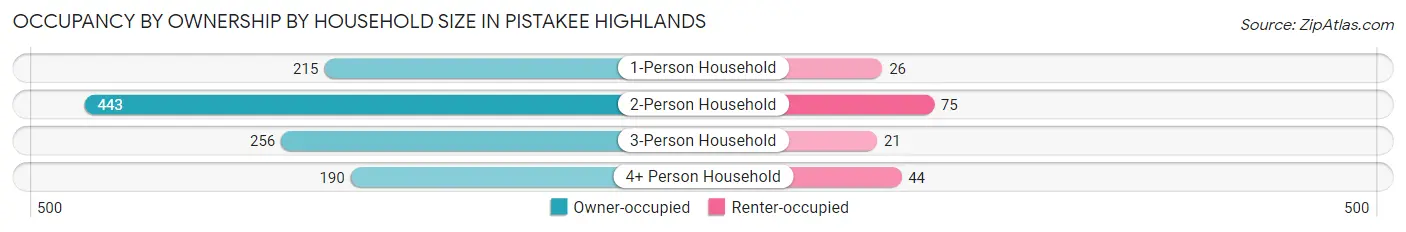
| Household Size | Owner-occupied | Renter-occupied |
| 1-Person Household | 215 (89.2%) | 26 (10.8%) |
| 2-Person Household | 443 (85.5%) | 75 (14.5%) |
| 3-Person Household | 256 (92.4%) | 21 (7.6%) |
| 4+ Person Household | 190 (81.2%) | 44 (18.8%) |
| Total Housing Units | 1,104 (86.9%) | 166 (13.1%) |
Occupancy by Educational Attainment in Pistakee Highlands
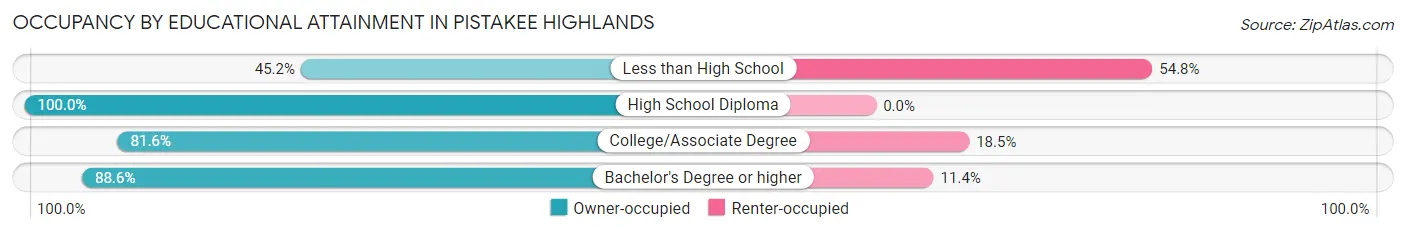
| Household Size | Owner-occupied | Renter-occupied |
| Less than High School | 19 (45.2%) | 23 (54.8%) |
| High School Diploma | 379 (100.0%) | 0 (0.0%) |
| College/Associate Degree | 535 (81.6%) | 121 (18.4%) |
| Bachelor's Degree or higher | 171 (88.6%) | 22 (11.4%) |
Occupancy by Age of Householder in Pistakee Highlands
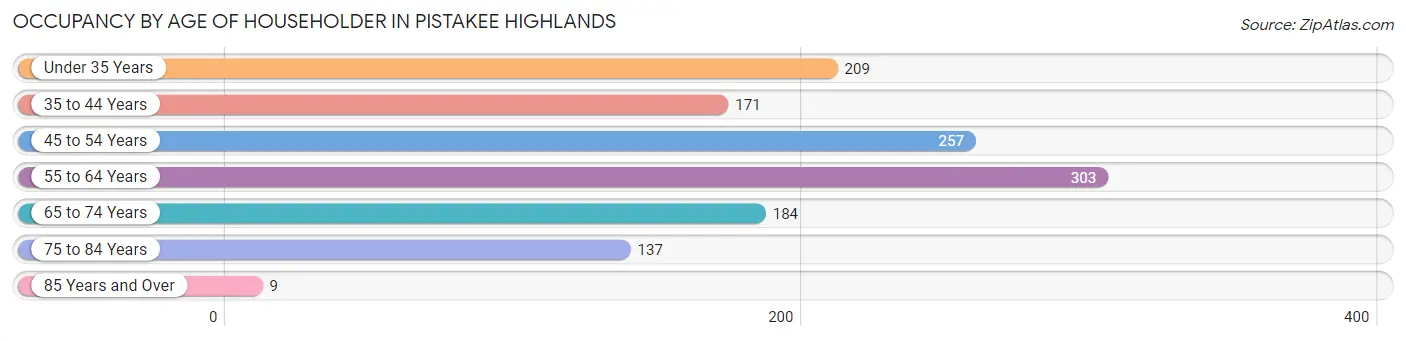
| Age Bracket | # Households | % Households |
| Under 35 Years | 209 | 16.5% |
| 35 to 44 Years | 171 | 13.5% |
| 45 to 54 Years | 257 | 20.2% |
| 55 to 64 Years | 303 | 23.9% |
| 65 to 74 Years | 184 | 14.5% |
| 75 to 84 Years | 137 | 10.8% |
| 85 Years and Over | 9 | 0.7% |
| Total | 1,270 | 100.0% |
Housing Finances in Pistakee Highlands
Median Income by Occupancy in Pistakee Highlands
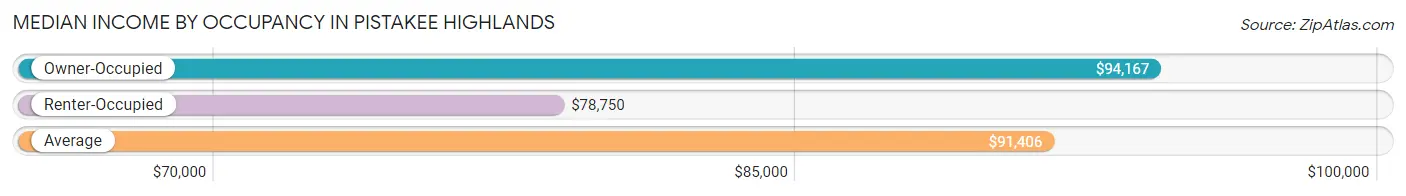
| Occupancy Type | # Households | Median Income |
| Owner-Occupied | 1,104 (86.9%) | $94,167 |
| Renter-Occupied | 166 (13.1%) | $78,750 |
| Average | 1,270 (100.0%) | $91,406 |
Occupancy by Householder Income Bracket in Pistakee Highlands
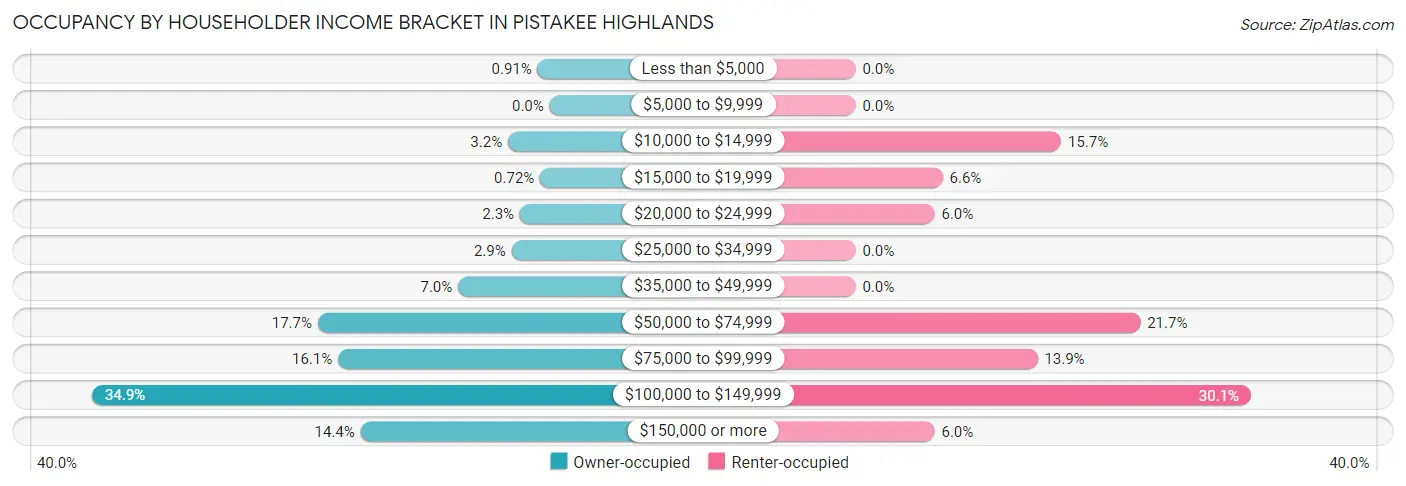
| Income Bracket | Owner-occupied | Renter-occupied |
| Less than $5,000 | 10 (0.9%) | 0 (0.0%) |
| $5,000 to $9,999 | 0 (0.0%) | 0 (0.0%) |
| $10,000 to $14,999 | 35 (3.2%) | 26 (15.7%) |
| $15,000 to $19,999 | 8 (0.7%) | 11 (6.6%) |
| $20,000 to $24,999 | 25 (2.3%) | 10 (6.0%) |
| $25,000 to $34,999 | 32 (2.9%) | 0 (0.0%) |
| $35,000 to $49,999 | 77 (7.0%) | 0 (0.0%) |
| $50,000 to $74,999 | 195 (17.7%) | 36 (21.7%) |
| $75,000 to $99,999 | 178 (16.1%) | 23 (13.9%) |
| $100,000 to $149,999 | 385 (34.9%) | 50 (30.1%) |
| $150,000 or more | 159 (14.4%) | 10 (6.0%) |
| Total | 1,104 (100.0%) | 166 (100.0%) |
Monthly Housing Cost Tiers in Pistakee Highlands
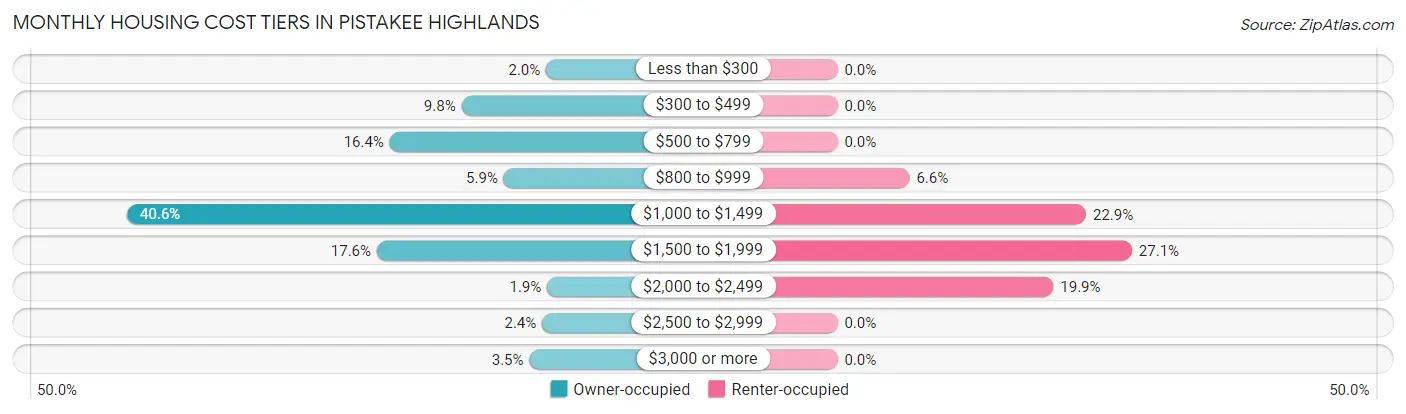
| Monthly Cost | Owner-occupied | Renter-occupied |
| Less than $300 | 22 (2.0%) | 0 (0.0%) |
| $300 to $499 | 108 (9.8%) | 0 (0.0%) |
| $500 to $799 | 181 (16.4%) | 0 (0.0%) |
| $800 to $999 | 65 (5.9%) | 11 (6.6%) |
| $1,000 to $1,499 | 448 (40.6%) | 38 (22.9%) |
| $1,500 to $1,999 | 194 (17.6%) | 45 (27.1%) |
| $2,000 to $2,499 | 21 (1.9%) | 33 (19.9%) |
| $2,500 to $2,999 | 26 (2.4%) | 0 (0.0%) |
| $3,000 or more | 39 (3.5%) | 0 (0.0%) |
| Total | 1,104 (100.0%) | 166 (100.0%) |
Physical Housing Characteristics in Pistakee Highlands
Housing Structures in Pistakee Highlands
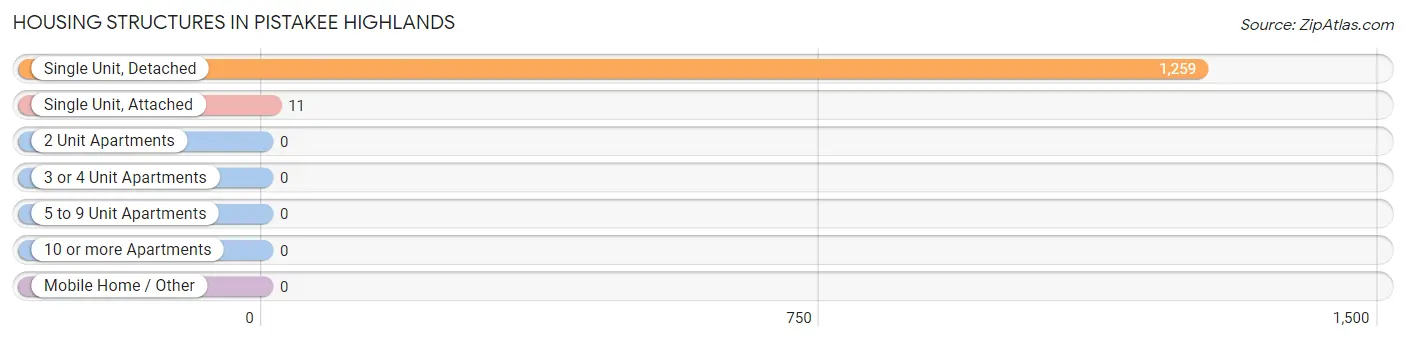
| Structure Type | # Housing Units | % Housing Units |
| Single Unit, Detached | 1,259 | 99.1% |
| Single Unit, Attached | 11 | 0.9% |
| 2 Unit Apartments | 0 | 0.0% |
| 3 or 4 Unit Apartments | 0 | 0.0% |
| 5 to 9 Unit Apartments | 0 | 0.0% |
| 10 or more Apartments | 0 | 0.0% |
| Mobile Home / Other | 0 | 0.0% |
| Total | 1,270 | 100.0% |
Housing Structures by Occupancy in Pistakee Highlands
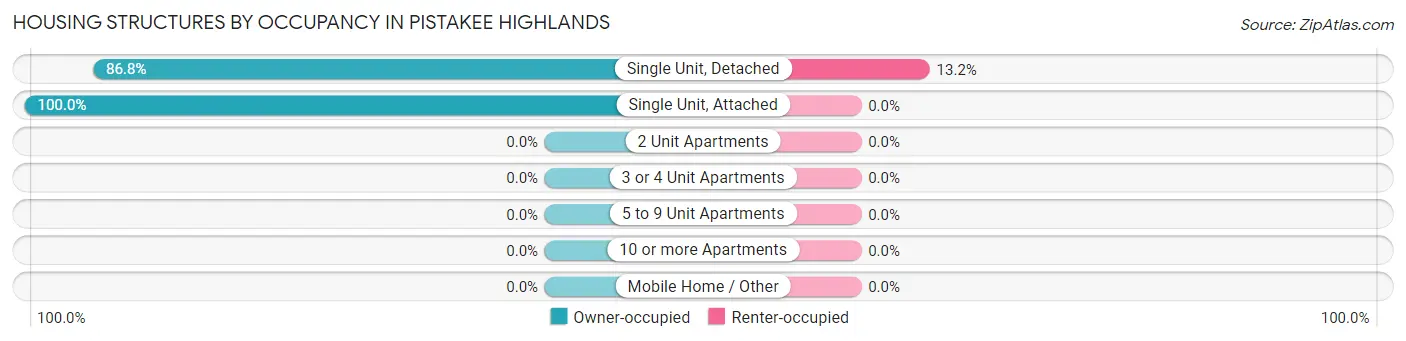
| Structure Type | Owner-occupied | Renter-occupied |
| Single Unit, Detached | 1,093 (86.8%) | 166 (13.2%) |
| Single Unit, Attached | 11 (100.0%) | 0 (0.0%) |
| 2 Unit Apartments | 0 (0.0%) | 0 (0.0%) |
| 3 or 4 Unit Apartments | 0 (0.0%) | 0 (0.0%) |
| 5 to 9 Unit Apartments | 0 (0.0%) | 0 (0.0%) |
| 10 or more Apartments | 0 (0.0%) | 0 (0.0%) |
| Mobile Home / Other | 0 (0.0%) | 0 (0.0%) |
| Total | 1,104 (86.9%) | 166 (13.1%) |
Housing Structures by Number of Rooms in Pistakee Highlands
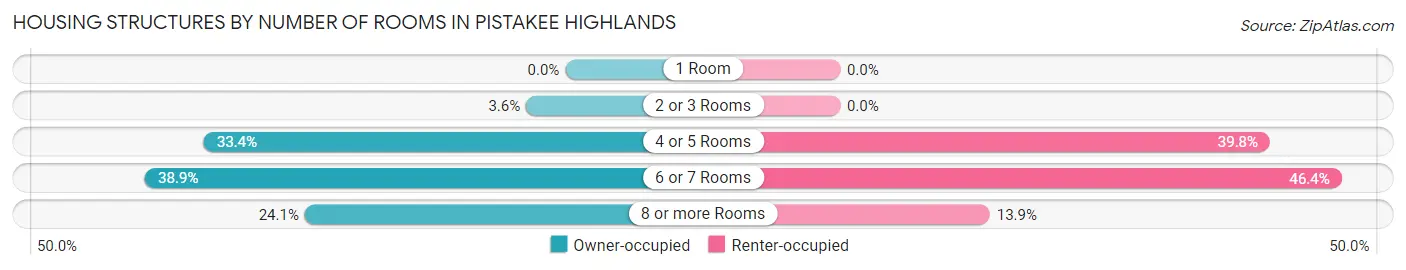
| Number of Rooms | Owner-occupied | Renter-occupied |
| 1 Room | 0 (0.0%) | 0 (0.0%) |
| 2 or 3 Rooms | 40 (3.6%) | 0 (0.0%) |
| 4 or 5 Rooms | 369 (33.4%) | 66 (39.8%) |
| 6 or 7 Rooms | 429 (38.9%) | 77 (46.4%) |
| 8 or more Rooms | 266 (24.1%) | 23 (13.9%) |
| Total | 1,104 (100.0%) | 166 (100.0%) |
Housing Structure by Heating Type in Pistakee Highlands
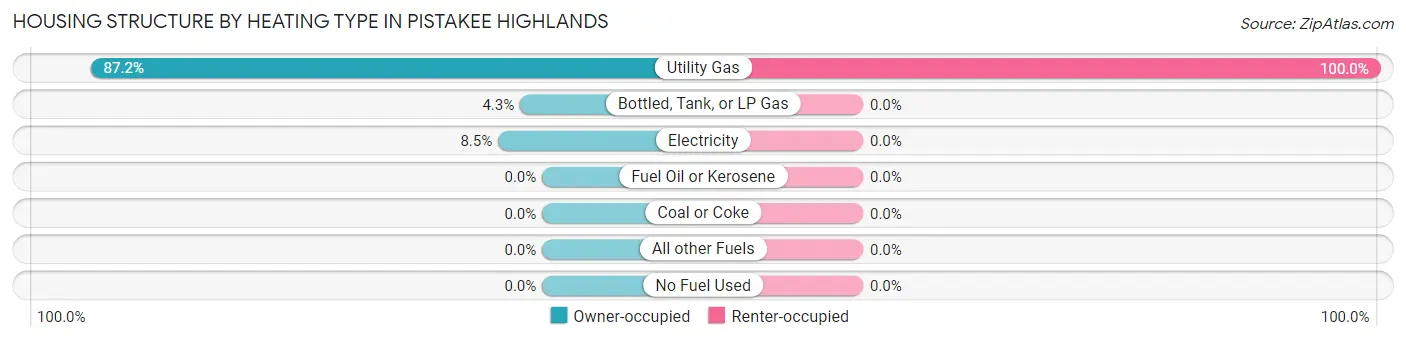
| Heating Type | Owner-occupied | Renter-occupied |
| Utility Gas | 963 (87.2%) | 166 (100.0%) |
| Bottled, Tank, or LP Gas | 47 (4.3%) | 0 (0.0%) |
| Electricity | 94 (8.5%) | 0 (0.0%) |
| Fuel Oil or Kerosene | 0 (0.0%) | 0 (0.0%) |
| Coal or Coke | 0 (0.0%) | 0 (0.0%) |
| All other Fuels | 0 (0.0%) | 0 (0.0%) |
| No Fuel Used | 0 (0.0%) | 0 (0.0%) |
| Total | 1,104 (100.0%) | 166 (100.0%) |
Household Vehicle Usage in Pistakee Highlands
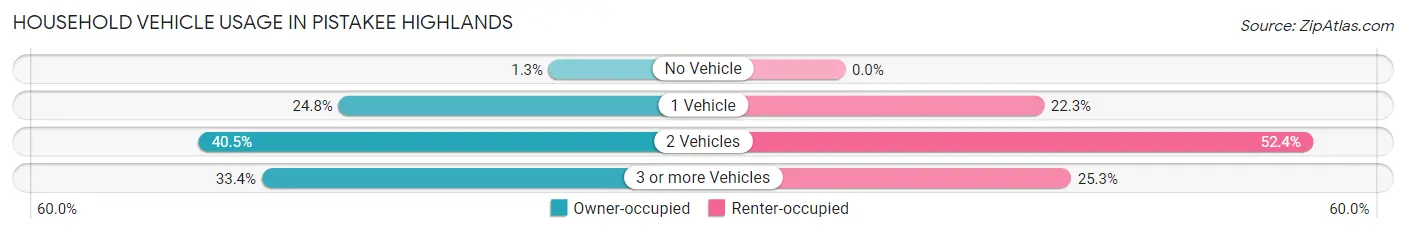
| Vehicles per Household | Owner-occupied | Renter-occupied |
| No Vehicle | 14 (1.3%) | 0 (0.0%) |
| 1 Vehicle | 274 (24.8%) | 37 (22.3%) |
| 2 Vehicles | 447 (40.5%) | 87 (52.4%) |
| 3 or more Vehicles | 369 (33.4%) | 42 (25.3%) |
| Total | 1,104 (100.0%) | 166 (100.0%) |
Real Estate & Mortgages in Pistakee Highlands
Real Estate and Mortgage Overview in Pistakee Highlands
| Characteristic | Without Mortgage | With Mortgage |
| Housing Units | 422 | 682 |
| Median Property Value | $206,000 | $186,700 |
| Median Household Income | $89,271 | $69 |
| Monthly Housing Costs | $686 | $39 |
| Real Estate Taxes | $4,591 | $19 |
Property Value by Mortgage Status in Pistakee Highlands
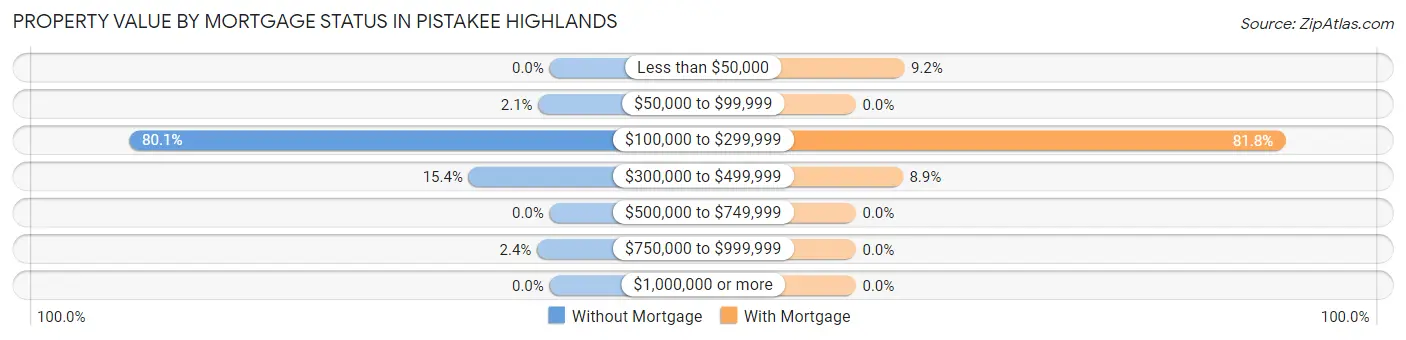
| Property Value | Without Mortgage | With Mortgage |
| Less than $50,000 | 0 (0.0%) | 63 (9.2%) |
| $50,000 to $99,999 | 9 (2.1%) | 0 (0.0%) |
| $100,000 to $299,999 | 338 (80.1%) | 558 (81.8%) |
| $300,000 to $499,999 | 65 (15.4%) | 61 (8.9%) |
| $500,000 to $749,999 | 0 (0.0%) | 0 (0.0%) |
| $750,000 to $999,999 | 10 (2.4%) | 0 (0.0%) |
| $1,000,000 or more | 0 (0.0%) | 0 (0.0%) |
| Total | 422 (100.0%) | 682 (100.0%) |
Household Income by Mortgage Status in Pistakee Highlands
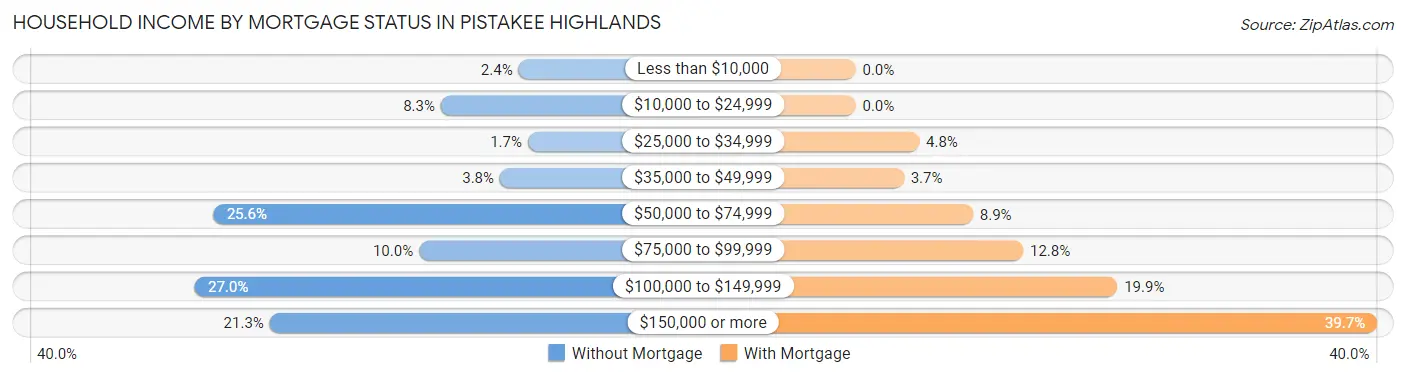
| Household Income | Without Mortgage | With Mortgage |
| Less than $10,000 | 10 (2.4%) | 0 (0.0%) |
| $10,000 to $24,999 | 35 (8.3%) | 0 (0.0%) |
| $25,000 to $34,999 | 7 (1.7%) | 33 (4.8%) |
| $35,000 to $49,999 | 16 (3.8%) | 25 (3.7%) |
| $50,000 to $74,999 | 108 (25.6%) | 61 (8.9%) |
| $75,000 to $99,999 | 42 (10.0%) | 87 (12.8%) |
| $100,000 to $149,999 | 114 (27.0%) | 136 (19.9%) |
| $150,000 or more | 90 (21.3%) | 271 (39.7%) |
| Total | 422 (100.0%) | 682 (100.0%) |
Property Value to Household Income Ratio in Pistakee Highlands
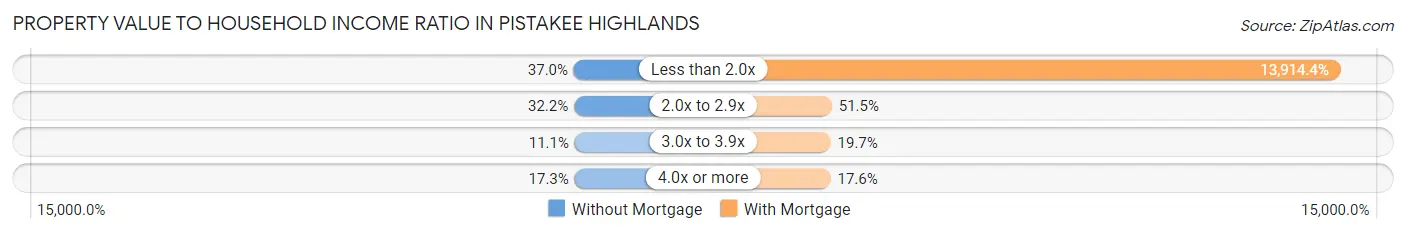
| Value-to-Income Ratio | Without Mortgage | With Mortgage |
| Less than 2.0x | 156 (37.0%) | 94,896 (13,914.4%) |
| 2.0x to 2.9x | 136 (32.2%) | 351 (51.5%) |
| 3.0x to 3.9x | 47 (11.1%) | 134 (19.7%) |
| 4.0x or more | 73 (17.3%) | 120 (17.6%) |
| Total | 422 (100.0%) | 682 (100.0%) |
Real Estate Taxes by Mortgage Status in Pistakee Highlands
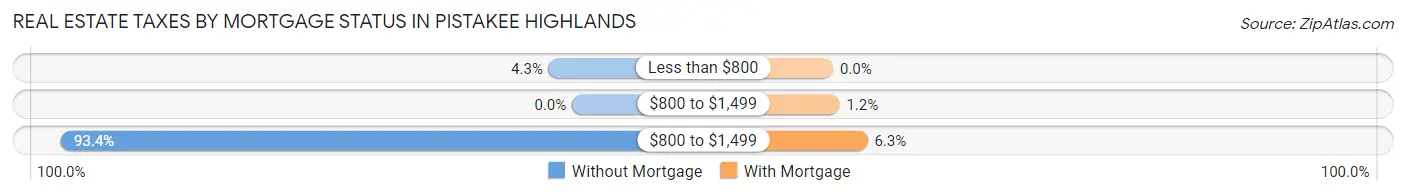
| Property Taxes | Without Mortgage | With Mortgage |
| Less than $800 | 18 (4.3%) | 0 (0.0%) |
| $800 to $1,499 | 0 (0.0%) | 8 (1.2%) |
| $800 to $1,499 | 394 (93.4%) | 43 (6.3%) |
| Total | 422 (100.0%) | 682 (100.0%) |
Health & Disability in Pistakee Highlands
Health Insurance Coverage by Age in Pistakee Highlands
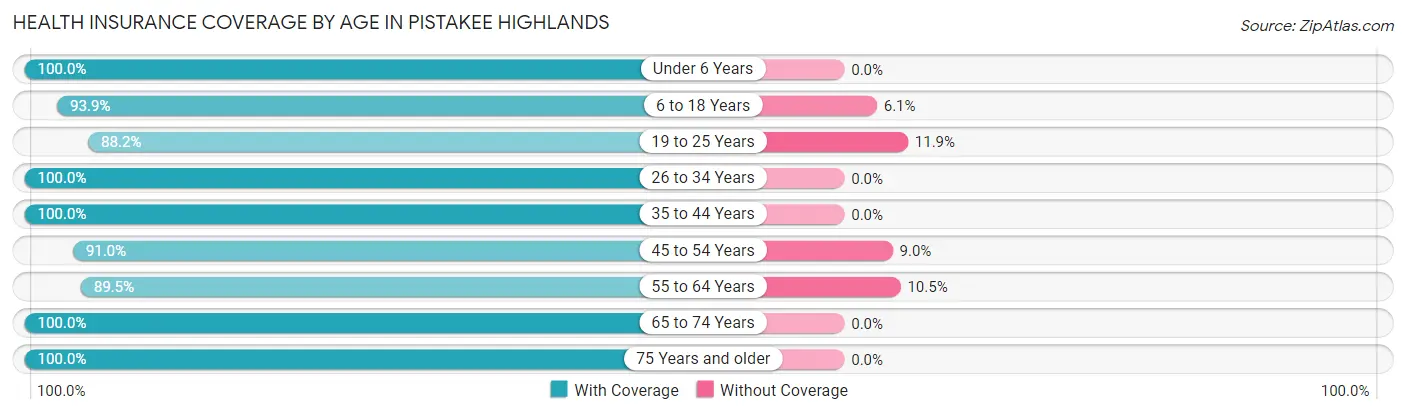
| Age Bracket | With Coverage | Without Coverage |
| Under 6 Years | 114 (100.0%) | 0 (0.0%) |
| 6 to 18 Years | 434 (93.9%) | 28 (6.1%) |
| 19 to 25 Years | 186 (88.1%) | 25 (11.8%) |
| 26 to 34 Years | 462 (100.0%) | 0 (0.0%) |
| 35 to 44 Years | 368 (100.0%) | 0 (0.0%) |
| 45 to 54 Years | 475 (91.0%) | 47 (9.0%) |
| 55 to 64 Years | 581 (89.5%) | 68 (10.5%) |
| 65 to 74 Years | 324 (100.0%) | 0 (0.0%) |
| 75 Years and older | 180 (100.0%) | 0 (0.0%) |
| Total | 3,124 (94.9%) | 168 (5.1%) |
Health Insurance Coverage by Citizenship Status in Pistakee Highlands
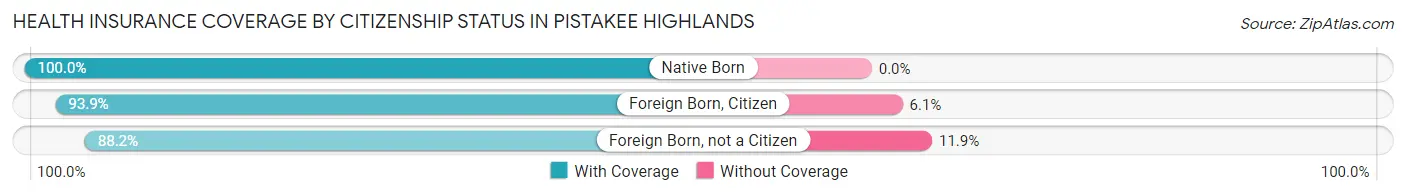
| Citizenship Status | With Coverage | Without Coverage |
| Native Born | 114 (100.0%) | 0 (0.0%) |
| Foreign Born, Citizen | 434 (93.9%) | 28 (6.1%) |
| Foreign Born, not a Citizen | 186 (88.1%) | 25 (11.8%) |
Health Insurance Coverage by Household Income in Pistakee Highlands
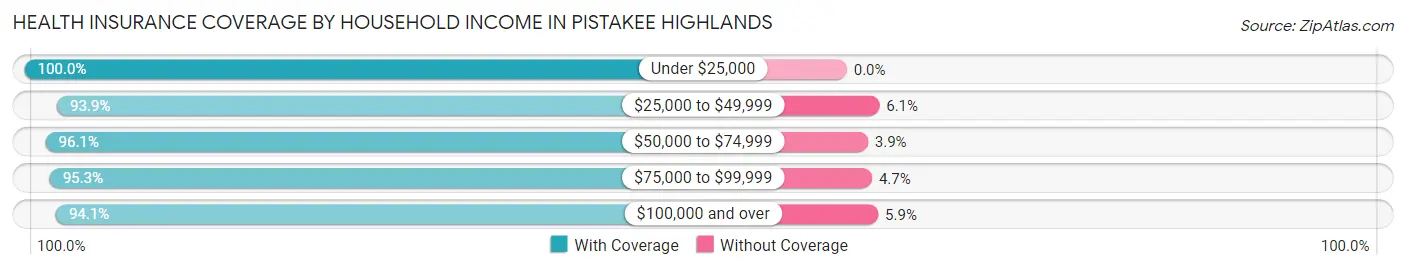
| Household Income | With Coverage | Without Coverage |
| Under $25,000 | 166 (100.0%) | 0 (0.0%) |
| $25,000 to $49,999 | 185 (93.9%) | 12 (6.1%) |
| $50,000 to $74,999 | 537 (96.1%) | 22 (3.9%) |
| $75,000 to $99,999 | 444 (95.3%) | 22 (4.7%) |
| $100,000 and over | 1,792 (94.1%) | 112 (5.9%) |
Public vs Private Health Insurance Coverage by Age in Pistakee Highlands
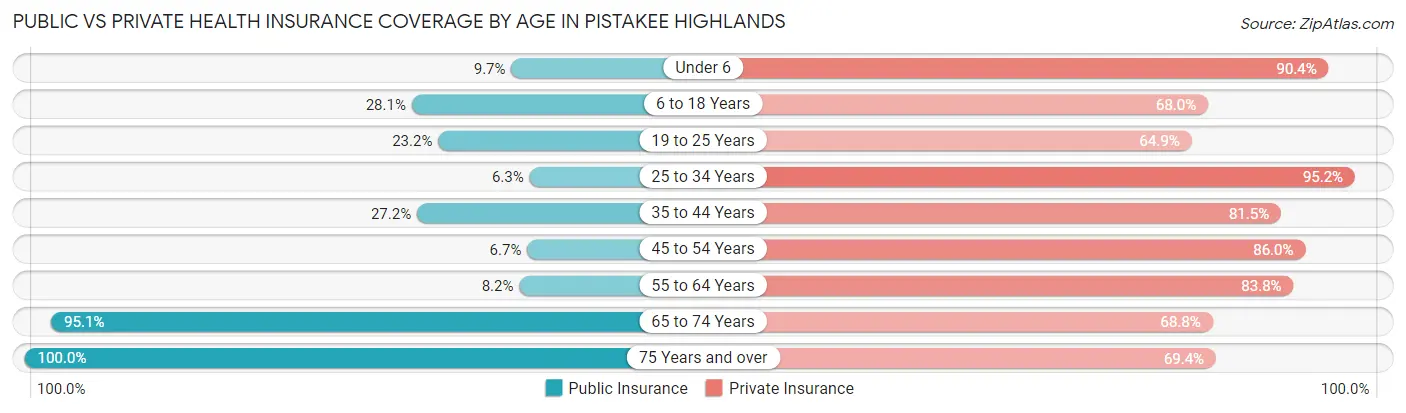
| Age Bracket | Public Insurance | Private Insurance |
| Under 6 | 11 (9.7%) | 103 (90.3%) |
| 6 to 18 Years | 130 (28.1%) | 314 (68.0%) |
| 19 to 25 Years | 49 (23.2%) | 137 (64.9%) |
| 25 to 34 Years | 29 (6.3%) | 440 (95.2%) |
| 35 to 44 Years | 100 (27.2%) | 300 (81.5%) |
| 45 to 54 Years | 35 (6.7%) | 449 (86.0%) |
| 55 to 64 Years | 53 (8.2%) | 544 (83.8%) |
| 65 to 74 Years | 308 (95.1%) | 223 (68.8%) |
| 75 Years and over | 180 (100.0%) | 125 (69.4%) |
| Total | 895 (27.2%) | 2,635 (80.0%) |
Disability Status by Sex by Age in Pistakee Highlands
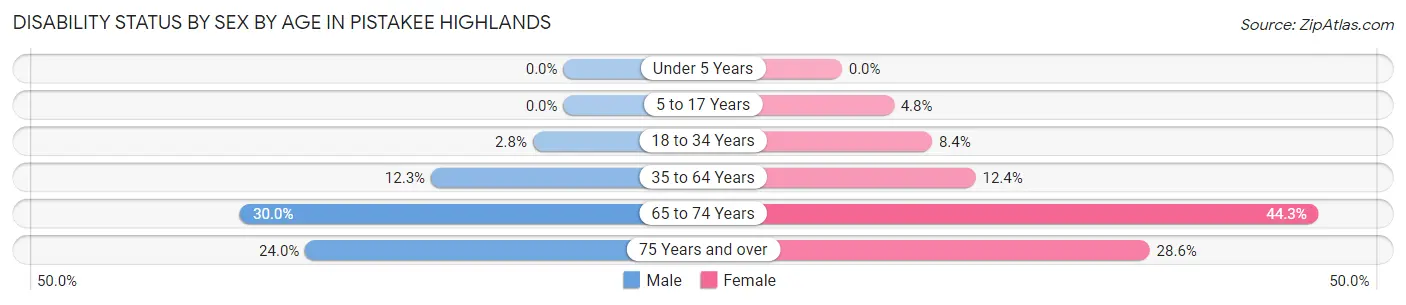
| Age Bracket | Male | Female |
| Under 5 Years | 0 (0.0%) | 0 (0.0%) |
| 5 to 17 Years | 0 (0.0%) | 11 (4.8%) |
| 18 to 34 Years | 13 (2.8%) | 20 (8.4%) |
| 35 to 64 Years | 102 (12.3%) | 88 (12.4%) |
| 65 to 74 Years | 45 (30.0%) | 77 (44.3%) |
| 75 Years and over | 23 (24.0%) | 24 (28.6%) |
Disability Class by Sex by Age in Pistakee Highlands
Disability Class: Hearing Difficulty
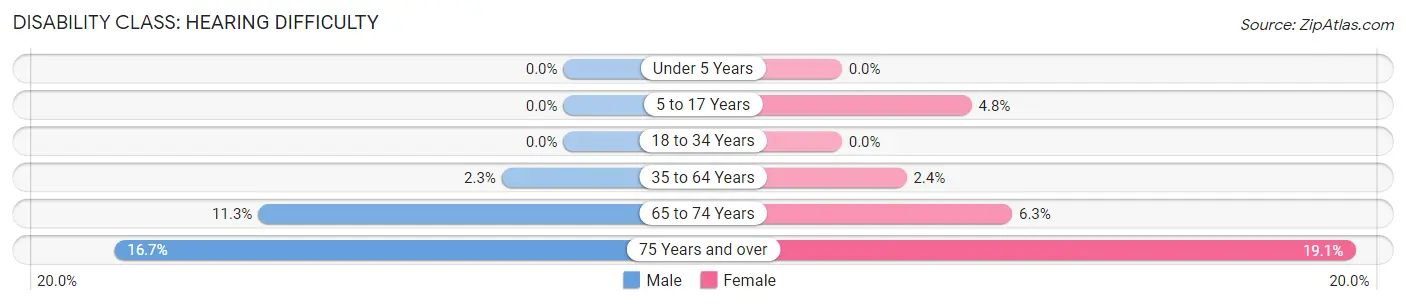
| Age Bracket | Male | Female |
| Under 5 Years | 0 (0.0%) | 0 (0.0%) |
| 5 to 17 Years | 0 (0.0%) | 11 (4.8%) |
| 18 to 34 Years | 0 (0.0%) | 0 (0.0%) |
| 35 to 64 Years | 19 (2.3%) | 17 (2.4%) |
| 65 to 74 Years | 17 (11.3%) | 11 (6.3%) |
| 75 Years and over | 16 (16.7%) | 16 (19.1%) |
Disability Class: Vision Difficulty
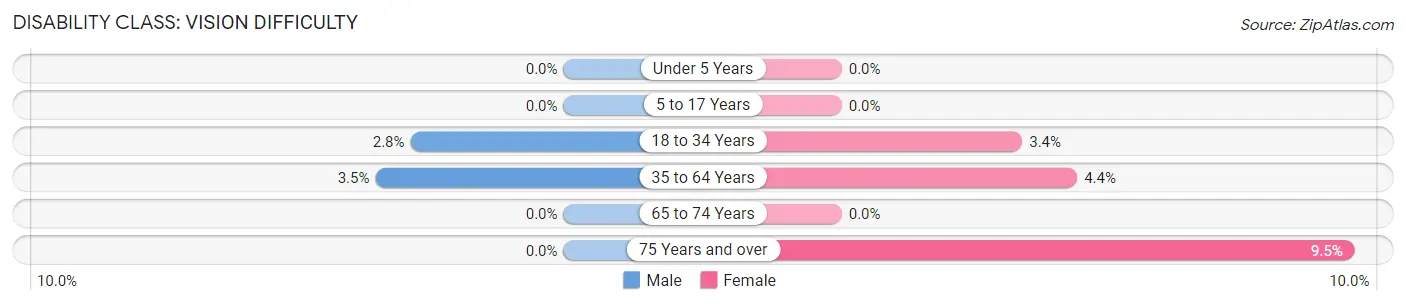
| Age Bracket | Male | Female |
| Under 5 Years | 0 (0.0%) | 0 (0.0%) |
| 5 to 17 Years | 0 (0.0%) | 0 (0.0%) |
| 18 to 34 Years | 13 (2.8%) | 8 (3.4%) |
| 35 to 64 Years | 29 (3.5%) | 31 (4.4%) |
| 65 to 74 Years | 0 (0.0%) | 0 (0.0%) |
| 75 Years and over | 0 (0.0%) | 8 (9.5%) |
Disability Class: Cognitive Difficulty
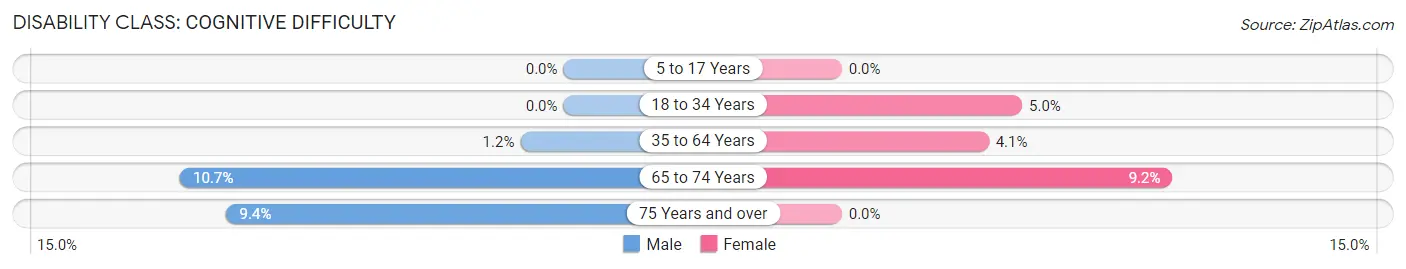
| Age Bracket | Male | Female |
| 5 to 17 Years | 0 (0.0%) | 0 (0.0%) |
| 18 to 34 Years | 0 (0.0%) | 12 (5.0%) |
| 35 to 64 Years | 10 (1.2%) | 29 (4.1%) |
| 65 to 74 Years | 16 (10.7%) | 16 (9.2%) |
| 75 Years and over | 9 (9.4%) | 0 (0.0%) |
Disability Class: Ambulatory Difficulty
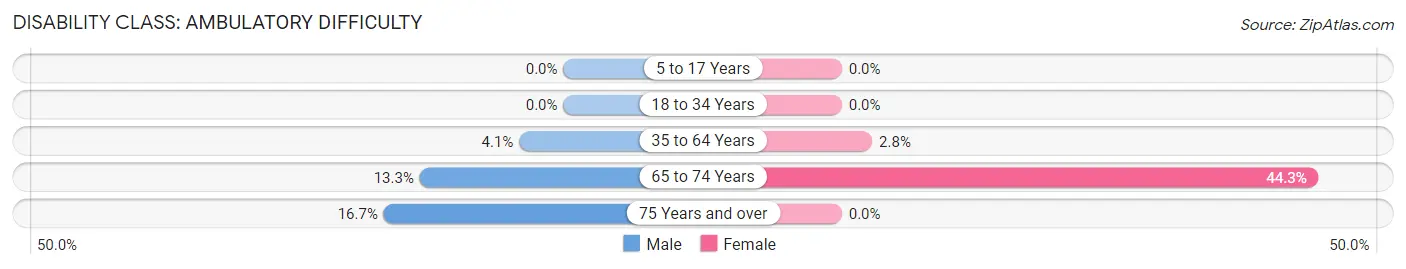
| Age Bracket | Male | Female |
| 5 to 17 Years | 0 (0.0%) | 0 (0.0%) |
| 18 to 34 Years | 0 (0.0%) | 0 (0.0%) |
| 35 to 64 Years | 34 (4.1%) | 20 (2.8%) |
| 65 to 74 Years | 20 (13.3%) | 77 (44.3%) |
| 75 Years and over | 16 (16.7%) | 0 (0.0%) |
Disability Class: Self-Care Difficulty
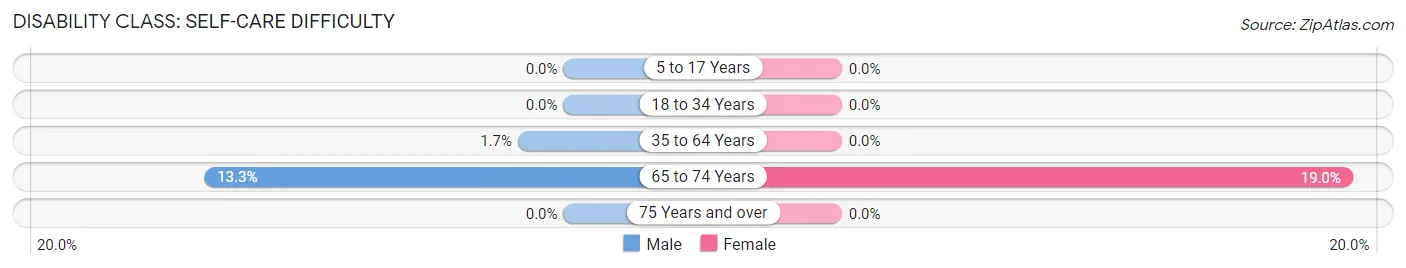
| Age Bracket | Male | Female |
| 5 to 17 Years | 0 (0.0%) | 0 (0.0%) |
| 18 to 34 Years | 0 (0.0%) | 0 (0.0%) |
| 35 to 64 Years | 14 (1.7%) | 0 (0.0%) |
| 65 to 74 Years | 20 (13.3%) | 33 (19.0%) |
| 75 Years and over | 0 (0.0%) | 0 (0.0%) |
Technology Access in Pistakee Highlands
Computing Device Access in Pistakee Highlands
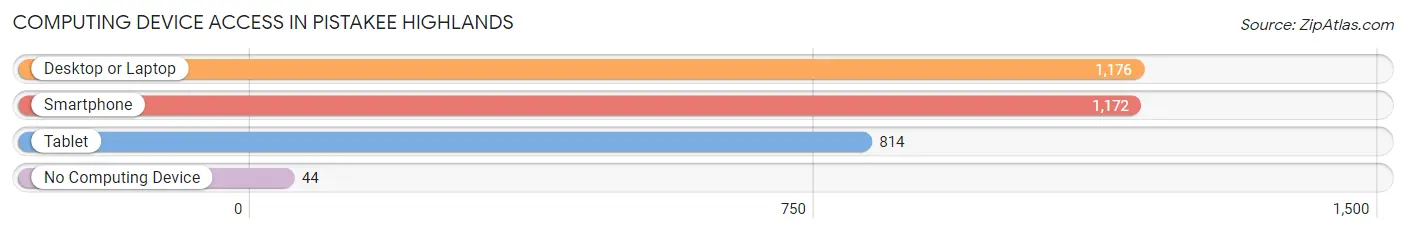
| Device Type | # Households | % Households |
| Desktop or Laptop | 1,176 | 92.6% |
| Smartphone | 1,172 | 92.3% |
| Tablet | 814 | 64.1% |
| No Computing Device | 44 | 3.5% |
| Total | 1,270 | 100.0% |
Internet Access in Pistakee Highlands
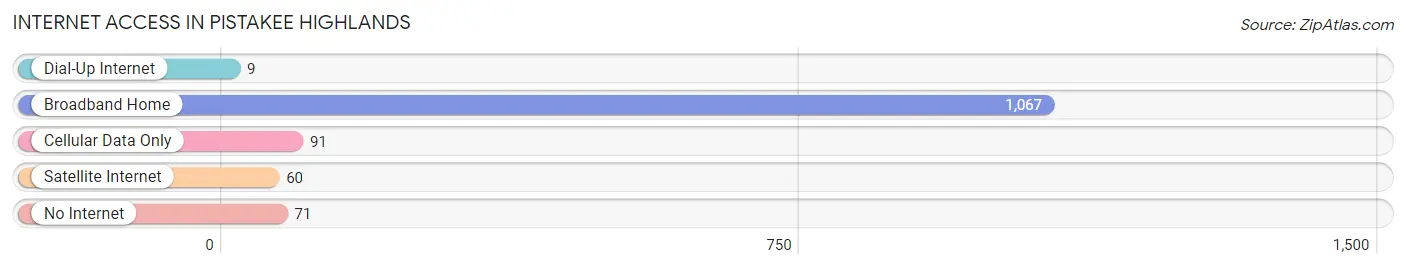
| Internet Type | # Households | % Households |
| Dial-Up Internet | 9 | 0.7% |
| Broadband Home | 1,067 | 84.0% |
| Cellular Data Only | 91 | 7.2% |
| Satellite Internet | 60 | 4.7% |
| No Internet | 71 | 5.6% |
| Total | 1,270 | 100.0% |
Pistakee Highlands Summary
Pistakee Highlands is a small unincorporated community located in McHenry County, Illinois. It is situated on the western shore of Pistakee Lake, a natural lake that is part of the Chain O' Lakes system. The community is located approximately 50 miles northwest of Chicago and is part of the Fox Lake Metropolitan Statistical Area.
History
The area that is now known as Pistakee Highlands was first settled in the early 1800s by a group of German immigrants. The area was originally known as “Pistakee”, which is derived from the Potawatomi word for “lake”. The area was primarily used for farming and fishing, and the lake was a popular spot for recreational activities.
In the late 1800s, the area began to develop as a resort community. Several hotels and resorts were built along the lake, and the area became a popular destination for vacationers. The area was also home to several amusement parks, including the famous “Pistakee Highlands Amusement Park”, which operated from the late 1800s until the early 1900s.
In the early 1900s, the area began to develop as a residential community. Several homes were built along the lake, and the area became a popular spot for summer homes. The area was also home to several small businesses, including a general store, a post office, and a gas station.
Geography
Pistakee Highlands is located in McHenry County, Illinois. It is situated on the western shore of Pistakee Lake, a natural lake that is part of the Chain O' Lakes system. The lake is approximately 4,000 acres in size and is connected to several other lakes in the area, including Fox Lake, Grass Lake, and Nippersink Lake.
The area is primarily flat, with some rolling hills in the northern part of the community. The area is also home to several small creeks and streams, including Pistakee Creek, which flows into Pistakee Lake.
Economy
The economy of Pistakee Highlands is primarily based on tourism and recreation. The area is home to several resorts and hotels, as well as several marinas and boat rental businesses. The area is also home to several restaurants and bars, as well as several retail stores.
The area is also home to several small businesses, including a general store, a post office, and a gas station. The area is also home to several small manufacturing businesses, including a boat manufacturing company and a furniture manufacturing company.
Demographics
As of the 2010 census, the population of Pistakee Highlands was 1,845. The population is primarily white (94.3%), with a small percentage of African Americans (2.2%) and Hispanics (2.2%). The median household income is $50,938, and the median home value is $179,400.
The area is served by several public schools, including Pistakee Highlands Elementary School, Pistakee Highlands Middle School, and Pistakee Highlands High School. The area is also home to several private schools, including St. Mary's Catholic School and Pistakee Christian Academy.
Conclusion
Pistakee Highlands is a small unincorporated community located in McHenry County, Illinois. It is situated on the western shore of Pistakee Lake, a natural lake that is part of the Chain O' Lakes system. The area is primarily known for its tourism and recreation, and is home to several resorts, hotels, restaurants, and retail stores. The area is also home to several small businesses, including a general store, a post office, and a gas station. The population of Pistakee Highlands is primarily white, with a small percentage of African Americans and Hispanics. The median household income is $50,938, and the median home value is $179,400. The area is served by several public schools, as well as several private schools.
Common Questions
What is Per Capita Income in Pistakee Highlands?
Per Capita income in Pistakee Highlands is $46,951.
What is the Median Family Income in Pistakee Highlands?
Median Family Income in Pistakee Highlands is $107,953.
What is the Median Household income in Pistakee Highlands?
Median Household Income in Pistakee Highlands is $91,406.
What is Income or Wage Gap in Pistakee Highlands?
Income or Wage Gap in Pistakee Highlands is 26.7%.
Women in Pistakee Highlands earn 73.3 cents for every dollar earned by a man.
What is Inequality or Gini Index in Pistakee Highlands?
Inequality or Gini Index in Pistakee Highlands is 0.44.
What is the Total Population of Pistakee Highlands?
Total Population of Pistakee Highlands is 3,292.
What is the Total Male Population of Pistakee Highlands?
Total Male Population of Pistakee Highlands is 1,786.
What is the Total Female Population of Pistakee Highlands?
Total Female Population of Pistakee Highlands is 1,506.
What is the Ratio of Males per 100 Females in Pistakee Highlands?
There are 118.59 Males per 100 Females in Pistakee Highlands.
What is the Ratio of Females per 100 Males in Pistakee Highlands?
There are 84.32 Females per 100 Males in Pistakee Highlands.
What is the Median Population Age in Pistakee Highlands?
Median Population Age in Pistakee Highlands is 45.6 Years.
What is the Average Family Size in Pistakee Highlands
Average Family Size in Pistakee Highlands is 2.9 People.
What is the Average Household Size in Pistakee Highlands
Average Household Size in Pistakee Highlands is 2.6 People.
How Large is the Labor Force in Pistakee Highlands?
There are 2,125 People in the Labor Forcein in Pistakee Highlands.
What is the Percentage of People in the Labor Force in Pistakee Highlands?
75.4% of People are in the Labor Force in Pistakee Highlands.
What is the Unemployment Rate in Pistakee Highlands?
Unemployment Rate in Pistakee Highlands is 3.6%.