Zip Codes with the Highest Percentage of Population Taking Taxi / Cab to Work in Mchenry, IL
RELATED REPORTS & OPTIONS
Taxi / Cab
Mchenry
Compare Zip Codes
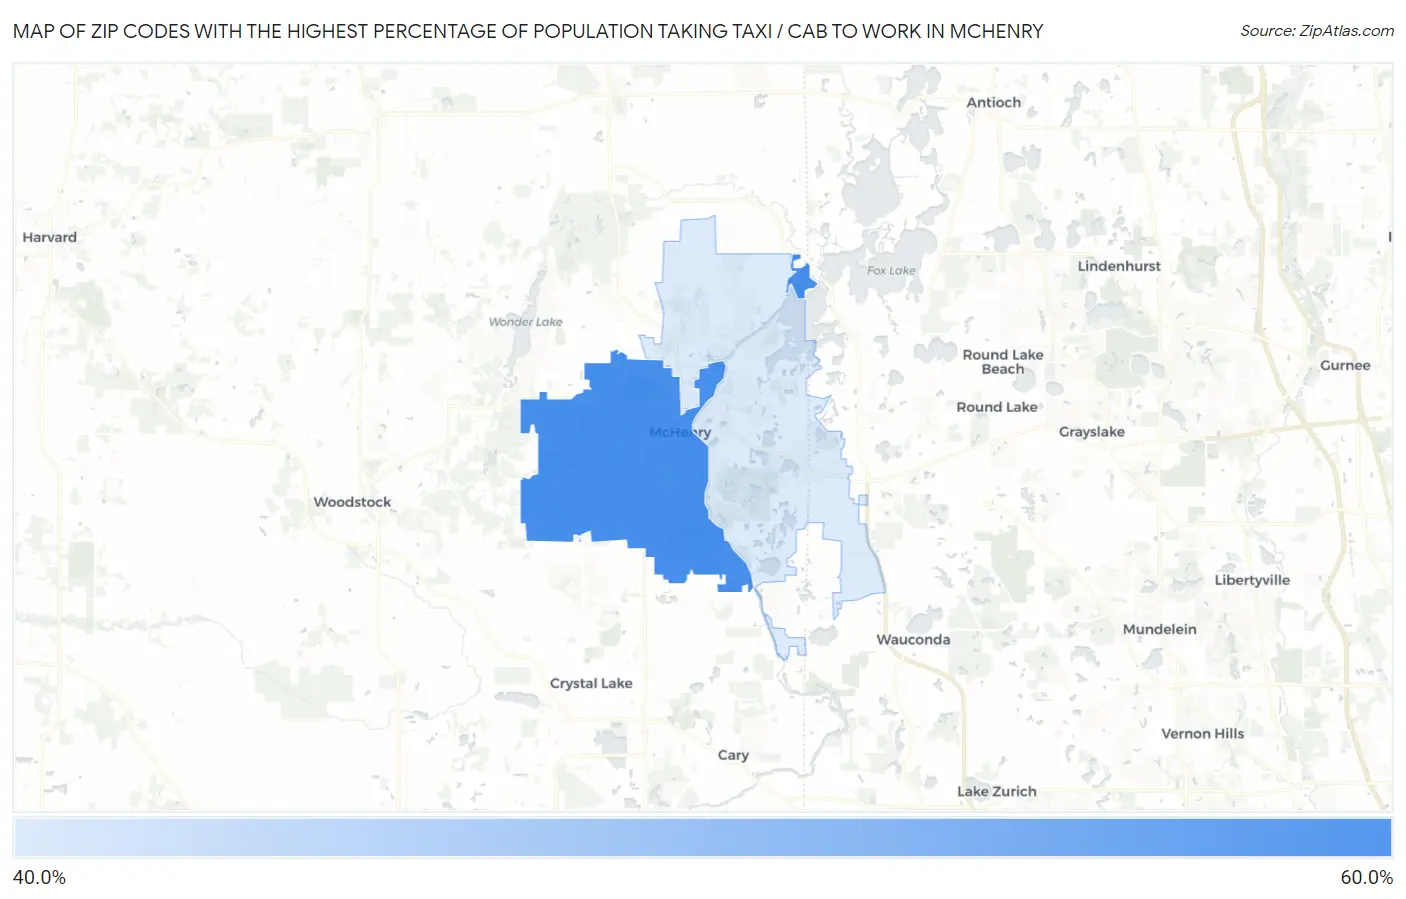
Map of Zip Codes with the Highest Percentage of Population Taking Taxi / Cab to Work in Mchenry
49.6%
51.3%
Zip Codes with the Highest Percentage of Population Taking Taxi / Cab to Work in Mchenry, IL
| Zip Code | % Take Taxi / Cab | vs State | vs National | |
| 1. | 60050 | 51.3% | 37.8%(+13.5)#102 | 38.2%(+13.1)#2,568 |
| 2. | 60051 | 49.6% | 37.8%(+11.8)#123 | 38.2%(+11.4)#3,063 |
1
Common Questions
What are the Top Zip Codes with the Highest Percentage of Population Taking Taxi / Cab to Work in Mchenry, IL?
Top Zip Codes with the Highest Percentage of Population Taking Taxi / Cab to Work in Mchenry, IL are:
What zip code has the Highest Percentage of Population Taking Taxi / Cab to Work in Mchenry, IL?
60050 has the Highest Percentage of Population Taking Taxi / Cab to Work in Mchenry, IL with 51.3%.
What is the Percentage of Population Taking Taxi / Cab to Work in Mchenry, IL?
Percentage of Population Taking Taxi / Cab to Work in Mchenry is 57.8%.
What is the Percentage of Population Taking Taxi / Cab to Work in Illinois?
Percentage of Population Taking Taxi / Cab to Work in Illinois is 37.8%.
What is the Percentage of Population Taking Taxi / Cab to Work in the United States?
Percentage of Population Taking Taxi / Cab to Work in the United States is 38.2%.