Zip Codes with the Highest Percentage of Population Taking Taxi / Cab to Work in Plainfield, IL
RELATED REPORTS & OPTIONS
Taxi / Cab
Plainfield
Compare Zip Codes
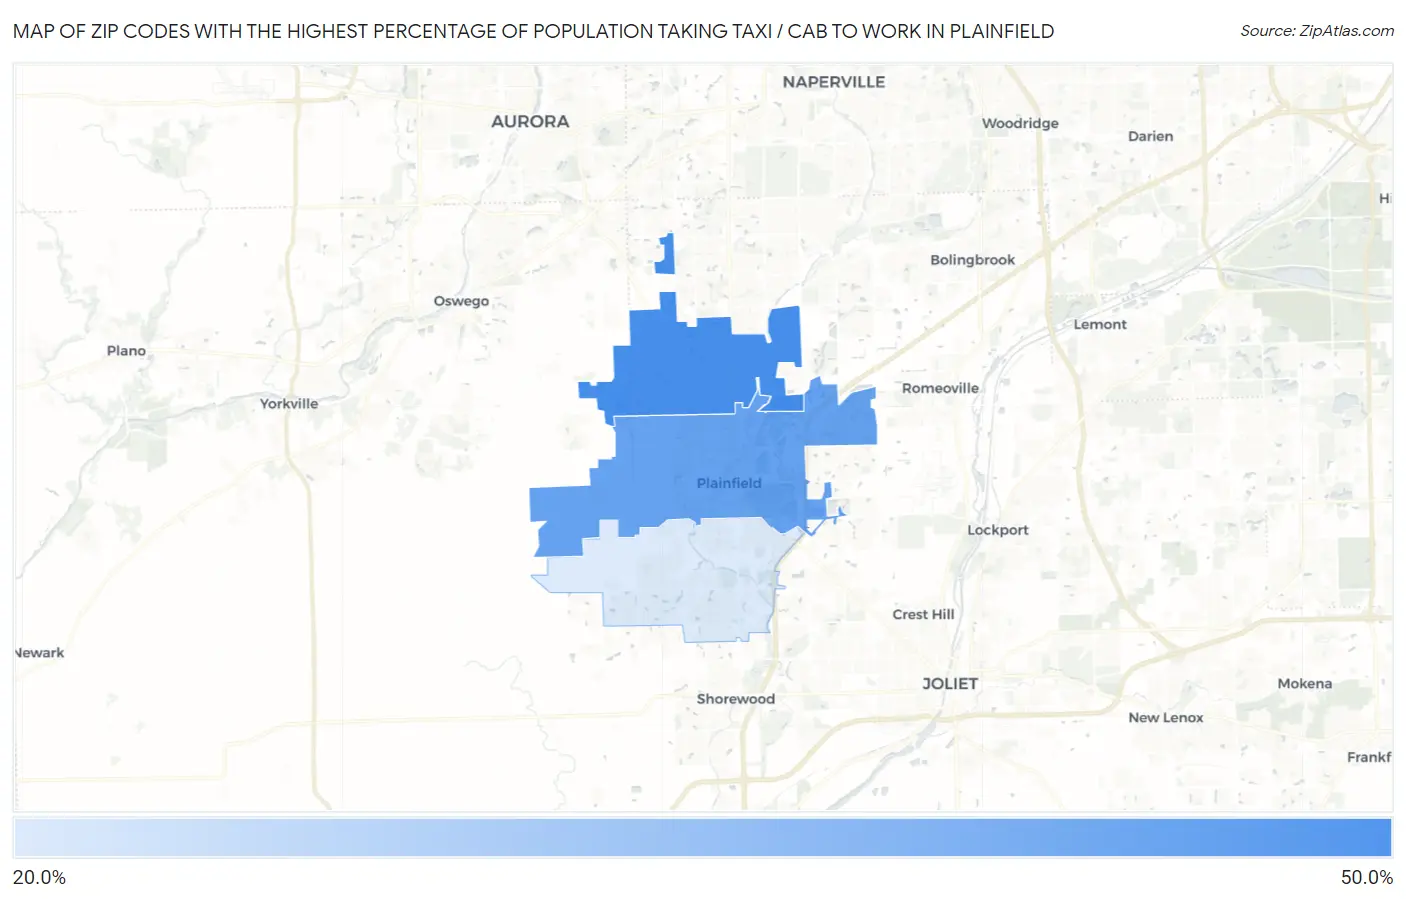
Map of Zip Codes with the Highest Percentage of Population Taking Taxi / Cab to Work in Plainfield
20.6%
43.5%
Zip Codes with the Highest Percentage of Population Taking Taxi / Cab to Work in Plainfield, IL
| Zip Code | % Take Taxi / Cab | vs State | vs National | |
| 1. | 60585 | 43.5% | 37.8%(+5.70)#213 | 38.2%(+5.30)#5,181 |
| 2. | 60544 | 38.7% | 37.8%(+0.900)#286 | 38.2%(+0.500)#7,178 |
| 3. | 60586 | 20.6% | 37.8%(-17.2)#486 | 38.2%(-17.6)#12,967 |
1
Common Questions
What are the Top Zip Codes with the Highest Percentage of Population Taking Taxi / Cab to Work in Plainfield, IL?
Top Zip Codes with the Highest Percentage of Population Taking Taxi / Cab to Work in Plainfield, IL are:
What zip code has the Highest Percentage of Population Taking Taxi / Cab to Work in Plainfield, IL?
60585 has the Highest Percentage of Population Taking Taxi / Cab to Work in Plainfield, IL with 43.5%.
What is the Percentage of Population Taking Taxi / Cab to Work in Plainfield, IL?
Percentage of Population Taking Taxi / Cab to Work in Plainfield is 42.8%.
What is the Percentage of Population Taking Taxi / Cab to Work in Illinois?
Percentage of Population Taking Taxi / Cab to Work in Illinois is 37.8%.
What is the Percentage of Population Taking Taxi / Cab to Work in the United States?
Percentage of Population Taking Taxi / Cab to Work in the United States is 38.2%.