Zip Codes with the Highest Percentage of Population Taking Taxi / Cab to Work in Glenview, IL
RELATED REPORTS & OPTIONS
Taxi / Cab
Glenview
Compare Zip Codes
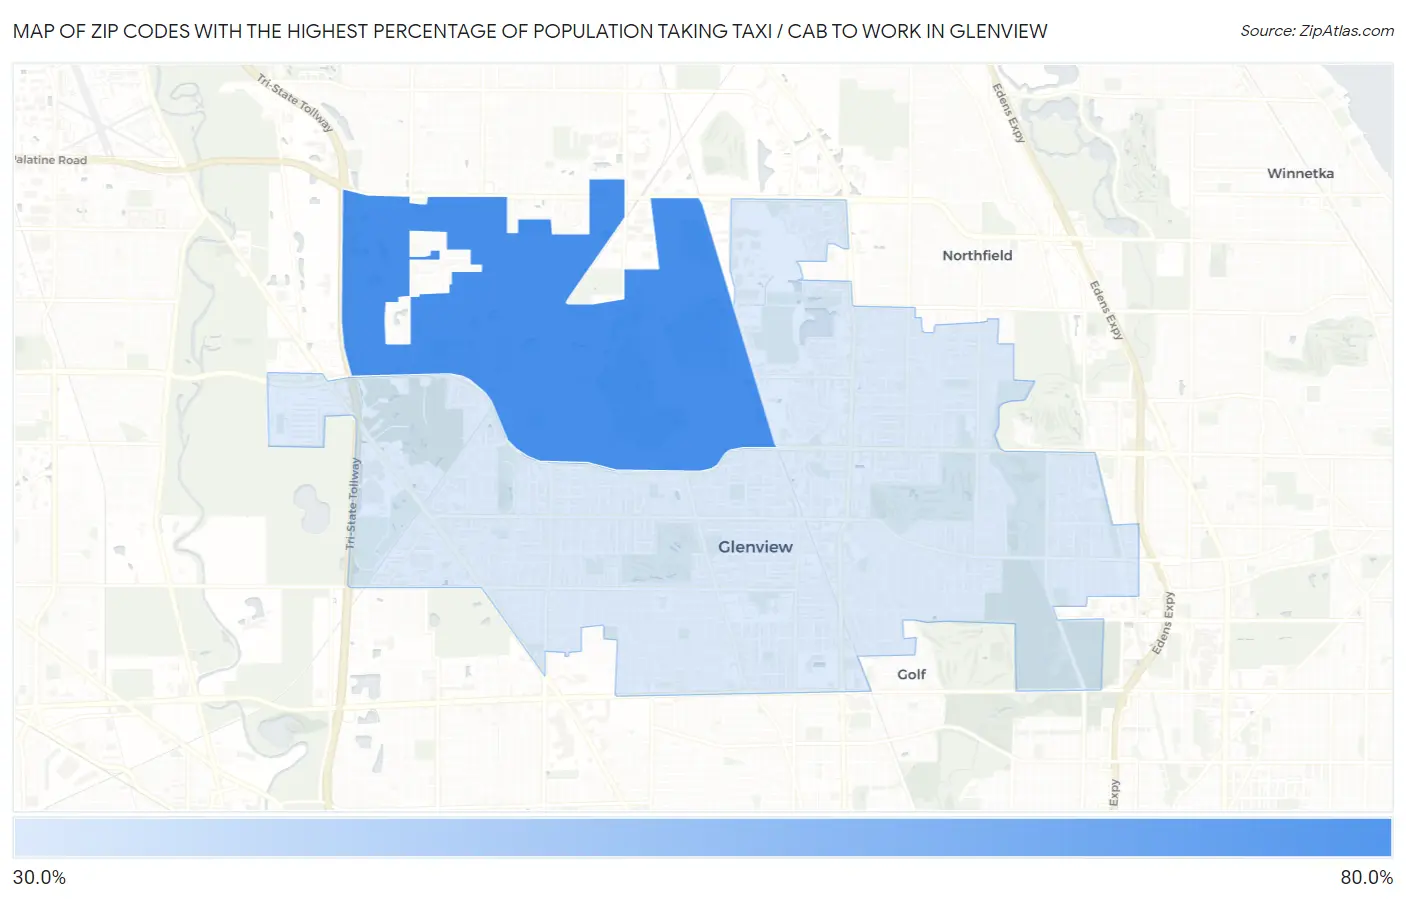
Map of Zip Codes with the Highest Percentage of Population Taking Taxi / Cab to Work in Glenview
38.0%
65.5%
Zip Codes with the Highest Percentage of Population Taking Taxi / Cab to Work in Glenview, IL
| Zip Code | % Take Taxi / Cab | vs State | vs National | |
| 1. | 60026 | 65.5% | 37.8%(+27.7)#7 | 38.2%(+27.3)#212 |
| 2. | 60025 | 38.0% | 37.8%(+0.200)#294 | 38.2%(-0.200)#7,473 |
1
Common Questions
What are the Top Zip Codes with the Highest Percentage of Population Taking Taxi / Cab to Work in Glenview, IL?
Top Zip Codes with the Highest Percentage of Population Taking Taxi / Cab to Work in Glenview, IL are:
What zip code has the Highest Percentage of Population Taking Taxi / Cab to Work in Glenview, IL?
60026 has the Highest Percentage of Population Taking Taxi / Cab to Work in Glenview, IL with 65.5%.
What is the Percentage of Population Taking Taxi / Cab to Work in Glenview, IL?
Percentage of Population Taking Taxi / Cab to Work in Glenview is 38.8%.
What is the Percentage of Population Taking Taxi / Cab to Work in Illinois?
Percentage of Population Taking Taxi / Cab to Work in Illinois is 37.8%.
What is the Percentage of Population Taking Taxi / Cab to Work in the United States?
Percentage of Population Taking Taxi / Cab to Work in the United States is 38.2%.