Zip Codes with the Highest Percentage of Population Taking Taxi / Cab to Work in Springfield, IL
RELATED REPORTS & OPTIONS
Taxi / Cab
Springfield
Compare Zip Codes
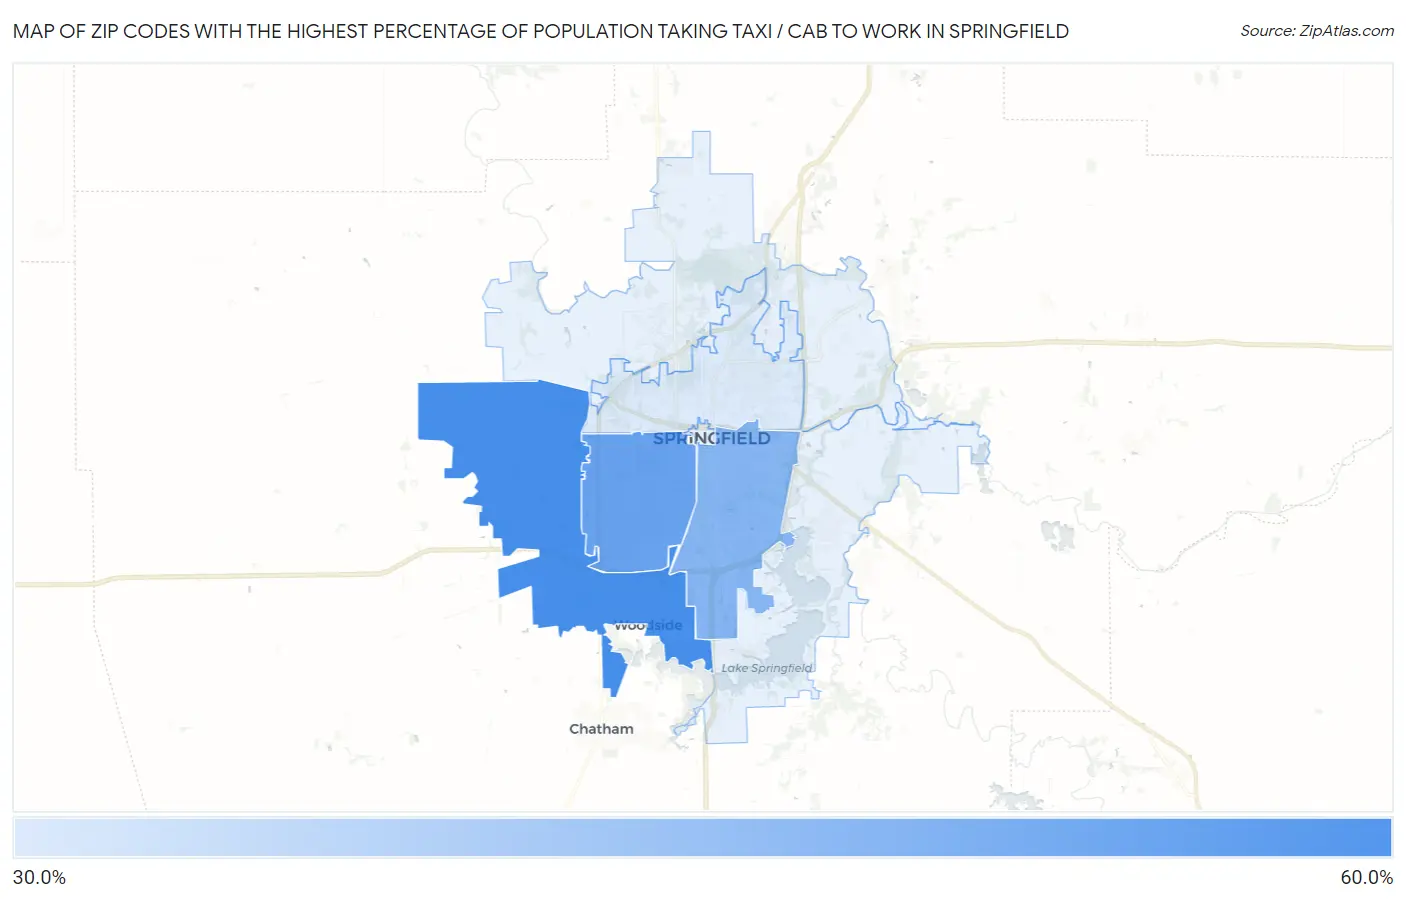
Map of Zip Codes with the Highest Percentage of Population Taking Taxi / Cab to Work in Springfield
38.2%
51.1%
Zip Codes with the Highest Percentage of Population Taking Taxi / Cab to Work in Springfield, IL
| Zip Code | % Take Taxi / Cab | vs State | vs National | |
| 1. | 62711 | 51.1% | 37.8%(+13.3)#106 | 38.2%(+12.9)#2,647 |
| 2. | 62704 | 48.3% | 37.8%(+10.5)#151 | 38.2%(+10.1)#3,490 |
| 3. | 62703 | 45.6% | 37.8%(+7.80)#187 | 38.2%(+7.40)#4,413 |
| 4. | 62702 | 38.2% | 37.8%(+0.400)#292 | 38.2%(=0.000)#7,396 |
1
Common Questions
What are the Top 5 Zip Codes with the Highest Percentage of Population Taking Taxi / Cab to Work in Springfield, IL?
Top 5 Zip Codes with the Highest Percentage of Population Taking Taxi / Cab to Work in Springfield, IL are:
What zip code has the Highest Percentage of Population Taking Taxi / Cab to Work in Springfield, IL?
62711 has the Highest Percentage of Population Taking Taxi / Cab to Work in Springfield, IL with 51.1%.
What is the Percentage of Population Taking Taxi / Cab to Work in Springfield, IL?
Percentage of Population Taking Taxi / Cab to Work in Springfield is 48.5%.
What is the Percentage of Population Taking Taxi / Cab to Work in Illinois?
Percentage of Population Taking Taxi / Cab to Work in Illinois is 37.8%.
What is the Percentage of Population Taking Taxi / Cab to Work in the United States?
Percentage of Population Taking Taxi / Cab to Work in the United States is 38.2%.