Zip Codes with the Highest Percentage of Households with Income Below $10,000 in Carbondale, IL
RELATED REPORTS & OPTIONS
Household Income | $0-10k
Carbondale
Compare Zip Codes
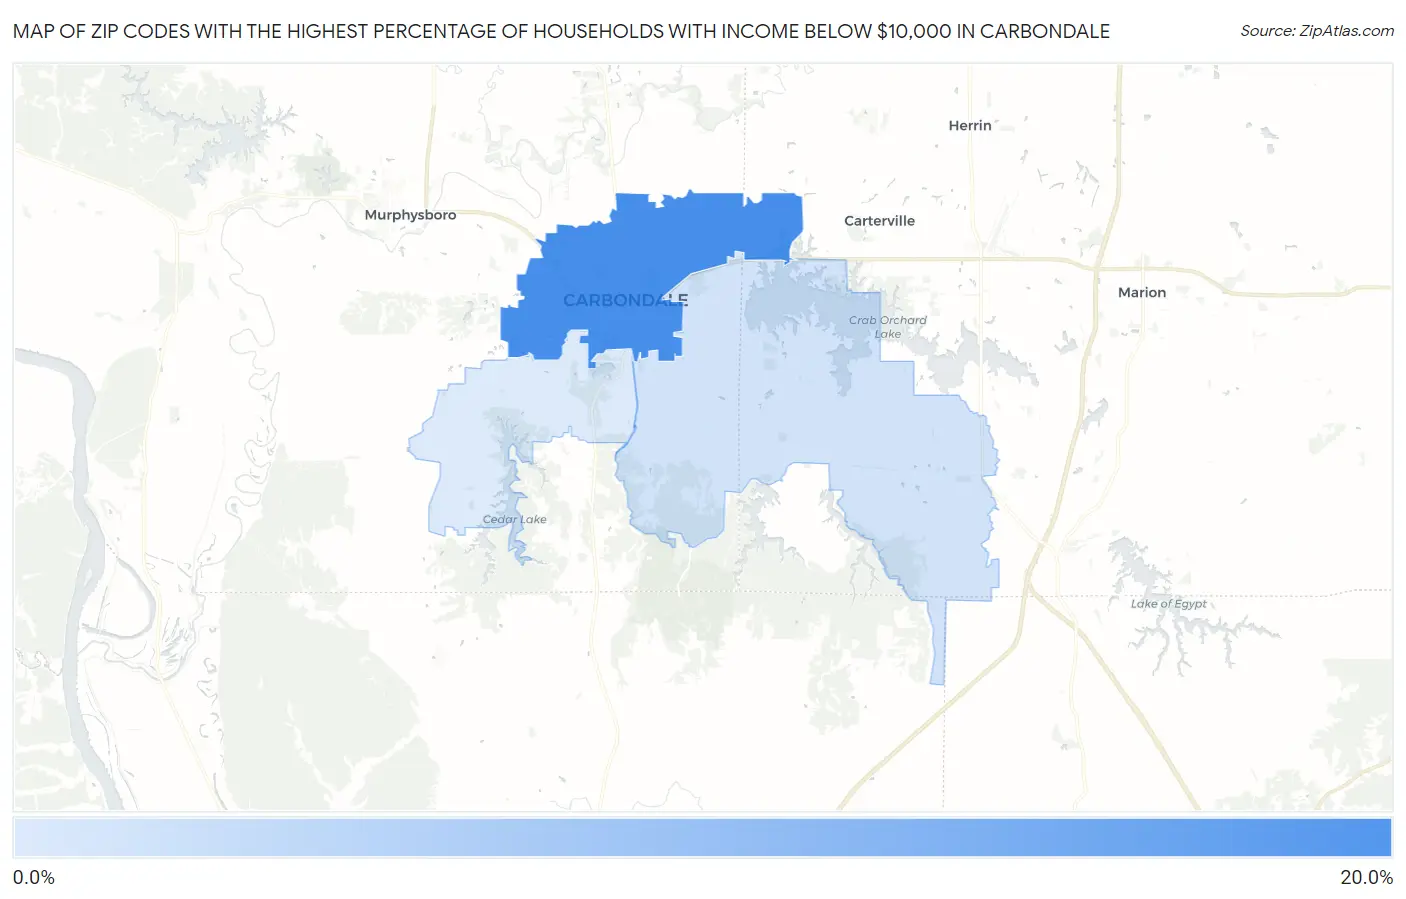
Map of Zip Codes with the Highest Percentage of Households with Income Below $10,000 in Carbondale
3.0%
18.2%
Zip Codes with the Highest Percentage of Households with Income Below $10,000 in Carbondale, IL
| Zip Code | Households with Income < $10k | vs State | vs National | |
| 1. | 62901 | 18.2% | 5.3%(+12.9)#17 | 4.9%(+13.3)#989 |
| 2. | 62902 | 4.2% | 5.3%(-1.10)#578 | 4.9%(-0.700)#14,635 |
| 3. | 62903 | 3.0% | 5.3%(-2.30)#823 | 4.9%(-1.90)#19,574 |
1
Common Questions
What are the Top Zip Codes with the Highest Percentage of Households with Income Below $10,000 in Carbondale, IL?
Top Zip Codes with the Highest Percentage of Households with Income Below $10,000 in Carbondale, IL are:
What zip code has the Highest Percentage of Households with Income Below $10,000 in Carbondale, IL?
62901 has the Highest Percentage of Households with Income Below $10,000 in Carbondale, IL with 18.2%.
What is the Percentage of Households with Income Below $10,000 in Carbondale, IL?
Percentage of Households with Income Below $10,000 in Carbondale is 18.5%.
What is the Percentage of Households with Income Below $10,000 in Illinois?
Percentage of Households with Income Below $10,000 in Illinois is 5.3%.
What is the Percentage of Households with Income Below $10,000 in the United States?
Percentage of Households with Income Below $10,000 in the United States is 4.9%.