Zip Codes with the Highest Percentage of Households with Income Below $10,000 in Illinois
RELATED REPORTS & OPTIONS
Household Income | $0-10k
Illinois
Compare Zip Codes
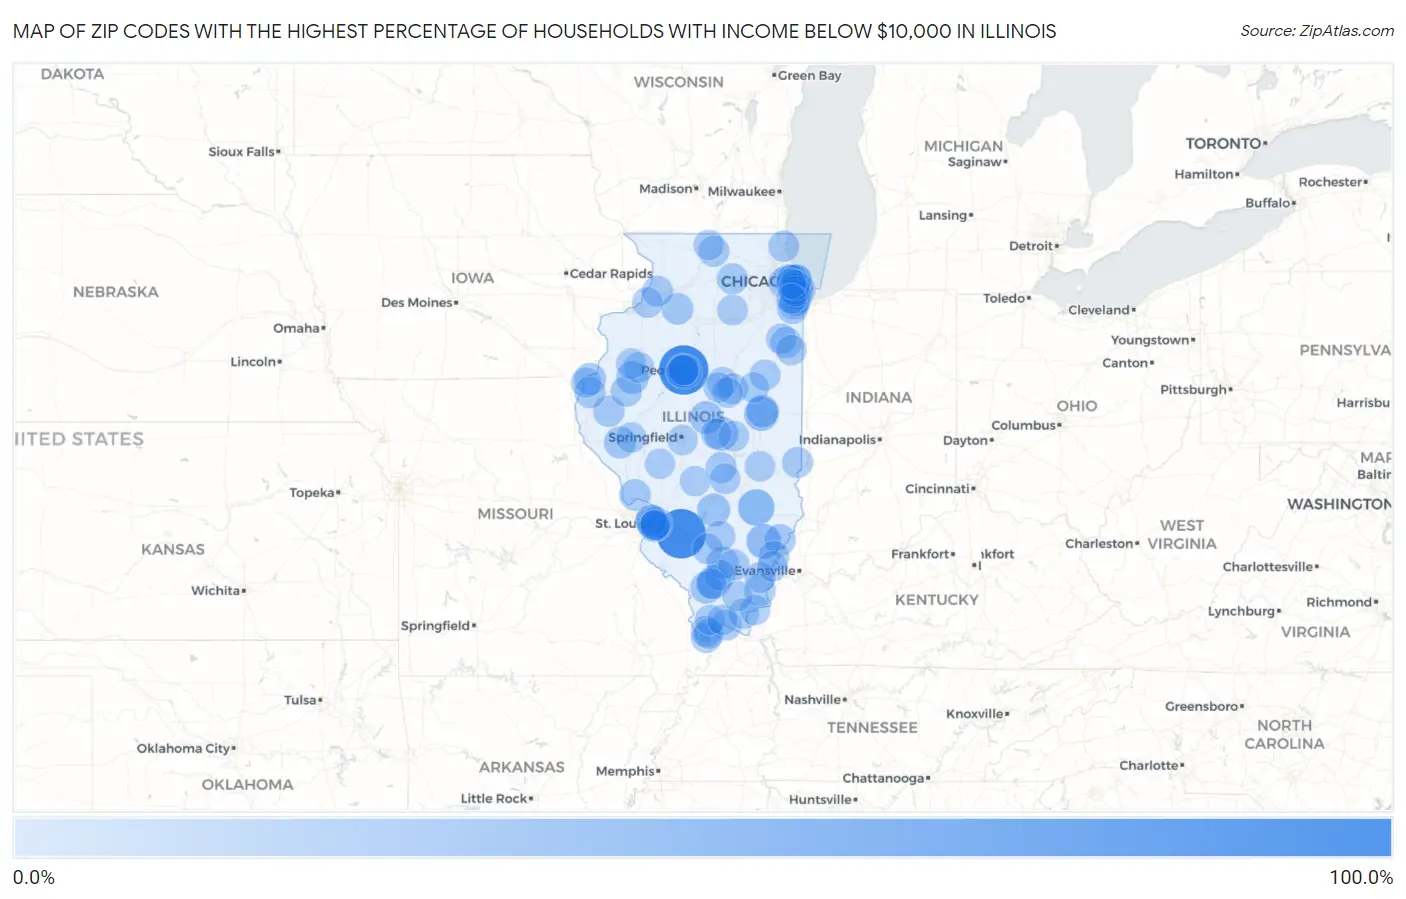
Map of Zip Codes with the Highest Percentage of Households with Income Below $10,000 in Illinois
0.0%
100.0%
Zip Codes with the Highest Percentage of Households with Income Below $10,000 in Illinois
| Zip Code | Households with Income < $10k | vs State | vs National | |
| 1. | 61625 | 100.0% | 5.3%(+94.7)#1 | 4.9%(+95.1)#12 |
| 2. | 62266 | 100.0% | 5.3%(+94.7)#2 | 4.9%(+95.1)#30 |
| 3. | 62434 | 38.1% | 5.3%(+32.8)#3 | 4.9%(+33.2)#186 |
| 4. | 61602 | 33.1% | 5.3%(+27.8)#4 | 4.9%(+28.2)#263 |
| 5. | 62843 | 29.3% | 5.3%(+24.0)#5 | 4.9%(+24.4)#343 |
| 6. | 61820 | 28.0% | 5.3%(+22.7)#6 | 4.9%(+23.1)#370 |
| 7. | 62523 | 26.7% | 5.3%(+21.4)#7 | 4.9%(+21.8)#412 |
| 8. | 62921 | 23.3% | 5.3%(+18.0)#8 | 4.9%(+18.4)#575 |
| 9. | 62892 | 22.4% | 5.3%(+17.1)#9 | 4.9%(+17.5)#613 |
| 10. | 62518 | 22.2% | 5.3%(+16.9)#10 | 4.9%(+17.3)#626 |
| 11. | 61470 | 21.1% | 5.3%(+15.8)#11 | 4.9%(+16.2)#699 |
| 12. | 61801 | 20.7% | 5.3%(+15.4)#12 | 4.9%(+15.8)#726 |
| 13. | 60827 | 20.2% | 5.3%(+14.9)#13 | 4.9%(+15.3)#780 |
| 14. | 60621 | 19.7% | 5.3%(+14.4)#14 | 4.9%(+14.8)#819 |
| 15. | 62201 | 19.4% | 5.3%(+14.1)#15 | 4.9%(+14.5)#853 |
| 16. | 61605 | 18.6% | 5.3%(+13.3)#16 | 4.9%(+13.7)#937 |
| 17. | 62901 | 18.2% | 5.3%(+12.9)#17 | 4.9%(+13.3)#989 |
| 18. | 62340 | 18.2% | 5.3%(+12.9)#18 | 4.9%(+13.3)#998 |
| 19. | 62897 | 18.1% | 5.3%(+12.8)#19 | 4.9%(+13.2)#1,016 |
| 20. | 62059 | 17.6% | 5.3%(+12.3)#20 | 4.9%(+12.7)#1,079 |
| 21. | 60604 | 17.3% | 5.3%(+12.0)#21 | 4.9%(+12.4)#1,119 |
| 22. | 62358 | 17.3% | 5.3%(+12.0)#22 | 4.9%(+12.4)#1,121 |
| 23. | 61346 | 16.7% | 5.3%(+11.4)#23 | 4.9%(+11.8)#1,226 |
| 24. | 60653 | 16.3% | 5.3%(+11.0)#24 | 4.9%(+11.4)#1,279 |
| 25. | 62954 | 16.1% | 5.3%(+10.8)#25 | 4.9%(+11.2)#1,325 |
| 26. | 62037 | 15.9% | 5.3%(+10.6)#26 | 4.9%(+11.0)#1,364 |
| 27. | 62811 | 15.9% | 5.3%(+10.6)#27 | 4.9%(+11.0)#1,369 |
| 28. | 62204 | 15.8% | 5.3%(+10.5)#28 | 4.9%(+10.9)#1,377 |
| 29. | 60637 | 15.1% | 5.3%(+9.80)#29 | 4.9%(+10.2)#1,498 |
| 30. | 62346 | 15.0% | 5.3%(+9.70)#30 | 4.9%(+10.1)#1,532 |
| 31. | 62203 | 14.8% | 5.3%(+9.50)#31 | 4.9%(+9.90)#1,569 |
| 32. | 60910 | 14.8% | 5.3%(+9.50)#32 | 4.9%(+9.90)#1,581 |
| 33. | 60644 | 14.5% | 5.3%(+9.20)#33 | 4.9%(+9.60)#1,642 |
| 34. | 62860 | 14.5% | 5.3%(+9.20)#34 | 4.9%(+9.60)#1,660 |
| 35. | 62334 | 14.5% | 5.3%(+9.20)#35 | 4.9%(+9.60)#1,662 |
| 36. | 62090 | 14.4% | 5.3%(+9.10)#36 | 4.9%(+9.50)#1,674 |
| 37. | 62207 | 14.3% | 5.3%(+9.00)#37 | 4.9%(+9.40)#1,691 |
| 38. | 61104 | 14.2% | 5.3%(+8.90)#38 | 4.9%(+9.30)#1,717 |
| 39. | 61455 | 14.1% | 5.3%(+8.80)#39 | 4.9%(+9.20)#1,741 |
| 40. | 61251 | 13.8% | 5.3%(+8.50)#40 | 4.9%(+8.90)#1,837 |
| 41. | 60064 | 13.7% | 5.3%(+8.40)#41 | 4.9%(+8.80)#1,846 |
| 42. | 60429 | 13.7% | 5.3%(+8.40)#42 | 4.9%(+8.80)#1,848 |
| 43. | 60649 | 13.6% | 5.3%(+8.30)#43 | 4.9%(+8.70)#1,870 |
| 44. | 60115 | 13.6% | 5.3%(+8.30)#44 | 4.9%(+8.70)#1,871 |
| 45. | 62423 | 13.5% | 5.3%(+8.20)#45 | 4.9%(+8.60)#1,934 |
| 46. | 62874 | 13.4% | 5.3%(+8.10)#46 | 4.9%(+8.50)#1,968 |
| 47. | 62571 | 13.2% | 5.3%(+7.90)#47 | 4.9%(+8.30)#2,015 |
| 48. | 62953 | 13.1% | 5.3%(+7.80)#48 | 4.9%(+8.20)#2,056 |
| 49. | 61761 | 13.0% | 5.3%(+7.70)#49 | 4.9%(+8.10)#2,059 |
| 50. | 60615 | 13.0% | 5.3%(+7.70)#50 | 4.9%(+8.10)#2,061 |
| 51. | 62827 | 13.0% | 5.3%(+7.70)#51 | 4.9%(+8.10)#2,088 |
| 52. | 60619 | 12.9% | 5.3%(+7.60)#52 | 4.9%(+8.00)#2,105 |
| 53. | 60155 | 12.9% | 5.3%(+7.60)#53 | 4.9%(+8.00)#2,119 |
| 54. | 62964 | 12.8% | 5.3%(+7.50)#54 | 4.9%(+7.90)#2,176 |
| 55. | 61737 | 12.8% | 5.3%(+7.50)#55 | 4.9%(+7.90)#2,182 |
| 56. | 60624 | 12.7% | 5.3%(+7.40)#56 | 4.9%(+7.80)#2,189 |
| 57. | 60612 | 12.7% | 5.3%(+7.40)#57 | 4.9%(+7.80)#2,190 |
| 58. | 61606 | 12.6% | 5.3%(+7.30)#58 | 4.9%(+7.70)#2,231 |
| 59. | 60461 | 12.4% | 5.3%(+7.10)#59 | 4.9%(+7.50)#2,302 |
| 60. | 62830 | 12.4% | 5.3%(+7.10)#60 | 4.9%(+7.50)#2,310 |
| 61. | 60549 | 12.4% | 5.3%(+7.10)#61 | 4.9%(+7.50)#2,315 |
| 62. | 60962 | 12.4% | 5.3%(+7.10)#62 | 4.9%(+7.50)#2,316 |
| 63. | 60636 | 12.3% | 5.3%(+7.00)#63 | 4.9%(+7.40)#2,327 |
| 64. | 60603 | 12.3% | 5.3%(+7.00)#64 | 4.9%(+7.40)#2,350 |
| 65. | 61257 | 12.3% | 5.3%(+7.00)#65 | 4.9%(+7.40)#2,354 |
| 66. | 62915 | 12.2% | 5.3%(+6.90)#66 | 4.9%(+7.30)#2,393 |
| 67. | 62876 | 12.2% | 5.3%(+6.90)#67 | 4.9%(+7.30)#2,400 |
| 68. | 62205 | 12.1% | 5.3%(+6.80)#68 | 4.9%(+7.20)#2,418 |
| 69. | 62914 | 12.1% | 5.3%(+6.80)#69 | 4.9%(+7.20)#2,430 |
| 70. | 61474 | 12.0% | 5.3%(+6.70)#70 | 4.9%(+7.10)#2,491 |
| 71. | 62422 | 11.7% | 5.3%(+6.40)#71 | 4.9%(+6.80)#2,604 |
| 72. | 62871 | 11.6% | 5.3%(+6.30)#72 | 4.9%(+6.70)#2,660 |
| 73. | 61936 | 11.5% | 5.3%(+6.20)#73 | 4.9%(+6.60)#2,718 |
| 74. | 62938 | 11.4% | 5.3%(+6.10)#74 | 4.9%(+6.50)#2,751 |
| 75. | 62861 | 11.4% | 5.3%(+6.10)#75 | 4.9%(+6.50)#2,778 |
| 76. | 60628 | 11.2% | 5.3%(+5.90)#76 | 4.9%(+6.30)#2,835 |
| 77. | 62522 | 11.2% | 5.3%(+5.90)#77 | 4.9%(+6.30)#2,843 |
| 78. | 60936 | 11.2% | 5.3%(+5.90)#78 | 4.9%(+6.30)#2,854 |
| 79. | 62440 | 11.2% | 5.3%(+5.90)#79 | 4.9%(+6.30)#2,868 |
| 80. | 60901 | 11.1% | 5.3%(+5.80)#80 | 4.9%(+6.20)#2,882 |
| 81. | 61736 | 11.1% | 5.3%(+5.80)#81 | 4.9%(+6.20)#2,905 |
| 82. | 61417 | 11.1% | 5.3%(+5.80)#82 | 4.9%(+6.20)#2,927 |
| 83. | 60426 | 11.0% | 5.3%(+5.70)#83 | 4.9%(+6.10)#2,950 |
| 84. | 62354 | 11.0% | 5.3%(+5.70)#84 | 4.9%(+6.10)#2,981 |
| 85. | 60620 | 10.9% | 5.3%(+5.60)#85 | 4.9%(+6.00)#2,994 |
| 86. | 60609 | 10.9% | 5.3%(+5.60)#86 | 4.9%(+6.00)#2,995 |
| 87. | 60956 | 10.9% | 5.3%(+5.60)#87 | 4.9%(+6.00)#3,050 |
| 88. | 60623 | 10.8% | 5.3%(+5.50)#88 | 4.9%(+5.90)#3,052 |
| 89. | 62703 | 10.8% | 5.3%(+5.50)#89 | 4.9%(+5.90)#3,059 |
| 90. | 62963 | 10.8% | 5.3%(+5.50)#90 | 4.9%(+5.90)#3,094 |
| 91. | 62992 | 10.8% | 5.3%(+5.50)#91 | 4.9%(+5.90)#3,098 |
| 92. | 61701 | 10.7% | 5.3%(+5.40)#92 | 4.9%(+5.80)#3,116 |
| 93. | 60472 | 10.7% | 5.3%(+5.40)#93 | 4.9%(+5.80)#3,136 |
| 94. | 62674 | 10.6% | 5.3%(+5.30)#94 | 4.9%(+5.70)#3,201 |
| 95. | 62956 | 10.6% | 5.3%(+5.30)#95 | 4.9%(+5.70)#3,203 |
| 96. | 62982 | 10.6% | 5.3%(+5.30)#96 | 4.9%(+5.70)#3,206 |
| 97. | 62665 | 10.5% | 5.3%(+5.20)#97 | 4.9%(+5.60)#3,264 |
| 98. | 61101 | 10.4% | 5.3%(+5.10)#98 | 4.9%(+5.50)#3,297 |
| 99. | 62987 | 10.4% | 5.3%(+5.10)#99 | 4.9%(+5.50)#3,331 |
| 100. | 62051 | 10.4% | 5.3%(+5.10)#100 | 4.9%(+5.50)#3,340 |
Common Questions
What are the Top 10 Zip Codes with the Highest Percentage of Households with Income Below $10,000 in Illinois?
Top 10 Zip Codes with the Highest Percentage of Households with Income Below $10,000 in Illinois are:
What zip code has the Highest Percentage of Households with Income Below $10,000 in Illinois?
61625 has the Highest Percentage of Households with Income Below $10,000 in Illinois with 100.0%.
What is the Percentage of Households with Income Below $10,000 in the State of Illinois?
Percentage of Households with Income Below $10,000 in Illinois is 5.3%.
What is the Percentage of Households with Income Below $10,000 in the United States?
Percentage of Households with Income Below $10,000 in the United States is 4.9%.