Big Bass Lake, PA Map & Demographics
Big Bass Lake Map
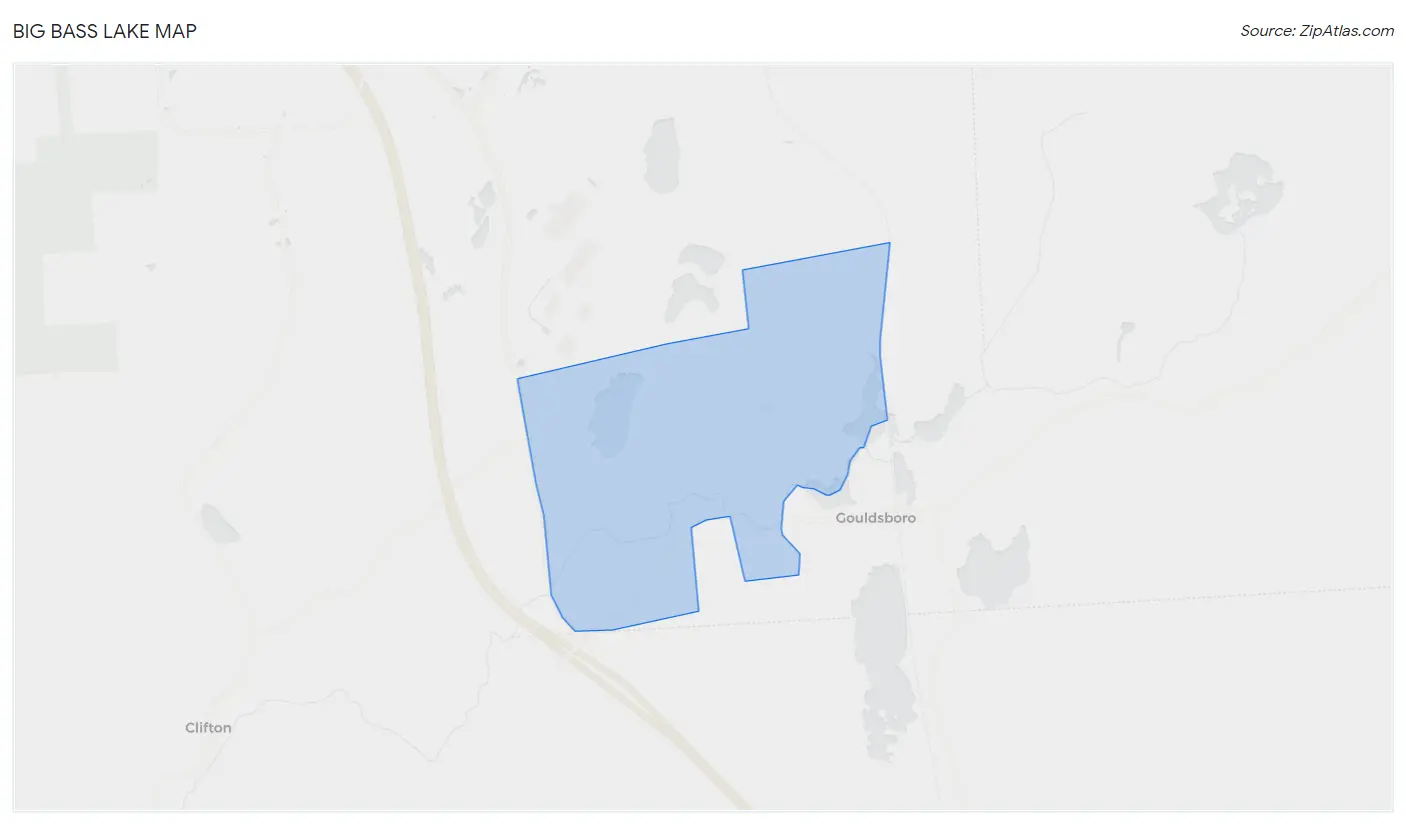
Big Bass Lake Overview
$32,170
PER CAPITA INCOME
$68,750
AVG FAMILY INCOME
$52,463
AVG HOUSEHOLD INCOME
11.0%
WAGE / INCOME GAP [ % ]
89.0¢/ $1
WAGE / INCOME GAP [ $ ]
0.39
INEQUALITY / GINI INDEX
1,420
TOTAL POPULATION
658
MALE POPULATION
762
FEMALE POPULATION
86.35
MALES / 100 FEMALES
115.81
FEMALES / 100 MALES
50.8
MEDIAN AGE
3.1
AVG FAMILY SIZE
2.6
AVG HOUSEHOLD SIZE
746
LABOR FORCE [ PEOPLE ]
62.5%
PERCENT IN LABOR FORCE
3.5%
UNEMPLOYMENT RATE
Income in Big Bass Lake
Income Overview in Big Bass Lake
Per Capita Income in Big Bass Lake is $32,170, while median incomes of families and households are $68,750 and $52,463 respectively.
| Characteristic | Number | Measure |
| Per Capita Income | 1,420 | $32,170 |
| Median Family Income | 400 | $68,750 |
| Mean Family Income | 400 | $86,641 |
| Median Household Income | 546 | $52,463 |
| Mean Household Income | 546 | $75,678 |
| Income Deficit | 400 | $0 |
| Wage / Income Gap (%) | 1,420 | 10.95% |
| Wage / Income Gap ($) | 1,420 | 89.05¢ per $1 |
| Gini / Inequality Index | 1,420 | 0.39 |
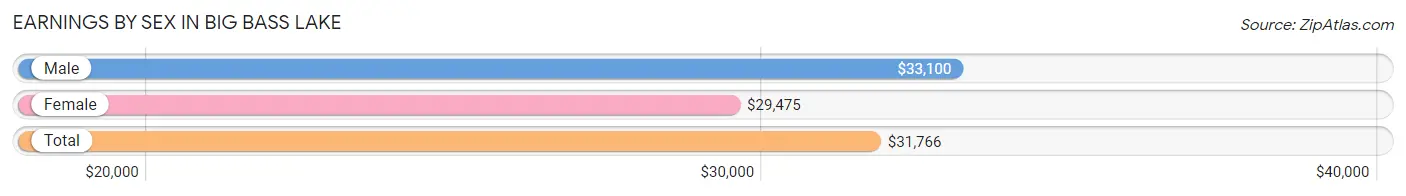
Earnings by Sex in Big Bass Lake
Average Earnings in Big Bass Lake are $31,766, $33,100 for men and $29,475 for women, a difference of 11.0%.
| Sex | Number | Average Earnings |
| Male | 376 (47.9%) | $33,100 |
| Female | 409 (52.1%) | $29,475 |
| Total | 785 (100.0%) | $31,766 |
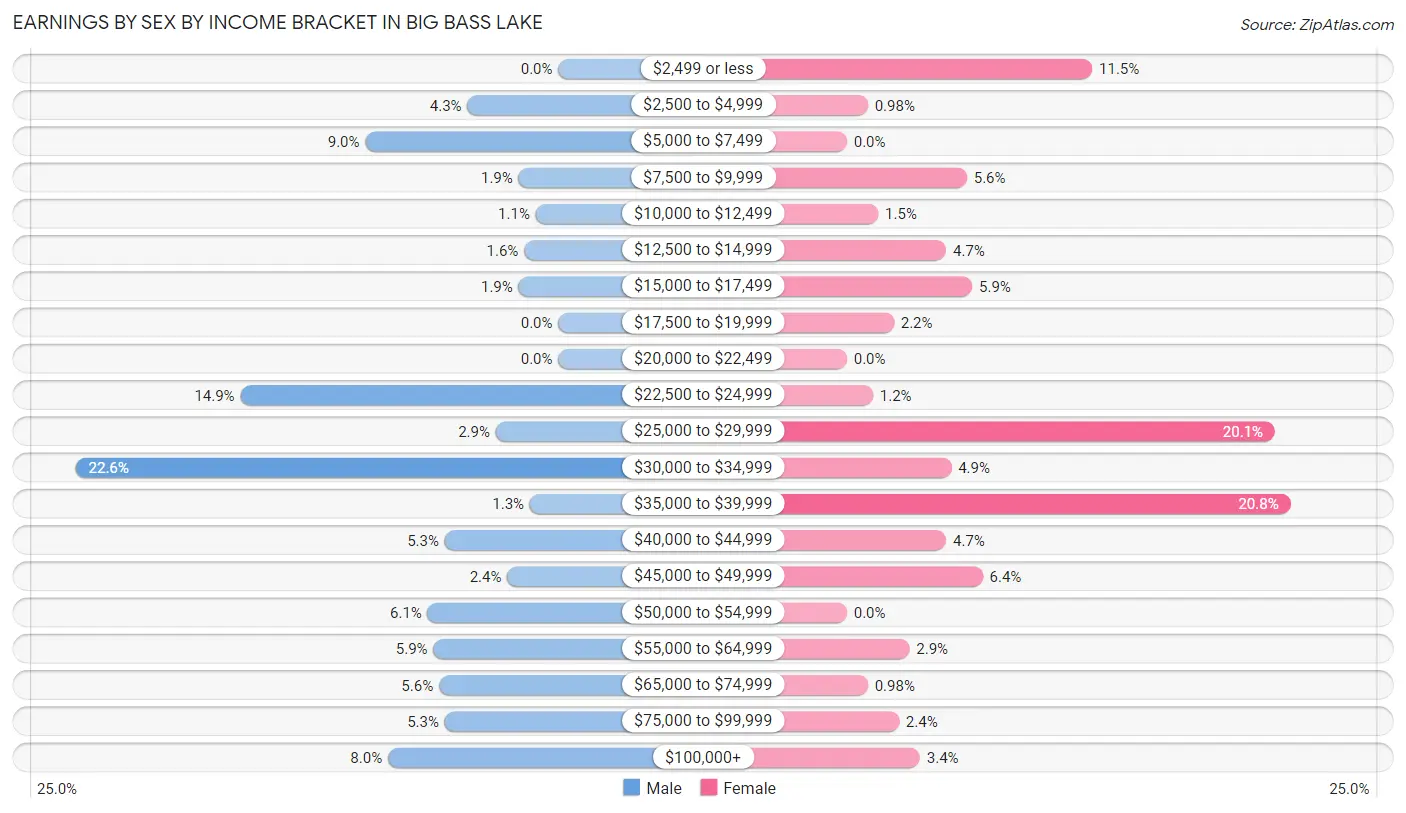
Earnings by Sex by Income Bracket in Big Bass Lake
The most common earnings brackets in Big Bass Lake are $30,000 to $34,999 for men (85 | 22.6%) and $35,000 to $39,999 for women (85 | 20.8%).
| Income | Male | Female |
| $2,499 or less | 0 (0.0%) | 47 (11.5%) |
| $2,500 to $4,999 | 16 (4.3%) | 4 (1.0%) |
| $5,000 to $7,499 | 34 (9.0%) | 0 (0.0%) |
| $7,500 to $9,999 | 7 (1.9%) | 23 (5.6%) |
| $10,000 to $12,499 | 4 (1.1%) | 6 (1.5%) |
| $12,500 to $14,999 | 6 (1.6%) | 19 (4.6%) |
| $15,000 to $17,499 | 7 (1.9%) | 24 (5.9%) |
| $17,500 to $19,999 | 0 (0.0%) | 9 (2.2%) |
| $20,000 to $22,499 | 0 (0.0%) | 0 (0.0%) |
| $22,500 to $24,999 | 56 (14.9%) | 5 (1.2%) |
| $25,000 to $29,999 | 11 (2.9%) | 82 (20.1%) |
| $30,000 to $34,999 | 85 (22.6%) | 20 (4.9%) |
| $35,000 to $39,999 | 5 (1.3%) | 85 (20.8%) |
| $40,000 to $44,999 | 20 (5.3%) | 19 (4.6%) |
| $45,000 to $49,999 | 9 (2.4%) | 26 (6.4%) |
| $50,000 to $54,999 | 23 (6.1%) | 0 (0.0%) |
| $55,000 to $64,999 | 22 (5.9%) | 12 (2.9%) |
| $65,000 to $74,999 | 21 (5.6%) | 4 (1.0%) |
| $75,000 to $99,999 | 20 (5.3%) | 10 (2.4%) |
| $100,000+ | 30 (8.0%) | 14 (3.4%) |
| Total | 376 (100.0%) | 409 (100.0%) |
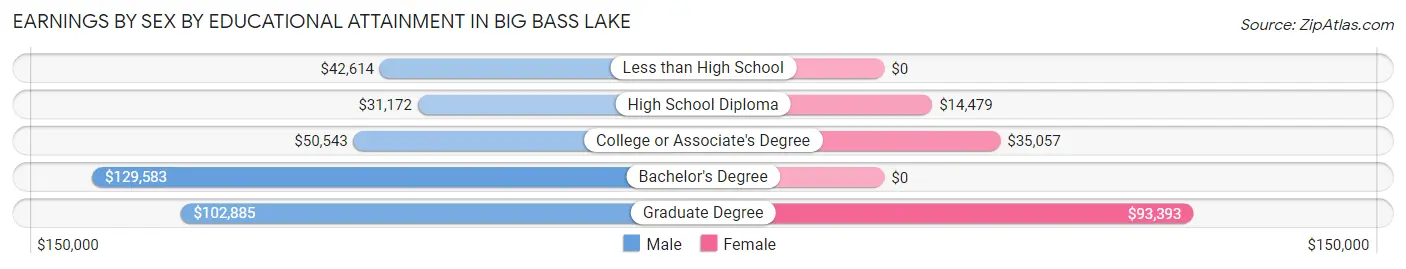
Earnings by Sex by Educational Attainment in Big Bass Lake
Average earnings in Big Bass Lake are $33,700 for men and $31,136 for women, a difference of 7.6%. Men with an educational attainment of bachelor's degree enjoy the highest average annual earnings of $129,583, while those with high school diploma education earn the least with $31,172. Women with an educational attainment of graduate degree earn the most with the average annual earnings of $93,393, while those with high school diploma education have the smallest earnings of $14,479.
| Educational Attainment | Male Income | Female Income |
| Less than High School | $42,614 | $0 |
| High School Diploma | $31,172 | $14,479 |
| College or Associate's Degree | $50,543 | $35,057 |
| Bachelor's Degree | $129,583 | $0 |
| Graduate Degree | $102,885 | $93,393 |
| Total | $33,700 | $31,136 |
Family Income in Big Bass Lake
Family Income Brackets in Big Bass Lake
According to the Big Bass Lake family income data, there are 102 families falling into the $50,000 to $74,999 income range, which is the most common income bracket and makes up 25.5% of all families.
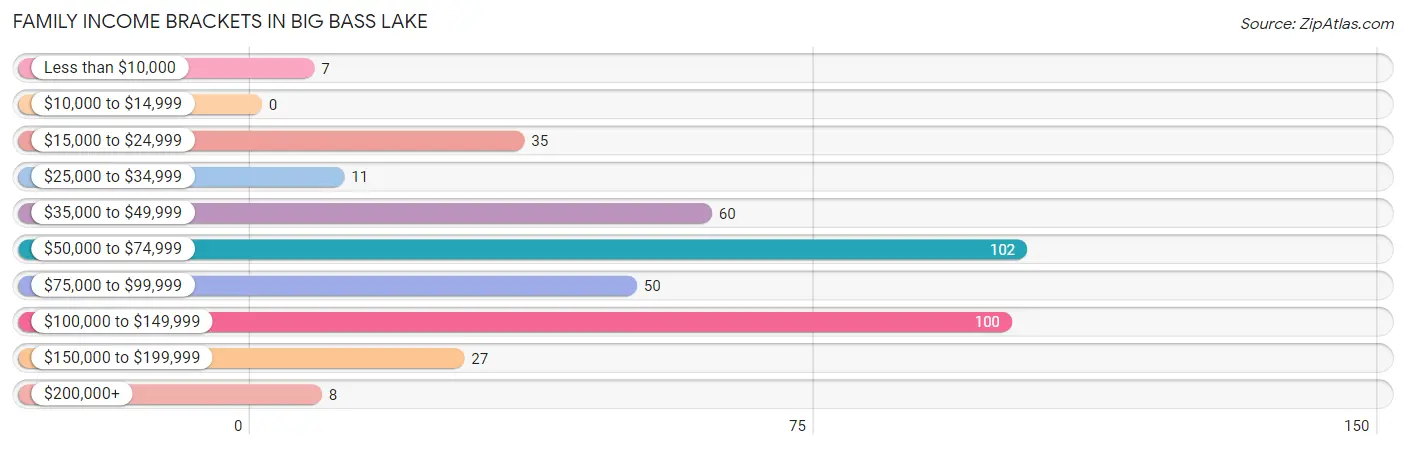
| Income Bracket | # Families | % Families |
| Less than $10,000 | 7 | 1.8% |
| $10,000 to $14,999 | 0 | 0.0% |
| $15,000 to $24,999 | 35 | 8.8% |
| $25,000 to $34,999 | 11 | 2.8% |
| $35,000 to $49,999 | 60 | 15.0% |
| $50,000 to $74,999 | 102 | 25.5% |
| $75,000 to $99,999 | 50 | 12.5% |
| $100,000 to $149,999 | 100 | 25.0% |
| $150,000 to $199,999 | 27 | 6.8% |
| $200,000+ | 8 | 2.0% |
Family Income by Famaliy Size in Big Bass Lake
5-person families (37 | 9.2%) account for the highest median family income in Big Bass Lake with $130,764 per family, while 2-person families (197 | 49.2%) have the highest median income of $29,844 per family member.
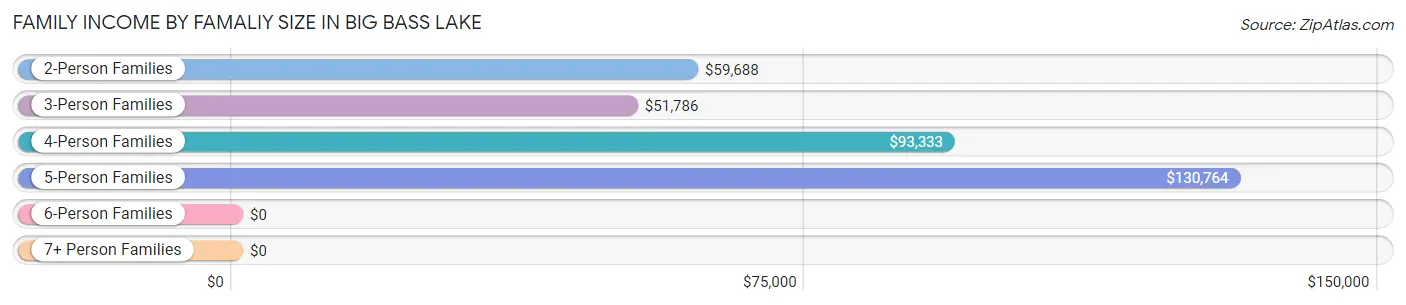
| Income Bracket | # Families | Median Income |
| 2-Person Families | 197 (49.2%) | $59,688 |
| 3-Person Families | 126 (31.5%) | $51,786 |
| 4-Person Families | 40 (10.0%) | $93,333 |
| 5-Person Families | 37 (9.2%) | $130,764 |
| 6-Person Families | 0 (0.0%) | $0 |
| 7+ Person Families | 0 (0.0%) | $0 |
| Total | 400 (100.0%) | $68,750 |
Family Income by Number of Earners in Big Bass Lake
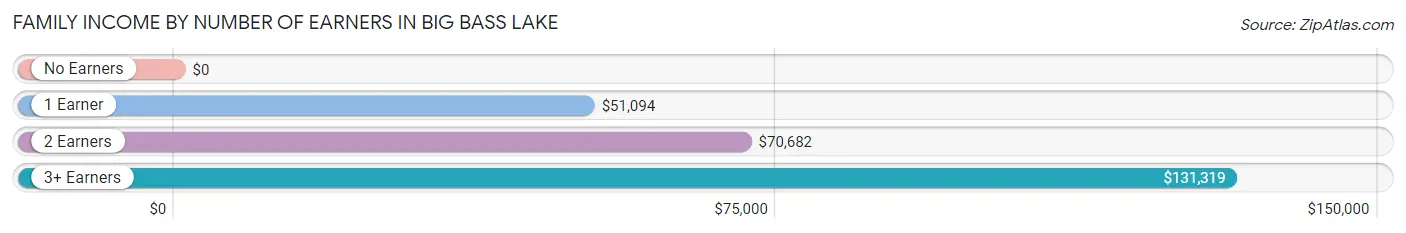
| Number of Earners | # Families | Median Income |
| No Earners | 88 (22.0%) | $0 |
| 1 Earner | 89 (22.3%) | $51,094 |
| 2 Earners | 172 (43.0%) | $70,682 |
| 3+ Earners | 51 (12.8%) | $131,319 |
| Total | 400 (100.0%) | $68,750 |
Household Income in Big Bass Lake
Household Income Brackets in Big Bass Lake
With 132 households falling in the category, the $50,000 to $74,999 income range is the most frequent in Big Bass Lake, accounting for 24.2% of all households. In contrast, only 4 households (0.7%) fall into the $10,000 to $14,999 income bracket, making it the least populous group.
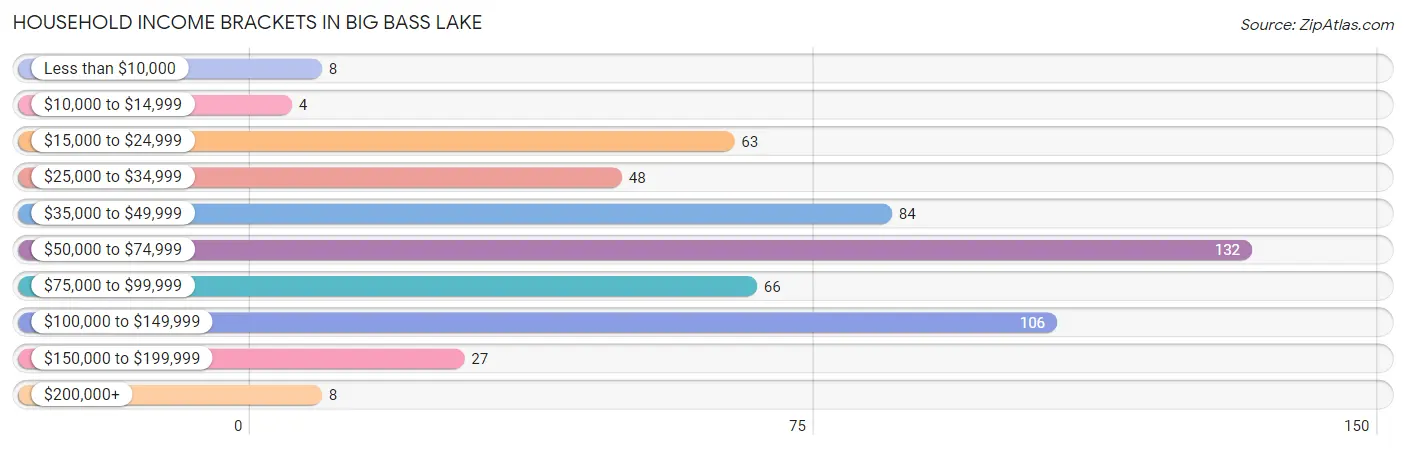
| Income Bracket | # Households | % Households |
| Less than $10,000 | 8 | 1.5% |
| $10,000 to $14,999 | 4 | 0.7% |
| $15,000 to $24,999 | 63 | 11.5% |
| $25,000 to $34,999 | 48 | 8.8% |
| $35,000 to $49,999 | 84 | 15.4% |
| $50,000 to $74,999 | 132 | 24.2% |
| $75,000 to $99,999 | 66 | 12.1% |
| $100,000 to $149,999 | 106 | 19.4% |
| $150,000 to $199,999 | 27 | 4.9% |
| $200,000+ | 8 | 1.5% |
Household Income by Householder Age in Big Bass Lake
The median household income in Big Bass Lake is $52,463, with the highest median household income of $82,250 found in the 25 to 44 years age bracket for the primary householder. A total of 43 households (7.9%) fall into this category.
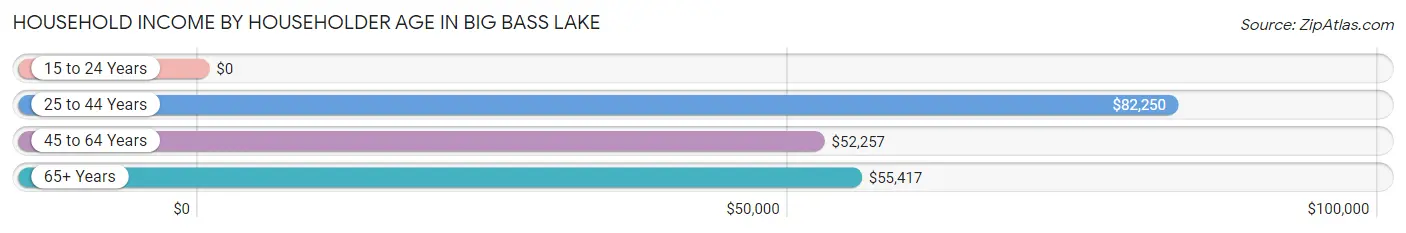
| Income Bracket | # Households | Median Income |
| 15 to 24 Years | 0 (0.0%) | $0 |
| 25 to 44 Years | 43 (7.9%) | $82,250 |
| 45 to 64 Years | 305 (55.9%) | $52,257 |
| 65+ Years | 198 (36.3%) | $55,417 |
| Total | 546 (100.0%) | $52,463 |
Poverty in Big Bass Lake
Income Below Poverty by Sex and Age in Big Bass Lake
With 6.2% poverty level for males and 8.0% for females among the residents of Big Bass Lake, 75 year old and over males and under 5 year old females are the most vulnerable to poverty, with 12 males (35.3%) and 5 females (100.0%) in their respective age groups living below the poverty level.
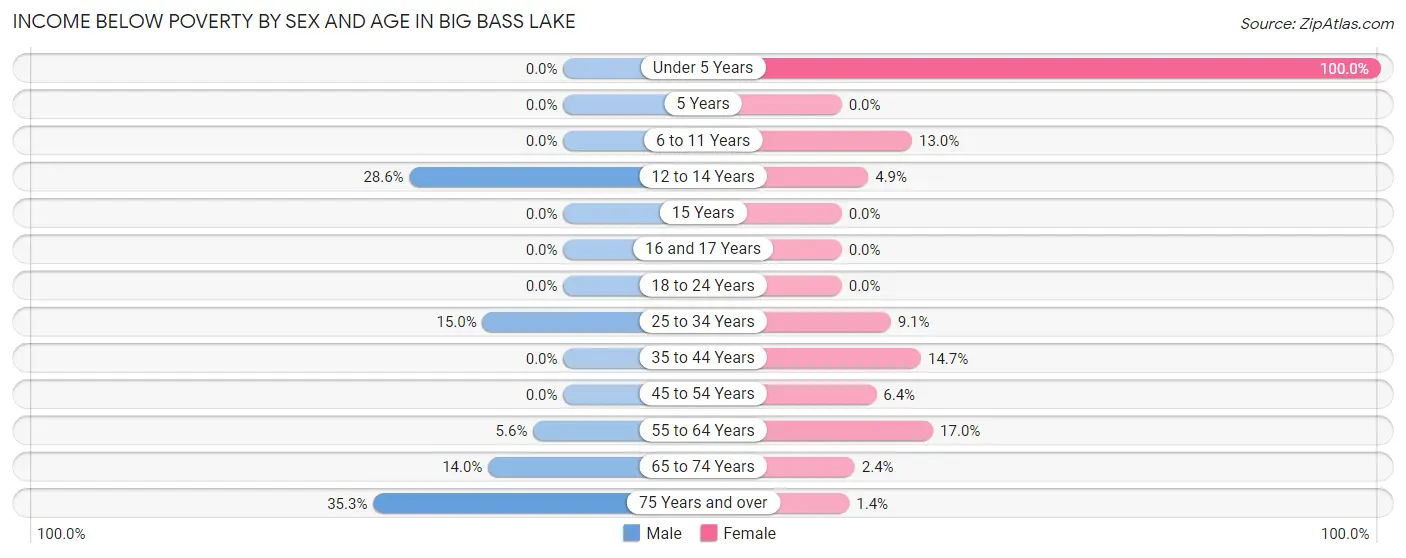
| Age Bracket | Male | Female |
| Under 5 Years | 0 (0.0%) | 5 (100.0%) |
| 5 Years | 0 (0.0%) | 0 (0.0%) |
| 6 to 11 Years | 0 (0.0%) | 6 (13.0%) |
| 12 to 14 Years | 6 (28.6%) | 3 (4.9%) |
| 15 Years | 0 (0.0%) | 0 (0.0%) |
| 16 and 17 Years | 0 (0.0%) | 0 (0.0%) |
| 18 to 24 Years | 0 (0.0%) | 0 (0.0%) |
| 25 to 34 Years | 3 (15.0%) | 9 (9.1%) |
| 35 to 44 Years | 0 (0.0%) | 5 (14.7%) |
| 45 to 54 Years | 0 (0.0%) | 10 (6.4%) |
| 55 to 64 Years | 8 (5.6%) | 19 (17.0%) |
| 65 to 74 Years | 12 (14.0%) | 3 (2.4%) |
| 75 Years and over | 12 (35.3%) | 1 (1.4%) |
| Total | 41 (6.2%) | 61 (8.0%) |
Income Above Poverty by Sex and Age in Big Bass Lake
According to the poverty statistics in Big Bass Lake, males aged under 5 years and females aged 16 and 17 years are the age groups that are most secure financially, with 100.0% of males and 100.0% of females in these age groups living above the poverty line.
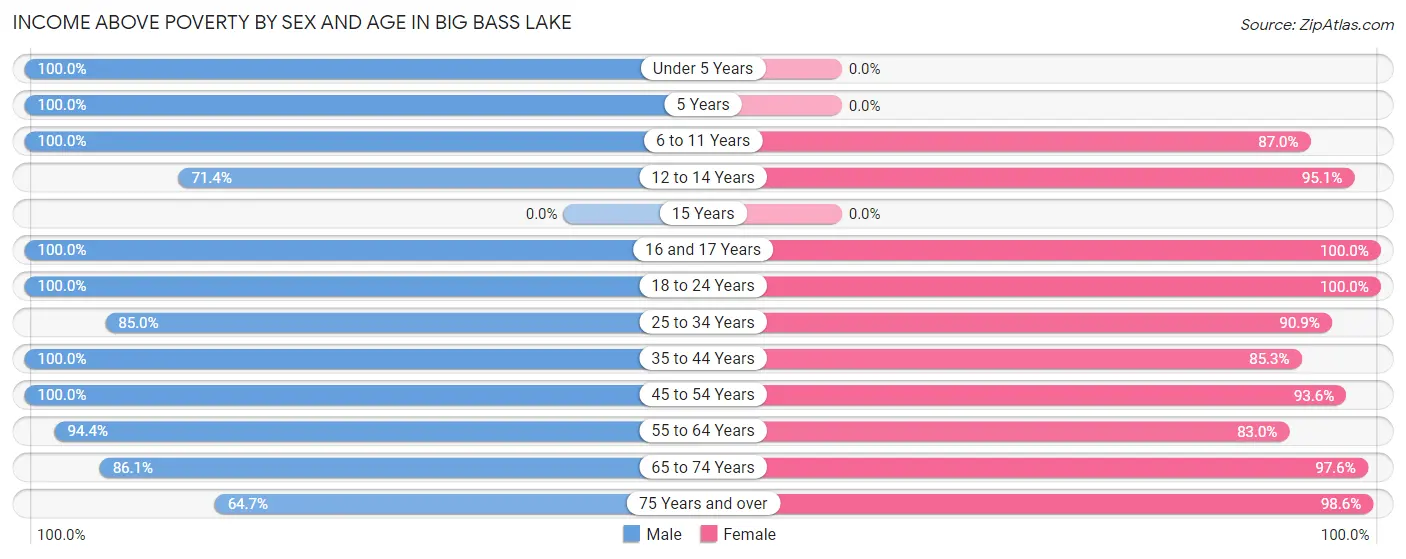
| Age Bracket | Male | Female |
| Under 5 Years | 26 (100.0%) | 0 (0.0%) |
| 5 Years | 8 (100.0%) | 0 (0.0%) |
| 6 to 11 Years | 59 (100.0%) | 40 (87.0%) |
| 12 to 14 Years | 15 (71.4%) | 58 (95.1%) |
| 15 Years | 0 (0.0%) | 0 (0.0%) |
| 16 and 17 Years | 17 (100.0%) | 17 (100.0%) |
| 18 to 24 Years | 17 (100.0%) | 37 (100.0%) |
| 25 to 34 Years | 17 (85.0%) | 90 (90.9%) |
| 35 to 44 Years | 89 (100.0%) | 29 (85.3%) |
| 45 to 54 Years | 138 (100.0%) | 146 (93.6%) |
| 55 to 64 Years | 135 (94.4%) | 93 (83.0%) |
| 65 to 74 Years | 74 (86.1%) | 121 (97.6%) |
| 75 Years and over | 22 (64.7%) | 70 (98.6%) |
| Total | 617 (93.8%) | 701 (92.0%) |
Income Below Poverty Among Married-Couple Families in Big Bass Lake
The poverty statistics for married-couple families in Big Bass Lake show that 8.3% or 27 of the total 327 families live below the poverty line. Families with no children have the highest poverty rate of 12.2%, comprising of 27 families. On the other hand, families with 1 or 2 children have the lowest poverty rate of 0.0%, which includes 0 families.
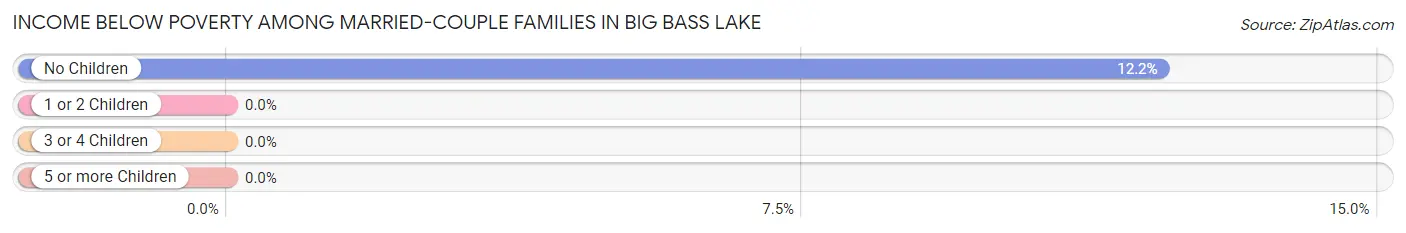
| Children | Above Poverty | Below Poverty |
| No Children | 195 (87.8%) | 27 (12.2%) |
| 1 or 2 Children | 105 (100.0%) | 0 (0.0%) |
| 3 or 4 Children | 0 (0.0%) | 0 (0.0%) |
| 5 or more Children | 0 (0.0%) | 0 (0.0%) |
| Total | 300 (91.7%) | 27 (8.3%) |
Income Below Poverty Among Single-Parent Households in Big Bass Lake
According to the poverty data in Big Bass Lake, 22.7% or 5 single-father households and 13.7% or 7 single-mother households are living below the poverty line. Among single-father households, those with 1 or 2 children have the highest poverty rate, with 5 households (26.3%) experiencing poverty. Likewise, among single-mother households, those with 1 or 2 children have the highest poverty rate, with 7 households (15.2%) falling below the poverty line.
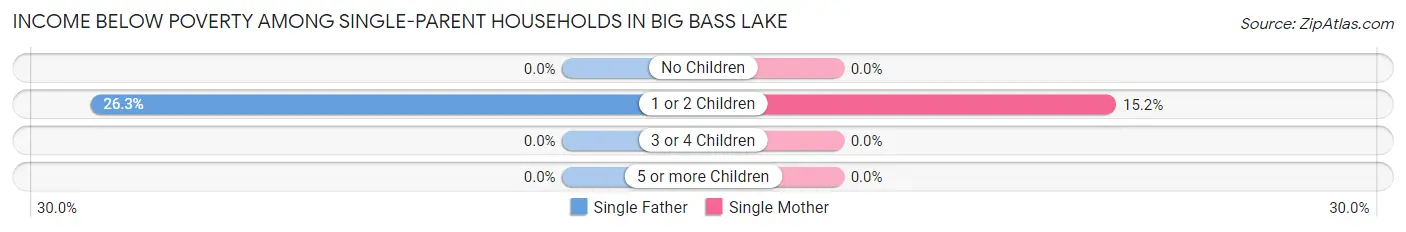
| Children | Single Father | Single Mother |
| No Children | 0 (0.0%) | 0 (0.0%) |
| 1 or 2 Children | 5 (26.3%) | 7 (15.2%) |
| 3 or 4 Children | 0 (0.0%) | 0 (0.0%) |
| 5 or more Children | 0 (0.0%) | 0 (0.0%) |
| Total | 5 (22.7%) | 7 (13.7%) |
Income Below Poverty Among Married-Couple vs Single-Parent Households in Big Bass Lake
The poverty data for Big Bass Lake shows that 27 of the married-couple family households (8.3%) and 12 of the single-parent households (16.4%) are living below the poverty level. Within the married-couple family households, those with no children have the highest poverty rate, with 27 households (12.2%) falling below the poverty line. Among the single-parent households, those with 1 or 2 children have the highest poverty rate, with 12 household (18.5%) living below poverty.
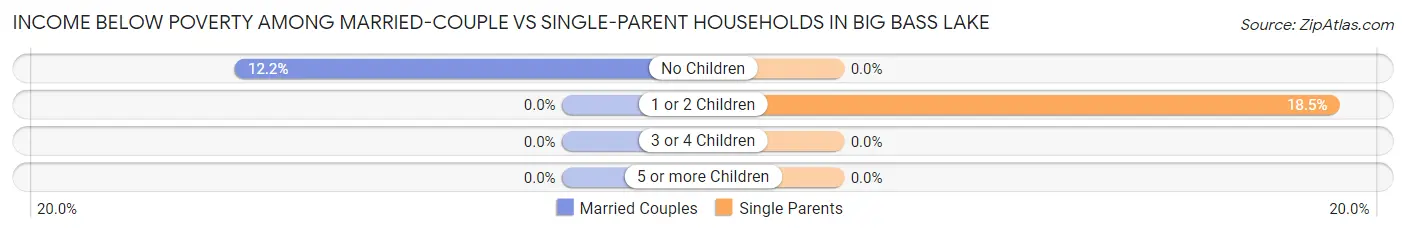
| Children | Married-Couple Families | Single-Parent Households |
| No Children | 27 (12.2%) | 0 (0.0%) |
| 1 or 2 Children | 0 (0.0%) | 12 (18.5%) |
| 3 or 4 Children | 0 (0.0%) | 0 (0.0%) |
| 5 or more Children | 0 (0.0%) | 0 (0.0%) |
| Total | 27 (8.3%) | 12 (16.4%) |
Race in Big Bass Lake
The most populous races in Big Bass Lake are White / Caucasian (1,305 | 91.9%), Two or more Races (65 | 4.6%), and Black / African American (38 | 2.7%).
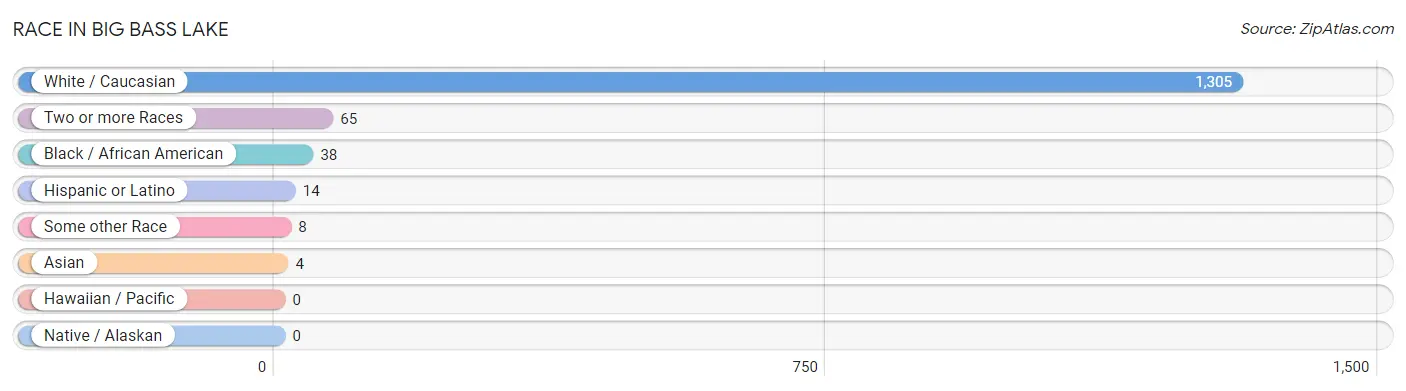
| Race | # Population | % Population |
| Asian | 4 | 0.3% |
| Black / African American | 38 | 2.7% |
| Hawaiian / Pacific | 0 | 0.0% |
| Hispanic or Latino | 14 | 1.0% |
| Native / Alaskan | 0 | 0.0% |
| White / Caucasian | 1,305 | 91.9% |
| Two or more Races | 65 | 4.6% |
| Some other Race | 8 | 0.6% |
| Total | 1,420 | 100.0% |
Ancestry in Big Bass Lake
The most populous ancestries reported in Big Bass Lake are Irish (406 | 28.6%), German (331 | 23.3%), Italian (329 | 23.2%), Welsh (253 | 17.8%), and Dutch (216 | 15.2%), together accounting for 108.1% of all Big Bass Lake residents.
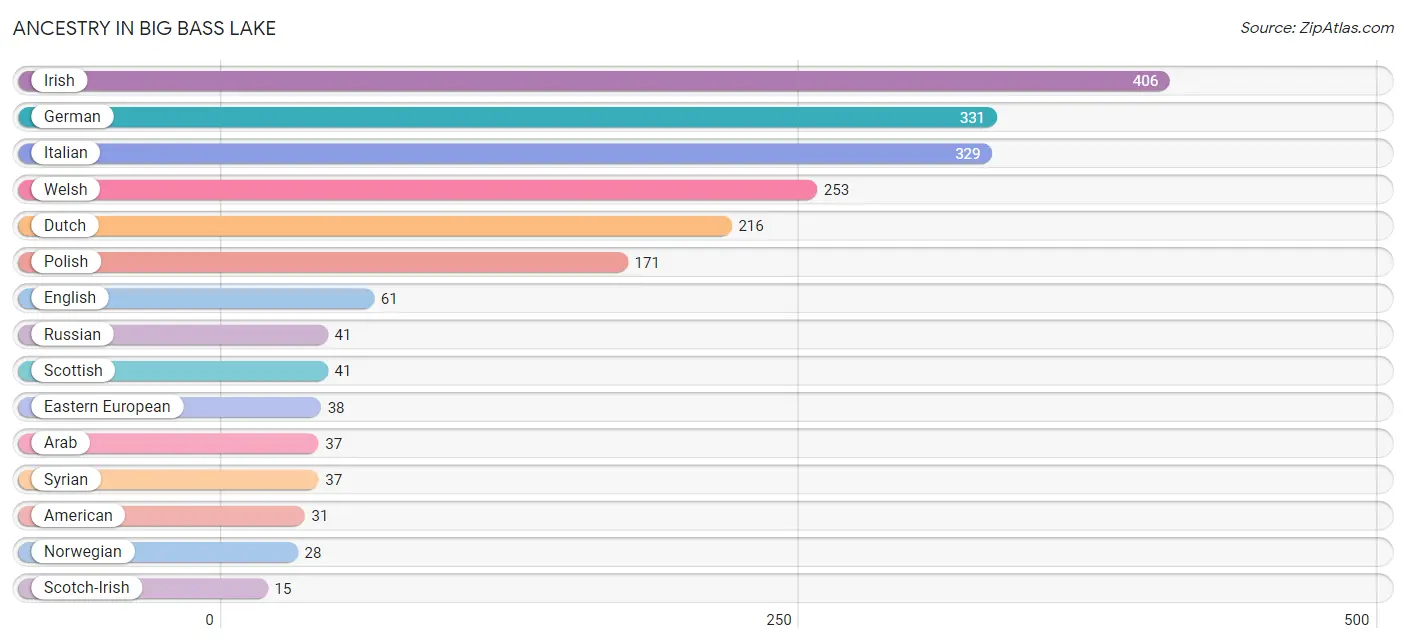
| Ancestry | # Population | % Population |
| American | 31 | 2.2% |
| Apache | 3 | 0.2% |
| Arab | 37 | 2.6% |
| Burmese | 8 | 0.6% |
| Cherokee | 3 | 0.2% |
| Cheyenne | 3 | 0.2% |
| Dominican | 3 | 0.2% |
| Dutch | 216 | 15.2% |
| Eastern European | 38 | 2.7% |
| English | 61 | 4.3% |
| French | 14 | 1.0% |
| German | 331 | 23.3% |
| Hungarian | 10 | 0.7% |
| Irish | 406 | 28.6% |
| Italian | 329 | 23.2% |
| Lithuanian | 7 | 0.5% |
| Mexican | 8 | 0.6% |
| Norwegian | 28 | 2.0% |
| Pennsylvania German | 11 | 0.8% |
| Polish | 171 | 12.0% |
| Puerto Rican | 3 | 0.2% |
| Romanian | 4 | 0.3% |
| Russian | 41 | 2.9% |
| Scotch-Irish | 15 | 1.1% |
| Scottish | 41 | 2.9% |
| Slovak | 14 | 1.0% |
| Swedish | 10 | 0.7% |
| Syrian | 37 | 2.6% |
| Ukrainian | 13 | 0.9% |
| Welsh | 253 | 17.8% | View All 30 Rows |
Immigrants in Big Bass Lake
The most numerous immigrant groups reported in Big Bass Lake came from Eastern Europe (11 | 0.8%), Europe (11 | 0.8%), Russia (7 | 0.5%), Latin America (5 | 0.4%), and Asia (4 | 0.3%), together accounting for 2.7% of all Big Bass Lake residents.
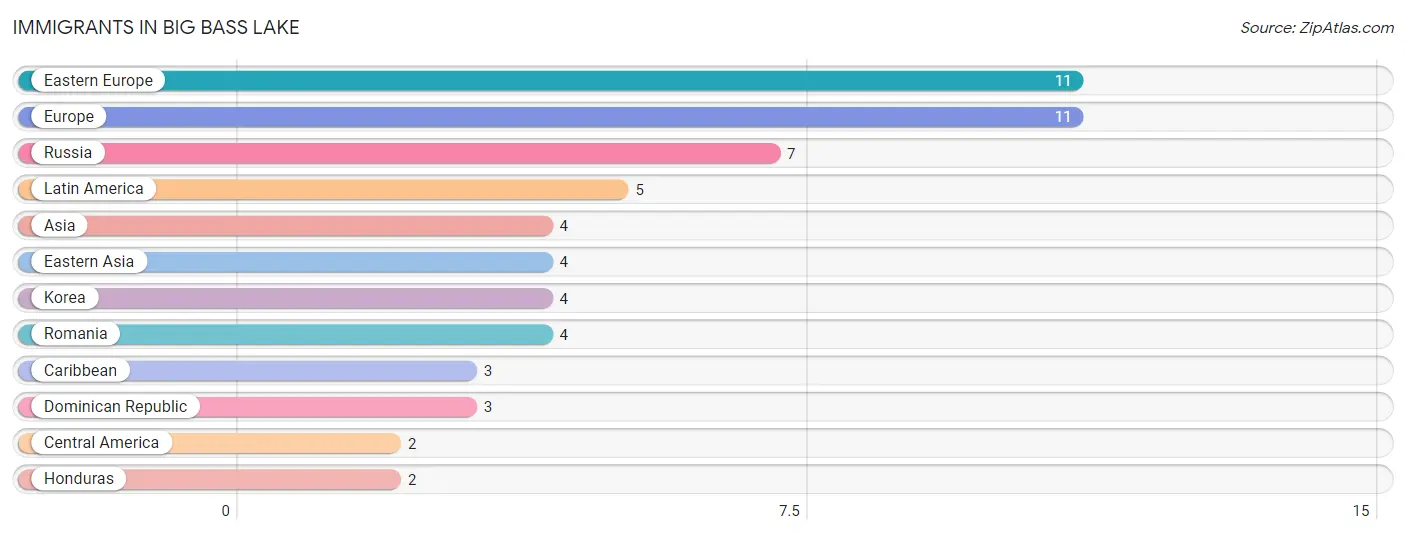
| Immigration Origin | # Population | % Population |
| Asia | 4 | 0.3% |
| Caribbean | 3 | 0.2% |
| Central America | 2 | 0.1% |
| Dominican Republic | 3 | 0.2% |
| Eastern Asia | 4 | 0.3% |
| Eastern Europe | 11 | 0.8% |
| Europe | 11 | 0.8% |
| Honduras | 2 | 0.1% |
| Korea | 4 | 0.3% |
| Latin America | 5 | 0.4% |
| Romania | 4 | 0.3% |
| Russia | 7 | 0.5% | View All 12 Rows |
Sex and Age in Big Bass Lake
Sex and Age in Big Bass Lake
The most populous age groups in Big Bass Lake are 50 to 54 Years (112 | 17.0%) for men and 45 to 49 Years (114 | 15.0%) for women.
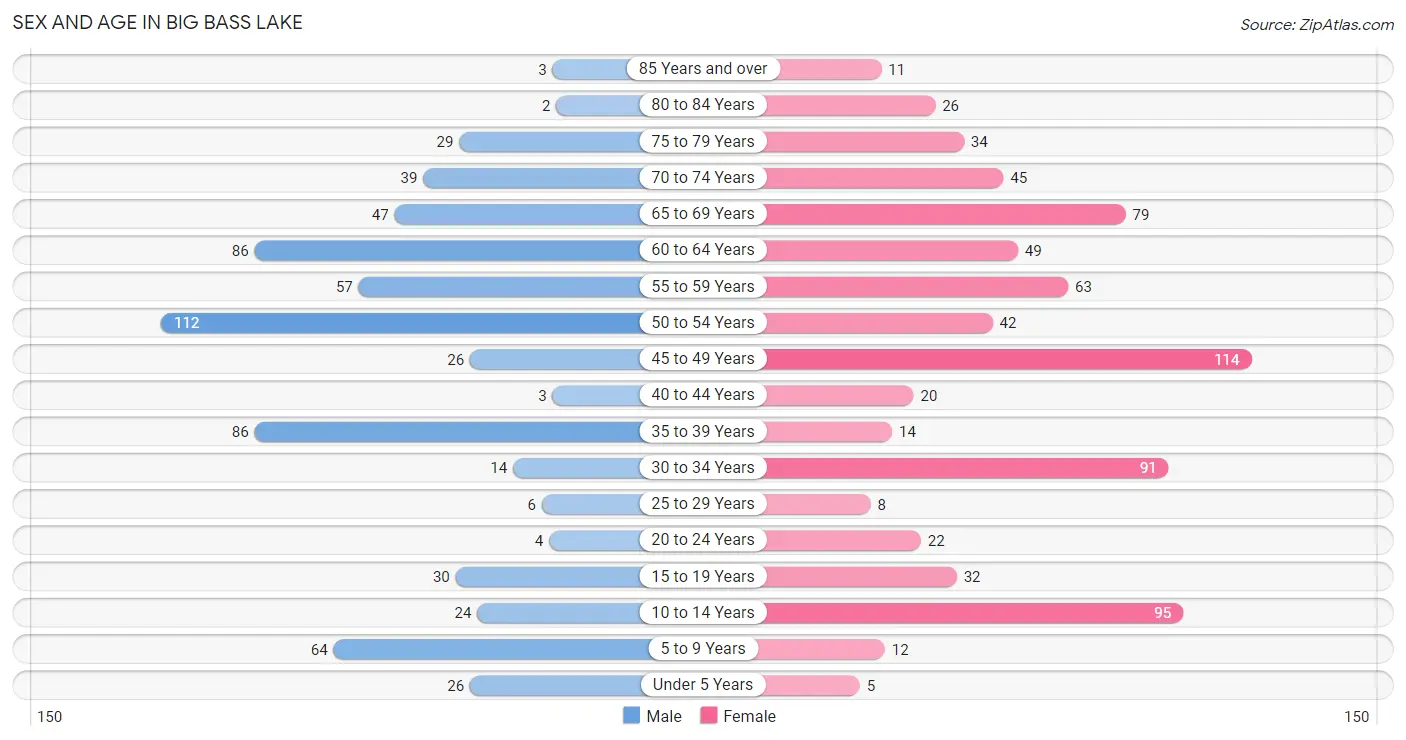
| Age Bracket | Male | Female |
| Under 5 Years | 26 (4.0%) | 5 (0.7%) |
| 5 to 9 Years | 64 (9.7%) | 12 (1.6%) |
| 10 to 14 Years | 24 (3.6%) | 95 (12.5%) |
| 15 to 19 Years | 30 (4.6%) | 32 (4.2%) |
| 20 to 24 Years | 4 (0.6%) | 22 (2.9%) |
| 25 to 29 Years | 6 (0.9%) | 8 (1.1%) |
| 30 to 34 Years | 14 (2.1%) | 91 (11.9%) |
| 35 to 39 Years | 86 (13.1%) | 14 (1.8%) |
| 40 to 44 Years | 3 (0.5%) | 20 (2.6%) |
| 45 to 49 Years | 26 (4.0%) | 114 (15.0%) |
| 50 to 54 Years | 112 (17.0%) | 42 (5.5%) |
| 55 to 59 Years | 57 (8.7%) | 63 (8.3%) |
| 60 to 64 Years | 86 (13.1%) | 49 (6.4%) |
| 65 to 69 Years | 47 (7.1%) | 79 (10.4%) |
| 70 to 74 Years | 39 (5.9%) | 45 (5.9%) |
| 75 to 79 Years | 29 (4.4%) | 34 (4.5%) |
| 80 to 84 Years | 2 (0.3%) | 26 (3.4%) |
| 85 Years and over | 3 (0.5%) | 11 (1.4%) |
| Total | 658 (100.0%) | 762 (100.0%) |
Families and Households in Big Bass Lake
Median Family Size in Big Bass Lake
The median family size in Big Bass Lake is 3.11 persons per family, with single female/mother families (51 | 12.8%) accounting for the largest median family size of 5.49 persons per family. On the other hand, single male/father families (22 | 5.5%) represent the smallest median family size with 2.50 persons per family.
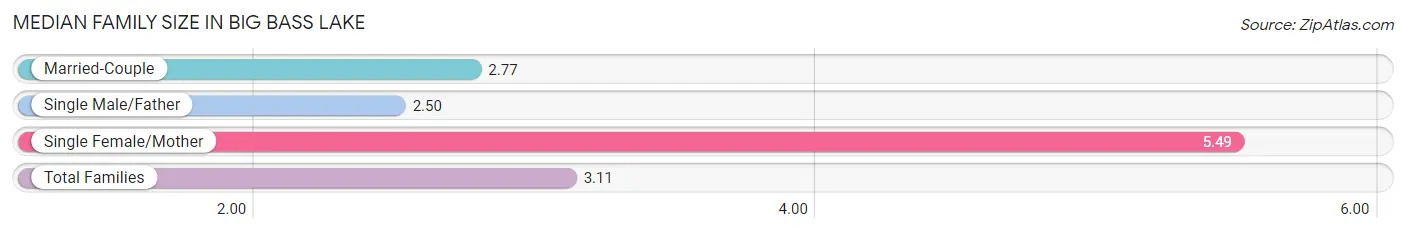
| Family Type | # Families | Family Size |
| Married-Couple | 327 (81.8%) | 2.77 |
| Single Male/Father | 22 (5.5%) | 2.50 |
| Single Female/Mother | 51 (12.8%) | 5.49 |
| Total Families | 400 (100.0%) | 3.11 |
Median Household Size in Big Bass Lake
The median household size in Big Bass Lake is 2.60 persons per household, with single female/mother households (51 | 9.3%) accounting for the largest median household size of 5.57 persons per household. non-family households (146 | 26.7%) represent the smallest median household size with 1.10 persons per household.
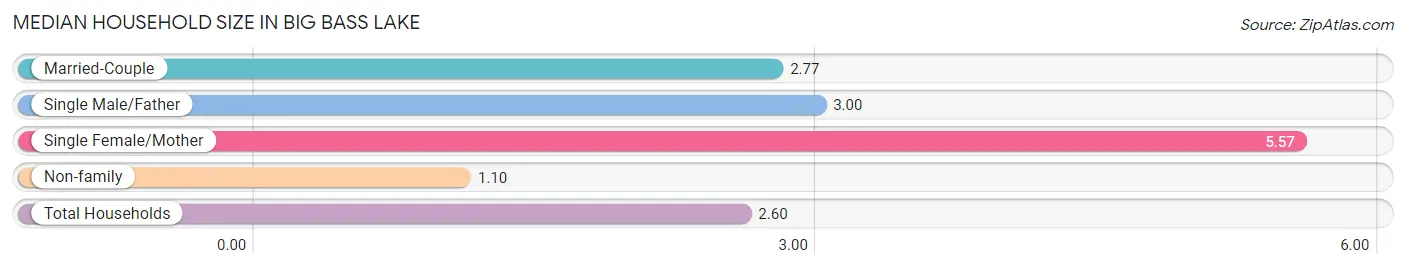
| Household Type | # Households | Household Size |
| Married-Couple | 327 (59.9%) | 2.77 |
| Single Male/Father | 22 (4.0%) | 3.00 |
| Single Female/Mother | 51 (9.3%) | 5.57 |
| Non-family | 146 (26.7%) | 1.10 |
| Total Households | 546 (100.0%) | 2.60 |
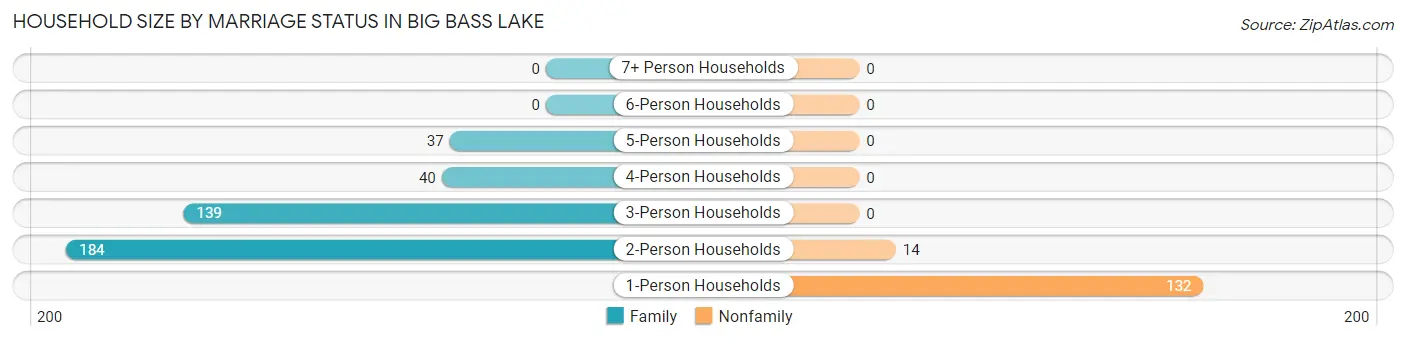
Household Size by Marriage Status in Big Bass Lake
Out of a total of 546 households in Big Bass Lake, 400 (73.3%) are family households, while 146 (26.7%) are nonfamily households. The most numerous type of family households are 2-person households, comprising 184, and the most common type of nonfamily households are 1-person households, comprising 132.
| Household Size | Family Households | Nonfamily Households |
| 1-Person Households | - | 132 (24.2%) |
| 2-Person Households | 184 (33.7%) | 14 (2.6%) |
| 3-Person Households | 139 (25.5%) | 0 (0.0%) |
| 4-Person Households | 40 (7.3%) | 0 (0.0%) |
| 5-Person Households | 37 (6.8%) | 0 (0.0%) |
| 6-Person Households | 0 (0.0%) | 0 (0.0%) |
| 7+ Person Households | 0 (0.0%) | 0 (0.0%) |
| Total | 400 (73.3%) | 146 (26.7%) |
Female Fertility in Big Bass Lake
Fertility by Age in Big Bass Lake
| Age Bracket | Women with Births | Births / 1,000 Women |
| 15 to 19 years | 0 (0.0%) | 0.0 |
| 20 to 34 years | 0 (0.0%) | 0.0 |
| 35 to 50 years | 0 (0.0%) | 0.0 |
| Total | 0 (0.0%) | 0.0 |
Fertility by Age by Marriage Status in Big Bass Lake
| Age Bracket | Married | Unmarried |
| 15 to 19 years | 0 (0.0%) | 0 (0.0%) |
| 20 to 34 years | 0 (0.0%) | 0 (0.0%) |
| 35 to 50 years | 0 (0.0%) | 0 (0.0%) |
| Total | 0 (0.0%) | 0 (0.0%) |
Fertility by Education in Big Bass Lake
| Educational Attainment | Women with Births | Births / 1,000 Women |
| Less than High School | 0 (0.0%) | 0.0 |
| High School Diploma | 0 (0.0%) | 0.0 |
| College or Associate's Degree | 0 (0.0%) | 0.0 |
| Bachelor's Degree | 0 (0.0%) | 0.0 |
| Graduate Degree | 0 (0.0%) | 0.0 |
| Total | 0 (0.0%) | 0.0 |
Fertility by Education by Marriage Status in Big Bass Lake
| Educational Attainment | Married | Unmarried |
| Less than High School | 0 (0.0%) | 0 (0.0%) |
| High School Diploma | 0 (0.0%) | 0 (0.0%) |
| College or Associate's Degree | 0 (0.0%) | 0 (0.0%) |
| Bachelor's Degree | 0 (0.0%) | 0 (0.0%) |
| Graduate Degree | 0 (0.0%) | 0 (0.0%) |
| Total | 0 (0.0%) | 0 (0.0%) |
Employment Characteristics in Big Bass Lake
Employment by Class of Employer in Big Bass Lake
Among the 698 employed individuals in Big Bass Lake, private company employees (362 | 51.9%), not-for-profit organizations (118 | 16.9%), and federal government employees (114 | 16.3%) make up the most common classes of employment.
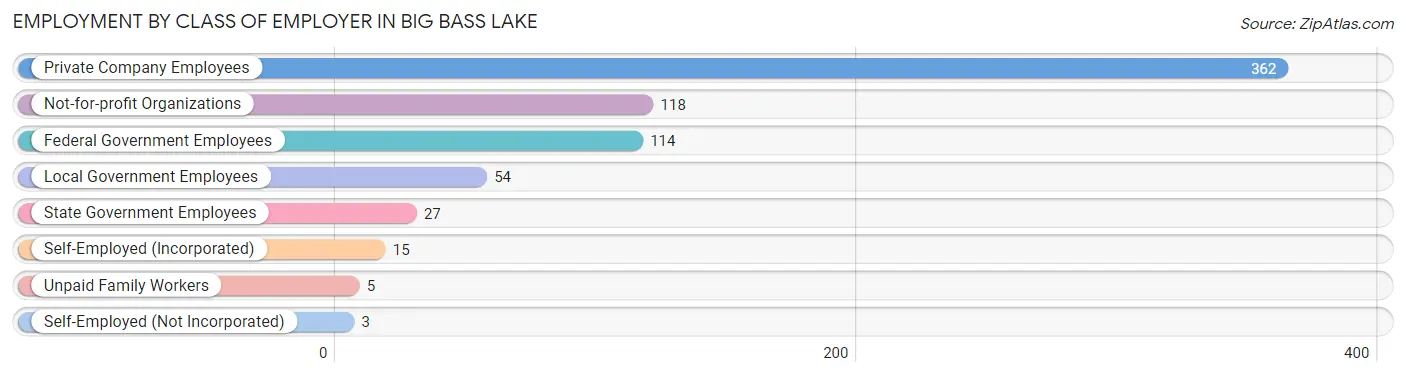
| Employer Class | # Employees | % Employees |
| Private Company Employees | 362 | 51.9% |
| Self-Employed (Incorporated) | 15 | 2.1% |
| Self-Employed (Not Incorporated) | 3 | 0.4% |
| Not-for-profit Organizations | 118 | 16.9% |
| Local Government Employees | 54 | 7.7% |
| State Government Employees | 27 | 3.9% |
| Federal Government Employees | 114 | 16.3% |
| Unpaid Family Workers | 5 | 0.7% |
| Total | 698 | 100.0% |
Employment Status by Age in Big Bass Lake
According to the labor force statistics for Big Bass Lake, out of the total population over 16 years of age (1,194), 62.5% or 746 individuals are in the labor force, with 3.5% or 26 of them unemployed. The age group with the highest labor force participation rate is 25 to 29 years, with 100.0% or 14 individuals in the labor force. Within the labor force, the 65 to 74 years age range has the highest percentage of unemployed individuals, with 20.6% or 7 of them being unemployed.
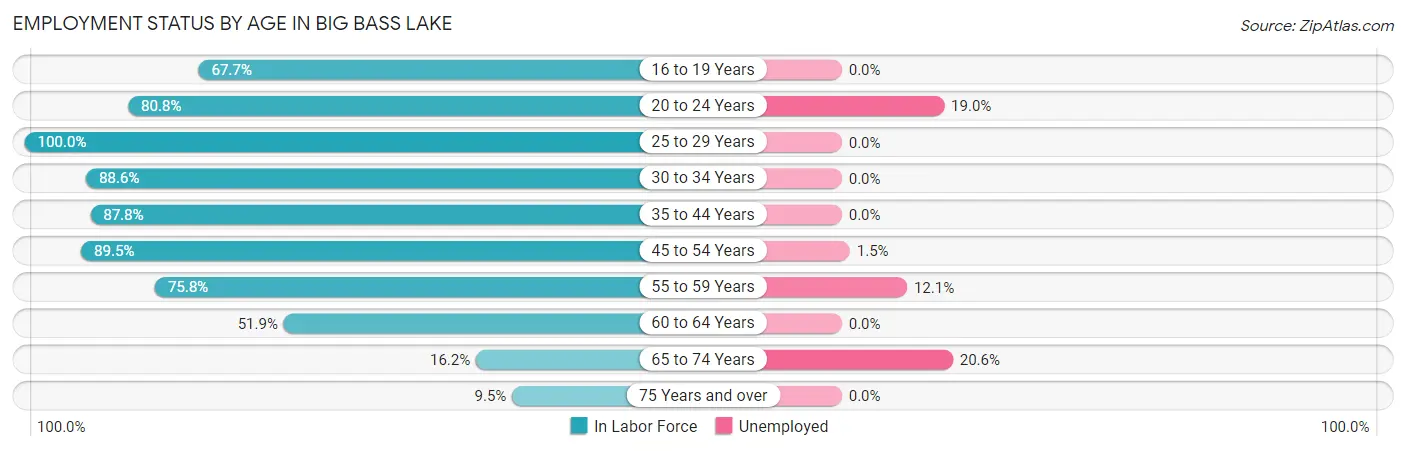
| Age Bracket | In Labor Force | Unemployed |
| 16 to 19 Years | 42 (67.7%) | 0 (0.0%) |
| 20 to 24 Years | 21 (80.8%) | 4 (19.0%) |
| 25 to 29 Years | 14 (100.0%) | 0 (0.0%) |
| 30 to 34 Years | 93 (88.6%) | 0 (0.0%) |
| 35 to 44 Years | 108 (87.8%) | 0 (0.0%) |
| 45 to 54 Years | 263 (89.5%) | 4 (1.5%) |
| 55 to 59 Years | 91 (75.8%) | 11 (12.1%) |
| 60 to 64 Years | 70 (51.9%) | 0 (0.0%) |
| 65 to 74 Years | 34 (16.2%) | 7 (20.6%) |
| 75 Years and over | 10 (9.5%) | 0 (0.0%) |
| Total | 746 (62.5%) | 26 (3.5%) |
Employment Status by Educational Attainment in Big Bass Lake
According to labor force statistics for Big Bass Lake, 80.8% of individuals (639) out of the total population between 25 and 64 years of age (791) are in the labor force, with 2.3% or 15 of them being unemployed. The group with the highest labor force participation rate are those with the educational attainment of college / associate degree, with 85.6% or 291 individuals in the labor force. Within the labor force, individuals with high school diploma education have the highest percentage of unemployment, with 5.8% or 15 of them being unemployed.
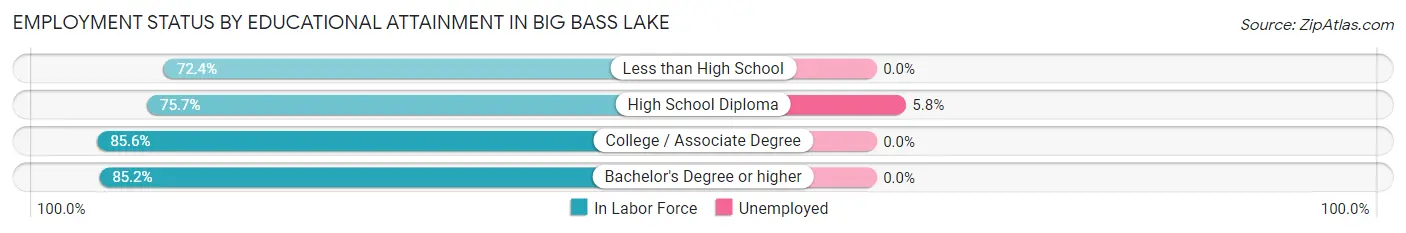
| Educational Attainment | In Labor Force | Unemployed |
| Less than High School | 21 (72.4%) | 0 (0.0%) |
| High School Diploma | 258 (75.7%) | 20 (5.8%) |
| College / Associate Degree | 291 (85.6%) | 0 (0.0%) |
| Bachelor's Degree or higher | 69 (85.2%) | 0 (0.0%) |
| Total | 639 (80.8%) | 18 (2.3%) |
Employment Occupations by Sex in Big Bass Lake
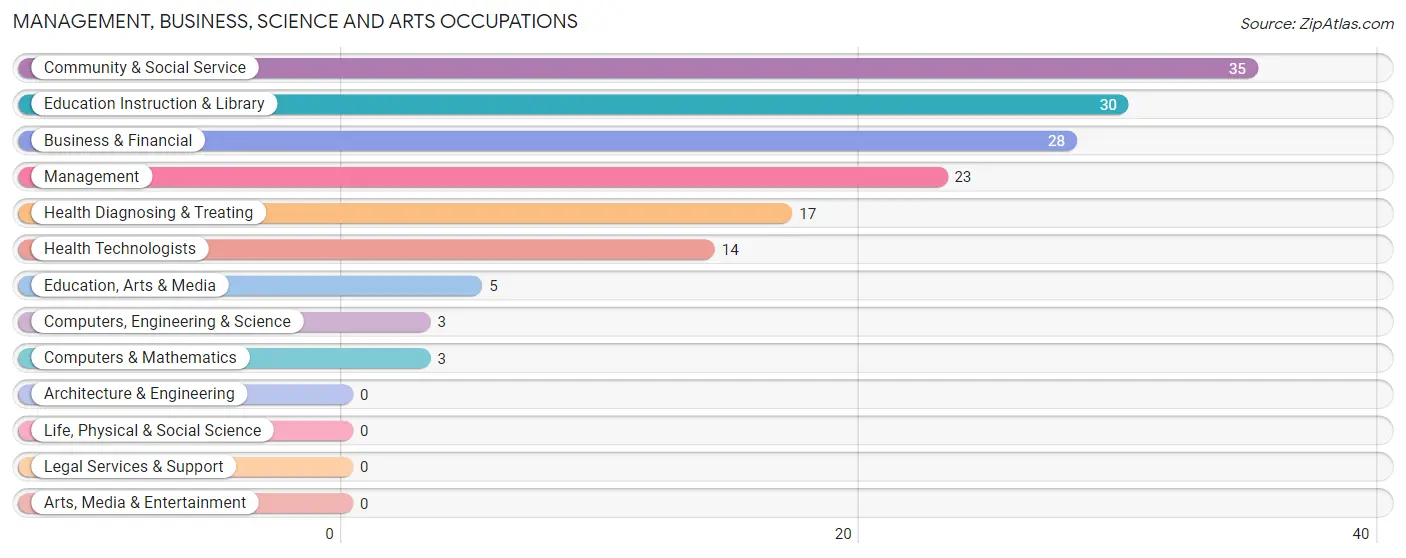
Management, Business, Science and Arts Occupations
The most common Management, Business, Science and Arts occupations in Big Bass Lake are Community & Social Service (35 | 4.9%), Education Instruction & Library (30 | 4.2%), Business & Financial (28 | 3.9%), Management (23 | 3.2%), and Health Diagnosing & Treating (17 | 2.4%).
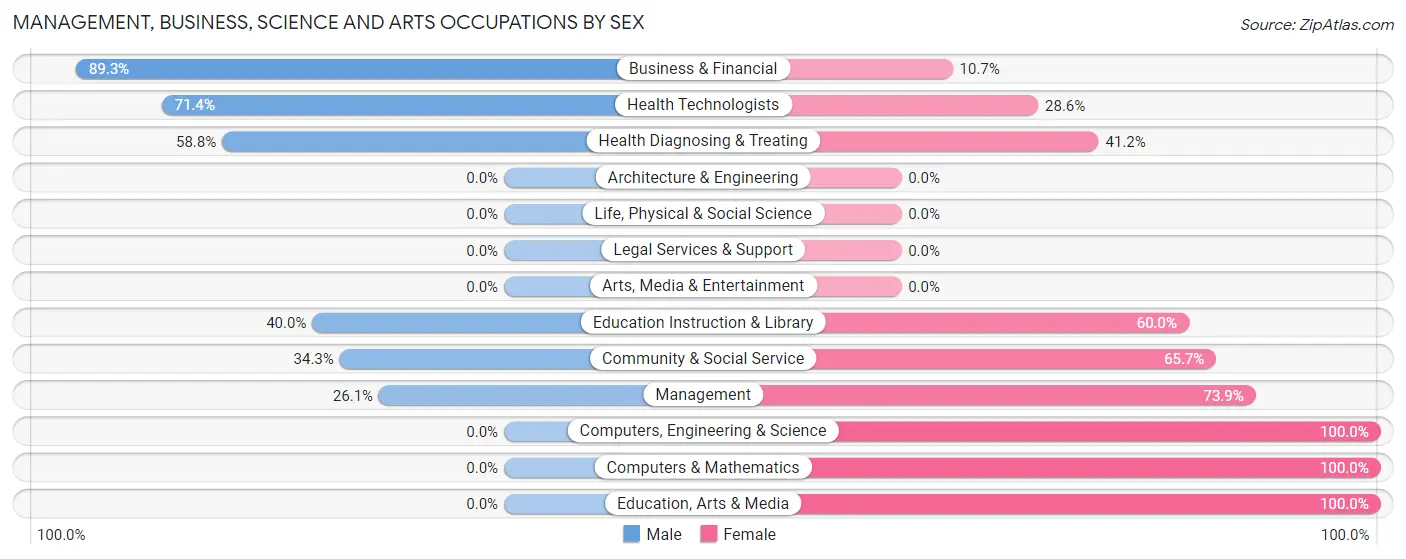
Management, Business, Science and Arts Occupations by Sex
Within the Management, Business, Science and Arts occupations in Big Bass Lake, the most male-oriented occupations are Business & Financial (89.3%), Health Technologists (71.4%), and Health Diagnosing & Treating (58.8%), while the most female-oriented occupations are Computers, Engineering & Science (100.0%), Computers & Mathematics (100.0%), and Education, Arts & Media (100.0%).
| Occupation | Male | Female |
| Management | 6 (26.1%) | 17 (73.9%) |
| Business & Financial | 25 (89.3%) | 3 (10.7%) |
| Computers, Engineering & Science | 0 (0.0%) | 3 (100.0%) |
| Computers & Mathematics | 0 (0.0%) | 3 (100.0%) |
| Architecture & Engineering | 0 (0.0%) | 0 (0.0%) |
| Life, Physical & Social Science | 0 (0.0%) | 0 (0.0%) |
| Community & Social Service | 12 (34.3%) | 23 (65.7%) |
| Education, Arts & Media | 0 (0.0%) | 5 (100.0%) |
| Legal Services & Support | 0 (0.0%) | 0 (0.0%) |
| Education Instruction & Library | 12 (40.0%) | 18 (60.0%) |
| Arts, Media & Entertainment | 0 (0.0%) | 0 (0.0%) |
| Health Diagnosing & Treating | 10 (58.8%) | 7 (41.2%) |
| Health Technologists | 10 (71.4%) | 4 (28.6%) |
| Total (Category) | 53 (50.0%) | 53 (50.0%) |
| Total (Overall) | 357 (49.6%) | 363 (50.4%) |
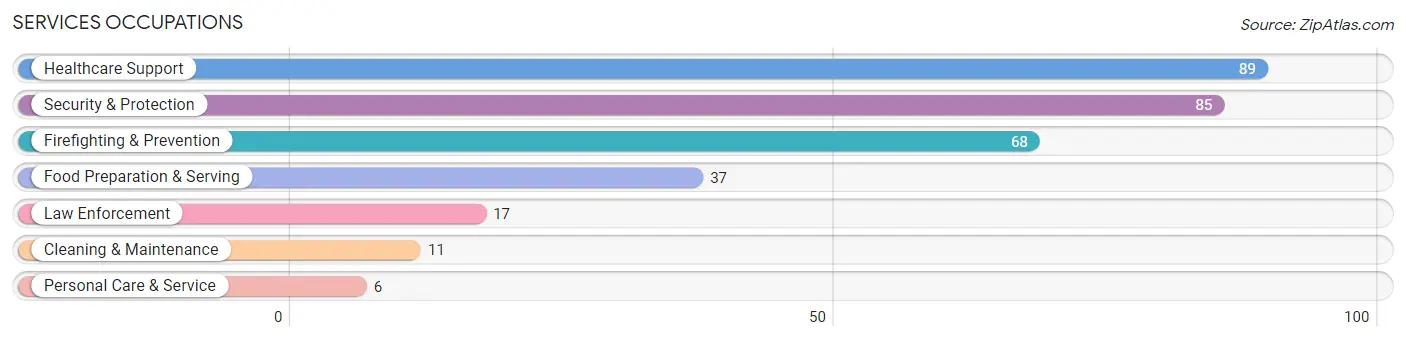
Services Occupations
The most common Services occupations in Big Bass Lake are Healthcare Support (89 | 12.4%), Security & Protection (85 | 11.8%), Firefighting & Prevention (68 | 9.4%), Food Preparation & Serving (37 | 5.1%), and Law Enforcement (17 | 2.4%).
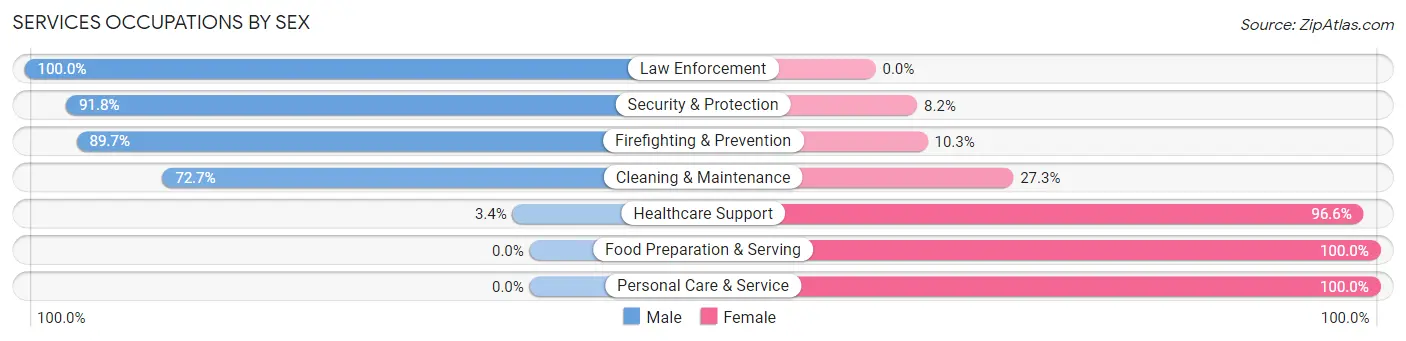
Services Occupations by Sex
Within the Services occupations in Big Bass Lake, the most male-oriented occupations are Law Enforcement (100.0%), Security & Protection (91.8%), and Firefighting & Prevention (89.7%), while the most female-oriented occupations are Food Preparation & Serving (100.0%), Personal Care & Service (100.0%), and Healthcare Support (96.6%).
| Occupation | Male | Female |
| Healthcare Support | 3 (3.4%) | 86 (96.6%) |
| Security & Protection | 78 (91.8%) | 7 (8.2%) |
| Firefighting & Prevention | 61 (89.7%) | 7 (10.3%) |
| Law Enforcement | 17 (100.0%) | 0 (0.0%) |
| Food Preparation & Serving | 0 (0.0%) | 37 (100.0%) |
| Cleaning & Maintenance | 8 (72.7%) | 3 (27.3%) |
| Personal Care & Service | 0 (0.0%) | 6 (100.0%) |
| Total (Category) | 89 (39.0%) | 139 (61.0%) |
| Total (Overall) | 357 (49.6%) | 363 (50.4%) |
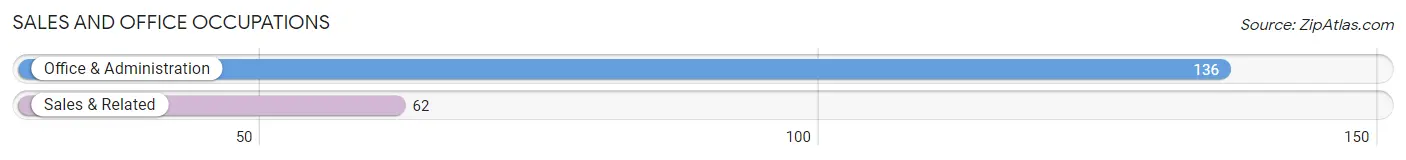
Sales and Office Occupations
The most common Sales and Office occupations in Big Bass Lake are Office & Administration (136 | 18.9%), and Sales & Related (62 | 8.6%).
Sales and Office Occupations by Sex
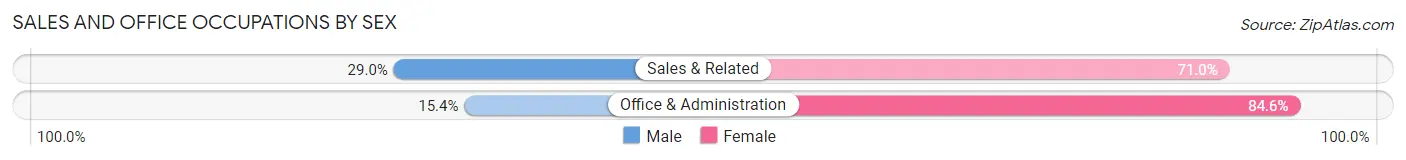
| Occupation | Male | Female |
| Sales & Related | 18 (29.0%) | 44 (71.0%) |
| Office & Administration | 21 (15.4%) | 115 (84.6%) |
| Total (Category) | 39 (19.7%) | 159 (80.3%) |
| Total (Overall) | 357 (49.6%) | 363 (50.4%) |
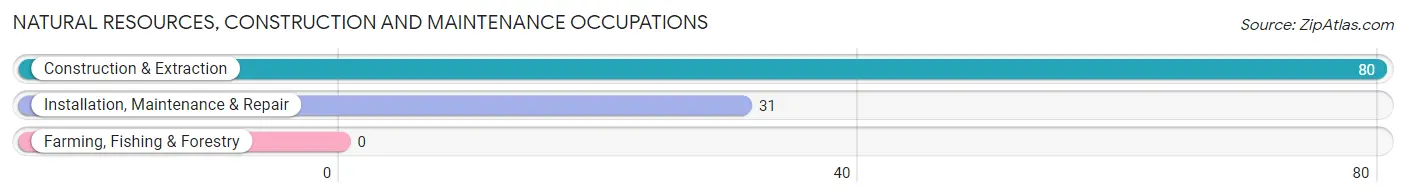
Natural Resources, Construction and Maintenance Occupations
The most common Natural Resources, Construction and Maintenance occupations in Big Bass Lake are Construction & Extraction (80 | 11.1%), and Installation, Maintenance & Repair (31 | 4.3%).
Natural Resources, Construction and Maintenance Occupations by Sex
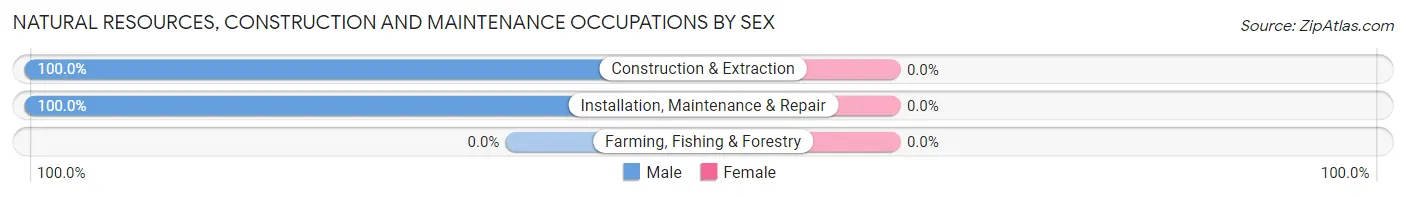
| Occupation | Male | Female |
| Farming, Fishing & Forestry | 0 (0.0%) | 0 (0.0%) |
| Construction & Extraction | 80 (100.0%) | 0 (0.0%) |
| Installation, Maintenance & Repair | 31 (100.0%) | 0 (0.0%) |
| Total (Category) | 111 (100.0%) | 0 (0.0%) |
| Total (Overall) | 357 (49.6%) | 363 (50.4%) |
Production, Transportation and Moving Occupations
The most common Production, Transportation and Moving occupations in Big Bass Lake are Material Moving (34 | 4.7%), Transportation (25 | 3.5%), and Production (18 | 2.5%).
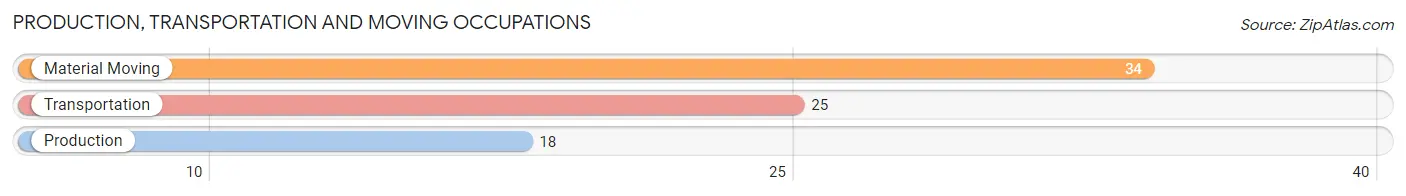
Production, Transportation and Moving Occupations by Sex
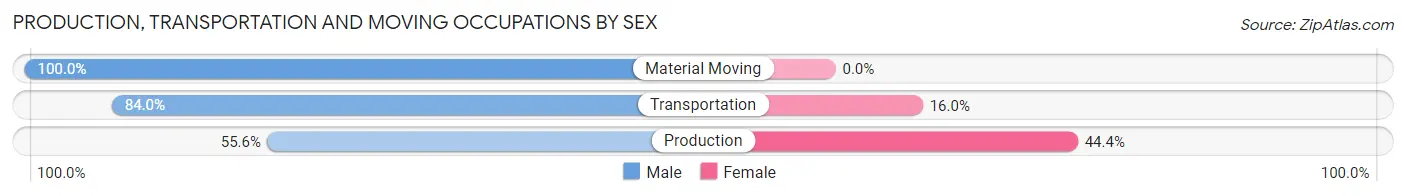
| Occupation | Male | Female |
| Production | 10 (55.6%) | 8 (44.4%) |
| Transportation | 21 (84.0%) | 4 (16.0%) |
| Material Moving | 34 (100.0%) | 0 (0.0%) |
| Total (Category) | 65 (84.4%) | 12 (15.6%) |
| Total (Overall) | 357 (49.6%) | 363 (50.4%) |
Employment Industries by Sex in Big Bass Lake
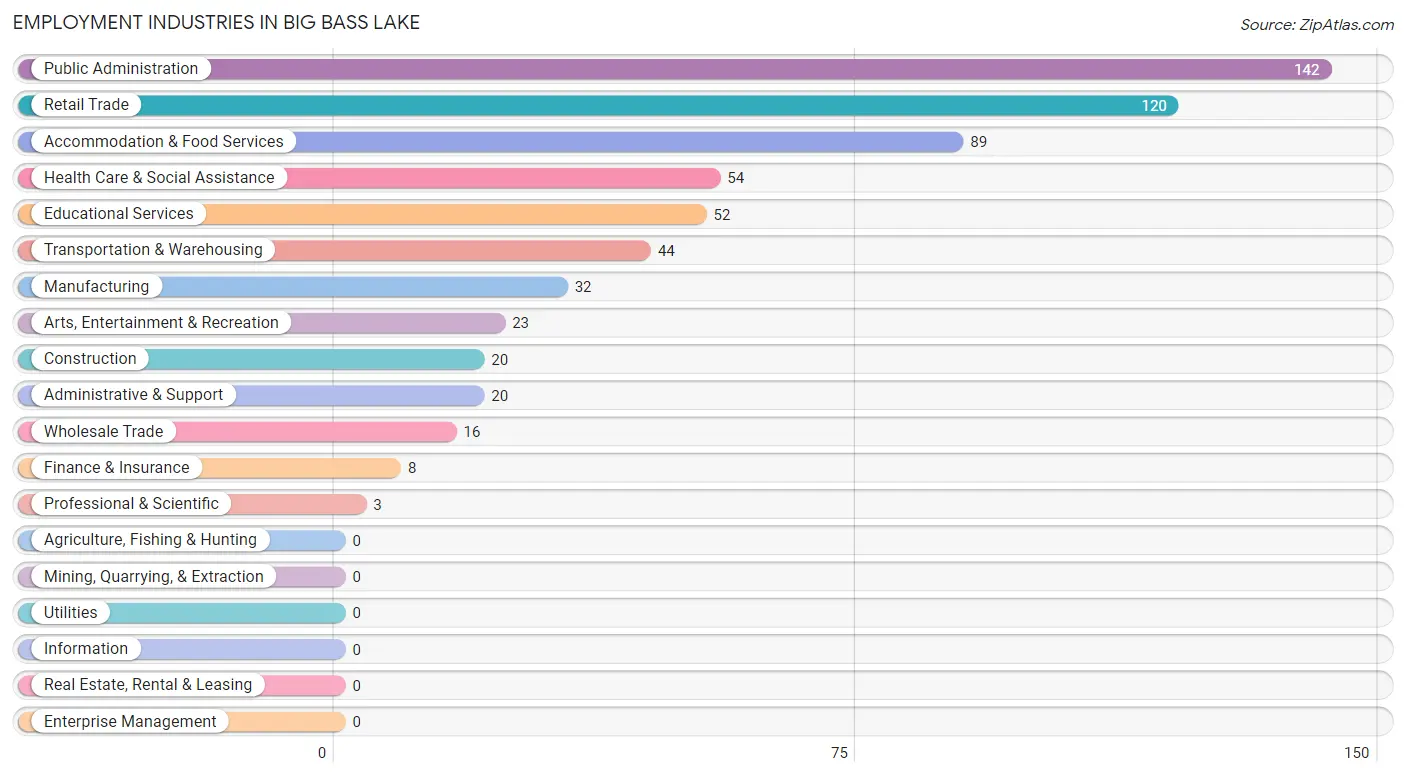
Employment Industries in Big Bass Lake
The major employment industries in Big Bass Lake include Public Administration (142 | 19.7%), Retail Trade (120 | 16.7%), Accommodation & Food Services (89 | 12.4%), Health Care & Social Assistance (54 | 7.5%), and Educational Services (52 | 7.2%).
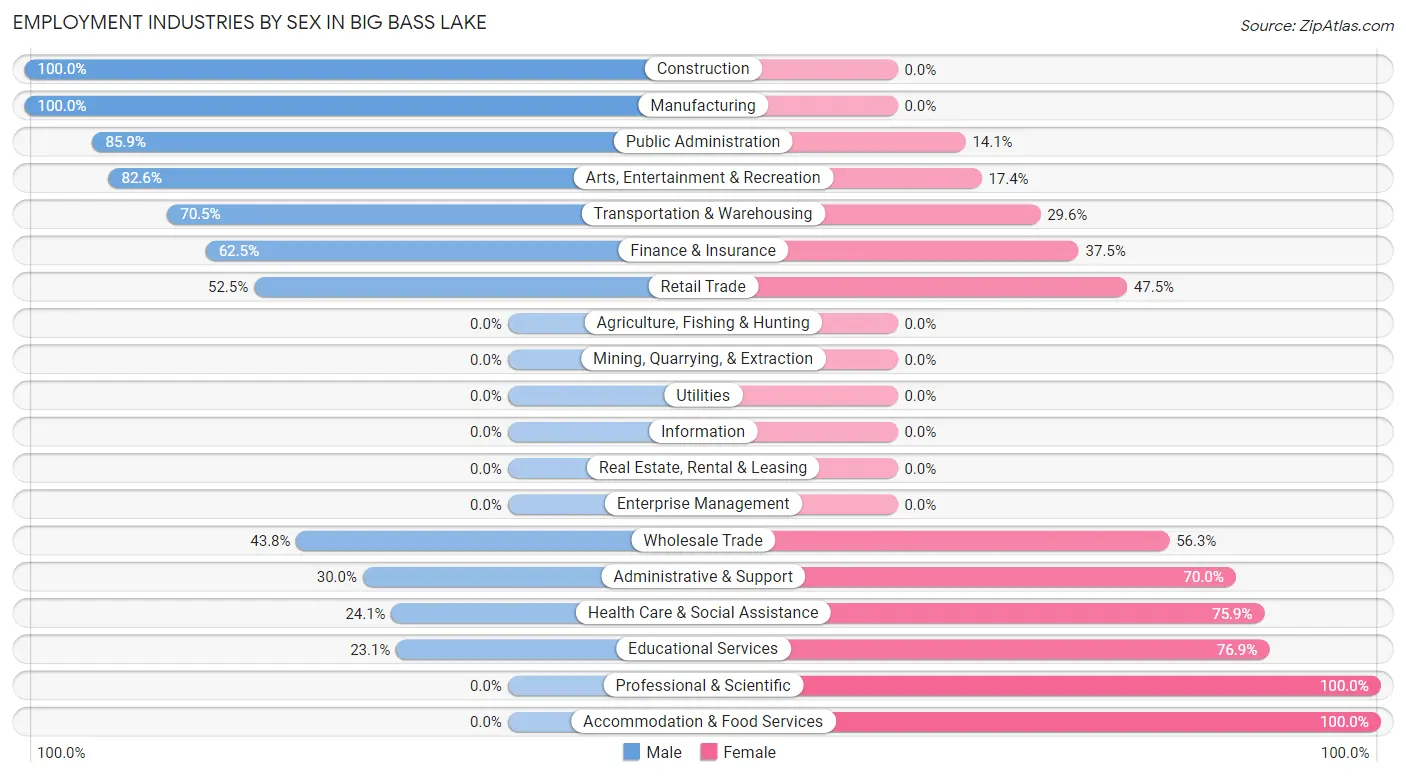
Employment Industries by Sex in Big Bass Lake
The Big Bass Lake industries that see more men than women are Construction (100.0%), Manufacturing (100.0%), and Public Administration (85.9%), whereas the industries that tend to have a higher number of women are Professional & Scientific (100.0%), Accommodation & Food Services (100.0%), and Educational Services (76.9%).
| Industry | Male | Female |
| Agriculture, Fishing & Hunting | 0 (0.0%) | 0 (0.0%) |
| Mining, Quarrying, & Extraction | 0 (0.0%) | 0 (0.0%) |
| Construction | 20 (100.0%) | 0 (0.0%) |
| Manufacturing | 32 (100.0%) | 0 (0.0%) |
| Wholesale Trade | 7 (43.8%) | 9 (56.2%) |
| Retail Trade | 63 (52.5%) | 57 (47.5%) |
| Transportation & Warehousing | 31 (70.5%) | 13 (29.5%) |
| Utilities | 0 (0.0%) | 0 (0.0%) |
| Information | 0 (0.0%) | 0 (0.0%) |
| Finance & Insurance | 5 (62.5%) | 3 (37.5%) |
| Real Estate, Rental & Leasing | 0 (0.0%) | 0 (0.0%) |
| Professional & Scientific | 0 (0.0%) | 3 (100.0%) |
| Enterprise Management | 0 (0.0%) | 0 (0.0%) |
| Administrative & Support | 6 (30.0%) | 14 (70.0%) |
| Educational Services | 12 (23.1%) | 40 (76.9%) |
| Health Care & Social Assistance | 13 (24.1%) | 41 (75.9%) |
| Arts, Entertainment & Recreation | 19 (82.6%) | 4 (17.4%) |
| Accommodation & Food Services | 0 (0.0%) | 89 (100.0%) |
| Public Administration | 122 (85.9%) | 20 (14.1%) |
| Total | 357 (49.6%) | 363 (50.4%) |
Education in Big Bass Lake
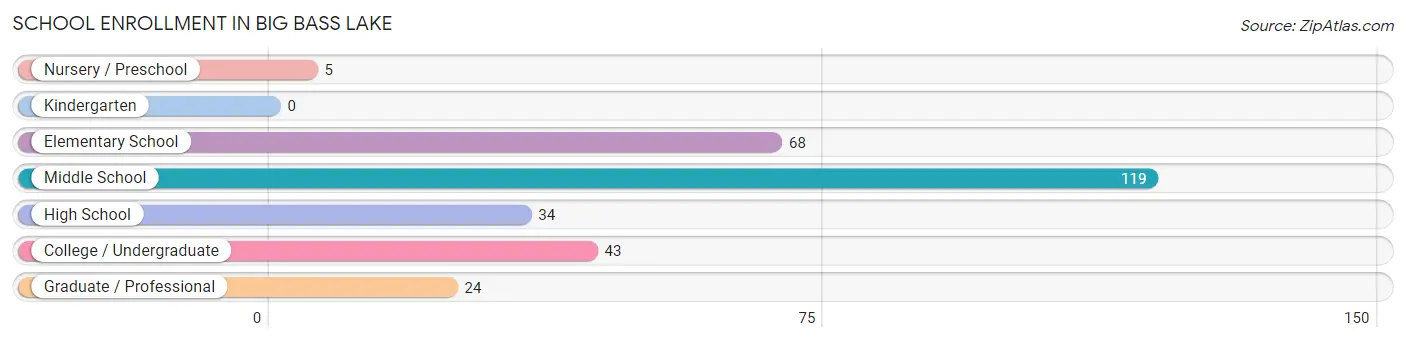
School Enrollment in Big Bass Lake
The most common levels of schooling among the 293 students in Big Bass Lake are middle school (119 | 40.6%), elementary school (68 | 23.2%), and college / undergraduate (43 | 14.7%).
| School Level | # Students | % Students |
| Nursery / Preschool | 5 | 1.7% |
| Kindergarten | 0 | 0.0% |
| Elementary School | 68 | 23.2% |
| Middle School | 119 | 40.6% |
| High School | 34 | 11.6% |
| College / Undergraduate | 43 | 14.7% |
| Graduate / Professional | 24 | 8.2% |
| Total | 293 | 100.0% |
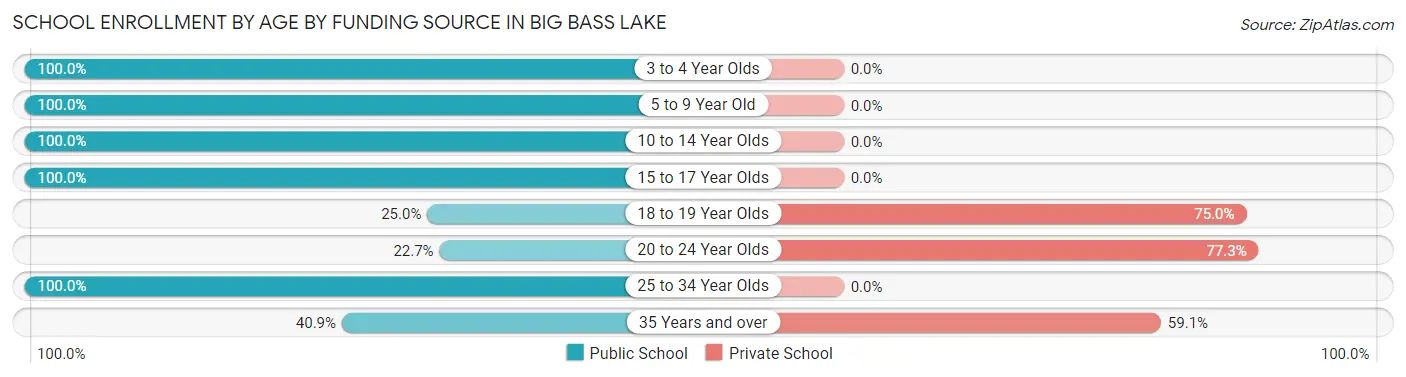
School Enrollment by Age by Funding Source in Big Bass Lake
Out of a total of 293 students who are enrolled in schools in Big Bass Lake, 45 (15.4%) attend a private institution, while the remaining 248 (84.6%) are enrolled in public schools. The age group of 20 to 24 year olds has the highest likelihood of being enrolled in private schools, with 17 (77.3% in the age bracket) enrolled. Conversely, the age group of 3 to 4 year olds has the lowest likelihood of being enrolled in a private school, with 5 (100.0% in the age bracket) attending a public institution.
| Age Bracket | Public School | Private School |
| 3 to 4 Year Olds | 5 (100.0%) | 0 (0.0%) |
| 5 to 9 Year Old | 68 (100.0%) | 0 (0.0%) |
| 10 to 14 Year Olds | 119 (100.0%) | 0 (0.0%) |
| 15 to 17 Year Olds | 34 (100.0%) | 0 (0.0%) |
| 18 to 19 Year Olds | 5 (25.0%) | 15 (75.0%) |
| 20 to 24 Year Olds | 5 (22.7%) | 17 (77.3%) |
| 25 to 34 Year Olds | 3 (100.0%) | 0 (0.0%) |
| 35 Years and over | 9 (40.9%) | 13 (59.1%) |
| Total | 248 (84.6%) | 45 (15.4%) |
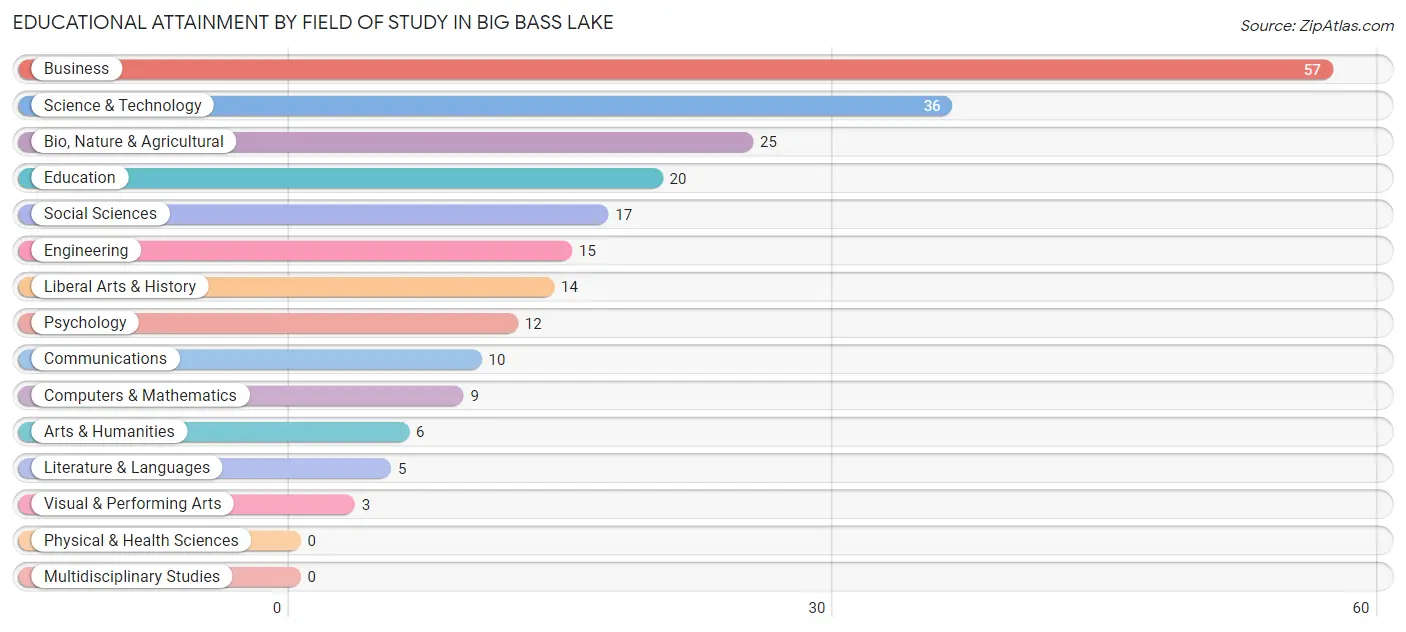
Educational Attainment by Field of Study in Big Bass Lake
Business (57 | 24.9%), science & technology (36 | 15.7%), bio, nature & agricultural (25 | 10.9%), education (20 | 8.7%), and social sciences (17 | 7.4%) are the most common fields of study among 229 individuals in Big Bass Lake who have obtained a bachelor's degree or higher.
| Field of Study | # Graduates | % Graduates |
| Computers & Mathematics | 9 | 3.9% |
| Bio, Nature & Agricultural | 25 | 10.9% |
| Physical & Health Sciences | 0 | 0.0% |
| Psychology | 12 | 5.2% |
| Social Sciences | 17 | 7.4% |
| Engineering | 15 | 6.6% |
| Multidisciplinary Studies | 0 | 0.0% |
| Science & Technology | 36 | 15.7% |
| Business | 57 | 24.9% |
| Education | 20 | 8.7% |
| Literature & Languages | 5 | 2.2% |
| Liberal Arts & History | 14 | 6.1% |
| Visual & Performing Arts | 3 | 1.3% |
| Communications | 10 | 4.4% |
| Arts & Humanities | 6 | 2.6% |
| Total | 229 | 100.0% |
Transportation & Commute in Big Bass Lake
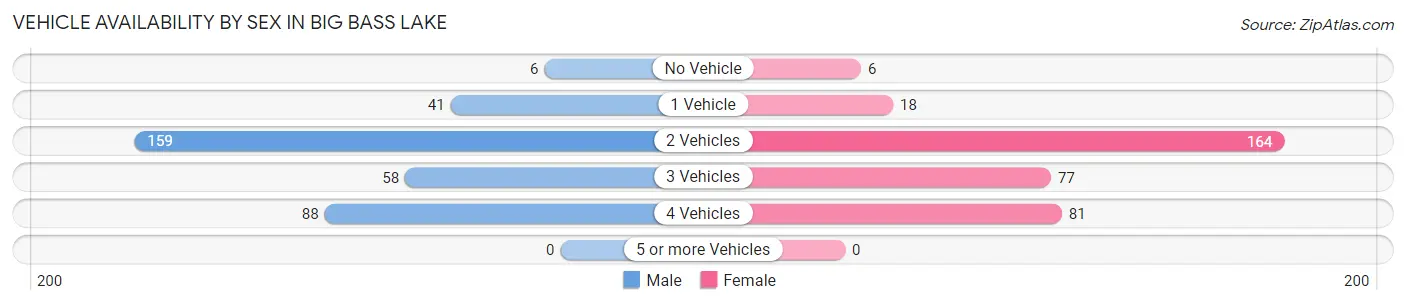
Vehicle Availability by Sex in Big Bass Lake
The most prevalent vehicle ownership categories in Big Bass Lake are males with 2 vehicles (159, accounting for 45.2%) and females with 2 vehicles (164, making up 46.0%).
| Vehicles Available | Male | Female |
| No Vehicle | 6 (1.7%) | 6 (1.7%) |
| 1 Vehicle | 41 (11.7%) | 18 (5.2%) |
| 2 Vehicles | 159 (45.2%) | 164 (47.4%) |
| 3 Vehicles | 58 (16.5%) | 77 (22.3%) |
| 4 Vehicles | 88 (25.0%) | 81 (23.4%) |
| 5 or more Vehicles | 0 (0.0%) | 0 (0.0%) |
| Total | 352 (100.0%) | 346 (100.0%) |
Commute Time in Big Bass Lake
The most frequently occuring commute durations in Big Bass Lake are 10 to 14 minutes (167 commuters, 25.2%), 15 to 19 minutes (125 commuters, 18.9%), and 5 to 9 minutes (85 commuters, 12.8%).
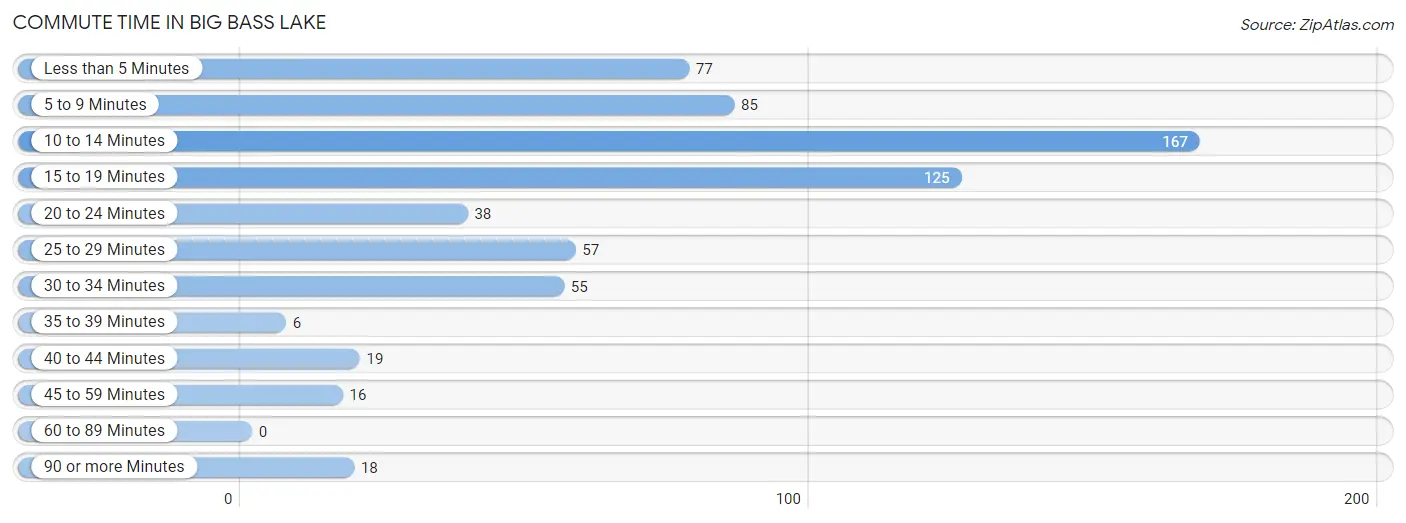
| Commute Time | # Commuters | % Commuters |
| Less than 5 Minutes | 77 | 11.6% |
| 5 to 9 Minutes | 85 | 12.8% |
| 10 to 14 Minutes | 167 | 25.2% |
| 15 to 19 Minutes | 125 | 18.9% |
| 20 to 24 Minutes | 38 | 5.7% |
| 25 to 29 Minutes | 57 | 8.6% |
| 30 to 34 Minutes | 55 | 8.3% |
| 35 to 39 Minutes | 6 | 0.9% |
| 40 to 44 Minutes | 19 | 2.9% |
| 45 to 59 Minutes | 16 | 2.4% |
| 60 to 89 Minutes | 0 | 0.0% |
| 90 or more Minutes | 18 | 2.7% |
Commute Time by Sex in Big Bass Lake
The most common commute times in Big Bass Lake are 15 to 19 minutes (95 commuters, 27.0%) for males and 10 to 14 minutes (89 commuters, 28.6%) for females.
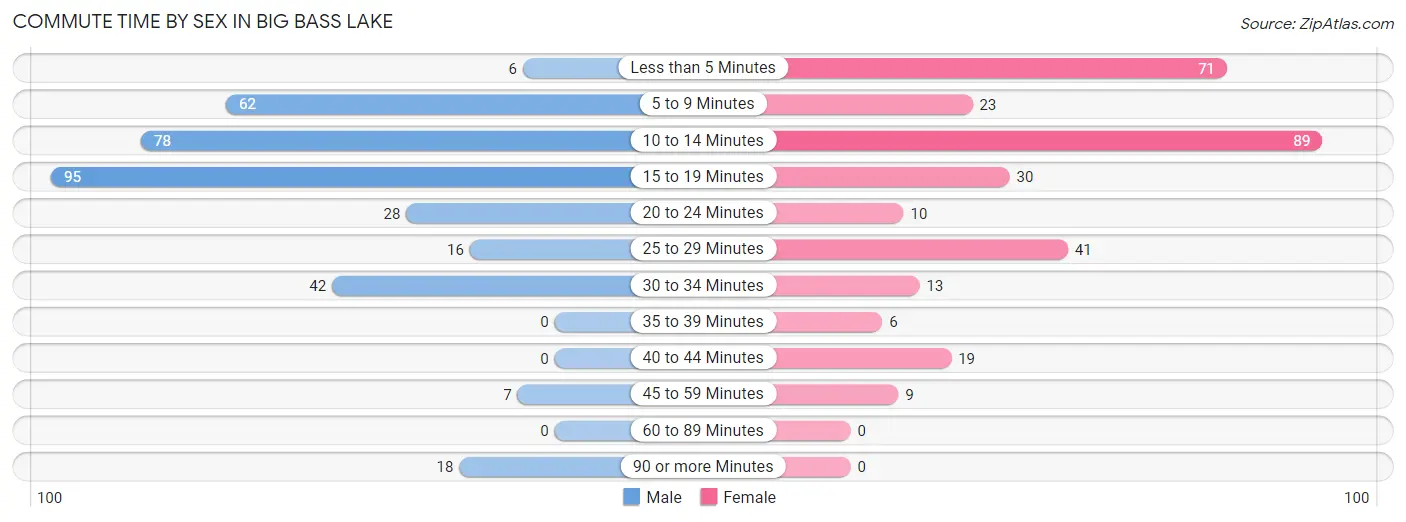
| Commute Time | Male | Female |
| Less than 5 Minutes | 6 (1.7%) | 71 (22.8%) |
| 5 to 9 Minutes | 62 (17.6%) | 23 (7.4%) |
| 10 to 14 Minutes | 78 (22.2%) | 89 (28.6%) |
| 15 to 19 Minutes | 95 (27.0%) | 30 (9.7%) |
| 20 to 24 Minutes | 28 (8.0%) | 10 (3.2%) |
| 25 to 29 Minutes | 16 (4.5%) | 41 (13.2%) |
| 30 to 34 Minutes | 42 (11.9%) | 13 (4.2%) |
| 35 to 39 Minutes | 0 (0.0%) | 6 (1.9%) |
| 40 to 44 Minutes | 0 (0.0%) | 19 (6.1%) |
| 45 to 59 Minutes | 7 (2.0%) | 9 (2.9%) |
| 60 to 89 Minutes | 0 (0.0%) | 0 (0.0%) |
| 90 or more Minutes | 18 (5.1%) | 0 (0.0%) |
Time of Departure to Work by Sex in Big Bass Lake
The most frequent times of departure to work in Big Bass Lake are 6:00 AM to 6:29 AM (107, 30.4%) for males and 4:00 PM to 11:59 PM (86, 27.7%) for females.
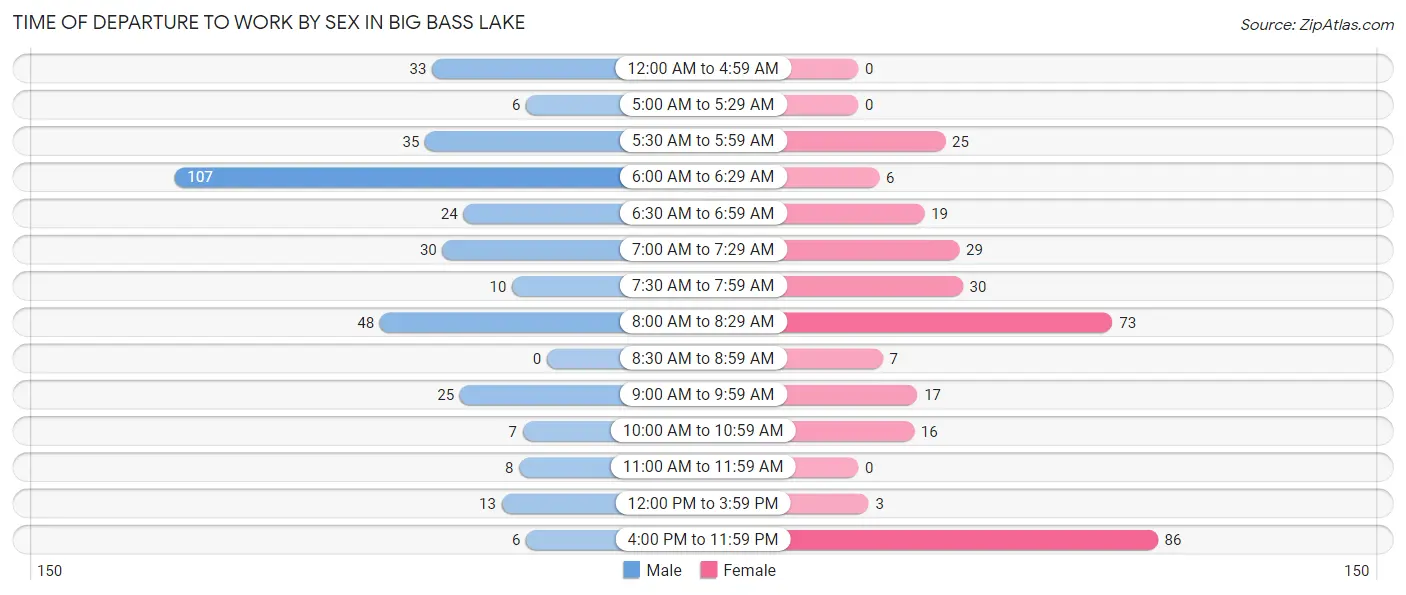
| Time of Departure | Male | Female |
| 12:00 AM to 4:59 AM | 33 (9.4%) | 0 (0.0%) |
| 5:00 AM to 5:29 AM | 6 (1.7%) | 0 (0.0%) |
| 5:30 AM to 5:59 AM | 35 (9.9%) | 25 (8.0%) |
| 6:00 AM to 6:29 AM | 107 (30.4%) | 6 (1.9%) |
| 6:30 AM to 6:59 AM | 24 (6.8%) | 19 (6.1%) |
| 7:00 AM to 7:29 AM | 30 (8.5%) | 29 (9.3%) |
| 7:30 AM to 7:59 AM | 10 (2.8%) | 30 (9.7%) |
| 8:00 AM to 8:29 AM | 48 (13.6%) | 73 (23.5%) |
| 8:30 AM to 8:59 AM | 0 (0.0%) | 7 (2.2%) |
| 9:00 AM to 9:59 AM | 25 (7.1%) | 17 (5.5%) |
| 10:00 AM to 10:59 AM | 7 (2.0%) | 16 (5.1%) |
| 11:00 AM to 11:59 AM | 8 (2.3%) | 0 (0.0%) |
| 12:00 PM to 3:59 PM | 13 (3.7%) | 3 (1.0%) |
| 4:00 PM to 11:59 PM | 6 (1.7%) | 86 (27.7%) |
| Total | 352 (100.0%) | 311 (100.0%) |
Housing Occupancy in Big Bass Lake
Occupancy by Ownership in Big Bass Lake
Of the total 546 dwellings in Big Bass Lake, owner-occupied units account for 498 (91.2%), while renter-occupied units make up 48 (8.8%).
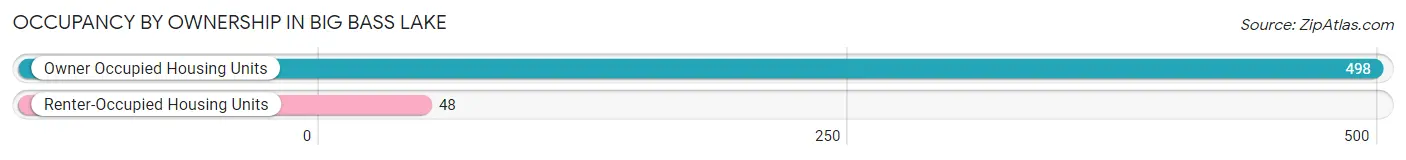
| Occupancy | # Housing Units | % Housing Units |
| Owner Occupied Housing Units | 498 | 91.2% |
| Renter-Occupied Housing Units | 48 | 8.8% |
| Total Occupied Housing Units | 546 | 100.0% |
Occupancy by Household Size in Big Bass Lake
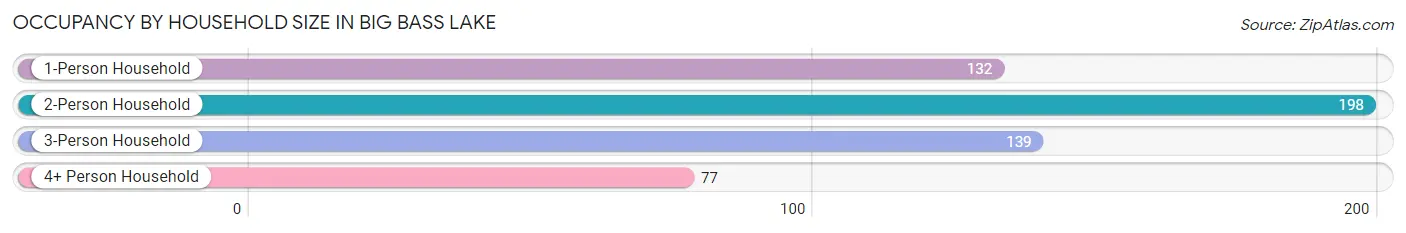
| Household Size | # Housing Units | % Housing Units |
| 1-Person Household | 132 | 24.2% |
| 2-Person Household | 198 | 36.3% |
| 3-Person Household | 139 | 25.5% |
| 4+ Person Household | 77 | 14.1% |
| Total Housing Units | 546 | 100.0% |
Occupancy by Ownership by Household Size in Big Bass Lake
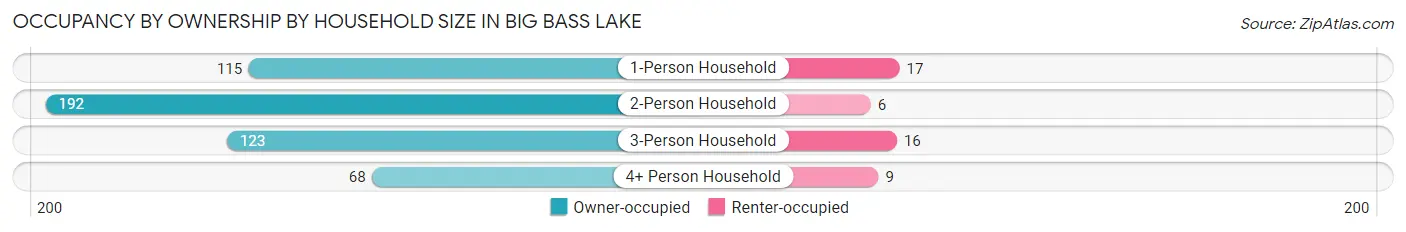
| Household Size | Owner-occupied | Renter-occupied |
| 1-Person Household | 115 (87.1%) | 17 (12.9%) |
| 2-Person Household | 192 (97.0%) | 6 (3.0%) |
| 3-Person Household | 123 (88.5%) | 16 (11.5%) |
| 4+ Person Household | 68 (88.3%) | 9 (11.7%) |
| Total Housing Units | 498 (91.2%) | 48 (8.8%) |
Occupancy by Educational Attainment in Big Bass Lake
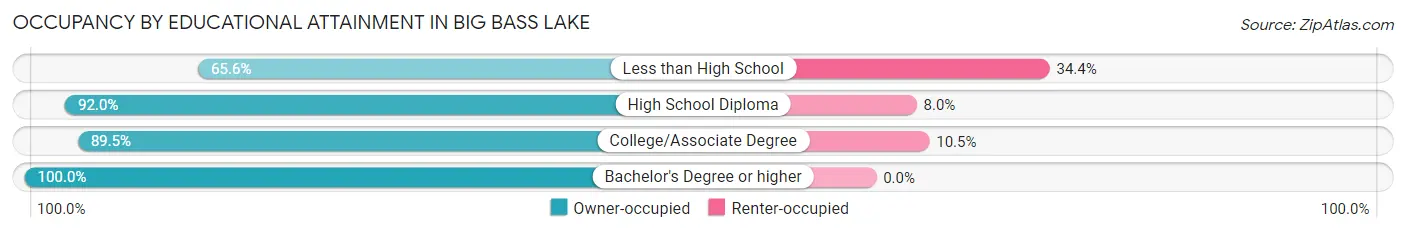
| Household Size | Owner-occupied | Renter-occupied |
| Less than High School | 21 (65.6%) | 11 (34.4%) |
| High School Diploma | 195 (92.0%) | 17 (8.0%) |
| College/Associate Degree | 170 (89.5%) | 20 (10.5%) |
| Bachelor's Degree or higher | 112 (100.0%) | 0 (0.0%) |
Occupancy by Age of Householder in Big Bass Lake
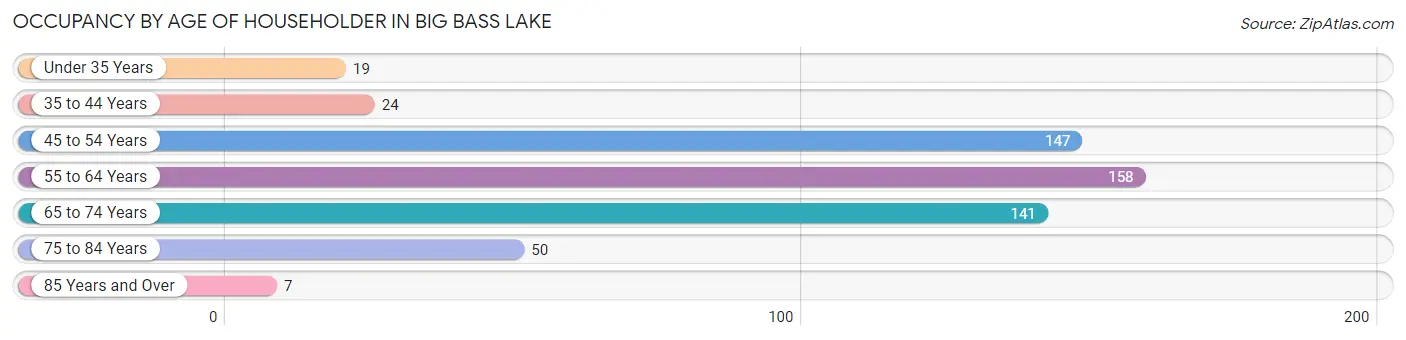
| Age Bracket | # Households | % Households |
| Under 35 Years | 19 | 3.5% |
| 35 to 44 Years | 24 | 4.4% |
| 45 to 54 Years | 147 | 26.9% |
| 55 to 64 Years | 158 | 28.9% |
| 65 to 74 Years | 141 | 25.8% |
| 75 to 84 Years | 50 | 9.2% |
| 85 Years and Over | 7 | 1.3% |
| Total | 546 | 100.0% |
Housing Finances in Big Bass Lake
Median Income by Occupancy in Big Bass Lake
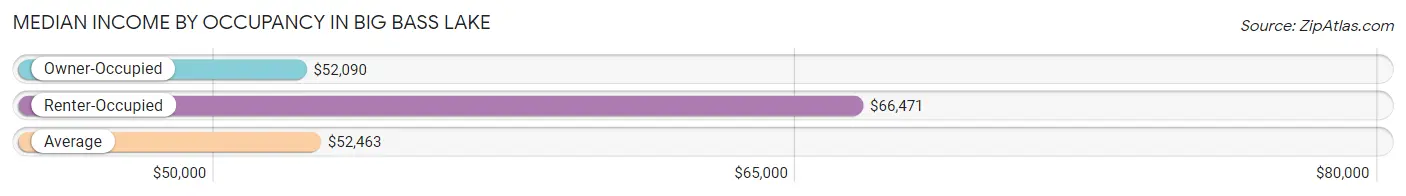
| Occupancy Type | # Households | Median Income |
| Owner-Occupied | 498 (91.2%) | $52,090 |
| Renter-Occupied | 48 (8.8%) | $66,471 |
| Average | 546 (100.0%) | $52,463 |
Occupancy by Householder Income Bracket in Big Bass Lake
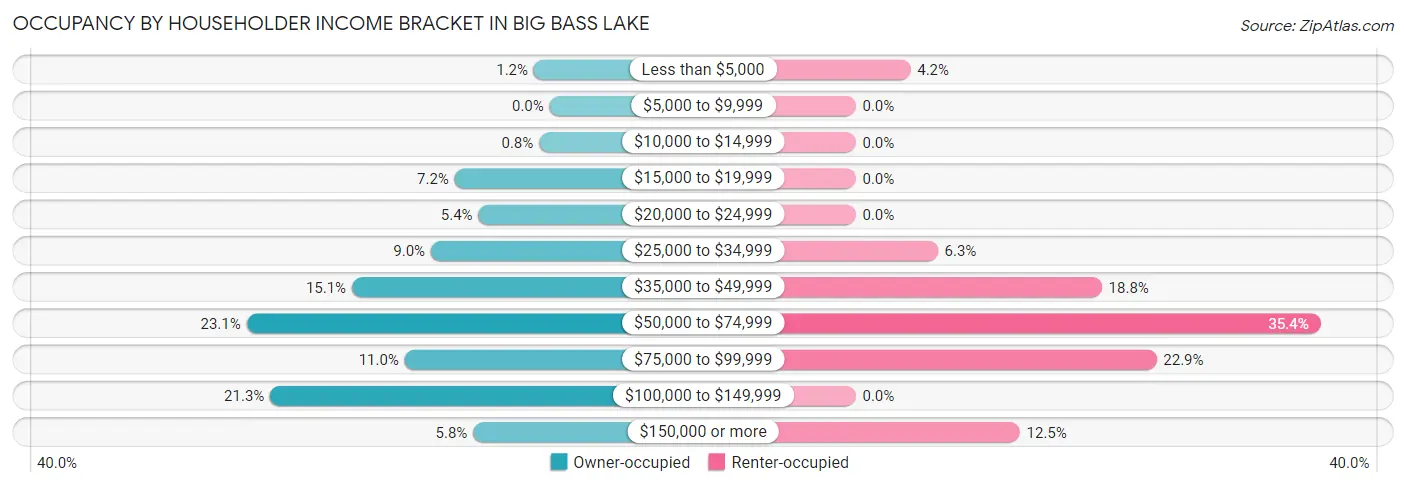
| Income Bracket | Owner-occupied | Renter-occupied |
| Less than $5,000 | 6 (1.2%) | 2 (4.2%) |
| $5,000 to $9,999 | 0 (0.0%) | 0 (0.0%) |
| $10,000 to $14,999 | 4 (0.8%) | 0 (0.0%) |
| $15,000 to $19,999 | 36 (7.2%) | 0 (0.0%) |
| $20,000 to $24,999 | 27 (5.4%) | 0 (0.0%) |
| $25,000 to $34,999 | 45 (9.0%) | 3 (6.2%) |
| $35,000 to $49,999 | 75 (15.1%) | 9 (18.8%) |
| $50,000 to $74,999 | 115 (23.1%) | 17 (35.4%) |
| $75,000 to $99,999 | 55 (11.0%) | 11 (22.9%) |
| $100,000 to $149,999 | 106 (21.3%) | 0 (0.0%) |
| $150,000 or more | 29 (5.8%) | 6 (12.5%) |
| Total | 498 (100.0%) | 48 (100.0%) |
Monthly Housing Cost Tiers in Big Bass Lake
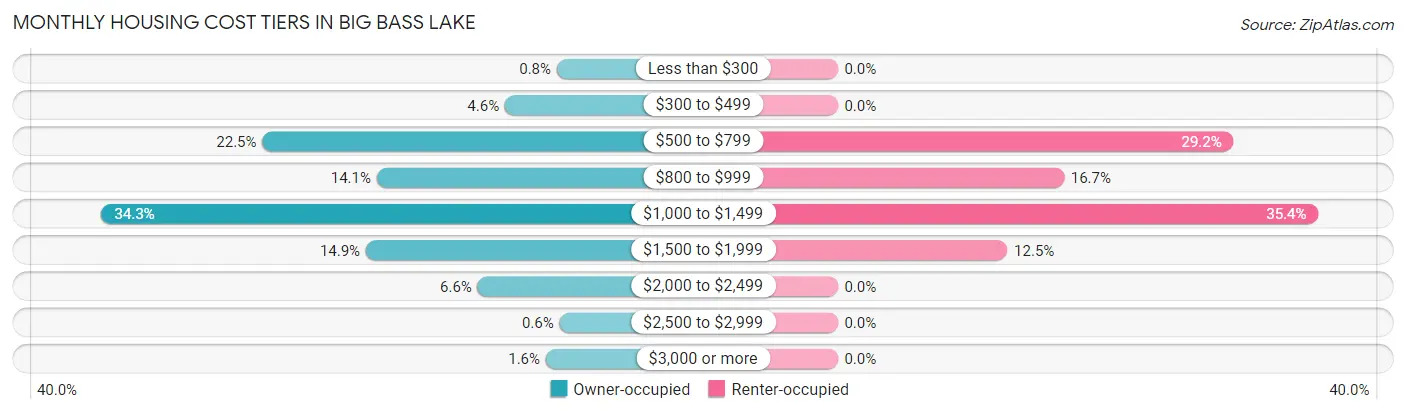
| Monthly Cost | Owner-occupied | Renter-occupied |
| Less than $300 | 4 (0.8%) | 0 (0.0%) |
| $300 to $499 | 23 (4.6%) | 0 (0.0%) |
| $500 to $799 | 112 (22.5%) | 14 (29.2%) |
| $800 to $999 | 70 (14.1%) | 8 (16.7%) |
| $1,000 to $1,499 | 171 (34.3%) | 17 (35.4%) |
| $1,500 to $1,999 | 74 (14.9%) | 6 (12.5%) |
| $2,000 to $2,499 | 33 (6.6%) | 0 (0.0%) |
| $2,500 to $2,999 | 3 (0.6%) | 0 (0.0%) |
| $3,000 or more | 8 (1.6%) | 0 (0.0%) |
| Total | 498 (100.0%) | 48 (100.0%) |
Physical Housing Characteristics in Big Bass Lake
Housing Structures in Big Bass Lake
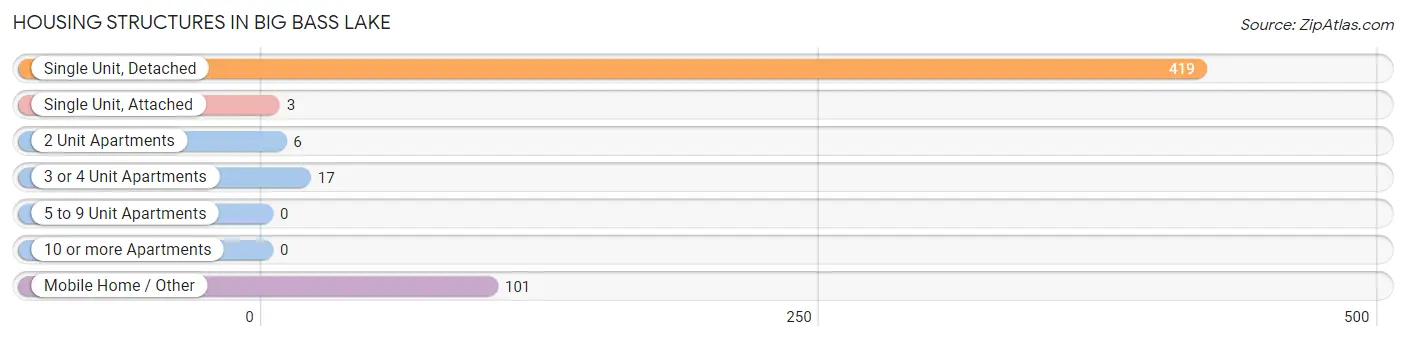
| Structure Type | # Housing Units | % Housing Units |
| Single Unit, Detached | 419 | 76.7% |
| Single Unit, Attached | 3 | 0.5% |
| 2 Unit Apartments | 6 | 1.1% |
| 3 or 4 Unit Apartments | 17 | 3.1% |
| 5 to 9 Unit Apartments | 0 | 0.0% |
| 10 or more Apartments | 0 | 0.0% |
| Mobile Home / Other | 101 | 18.5% |
| Total | 546 | 100.0% |
Housing Structures by Occupancy in Big Bass Lake
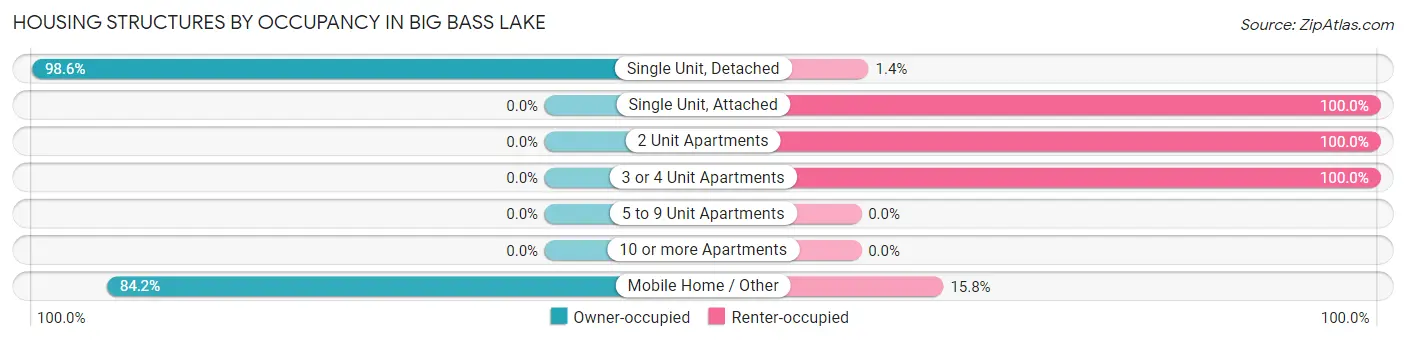
| Structure Type | Owner-occupied | Renter-occupied |
| Single Unit, Detached | 413 (98.6%) | 6 (1.4%) |
| Single Unit, Attached | 0 (0.0%) | 3 (100.0%) |
| 2 Unit Apartments | 0 (0.0%) | 6 (100.0%) |
| 3 or 4 Unit Apartments | 0 (0.0%) | 17 (100.0%) |
| 5 to 9 Unit Apartments | 0 (0.0%) | 0 (0.0%) |
| 10 or more Apartments | 0 (0.0%) | 0 (0.0%) |
| Mobile Home / Other | 85 (84.2%) | 16 (15.8%) |
| Total | 498 (91.2%) | 48 (8.8%) |
Housing Structures by Number of Rooms in Big Bass Lake
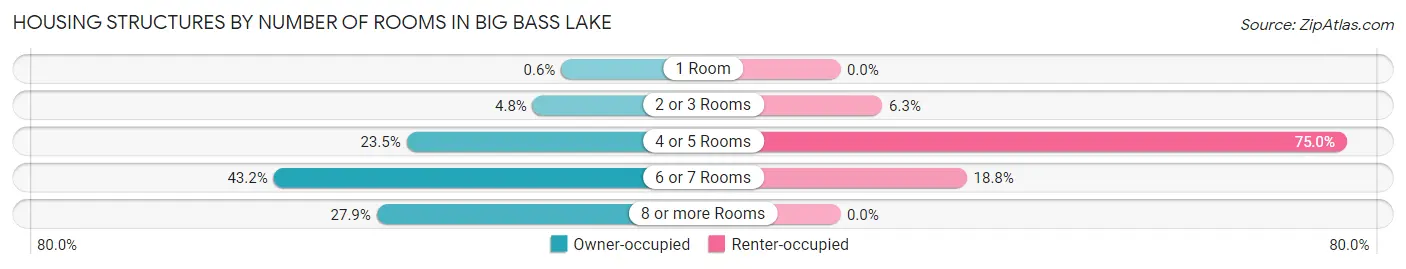
| Number of Rooms | Owner-occupied | Renter-occupied |
| 1 Room | 3 (0.6%) | 0 (0.0%) |
| 2 or 3 Rooms | 24 (4.8%) | 3 (6.2%) |
| 4 or 5 Rooms | 117 (23.5%) | 36 (75.0%) |
| 6 or 7 Rooms | 215 (43.2%) | 9 (18.8%) |
| 8 or more Rooms | 139 (27.9%) | 0 (0.0%) |
| Total | 498 (100.0%) | 48 (100.0%) |
Housing Structure by Heating Type in Big Bass Lake
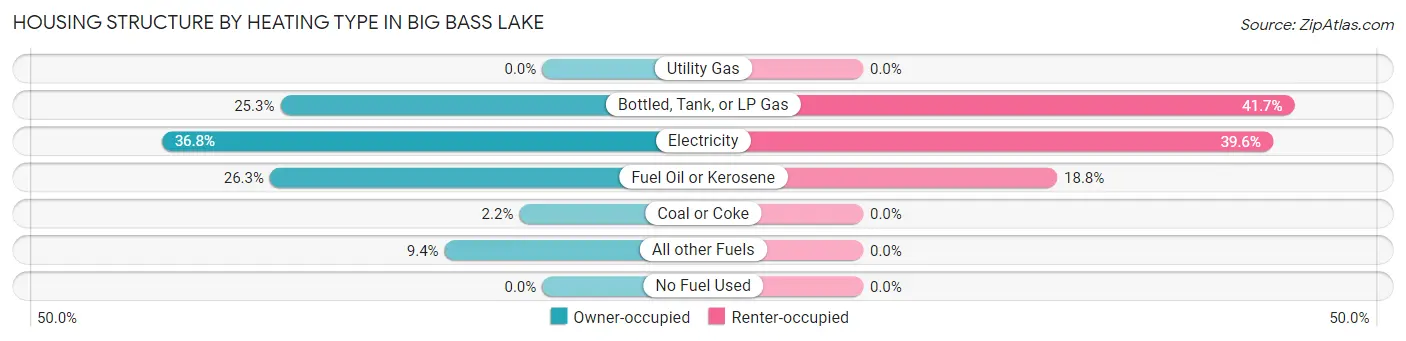
| Heating Type | Owner-occupied | Renter-occupied |
| Utility Gas | 0 (0.0%) | 0 (0.0%) |
| Bottled, Tank, or LP Gas | 126 (25.3%) | 20 (41.7%) |
| Electricity | 183 (36.7%) | 19 (39.6%) |
| Fuel Oil or Kerosene | 131 (26.3%) | 9 (18.8%) |
| Coal or Coke | 11 (2.2%) | 0 (0.0%) |
| All other Fuels | 47 (9.4%) | 0 (0.0%) |
| No Fuel Used | 0 (0.0%) | 0 (0.0%) |
| Total | 498 (100.0%) | 48 (100.0%) |
Household Vehicle Usage in Big Bass Lake
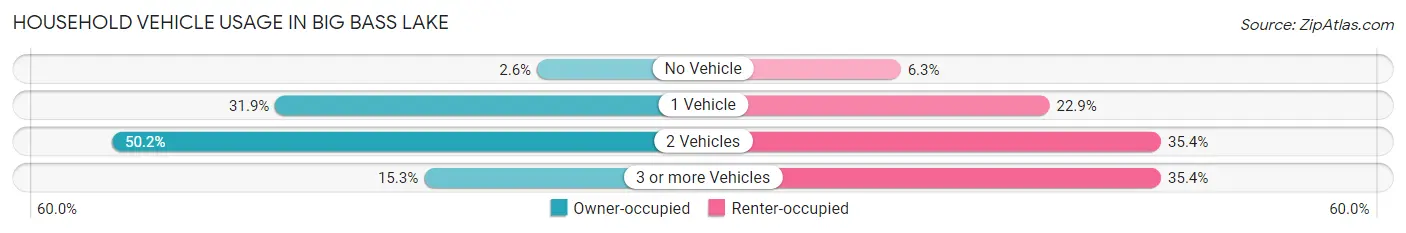
| Vehicles per Household | Owner-occupied | Renter-occupied |
| No Vehicle | 13 (2.6%) | 3 (6.2%) |
| 1 Vehicle | 159 (31.9%) | 11 (22.9%) |
| 2 Vehicles | 250 (50.2%) | 17 (35.4%) |
| 3 or more Vehicles | 76 (15.3%) | 17 (35.4%) |
| Total | 498 (100.0%) | 48 (100.0%) |
Real Estate & Mortgages in Big Bass Lake
Real Estate and Mortgage Overview in Big Bass Lake
| Characteristic | Without Mortgage | With Mortgage |
| Housing Units | 211 | 287 |
| Median Property Value | $160,800 | $191,300 |
| Median Household Income | $51,719 | $11 |
| Monthly Housing Costs | $712 | $8 |
| Real Estate Taxes | $3,286 | $0 |
Property Value by Mortgage Status in Big Bass Lake
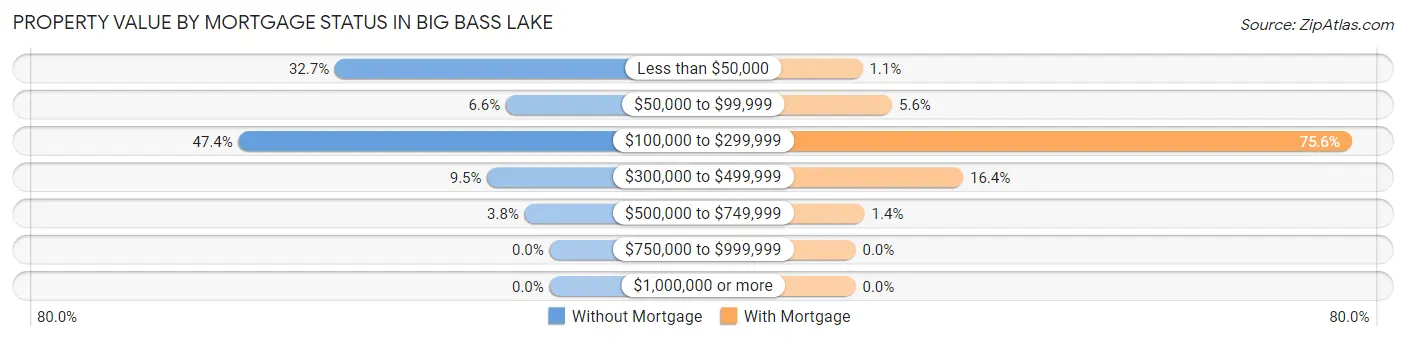
| Property Value | Without Mortgage | With Mortgage |
| Less than $50,000 | 69 (32.7%) | 3 (1.1%) |
| $50,000 to $99,999 | 14 (6.6%) | 16 (5.6%) |
| $100,000 to $299,999 | 100 (47.4%) | 217 (75.6%) |
| $300,000 to $499,999 | 20 (9.5%) | 47 (16.4%) |
| $500,000 to $749,999 | 8 (3.8%) | 4 (1.4%) |
| $750,000 to $999,999 | 0 (0.0%) | 0 (0.0%) |
| $1,000,000 or more | 0 (0.0%) | 0 (0.0%) |
| Total | 211 (100.0%) | 287 (100.0%) |
Household Income by Mortgage Status in Big Bass Lake
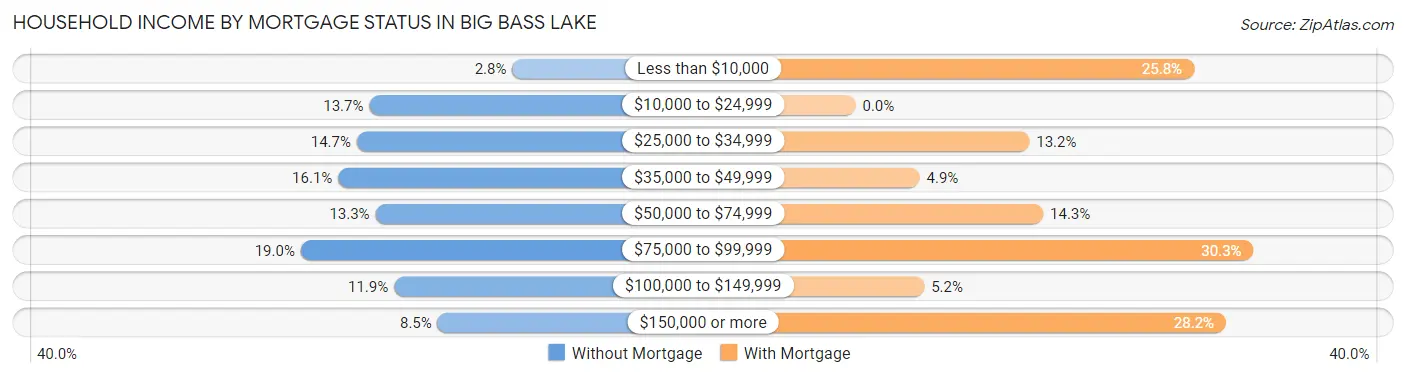
| Household Income | Without Mortgage | With Mortgage |
| Less than $10,000 | 6 (2.8%) | 74 (25.8%) |
| $10,000 to $24,999 | 29 (13.7%) | 0 (0.0%) |
| $25,000 to $34,999 | 31 (14.7%) | 38 (13.2%) |
| $35,000 to $49,999 | 34 (16.1%) | 14 (4.9%) |
| $50,000 to $74,999 | 28 (13.3%) | 41 (14.3%) |
| $75,000 to $99,999 | 40 (19.0%) | 87 (30.3%) |
| $100,000 to $149,999 | 25 (11.8%) | 15 (5.2%) |
| $150,000 or more | 18 (8.5%) | 81 (28.2%) |
| Total | 211 (100.0%) | 287 (100.0%) |
Property Value to Household Income Ratio in Big Bass Lake
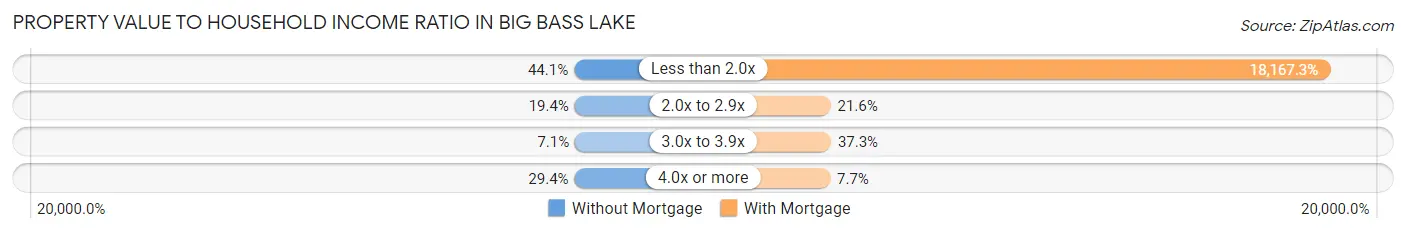
| Value-to-Income Ratio | Without Mortgage | With Mortgage |
| Less than 2.0x | 93 (44.1%) | 52,140 (18,167.3%) |
| 2.0x to 2.9x | 41 (19.4%) | 62 (21.6%) |
| 3.0x to 3.9x | 15 (7.1%) | 107 (37.3%) |
| 4.0x or more | 62 (29.4%) | 22 (7.7%) |
| Total | 211 (100.0%) | 287 (100.0%) |
Real Estate Taxes by Mortgage Status in Big Bass Lake
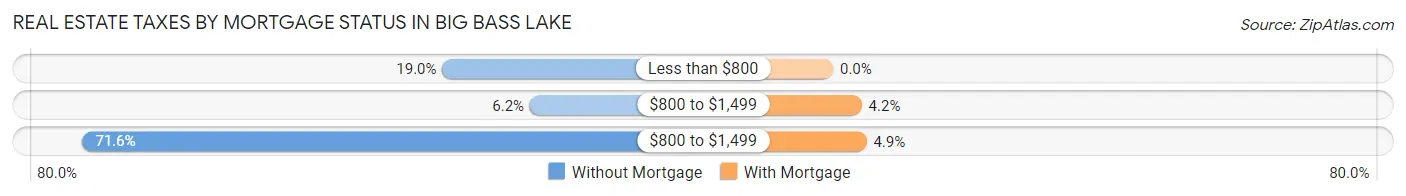
| Property Taxes | Without Mortgage | With Mortgage |
| Less than $800 | 40 (19.0%) | 0 (0.0%) |
| $800 to $1,499 | 13 (6.2%) | 12 (4.2%) |
| $800 to $1,499 | 151 (71.6%) | 14 (4.9%) |
| Total | 211 (100.0%) | 287 (100.0%) |
Health & Disability in Big Bass Lake
Health Insurance Coverage by Age in Big Bass Lake
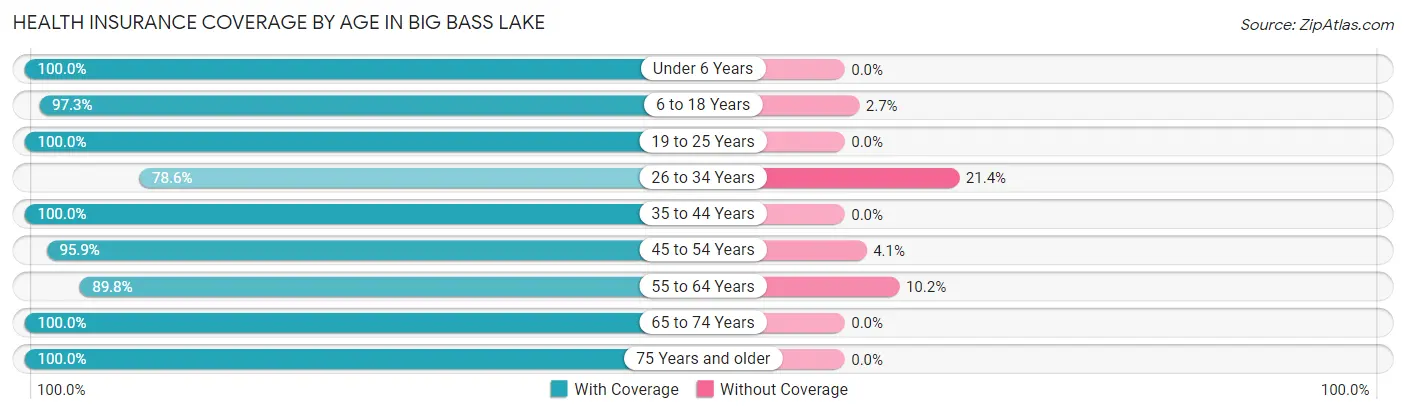
| Age Bracket | With Coverage | Without Coverage |
| Under 6 Years | 39 (100.0%) | 0 (0.0%) |
| 6 to 18 Years | 215 (97.3%) | 6 (2.7%) |
| 19 to 25 Years | 56 (100.0%) | 0 (0.0%) |
| 26 to 34 Years | 92 (78.6%) | 25 (21.4%) |
| 35 to 44 Years | 123 (100.0%) | 0 (0.0%) |
| 45 to 54 Years | 282 (95.9%) | 12 (4.1%) |
| 55 to 64 Years | 229 (89.8%) | 26 (10.2%) |
| 65 to 74 Years | 210 (100.0%) | 0 (0.0%) |
| 75 Years and older | 105 (100.0%) | 0 (0.0%) |
| Total | 1,351 (95.1%) | 69 (4.9%) |
Health Insurance Coverage by Citizenship Status in Big Bass Lake
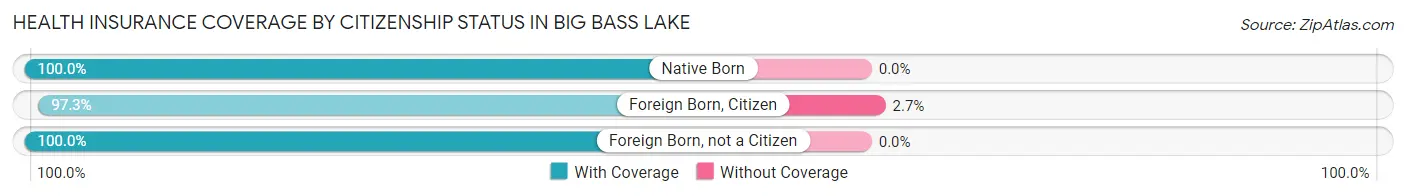
| Citizenship Status | With Coverage | Without Coverage |
| Native Born | 39 (100.0%) | 0 (0.0%) |
| Foreign Born, Citizen | 215 (97.3%) | 6 (2.7%) |
| Foreign Born, not a Citizen | 56 (100.0%) | 0 (0.0%) |
Health Insurance Coverage by Household Income in Big Bass Lake
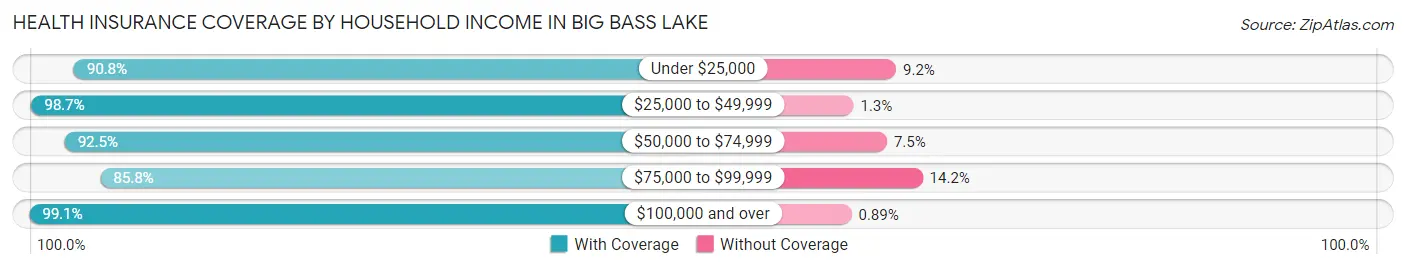
| Household Income | With Coverage | Without Coverage |
| Under $25,000 | 118 (90.8%) | 12 (9.2%) |
| $25,000 to $49,999 | 235 (98.7%) | 3 (1.3%) |
| $50,000 to $74,999 | 283 (92.5%) | 23 (7.5%) |
| $75,000 to $99,999 | 157 (85.8%) | 26 (14.2%) |
| $100,000 and over | 556 (99.1%) | 5 (0.9%) |
Public vs Private Health Insurance Coverage by Age in Big Bass Lake
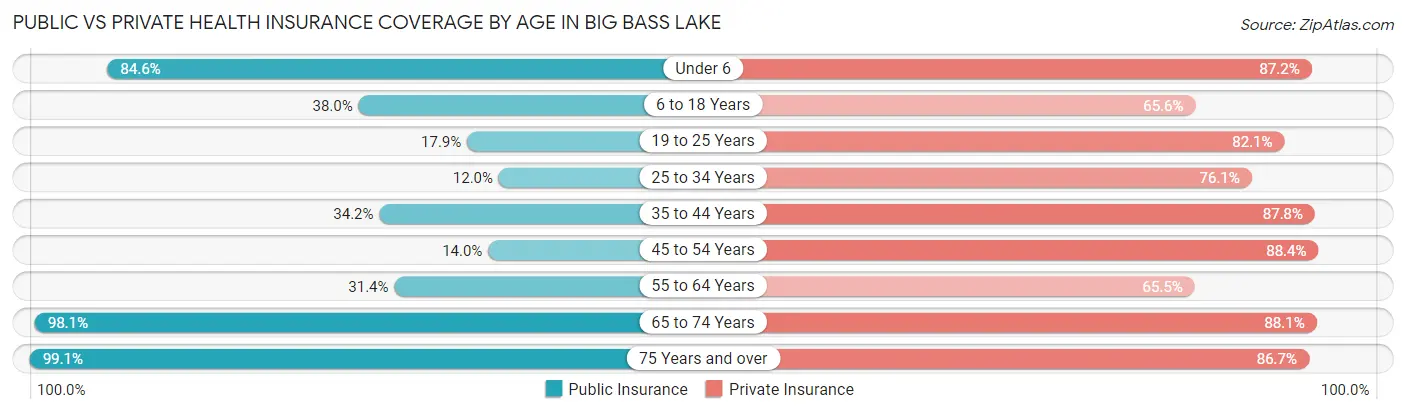
| Age Bracket | Public Insurance | Private Insurance |
| Under 6 | 33 (84.6%) | 34 (87.2%) |
| 6 to 18 Years | 84 (38.0%) | 145 (65.6%) |
| 19 to 25 Years | 10 (17.9%) | 46 (82.1%) |
| 25 to 34 Years | 14 (12.0%) | 89 (76.1%) |
| 35 to 44 Years | 42 (34.2%) | 108 (87.8%) |
| 45 to 54 Years | 41 (14.0%) | 260 (88.4%) |
| 55 to 64 Years | 80 (31.4%) | 167 (65.5%) |
| 65 to 74 Years | 206 (98.1%) | 185 (88.1%) |
| 75 Years and over | 104 (99.1%) | 91 (86.7%) |
| Total | 614 (43.2%) | 1,125 (79.2%) |
Disability Status by Sex by Age in Big Bass Lake
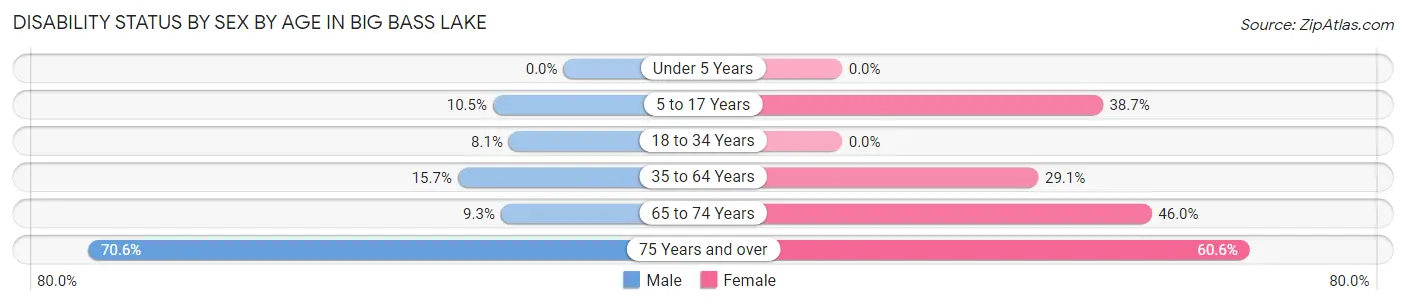
| Age Bracket | Male | Female |
| Under 5 Years | 0 (0.0%) | 0 (0.0%) |
| 5 to 17 Years | 11 (10.5%) | 48 (38.7%) |
| 18 to 34 Years | 3 (8.1%) | 0 (0.0%) |
| 35 to 64 Years | 58 (15.7%) | 88 (29.1%) |
| 65 to 74 Years | 8 (9.3%) | 57 (46.0%) |
| 75 Years and over | 24 (70.6%) | 43 (60.6%) |
Disability Class by Sex by Age in Big Bass Lake
Disability Class: Hearing Difficulty
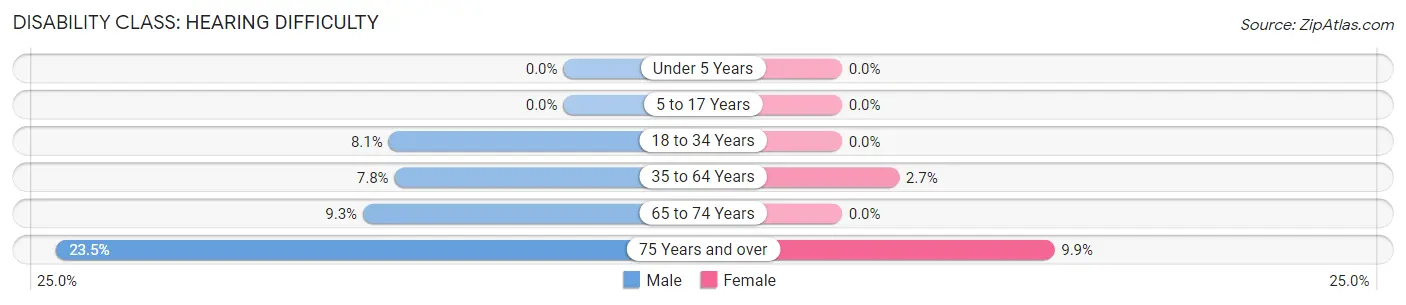
| Age Bracket | Male | Female |
| Under 5 Years | 0 (0.0%) | 0 (0.0%) |
| 5 to 17 Years | 0 (0.0%) | 0 (0.0%) |
| 18 to 34 Years | 3 (8.1%) | 0 (0.0%) |
| 35 to 64 Years | 29 (7.8%) | 8 (2.6%) |
| 65 to 74 Years | 8 (9.3%) | 0 (0.0%) |
| 75 Years and over | 8 (23.5%) | 7 (9.9%) |
Disability Class: Vision Difficulty
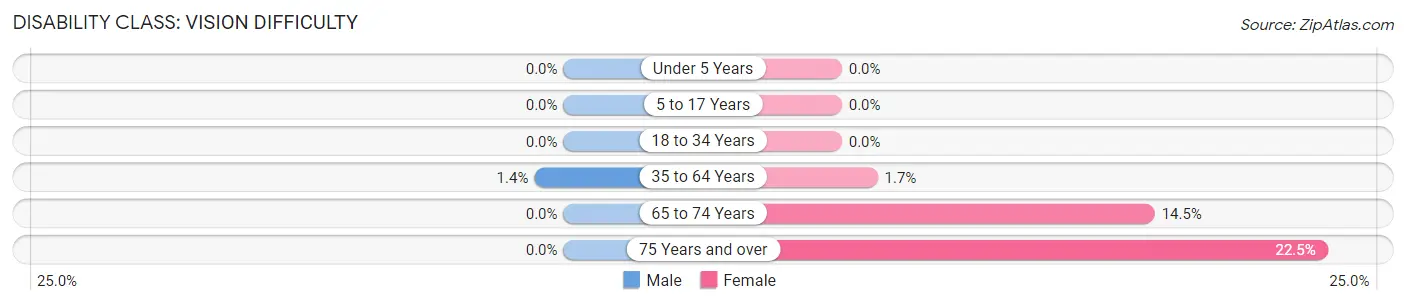
| Age Bracket | Male | Female |
| Under 5 Years | 0 (0.0%) | 0 (0.0%) |
| 5 to 17 Years | 0 (0.0%) | 0 (0.0%) |
| 18 to 34 Years | 0 (0.0%) | 0 (0.0%) |
| 35 to 64 Years | 5 (1.3%) | 5 (1.7%) |
| 65 to 74 Years | 0 (0.0%) | 18 (14.5%) |
| 75 Years and over | 0 (0.0%) | 16 (22.5%) |
Disability Class: Cognitive Difficulty
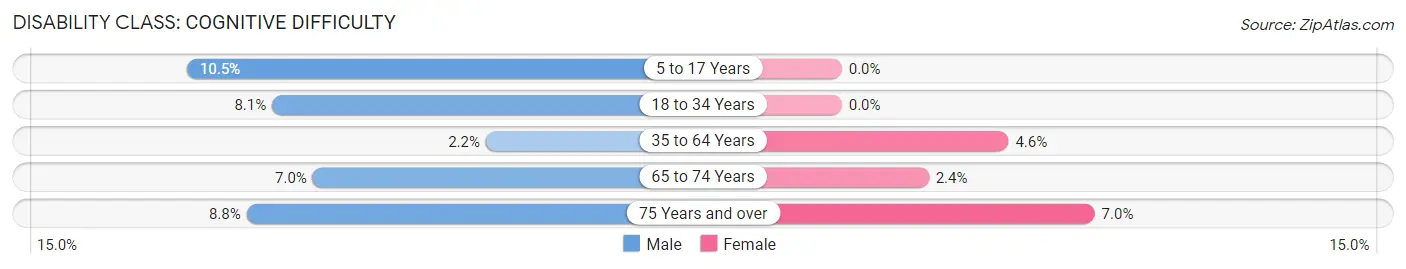
| Age Bracket | Male | Female |
| 5 to 17 Years | 11 (10.5%) | 0 (0.0%) |
| 18 to 34 Years | 3 (8.1%) | 0 (0.0%) |
| 35 to 64 Years | 8 (2.2%) | 14 (4.6%) |
| 65 to 74 Years | 6 (7.0%) | 3 (2.4%) |
| 75 Years and over | 3 (8.8%) | 5 (7.0%) |
Disability Class: Ambulatory Difficulty
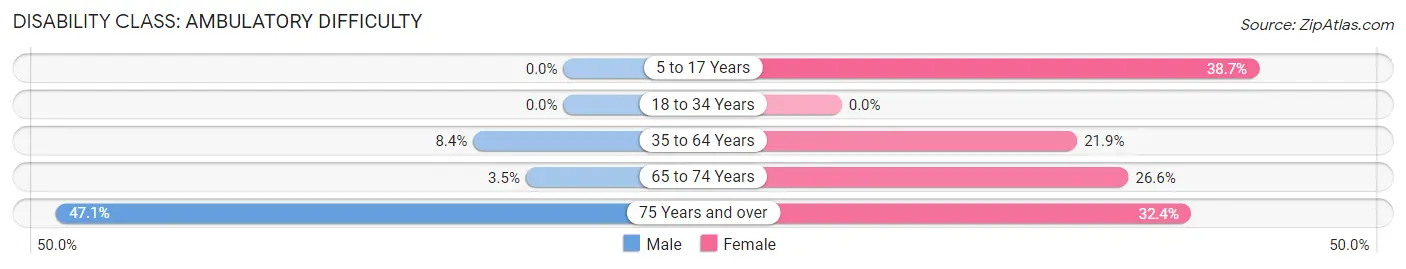
| Age Bracket | Male | Female |
| 5 to 17 Years | 0 (0.0%) | 48 (38.7%) |
| 18 to 34 Years | 0 (0.0%) | 0 (0.0%) |
| 35 to 64 Years | 31 (8.4%) | 66 (21.8%) |
| 65 to 74 Years | 3 (3.5%) | 33 (26.6%) |
| 75 Years and over | 16 (47.1%) | 23 (32.4%) |
Disability Class: Self-Care Difficulty
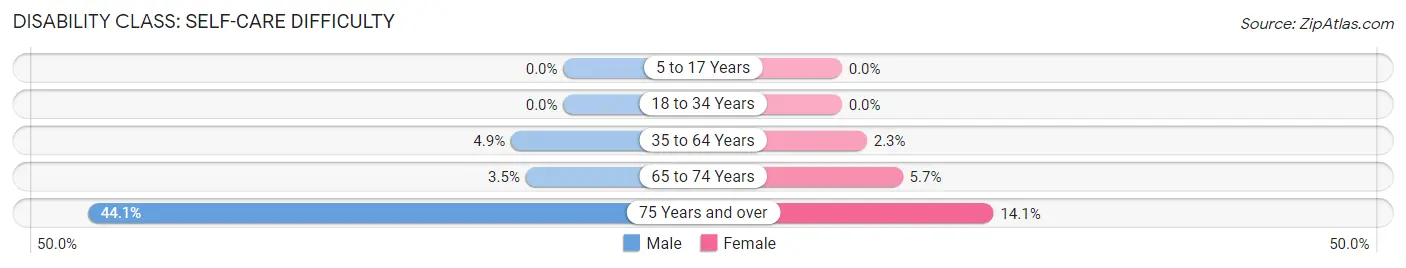
| Age Bracket | Male | Female |
| 5 to 17 Years | 0 (0.0%) | 0 (0.0%) |
| 18 to 34 Years | 0 (0.0%) | 0 (0.0%) |
| 35 to 64 Years | 18 (4.9%) | 7 (2.3%) |
| 65 to 74 Years | 3 (3.5%) | 7 (5.7%) |
| 75 Years and over | 15 (44.1%) | 10 (14.1%) |
Technology Access in Big Bass Lake
Computing Device Access in Big Bass Lake
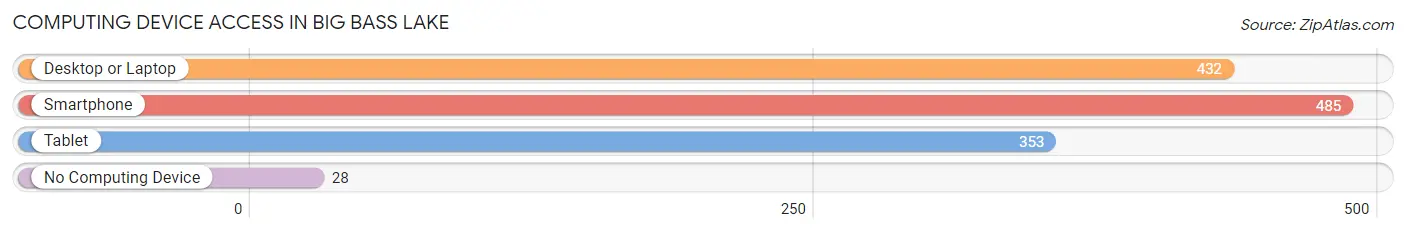
| Device Type | # Households | % Households |
| Desktop or Laptop | 432 | 79.1% |
| Smartphone | 485 | 88.8% |
| Tablet | 353 | 64.6% |
| No Computing Device | 28 | 5.1% |
| Total | 546 | 100.0% |
Internet Access in Big Bass Lake

| Internet Type | # Households | % Households |
| Dial-Up Internet | 12 | 2.2% |
| Broadband Home | 420 | 76.9% |
| Cellular Data Only | 41 | 7.5% |
| Satellite Internet | 16 | 2.9% |
| No Internet | 44 | 8.1% |
| Total | 546 | 100.0% |
Big Bass Lake Summary
Bass Lake, Pennsylvania is a small, rural community located in the Pocono Mountains of northeastern Pennsylvania. It is situated in Wayne County, approximately two hours from Philadelphia and two and a half hours from New York City. The lake itself is a natural glacial lake, and is the largest natural lake in the state. It is a popular destination for fishing, swimming, boating, and other recreational activities.
History
The area around Bass Lake has been inhabited for thousands of years. Native American tribes, including the Lenape, Susquehannock, and Iroquois, were the first to inhabit the area. The first European settlers arrived in the area in the late 1700s, and the lake was named after the large population of bass fish that were found in the lake.
In the early 1800s, the area around Bass Lake began to be developed for logging and farming. The lake was also used for recreational activities, such as fishing and swimming. In the late 1800s, the lake became a popular destination for vacationers, and several resorts were built around the lake.
In the early 1900s, the lake was used for hydroelectric power generation. The lake was dammed in the 1920s, and the resulting lake was used to generate electricity for the surrounding area. The lake was also used for recreational activities, such as fishing, swimming, and boating.
In the 1950s, the lake was used for recreational activities, such as fishing, swimming, and boating. The lake was also used for hydroelectric power generation. In the 1970s, the lake was used for recreational activities, such as fishing, swimming, and boating.
Geography
Bass Lake is located in the Pocono Mountains of northeastern Pennsylvania. The lake is approximately two miles long and one mile wide. The lake is surrounded by forests and mountains, and is a popular destination for fishing, swimming, boating, and other recreational activities.
The lake is fed by several small streams, and is drained by the Lackawaxen River. The lake is also connected to the Delaware River by a canal. The lake is located at an elevation of 1,400 feet above sea level.
Economy
The economy of Bass Lake is largely based on tourism and recreation. The lake is a popular destination for fishing, swimming, boating, and other recreational activities. The lake is also used for hydroelectric power generation.
The area around Bass Lake is also home to several small businesses, including restaurants, lodging, and retail stores. The area is also home to several small farms, which produce a variety of crops, including corn, soybeans, and hay.
Demographics
As of the 2010 census, the population of Bass Lake was 1,845. The population is largely white (94.3%), with small percentages of African American (2.2%), Asian (1.2%), and Hispanic (1.2%) residents. The median household income is $45,000, and the median home value is $150,000.
Conclusion
Bass Lake, Pennsylvania is a small, rural community located in the Pocono Mountains of northeastern Pennsylvania. It is a popular destination for fishing, swimming, boating, and other recreational activities. The economy of Bass Lake is largely based on tourism and recreation, and the area is also home to several small businesses and farms. The population of Bass Lake is largely white, with small percentages of African American, Asian, and Hispanic residents.
Common Questions
What is Per Capita Income in Big Bass Lake?
Per Capita income in Big Bass Lake is $32,170.
What is the Median Family Income in Big Bass Lake?
Median Family Income in Big Bass Lake is $68,750.
What is the Median Household income in Big Bass Lake?
Median Household Income in Big Bass Lake is $52,463.
What is Income or Wage Gap in Big Bass Lake?
Income or Wage Gap in Big Bass Lake is 11.0%.
Women in Big Bass Lake earn 89.0 cents for every dollar earned by a man.
What is Inequality or Gini Index in Big Bass Lake?
Inequality or Gini Index in Big Bass Lake is 0.39.
What is the Total Population of Big Bass Lake?
Total Population of Big Bass Lake is 1,420.
What is the Total Male Population of Big Bass Lake?
Total Male Population of Big Bass Lake is 658.
What is the Total Female Population of Big Bass Lake?
Total Female Population of Big Bass Lake is 762.
What is the Ratio of Males per 100 Females in Big Bass Lake?
There are 86.35 Males per 100 Females in Big Bass Lake.
What is the Ratio of Females per 100 Males in Big Bass Lake?
There are 115.81 Females per 100 Males in Big Bass Lake.
What is the Median Population Age in Big Bass Lake?
Median Population Age in Big Bass Lake is 50.8 Years.
What is the Average Family Size in Big Bass Lake
Average Family Size in Big Bass Lake is 3.1 People.
What is the Average Household Size in Big Bass Lake
Average Household Size in Big Bass Lake is 2.6 People.
How Large is the Labor Force in Big Bass Lake?
There are 746 People in the Labor Forcein in Big Bass Lake.
What is the Percentage of People in the Labor Force in Big Bass Lake?
62.5% of People are in the Labor Force in Big Bass Lake.
What is the Unemployment Rate in Big Bass Lake?
Unemployment Rate in Big Bass Lake is 3.5%.