East Greenville borough, PA Map & Demographics
East Greenville borough Overview
$30,953
PER CAPITA INCOME
$83,854
AVG FAMILY INCOME
$75,417
AVG HOUSEHOLD INCOME
17.0%
WAGE / INCOME GAP [ % ]
83.0¢/ $1
WAGE / INCOME GAP [ $ ]
0.30
INEQUALITY / GINI INDEX
3,150
TOTAL POPULATION
1,651
MALE POPULATION
1,499
FEMALE POPULATION
110.14
MALES / 100 FEMALES
90.79
FEMALES / 100 MALES
32.3
MEDIAN AGE
3.2
AVG FAMILY SIZE
2.8
AVG HOUSEHOLD SIZE
1,803
LABOR FORCE [ PEOPLE ]
75.9%
PERCENT IN LABOR FORCE
3.7%
UNEMPLOYMENT RATE
Income in East Greenville borough
Income Overview in East Greenville borough
Per Capita Income in East Greenville borough is $30,953, while median incomes of families and households are $83,854 and $75,417 respectively.
| Characteristic | Number | Measure |
| Per Capita Income | 3,150 | $30,953 |
| Median Family Income | 786 | $83,854 |
| Mean Family Income | 786 | $90,009 |
| Median Household Income | 1,135 | $75,417 |
| Mean Household Income | 1,135 | $83,878 |
| Income Deficit | 786 | $0 |
| Wage / Income Gap (%) | 3,150 | 17.01% |
| Wage / Income Gap ($) | 3,150 | 82.99¢ per $1 |
| Gini / Inequality Index | 3,150 | 0.30 |
Earnings by Sex in East Greenville borough
Average Earnings in East Greenville borough are $38,095, $42,313 for men and $35,117 for women, a difference of 17.0%.
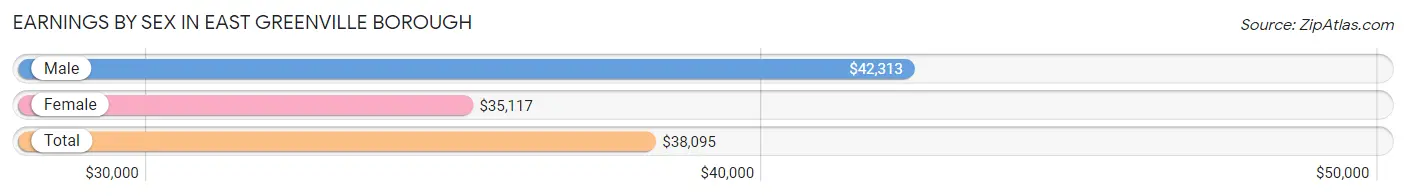
| Sex | Number | Average Earnings |
| Male | 1,035 (56.2%) | $42,313 |
| Female | 805 (43.8%) | $35,117 |
| Total | 1,840 (100.0%) | $38,095 |
Earnings by Sex by Income Bracket in East Greenville borough
The most common earnings brackets in East Greenville borough are $25,000 to $29,999 for men (130 | 12.6%) and $30,000 to $34,999 for women (131 | 16.3%).
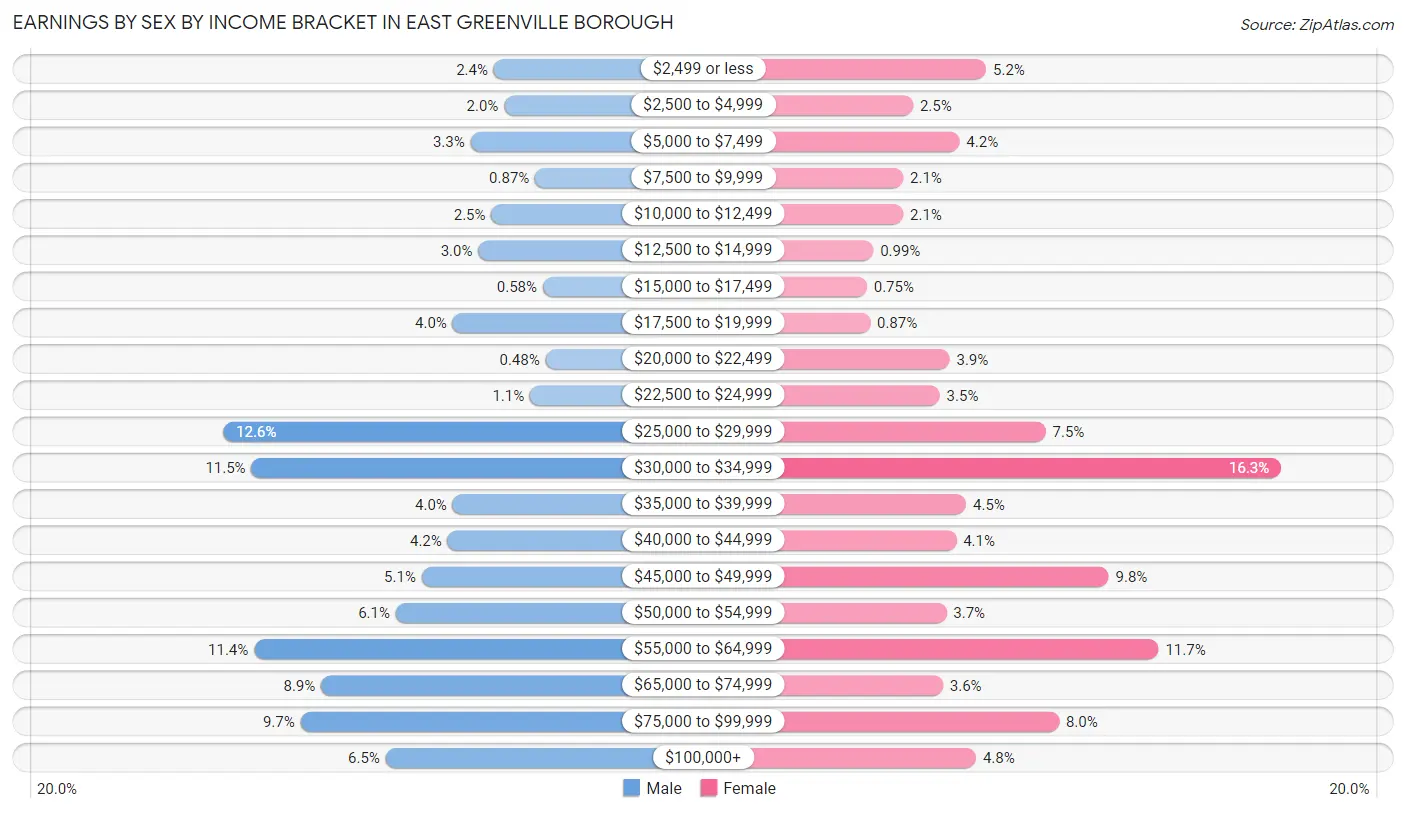
| Income | Male | Female |
| $2,499 or less | 25 (2.4%) | 42 (5.2%) |
| $2,500 to $4,999 | 21 (2.0%) | 20 (2.5%) |
| $5,000 to $7,499 | 34 (3.3%) | 34 (4.2%) |
| $7,500 to $9,999 | 9 (0.9%) | 17 (2.1%) |
| $10,000 to $12,499 | 26 (2.5%) | 17 (2.1%) |
| $12,500 to $14,999 | 31 (3.0%) | 8 (1.0%) |
| $15,000 to $17,499 | 6 (0.6%) | 6 (0.7%) |
| $17,500 to $19,999 | 41 (4.0%) | 7 (0.9%) |
| $20,000 to $22,499 | 5 (0.5%) | 31 (3.8%) |
| $22,500 to $24,999 | 11 (1.1%) | 28 (3.5%) |
| $25,000 to $29,999 | 130 (12.6%) | 60 (7.4%) |
| $30,000 to $34,999 | 119 (11.5%) | 131 (16.3%) |
| $35,000 to $39,999 | 41 (4.0%) | 36 (4.5%) |
| $40,000 to $44,999 | 43 (4.2%) | 33 (4.1%) |
| $45,000 to $49,999 | 53 (5.1%) | 79 (9.8%) |
| $50,000 to $54,999 | 63 (6.1%) | 30 (3.7%) |
| $55,000 to $64,999 | 118 (11.4%) | 94 (11.7%) |
| $65,000 to $74,999 | 92 (8.9%) | 29 (3.6%) |
| $75,000 to $99,999 | 100 (9.7%) | 64 (8.0%) |
| $100,000+ | 67 (6.5%) | 39 (4.8%) |
| Total | 1,035 (100.0%) | 805 (100.0%) |
Earnings by Sex by Educational Attainment in East Greenville borough
Average earnings in East Greenville borough are $47,917 for men and $45,333 for women, a difference of 5.4%. Men with an educational attainment of graduate degree enjoy the highest average annual earnings of $94,250, while those with less than high school education earn the least with $33,846. Women with an educational attainment of bachelor's degree earn the most with the average annual earnings of $60,078, while those with less than high school education have the smallest earnings of $27,778.
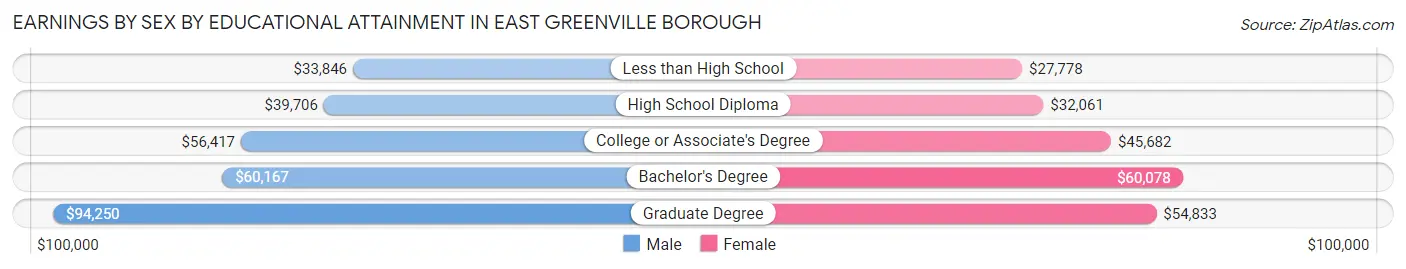
| Educational Attainment | Male Income | Female Income |
| Less than High School | $33,846 | $27,778 |
| High School Diploma | $39,706 | $32,061 |
| College or Associate's Degree | $56,417 | $45,682 |
| Bachelor's Degree | $60,167 | $60,078 |
| Graduate Degree | $94,250 | $54,833 |
| Total | $47,917 | $45,333 |
Family Income in East Greenville borough
Family Income Brackets in East Greenville borough
According to the East Greenville borough family income data, there are 217 families falling into the $50,000 to $74,999 income range, which is the most common income bracket and makes up 27.6% of all families.
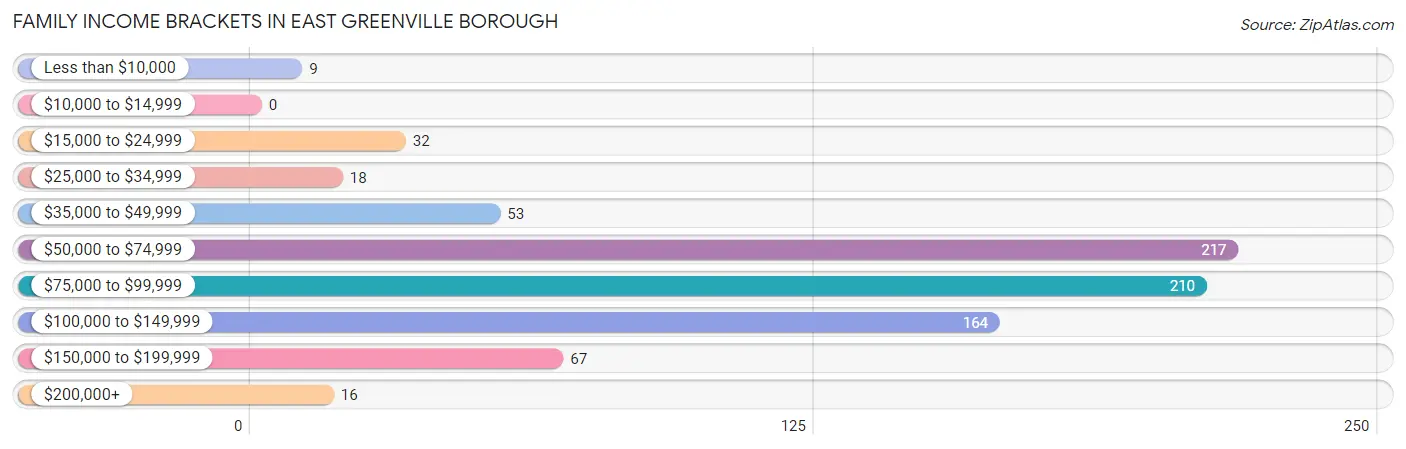
| Income Bracket | # Families | % Families |
| Less than $10,000 | 9 | 1.1% |
| $10,000 to $14,999 | 0 | 0.0% |
| $15,000 to $24,999 | 32 | 4.1% |
| $25,000 to $34,999 | 18 | 2.3% |
| $35,000 to $49,999 | 53 | 6.7% |
| $50,000 to $74,999 | 217 | 27.6% |
| $75,000 to $99,999 | 210 | 26.7% |
| $100,000 to $149,999 | 164 | 20.9% |
| $150,000 to $199,999 | 67 | 8.5% |
| $200,000+ | 16 | 2.0% |
Family Income by Famaliy Size in East Greenville borough
4-person families (100 | 12.7%) account for the highest median family income in East Greenville borough with $109,500 per family, while 2-person families (283 | 36.0%) have the highest median income of $39,425 per family member.
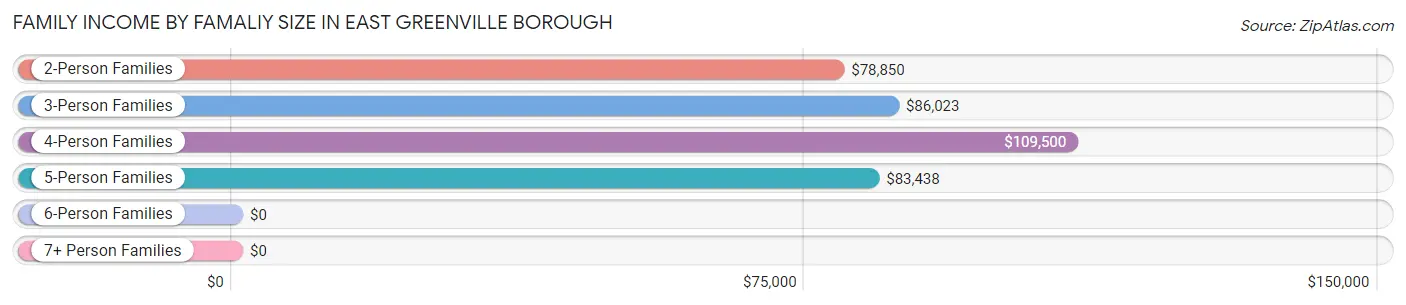
| Income Bracket | # Families | Median Income |
| 2-Person Families | 283 (36.0%) | $78,850 |
| 3-Person Families | 299 (38.0%) | $86,023 |
| 4-Person Families | 100 (12.7%) | $109,500 |
| 5-Person Families | 70 (8.9%) | $83,438 |
| 6-Person Families | 15 (1.9%) | $0 |
| 7+ Person Families | 19 (2.4%) | $0 |
| Total | 786 (100.0%) | $83,854 |
Family Income by Number of Earners in East Greenville borough
The median family income in East Greenville borough is $83,854, with families comprising 2 earners (318) having the highest median family income of $90,417, while families with no earners (64) have the lowest median family income of $59,000, accounting for 40.5% and 8.1% of families, respectively.
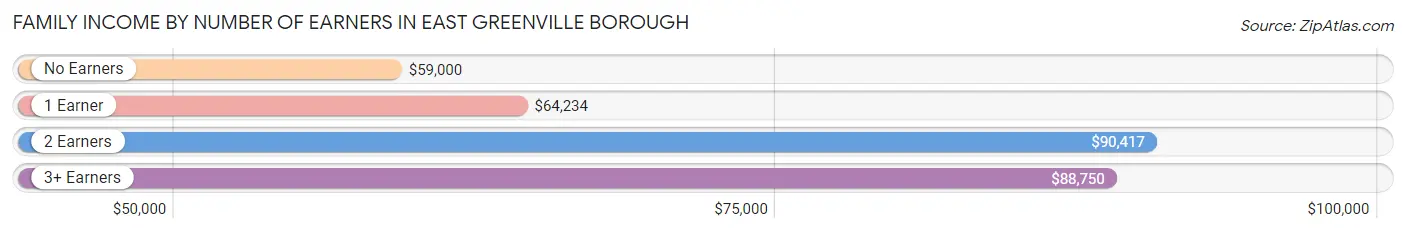
| Number of Earners | # Families | Median Income |
| No Earners | 64 (8.1%) | $59,000 |
| 1 Earner | 289 (36.8%) | $64,234 |
| 2 Earners | 318 (40.5%) | $90,417 |
| 3+ Earners | 115 (14.6%) | $88,750 |
| Total | 786 (100.0%) | $83,854 |
Household Income in East Greenville borough
Household Income Brackets in East Greenville borough
With 353 households falling in the category, the $50,000 to $74,999 income range is the most frequent in East Greenville borough, accounting for 31.1% of all households. In contrast, only 6 households (0.5%) fall into the $10,000 to $14,999 income bracket, making it the least populous group.
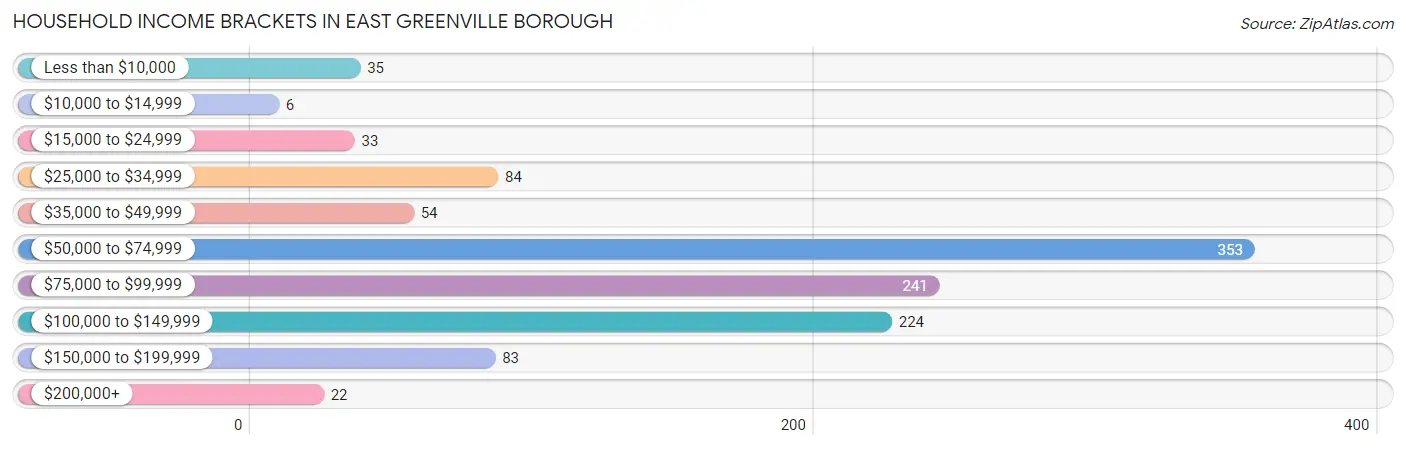
| Income Bracket | # Households | % Households |
| Less than $10,000 | 35 | 3.1% |
| $10,000 to $14,999 | 6 | 0.5% |
| $15,000 to $24,999 | 33 | 2.9% |
| $25,000 to $34,999 | 84 | 7.4% |
| $35,000 to $49,999 | 54 | 4.8% |
| $50,000 to $74,999 | 353 | 31.1% |
| $75,000 to $99,999 | 241 | 21.2% |
| $100,000 to $149,999 | 224 | 19.7% |
| $150,000 to $199,999 | 83 | 7.3% |
| $200,000+ | 22 | 1.9% |
Household Income by Householder Age in East Greenville borough
The median household income in East Greenville borough is $75,417, with the highest median household income of $87,546 found in the 25 to 44 years age bracket for the primary householder. A total of 495 households (43.6%) fall into this category. Meanwhile, the 15 to 24 years age bracket for the primary householder has the lowest median household income of $50,870, with 66 households (5.8%) in this group.
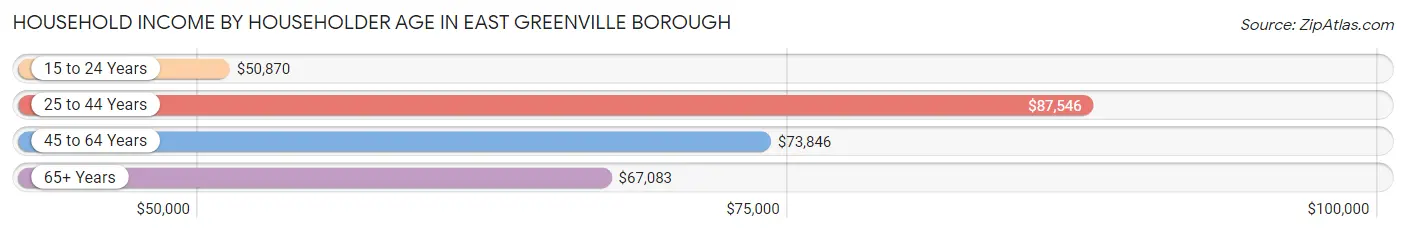
| Income Bracket | # Households | Median Income |
| 15 to 24 Years | 66 (5.8%) | $50,870 |
| 25 to 44 Years | 495 (43.6%) | $87,546 |
| 45 to 64 Years | 374 (33.0%) | $73,846 |
| 65+ Years | 200 (17.6%) | $67,083 |
| Total | 1,135 (100.0%) | $75,417 |
Poverty in East Greenville borough
Income Below Poverty by Sex and Age in East Greenville borough
With 7.9% poverty level for males and 9.0% for females among the residents of East Greenville borough, 16 and 17 year old males and 18 to 24 year old females are the most vulnerable to poverty, with 23 males (71.9%) and 33 females (23.1%) in their respective age groups living below the poverty level.
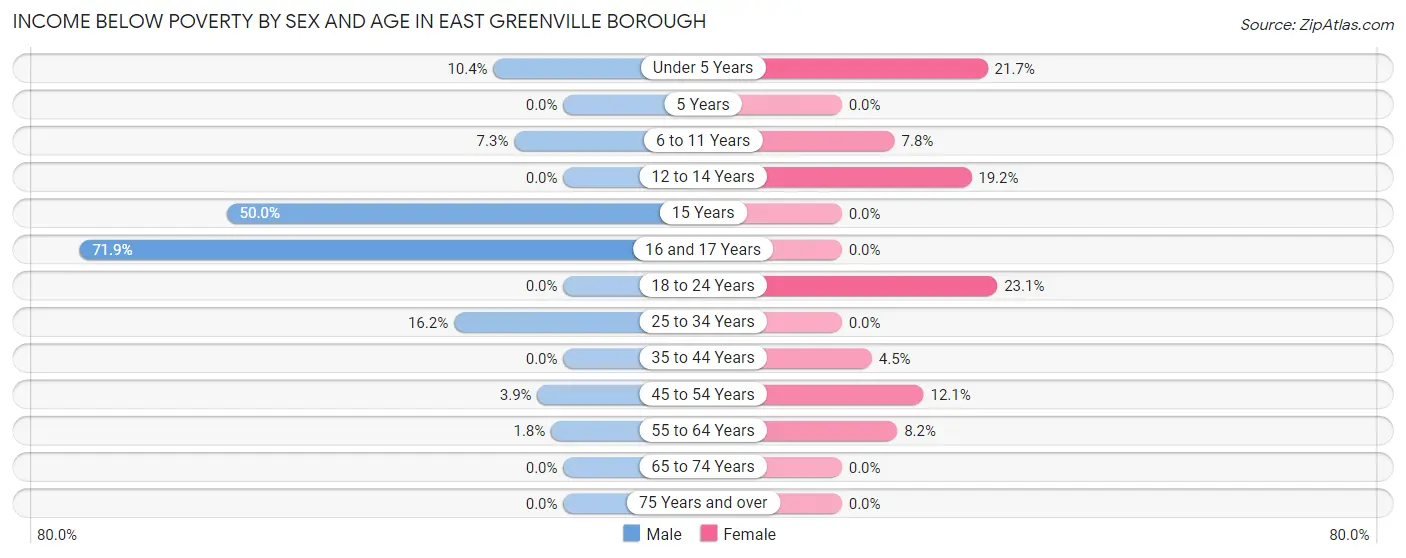
| Age Bracket | Male | Female |
| Under 5 Years | 22 (10.4%) | 34 (21.7%) |
| 5 Years | 0 (0.0%) | 0 (0.0%) |
| 6 to 11 Years | 7 (7.3%) | 8 (7.8%) |
| 12 to 14 Years | 0 (0.0%) | 15 (19.2%) |
| 15 Years | 17 (50.0%) | 0 (0.0%) |
| 16 and 17 Years | 23 (71.9%) | 0 (0.0%) |
| 18 to 24 Years | 0 (0.0%) | 33 (23.1%) |
| 25 to 34 Years | 51 (16.2%) | 0 (0.0%) |
| 35 to 44 Years | 0 (0.0%) | 7 (4.5%) |
| 45 to 54 Years | 7 (3.8%) | 25 (12.1%) |
| 55 to 64 Years | 4 (1.8%) | 13 (8.2%) |
| 65 to 74 Years | 0 (0.0%) | 0 (0.0%) |
| 75 Years and over | 0 (0.0%) | 0 (0.0%) |
| Total | 131 (7.9%) | 135 (9.0%) |
Income Above Poverty by Sex and Age in East Greenville borough
According to the poverty statistics in East Greenville borough, males aged 5 years and females aged 5 years are the age groups that are most secure financially, with 100.0% of males and 100.0% of females in these age groups living above the poverty line.
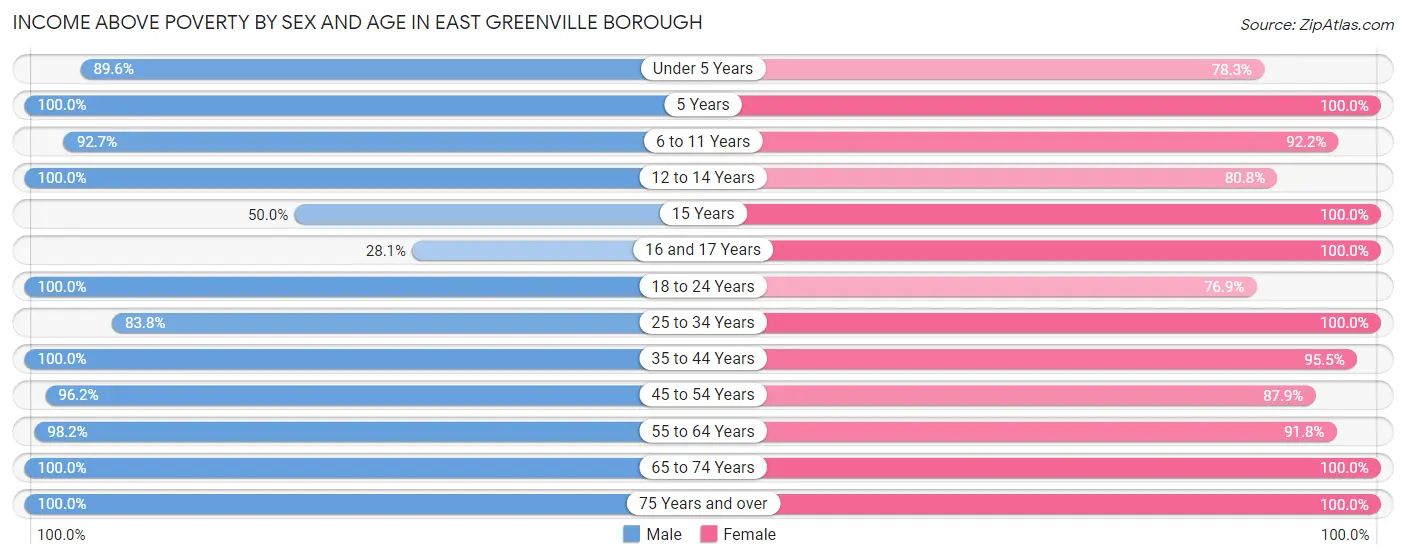
| Age Bracket | Male | Female |
| Under 5 Years | 190 (89.6%) | 123 (78.3%) |
| 5 Years | 29 (100.0%) | 4 (100.0%) |
| 6 to 11 Years | 89 (92.7%) | 94 (92.2%) |
| 12 to 14 Years | 38 (100.0%) | 63 (80.8%) |
| 15 Years | 17 (50.0%) | 24 (100.0%) |
| 16 and 17 Years | 9 (28.1%) | 29 (100.0%) |
| 18 to 24 Years | 212 (100.0%) | 110 (76.9%) |
| 25 to 34 Years | 263 (83.8%) | 289 (100.0%) |
| 35 to 44 Years | 148 (100.0%) | 150 (95.5%) |
| 45 to 54 Years | 175 (96.2%) | 181 (87.9%) |
| 55 to 64 Years | 216 (98.2%) | 145 (91.8%) |
| 65 to 74 Years | 82 (100.0%) | 115 (100.0%) |
| 75 Years and over | 52 (100.0%) | 37 (100.0%) |
| Total | 1,520 (92.1%) | 1,364 (91.0%) |
Income Below Poverty Among Married-Couple Families in East Greenville borough
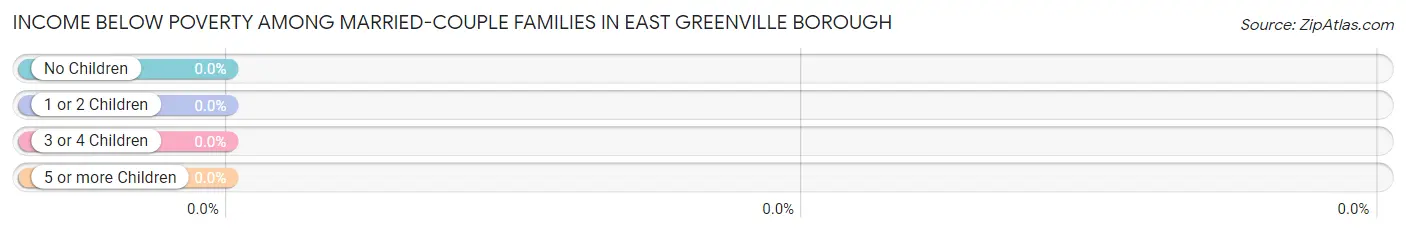
| Children | Above Poverty | Below Poverty |
| No Children | 282 (100.0%) | 0 (0.0%) |
| 1 or 2 Children | 192 (100.0%) | 0 (0.0%) |
| 3 or 4 Children | 57 (100.0%) | 0 (0.0%) |
| 5 or more Children | 0 (0.0%) | 0 (0.0%) |
| Total | 531 (100.0%) | 0 (0.0%) |
Income Below Poverty Among Single-Parent Households in East Greenville borough
According to the poverty data in East Greenville borough, 19.2% or 18 single-father households and 15.5% or 25 single-mother households are living below the poverty line. Among single-father households, those with 5 or more children have the highest poverty rate, with 9 households (100.0%) experiencing poverty. Likewise, among single-mother households, those with 1 or 2 children have the highest poverty rate, with 25 households (22.3%) falling below the poverty line.
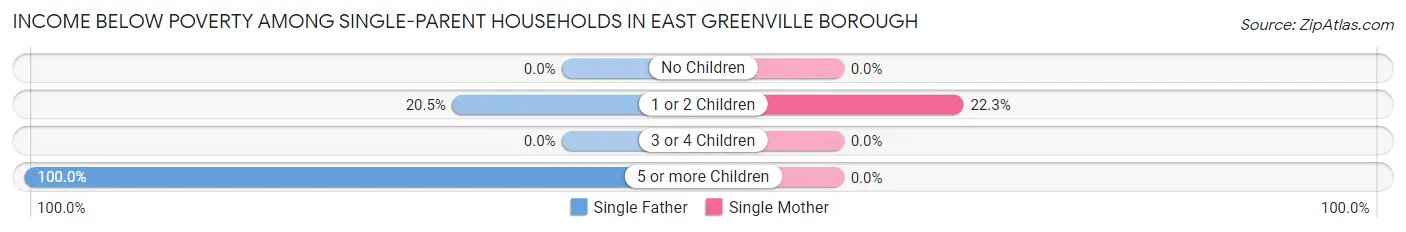
| Children | Single Father | Single Mother |
| No Children | 0 (0.0%) | 0 (0.0%) |
| 1 or 2 Children | 9 (20.4%) | 25 (22.3%) |
| 3 or 4 Children | 0 (0.0%) | 0 (0.0%) |
| 5 or more Children | 9 (100.0%) | 0 (0.0%) |
| Total | 18 (19.2%) | 25 (15.5%) |
Income Below Poverty Among Married-Couple vs Single-Parent Households in East Greenville borough
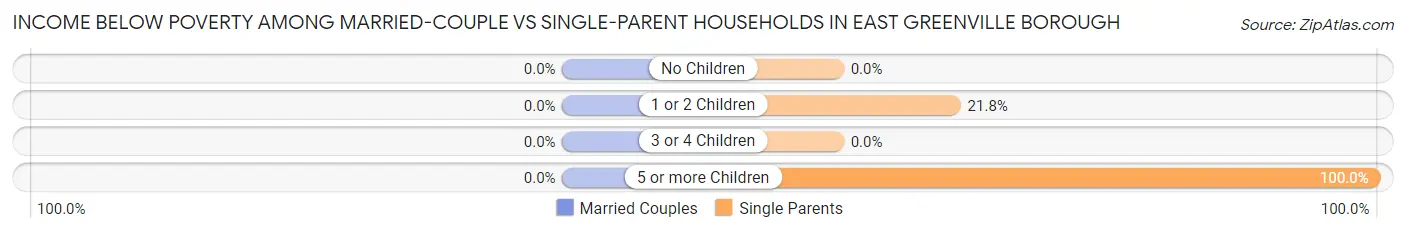
| Children | Married-Couple Families | Single-Parent Households |
| No Children | 0 (0.0%) | 0 (0.0%) |
| 1 or 2 Children | 0 (0.0%) | 34 (21.8%) |
| 3 or 4 Children | 0 (0.0%) | 0 (0.0%) |
| 5 or more Children | 0 (0.0%) | 9 (100.0%) |
| Total | 0 (0.0%) | 43 (16.9%) |
Race in East Greenville borough
The most populous races in East Greenville borough are White / Caucasian (2,786 | 88.4%), Hispanic or Latino (305 | 9.7%), and Two or more Races (277 | 8.8%).
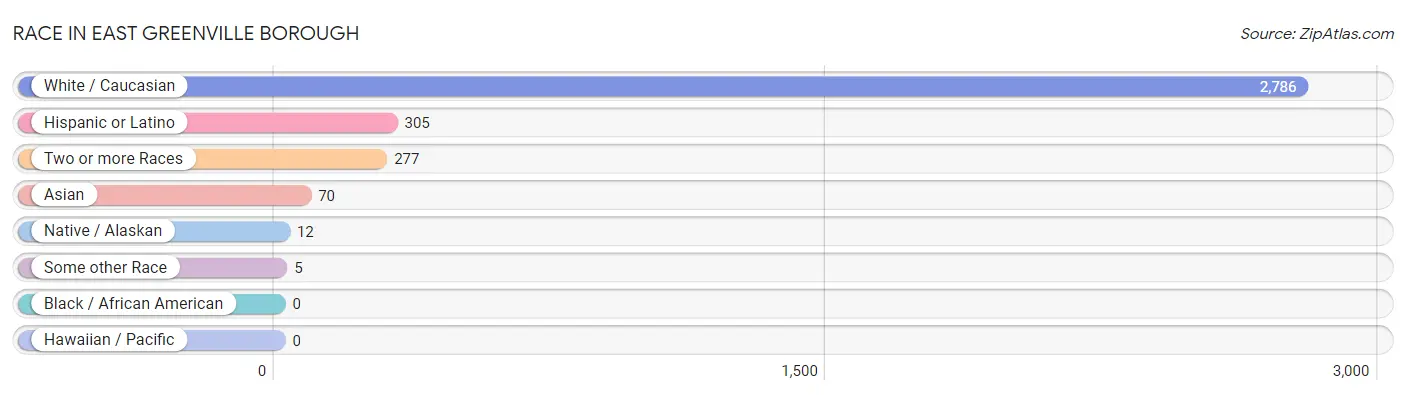
| Race | # Population | % Population |
| Asian | 70 | 2.2% |
| Black / African American | 0 | 0.0% |
| Hawaiian / Pacific | 0 | 0.0% |
| Hispanic or Latino | 305 | 9.7% |
| Native / Alaskan | 12 | 0.4% |
| White / Caucasian | 2,786 | 88.4% |
| Two or more Races | 277 | 8.8% |
| Some other Race | 5 | 0.2% |
| Total | 3,150 | 100.0% |
Ancestry in East Greenville borough
The most populous ancestries reported in East Greenville borough are German (949 | 30.1%), Irish (484 | 15.4%), Italian (404 | 12.8%), English (291 | 9.2%), and Puerto Rican (257 | 8.2%), together accounting for 75.7% of all East Greenville borough residents.
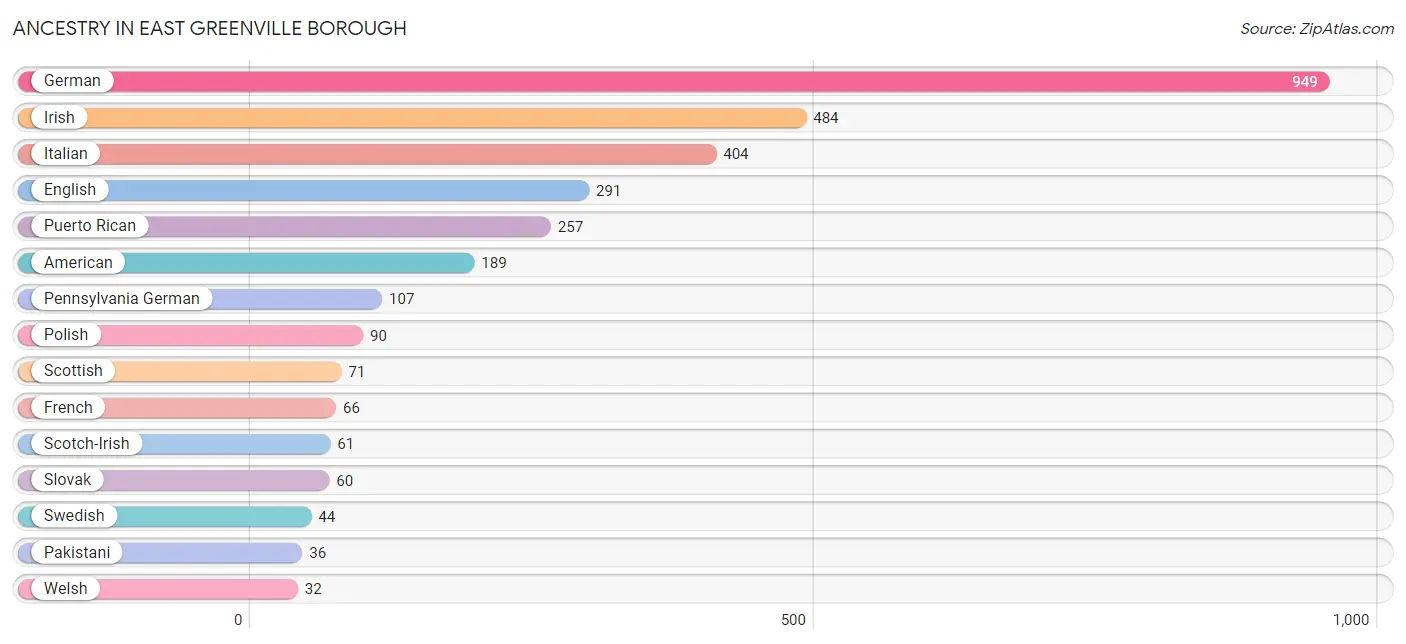
| Ancestry | # Population | % Population |
| American | 189 | 6.0% |
| Armenian | 6 | 0.2% |
| Bhutanese | 15 | 0.5% |
| Burmese | 28 | 0.9% |
| Cherokee | 8 | 0.3% |
| Colombian | 13 | 0.4% |
| Czech | 21 | 0.7% |
| Danish | 10 | 0.3% |
| Dominican | 11 | 0.4% |
| Dutch | 22 | 0.7% |
| Eastern European | 23 | 0.7% |
| English | 291 | 9.2% |
| European | 19 | 0.6% |
| French | 66 | 2.1% |
| French Canadian | 4 | 0.1% |
| German | 949 | 30.1% |
| Hungarian | 7 | 0.2% |
| Iranian | 18 | 0.6% |
| Irish | 484 | 15.4% |
| Iroquois | 5 | 0.2% |
| Italian | 404 | 12.8% |
| Korean | 18 | 0.6% |
| Lithuanian | 20 | 0.6% |
| Mexican | 24 | 0.8% |
| Pakistani | 36 | 1.1% |
| Pennsylvania German | 107 | 3.4% |
| Polish | 90 | 2.9% |
| Puerto Rican | 257 | 8.2% |
| Romanian | 17 | 0.5% |
| Russian | 27 | 0.9% |
| Scandinavian | 4 | 0.1% |
| Scotch-Irish | 61 | 1.9% |
| Scottish | 71 | 2.2% |
| Sioux | 5 | 0.2% |
| Slavic | 10 | 0.3% |
| Slovak | 60 | 1.9% |
| South American | 13 | 0.4% |
| Sri Lankan | 8 | 0.3% |
| Swedish | 44 | 1.4% |
| Swiss | 28 | 0.9% |
| Ukrainian | 30 | 0.9% |
| Welsh | 32 | 1.0% | View All 42 Rows |
Immigrants in East Greenville borough
The most numerous immigrant groups reported in East Greenville borough came from Asia (55 | 1.8%), South Eastern Asia (40 | 1.3%), Europe (36 | 1.1%), Thailand (36 | 1.1%), and Eastern Europe (22 | 0.7%), together accounting for 6.0% of all East Greenville borough residents.
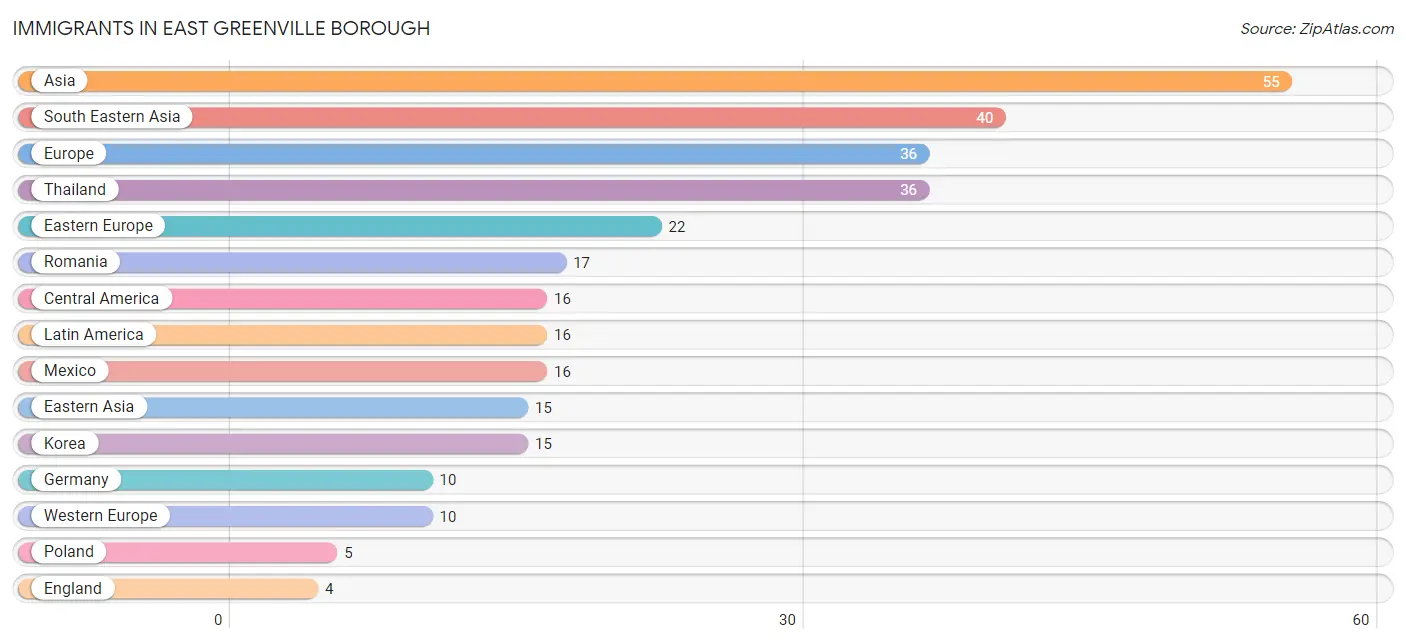
| Immigration Origin | # Population | % Population |
| Asia | 55 | 1.8% |
| Central America | 16 | 0.5% |
| Eastern Asia | 15 | 0.5% |
| Eastern Europe | 22 | 0.7% |
| England | 4 | 0.1% |
| Europe | 36 | 1.1% |
| Germany | 10 | 0.3% |
| Korea | 15 | 0.5% |
| Latin America | 16 | 0.5% |
| Mexico | 16 | 0.5% |
| Northern Europe | 4 | 0.1% |
| Poland | 5 | 0.2% |
| Romania | 17 | 0.5% |
| South Eastern Asia | 40 | 1.3% |
| Thailand | 36 | 1.1% |
| Vietnam | 4 | 0.1% |
| Western Europe | 10 | 0.3% | View All 17 Rows |
Sex and Age in East Greenville borough
Sex and Age in East Greenville borough
The most populous age groups in East Greenville borough are Under 5 Years (212 | 12.8%) for men and 30 to 34 Years (175 | 11.7%) for women.
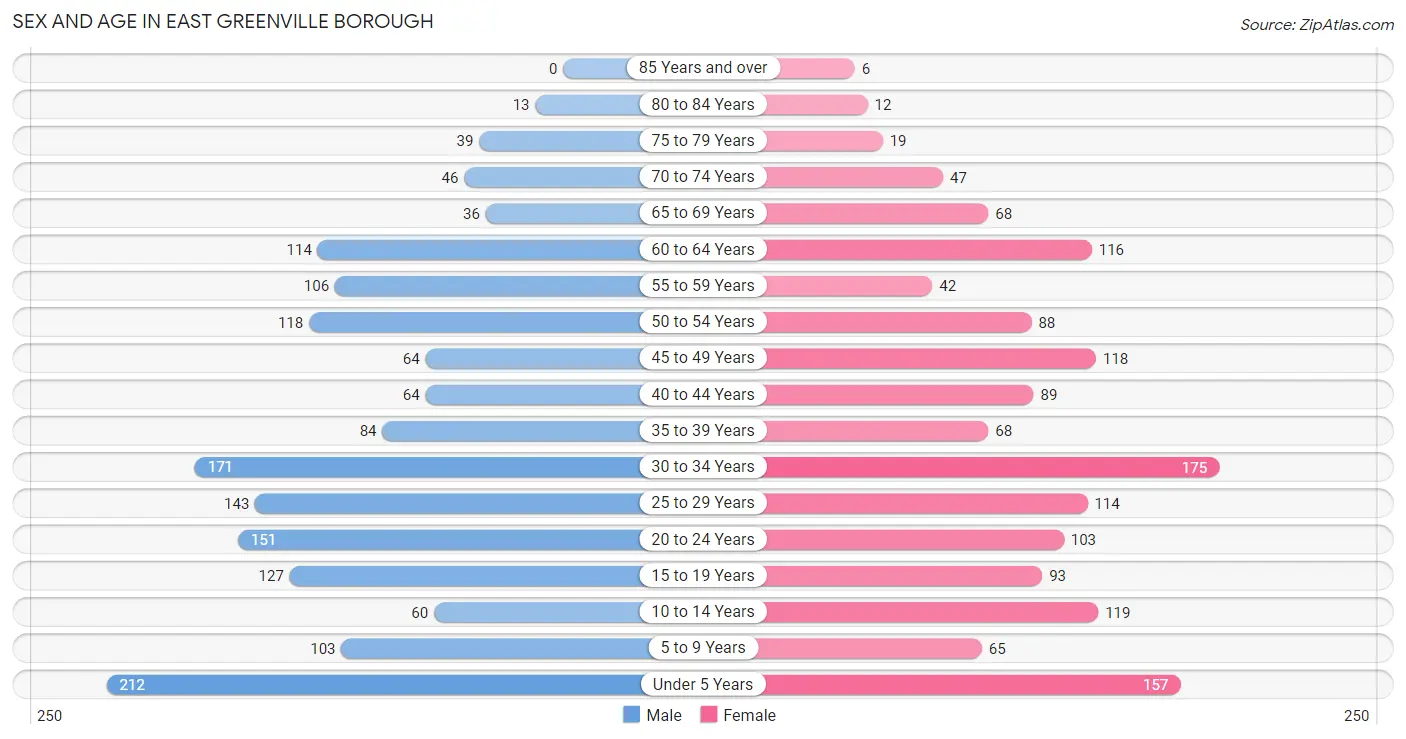
| Age Bracket | Male | Female |
| Under 5 Years | 212 (12.8%) | 157 (10.5%) |
| 5 to 9 Years | 103 (6.2%) | 65 (4.3%) |
| 10 to 14 Years | 60 (3.6%) | 119 (7.9%) |
| 15 to 19 Years | 127 (7.7%) | 93 (6.2%) |
| 20 to 24 Years | 151 (9.1%) | 103 (6.9%) |
| 25 to 29 Years | 143 (8.7%) | 114 (7.6%) |
| 30 to 34 Years | 171 (10.4%) | 175 (11.7%) |
| 35 to 39 Years | 84 (5.1%) | 68 (4.5%) |
| 40 to 44 Years | 64 (3.9%) | 89 (5.9%) |
| 45 to 49 Years | 64 (3.9%) | 118 (7.9%) |
| 50 to 54 Years | 118 (7.1%) | 88 (5.9%) |
| 55 to 59 Years | 106 (6.4%) | 42 (2.8%) |
| 60 to 64 Years | 114 (6.9%) | 116 (7.7%) |
| 65 to 69 Years | 36 (2.2%) | 68 (4.5%) |
| 70 to 74 Years | 46 (2.8%) | 47 (3.1%) |
| 75 to 79 Years | 39 (2.4%) | 19 (1.3%) |
| 80 to 84 Years | 13 (0.8%) | 12 (0.8%) |
| 85 Years and over | 0 (0.0%) | 6 (0.4%) |
| Total | 1,651 (100.0%) | 1,499 (100.0%) |
Families and Households in East Greenville borough
Median Family Size in East Greenville borough
The median family size in East Greenville borough is 3.24 persons per family, with married-couple families (531 | 67.6%) accounting for the largest median family size of 3.34 persons per family. On the other hand, single male/father families (94 | 12.0%) represent the smallest median family size with 2.96 persons per family.
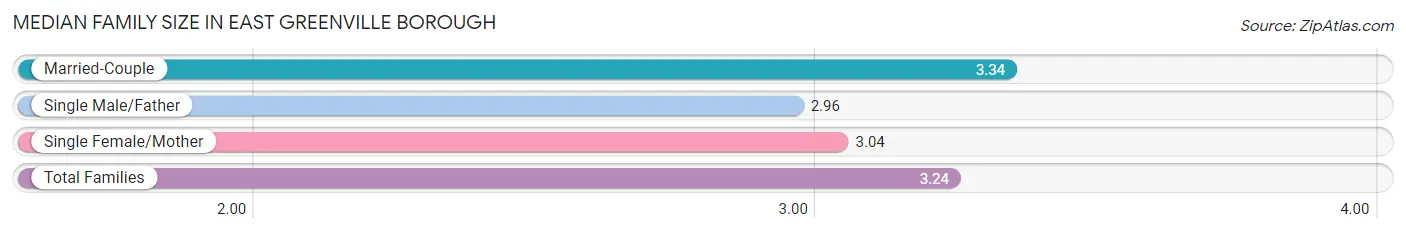
| Family Type | # Families | Family Size |
| Married-Couple | 531 (67.6%) | 3.34 |
| Single Male/Father | 94 (12.0%) | 2.96 |
| Single Female/Mother | 161 (20.5%) | 3.04 |
| Total Families | 786 (100.0%) | 3.24 |
Median Household Size in East Greenville borough
The median household size in East Greenville borough is 2.76 persons per household, with single female/mother households (161 | 14.2%) accounting for the largest median household size of 3.43 persons per household. non-family households (349 | 30.7%) represent the smallest median household size with 1.30 persons per household.
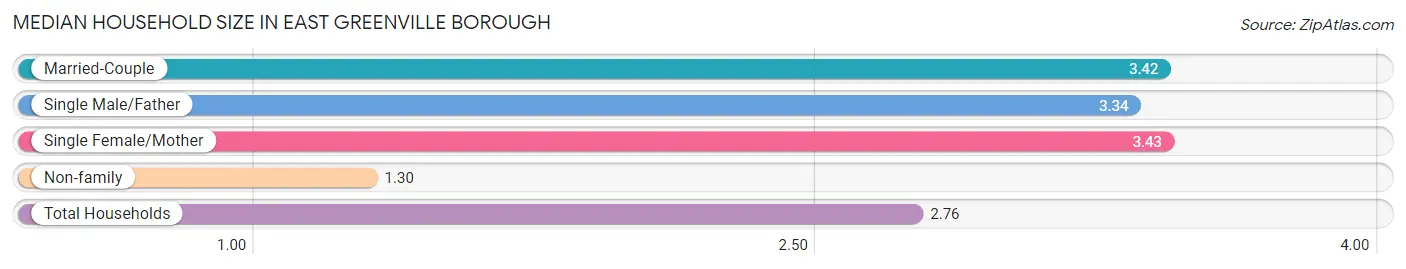
| Household Type | # Households | Household Size |
| Married-Couple | 531 (46.8%) | 3.42 |
| Single Male/Father | 94 (8.3%) | 3.34 |
| Single Female/Mother | 161 (14.2%) | 3.43 |
| Non-family | 349 (30.7%) | 1.30 |
| Total Households | 1,135 (100.0%) | 2.76 |
Household Size by Marriage Status in East Greenville borough
Out of a total of 1,135 households in East Greenville borough, 786 (69.3%) are family households, while 349 (30.7%) are nonfamily households. The most numerous type of family households are 2-person households, comprising 259, and the most common type of nonfamily households are 1-person households, comprising 262.
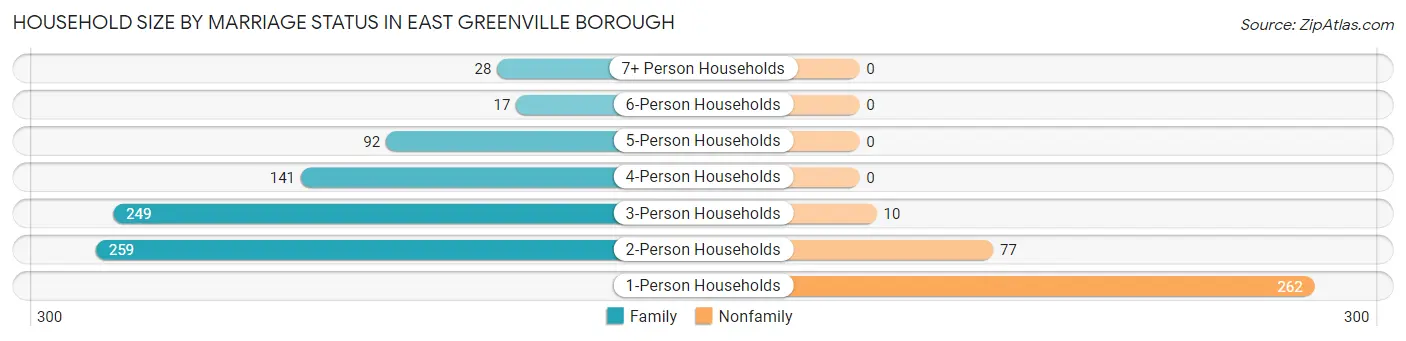
| Household Size | Family Households | Nonfamily Households |
| 1-Person Households | - | 262 (23.1%) |
| 2-Person Households | 259 (22.8%) | 77 (6.8%) |
| 3-Person Households | 249 (21.9%) | 10 (0.9%) |
| 4-Person Households | 141 (12.4%) | 0 (0.0%) |
| 5-Person Households | 92 (8.1%) | 0 (0.0%) |
| 6-Person Households | 17 (1.5%) | 0 (0.0%) |
| 7+ Person Households | 28 (2.5%) | 0 (0.0%) |
| Total | 786 (69.3%) | 349 (30.7%) |
Female Fertility in East Greenville borough
Fertility by Age in East Greenville borough
Average fertility rate in East Greenville borough is 89.0 births per 1,000 women. Women in the age bracket of 20 to 34 years have the highest fertility rate with 105.0 births per 1,000 women. Women in the age bracket of 20 to 34 years acount for 60.3% of all women with births.
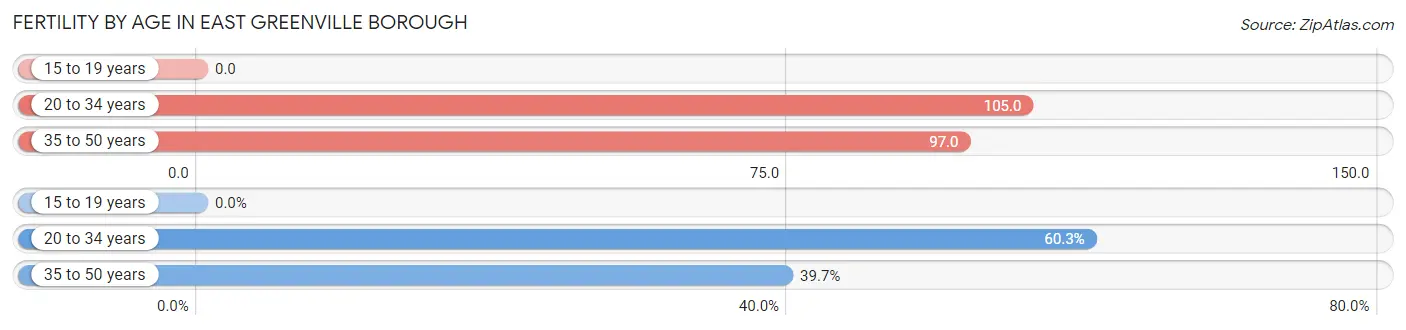
| Age Bracket | Women with Births | Births / 1,000 Women |
| 15 to 19 years | 0 (0.0%) | 0.0 |
| 20 to 34 years | 41 (60.3%) | 105.0 |
| 35 to 50 years | 27 (39.7%) | 97.0 |
| Total | 68 (100.0%) | 89.0 |
Fertility by Age by Marriage Status in East Greenville borough
39.7% of women with births (68) in East Greenville borough are married. The highest percentage of unmarried women with births falls into 20 to 34 years age bracket with 100.0% of them unmarried at the time of birth, while the lowest percentage of unmarried women with births belong to 35 to 50 years age bracket with 0.0% of them unmarried.
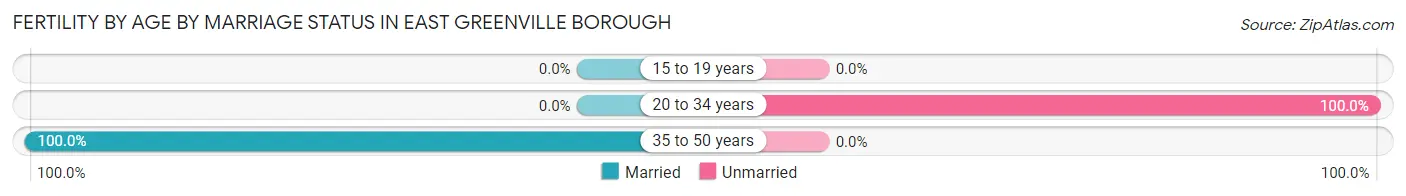
| Age Bracket | Married | Unmarried |
| 15 to 19 years | 0 (0.0%) | 0 (0.0%) |
| 20 to 34 years | 0 (0.0%) | 41 (100.0%) |
| 35 to 50 years | 27 (100.0%) | 0 (0.0%) |
| Total | 27 (39.7%) | 41 (60.3%) |
Fertility by Education in East Greenville borough
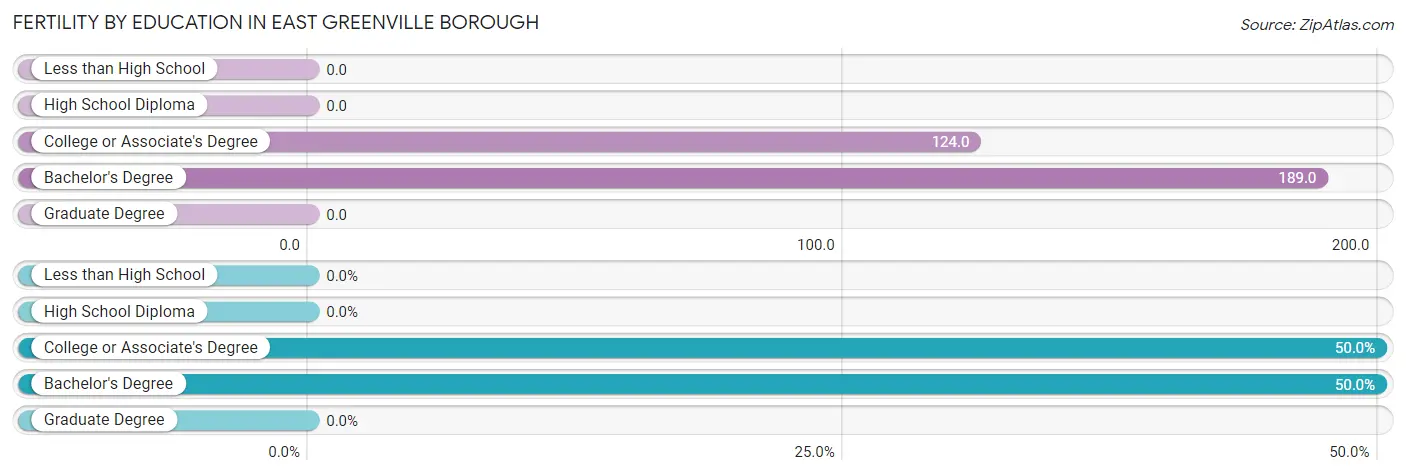
| Educational Attainment | Women with Births | Births / 1,000 Women |
| Less than High School | 0 (0.0%) | 0.0 |
| High School Diploma | 0 (0.0%) | 0.0 |
| College or Associate's Degree | 34 (50.0%) | 124.0 |
| Bachelor's Degree | 34 (50.0%) | 189.0 |
| Graduate Degree | 0 (0.0%) | 0.0 |
| Total | 68 (100.0%) | 89.0 |
Fertility by Education by Marriage Status in East Greenville borough
60.3% of women with births in East Greenville borough are unmarried. Women with the educational attainment of bachelor's degree are most likely to be married with 79.4% of them married at childbirth, while women with the educational attainment of college or associate's degree are least likely to be married with 100.0% of them unmarried at childbirth.
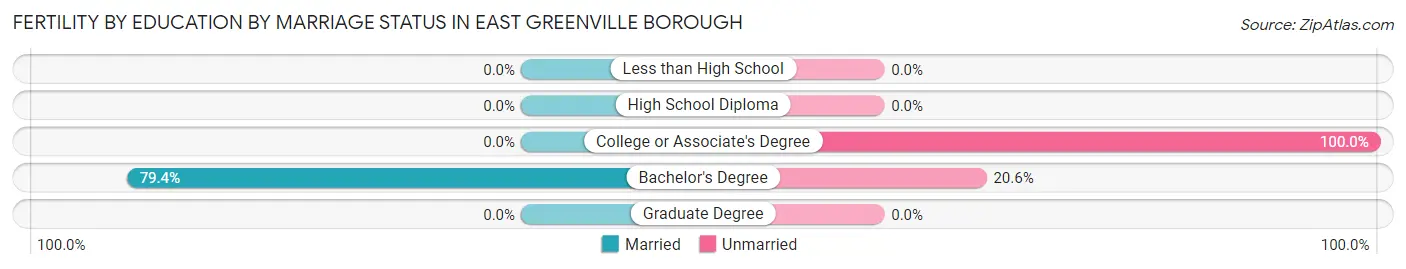
| Educational Attainment | Married | Unmarried |
| Less than High School | 0 (0.0%) | 0 (0.0%) |
| High School Diploma | 0 (0.0%) | 0 (0.0%) |
| College or Associate's Degree | 0 (0.0%) | 34 (100.0%) |
| Bachelor's Degree | 27 (79.4%) | 7 (20.6%) |
| Graduate Degree | 0 (0.0%) | 0 (0.0%) |
| Total | 27 (39.7%) | 41 (60.3%) |
Employment Characteristics in East Greenville borough
Employment by Class of Employer in East Greenville borough
Among the 1,719 employed individuals in East Greenville borough, private company employees (1,472 | 85.6%), not-for-profit organizations (128 | 7.4%), and local government employees (40 | 2.3%) make up the most common classes of employment.
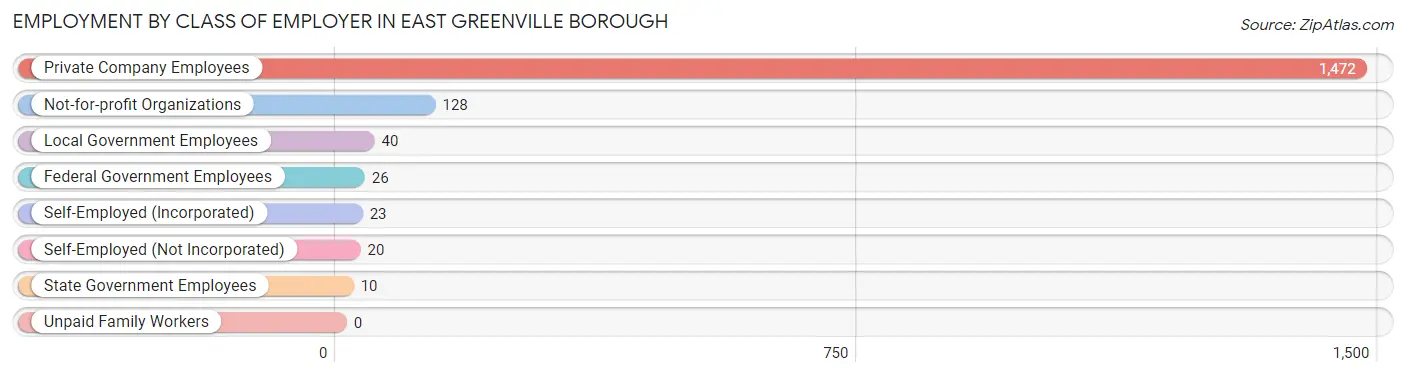
| Employer Class | # Employees | % Employees |
| Private Company Employees | 1,472 | 85.6% |
| Self-Employed (Incorporated) | 23 | 1.3% |
| Self-Employed (Not Incorporated) | 20 | 1.2% |
| Not-for-profit Organizations | 128 | 7.4% |
| Local Government Employees | 40 | 2.3% |
| State Government Employees | 10 | 0.6% |
| Federal Government Employees | 26 | 1.5% |
| Unpaid Family Workers | 0 | 0.0% |
| Total | 1,719 | 100.0% |
Employment Status by Age in East Greenville borough
According to the labor force statistics for East Greenville borough, out of the total population over 16 years of age (2,376), 75.9% or 1,803 individuals are in the labor force, with 3.7% or 67 of them unemployed. The age group with the highest labor force participation rate is 55 to 59 years, with 100.0% or 148 individuals in the labor force. Within the labor force, the 16 to 19 years age range has the highest percentage of unemployed individuals, with 11.9% or 14 of them being unemployed.
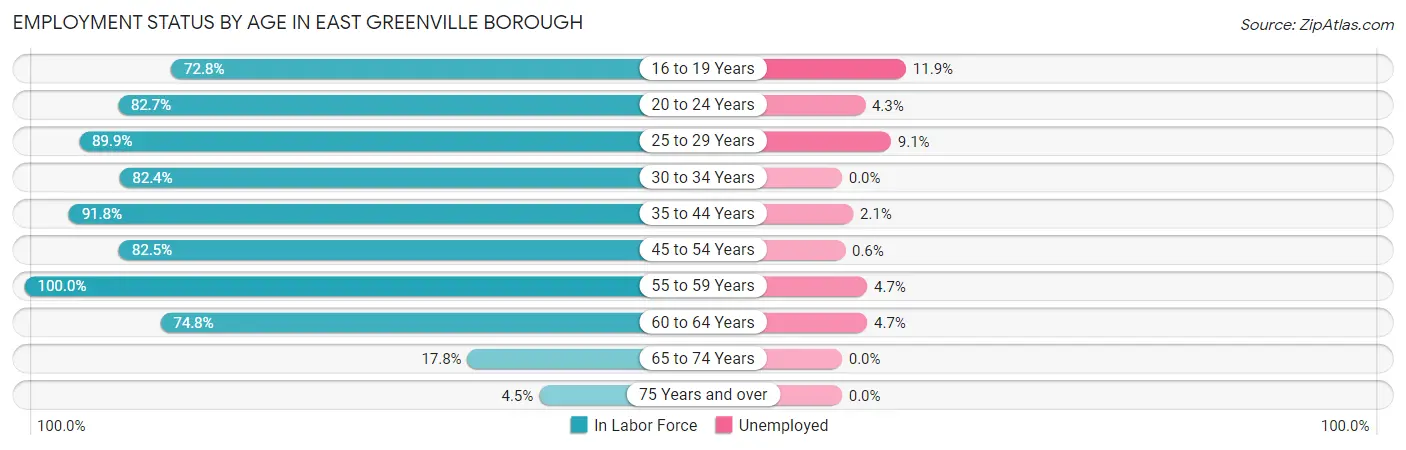
| Age Bracket | In Labor Force | Unemployed |
| 16 to 19 Years | 118 (72.8%) | 14 (11.9%) |
| 20 to 24 Years | 210 (82.7%) | 9 (4.3%) |
| 25 to 29 Years | 231 (89.9%) | 21 (9.1%) |
| 30 to 34 Years | 285 (82.4%) | 0 (0.0%) |
| 35 to 44 Years | 280 (91.8%) | 6 (2.1%) |
| 45 to 54 Years | 320 (82.5%) | 2 (0.6%) |
| 55 to 59 Years | 148 (100.0%) | 7 (4.7%) |
| 60 to 64 Years | 172 (74.8%) | 8 (4.7%) |
| 65 to 74 Years | 35 (17.8%) | 0 (0.0%) |
| 75 Years and over | 4 (4.5%) | 0 (0.0%) |
| Total | 1,803 (75.9%) | 67 (3.7%) |
Employment Status by Educational Attainment in East Greenville borough
According to labor force statistics for East Greenville borough, 85.8% of individuals (1,436) out of the total population between 25 and 64 years of age (1,674) are in the labor force, with 3.1% or 45 of them being unemployed. The group with the highest labor force participation rate are those with the educational attainment of high school diploma, with 90.9% or 612 individuals in the labor force. Within the labor force, individuals with college / associate degree education have the highest percentage of unemployment, with 5.3% or 21 of them being unemployed.
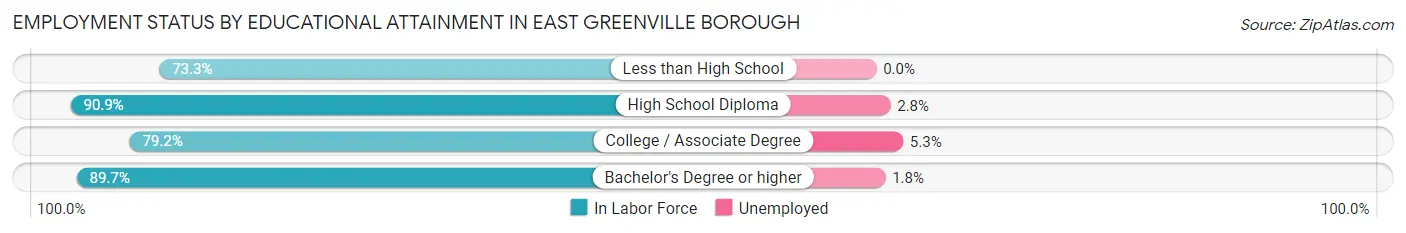
| Educational Attainment | In Labor Force | Unemployed |
| Less than High School | 96 (73.3%) | 0 (0.0%) |
| High School Diploma | 612 (90.9%) | 19 (2.8%) |
| College / Associate Degree | 397 (79.2%) | 27 (5.3%) |
| Bachelor's Degree or higher | 331 (89.7%) | 7 (1.8%) |
| Total | 1,436 (85.8%) | 52 (3.1%) |
Employment Occupations by Sex in East Greenville borough
Management, Business, Science and Arts Occupations
The most common Management, Business, Science and Arts occupations in East Greenville borough are Community & Social Service (136 | 7.8%), Management (129 | 7.4%), Education Instruction & Library (83 | 4.8%), Business & Financial (79 | 4.5%), and Health Diagnosing & Treating (77 | 4.4%).
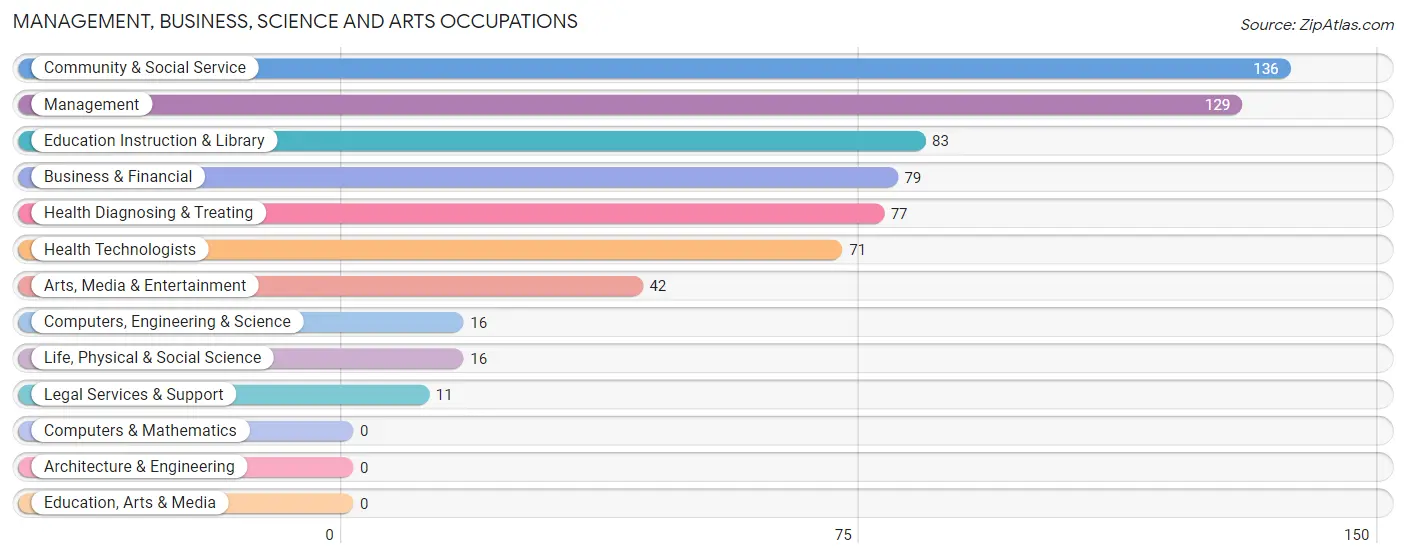
Management, Business, Science and Arts Occupations by Sex
Within the Management, Business, Science and Arts occupations in East Greenville borough, the most male-oriented occupations are Computers, Engineering & Science (68.8%), Life, Physical & Social Science (68.8%), and Management (44.2%), while the most female-oriented occupations are Legal Services & Support (100.0%), Community & Social Service (83.8%), and Education Instruction & Library (83.1%).
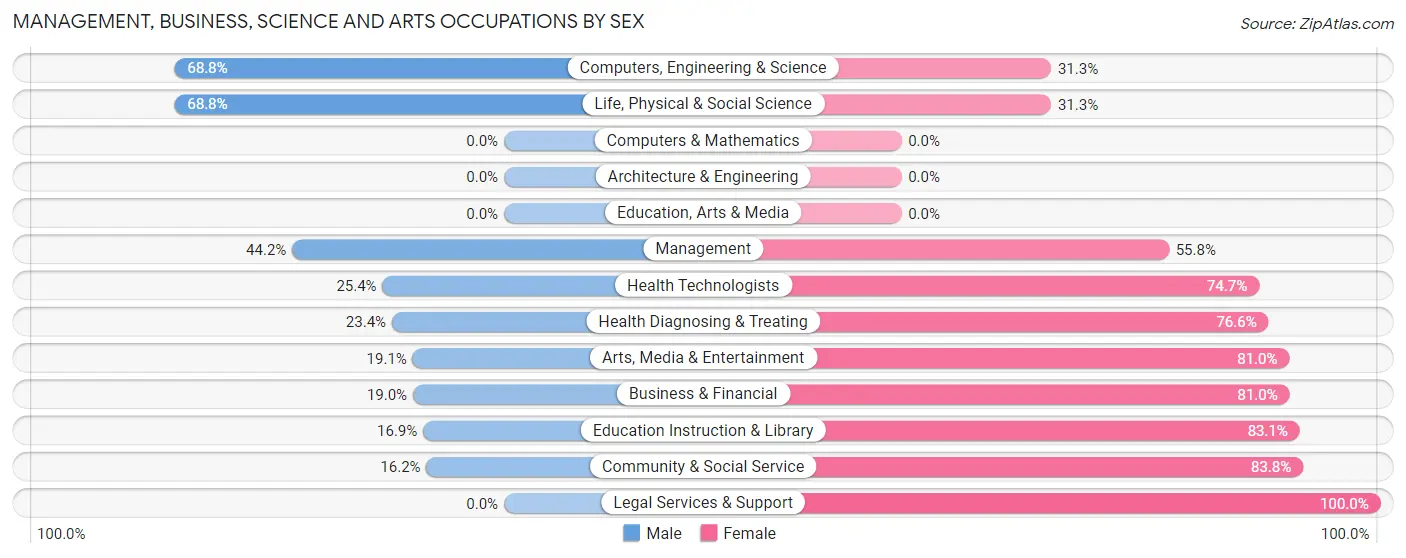
| Occupation | Male | Female |
| Management | 57 (44.2%) | 72 (55.8%) |
| Business & Financial | 15 (19.0%) | 64 (81.0%) |
| Computers, Engineering & Science | 11 (68.8%) | 5 (31.2%) |
| Computers & Mathematics | 0 (0.0%) | 0 (0.0%) |
| Architecture & Engineering | 0 (0.0%) | 0 (0.0%) |
| Life, Physical & Social Science | 11 (68.8%) | 5 (31.2%) |
| Community & Social Service | 22 (16.2%) | 114 (83.8%) |
| Education, Arts & Media | 0 (0.0%) | 0 (0.0%) |
| Legal Services & Support | 0 (0.0%) | 11 (100.0%) |
| Education Instruction & Library | 14 (16.9%) | 69 (83.1%) |
| Arts, Media & Entertainment | 8 (19.1%) | 34 (80.9%) |
| Health Diagnosing & Treating | 18 (23.4%) | 59 (76.6%) |
| Health Technologists | 18 (25.4%) | 53 (74.7%) |
| Total (Category) | 123 (28.1%) | 314 (71.9%) |
| Total (Overall) | 988 (56.9%) | 748 (43.1%) |
Services Occupations
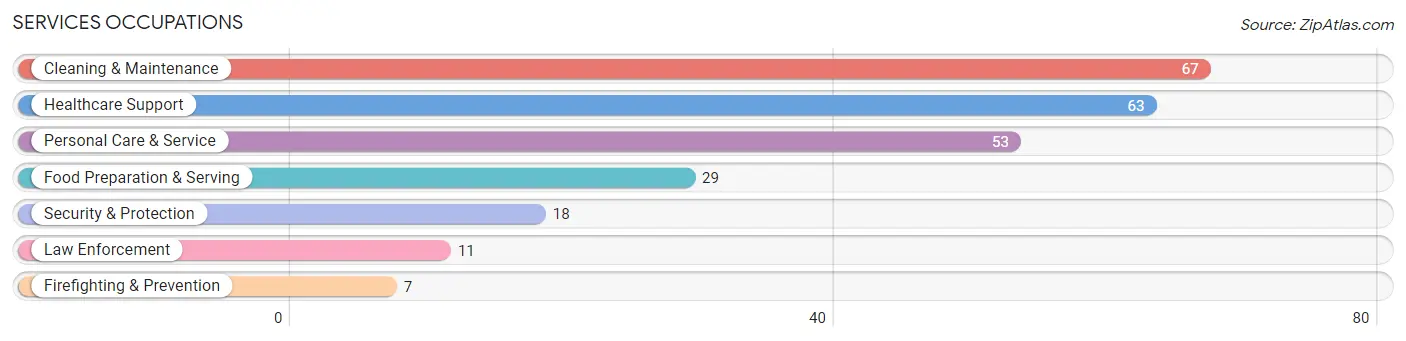
The most common Services occupations in East Greenville borough are Cleaning & Maintenance (67 | 3.9%), Healthcare Support (63 | 3.6%), Personal Care & Service (53 | 3.0%), Food Preparation & Serving (29 | 1.7%), and Security & Protection (18 | 1.0%).
Services Occupations by Sex
Within the Services occupations in East Greenville borough, the most male-oriented occupations are Security & Protection (100.0%), Firefighting & Prevention (100.0%), and Law Enforcement (100.0%), while the most female-oriented occupations are Healthcare Support (100.0%), Personal Care & Service (77.4%), and Food Preparation & Serving (37.9%).
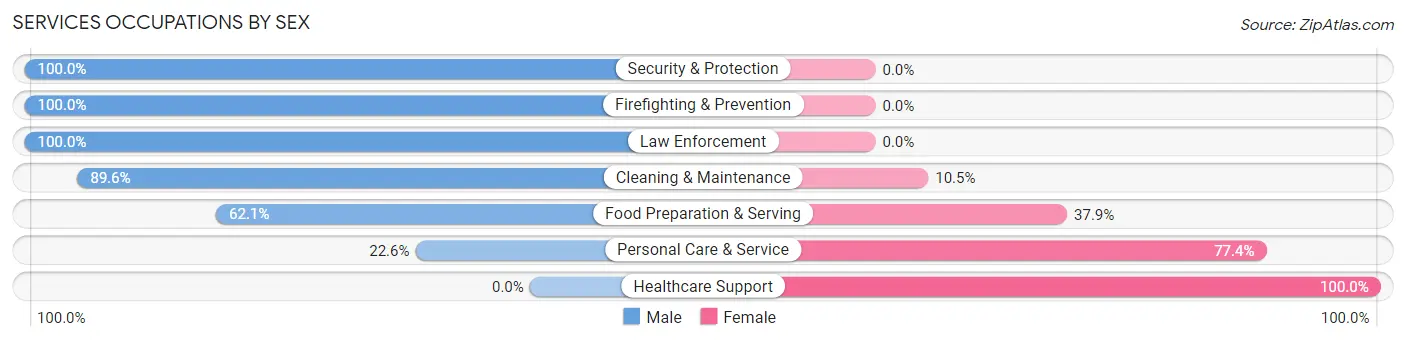
| Occupation | Male | Female |
| Healthcare Support | 0 (0.0%) | 63 (100.0%) |
| Security & Protection | 18 (100.0%) | 0 (0.0%) |
| Firefighting & Prevention | 7 (100.0%) | 0 (0.0%) |
| Law Enforcement | 11 (100.0%) | 0 (0.0%) |
| Food Preparation & Serving | 18 (62.1%) | 11 (37.9%) |
| Cleaning & Maintenance | 60 (89.5%) | 7 (10.4%) |
| Personal Care & Service | 12 (22.6%) | 41 (77.4%) |
| Total (Category) | 108 (47.0%) | 122 (53.0%) |
| Total (Overall) | 988 (56.9%) | 748 (43.1%) |
Sales and Office Occupations
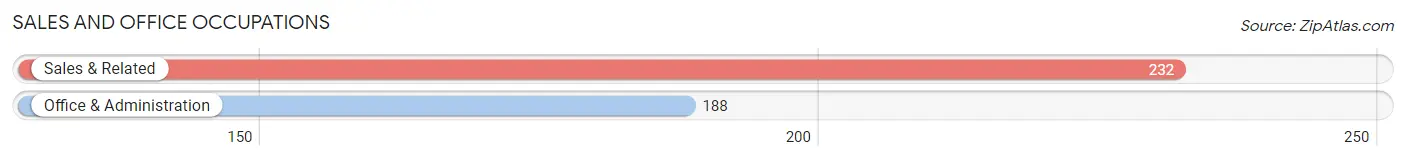
The most common Sales and Office occupations in East Greenville borough are Sales & Related (232 | 13.4%), and Office & Administration (188 | 10.8%).
Sales and Office Occupations by Sex
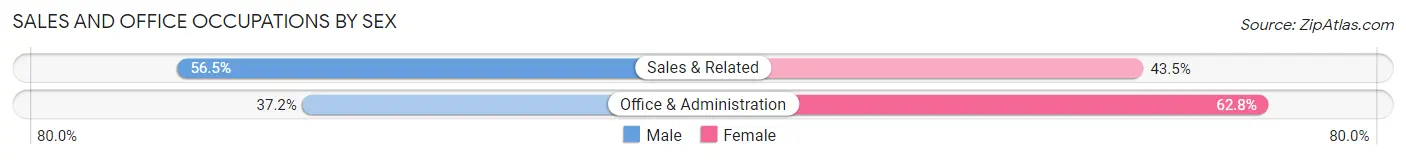
| Occupation | Male | Female |
| Sales & Related | 131 (56.5%) | 101 (43.5%) |
| Office & Administration | 70 (37.2%) | 118 (62.8%) |
| Total (Category) | 201 (47.9%) | 219 (52.1%) |
| Total (Overall) | 988 (56.9%) | 748 (43.1%) |
Natural Resources, Construction and Maintenance Occupations
The most common Natural Resources, Construction and Maintenance occupations in East Greenville borough are Construction & Extraction (111 | 6.4%), Installation, Maintenance & Repair (68 | 3.9%), and Farming, Fishing & Forestry (16 | 0.9%).
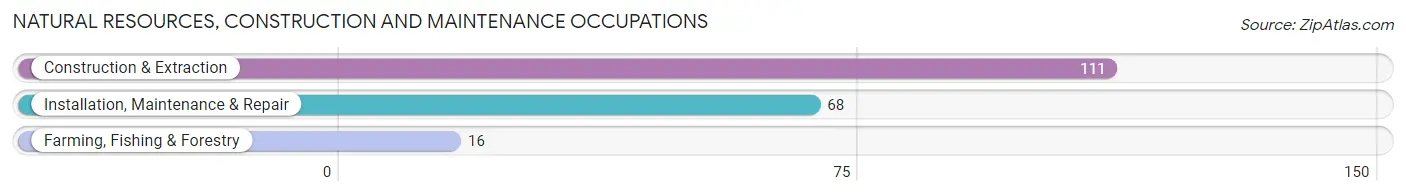
Natural Resources, Construction and Maintenance Occupations by Sex
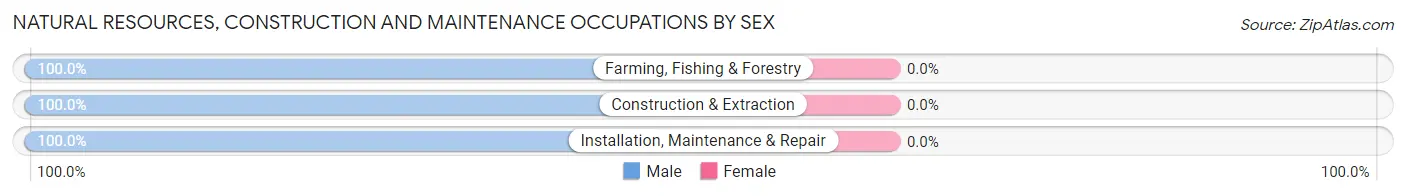
| Occupation | Male | Female |
| Farming, Fishing & Forestry | 16 (100.0%) | 0 (0.0%) |
| Construction & Extraction | 111 (100.0%) | 0 (0.0%) |
| Installation, Maintenance & Repair | 68 (100.0%) | 0 (0.0%) |
| Total (Category) | 195 (100.0%) | 0 (0.0%) |
| Total (Overall) | 988 (56.9%) | 748 (43.1%) |
Production, Transportation and Moving Occupations
The most common Production, Transportation and Moving occupations in East Greenville borough are Production (264 | 15.2%), Material Moving (117 | 6.7%), and Transportation (73 | 4.2%).
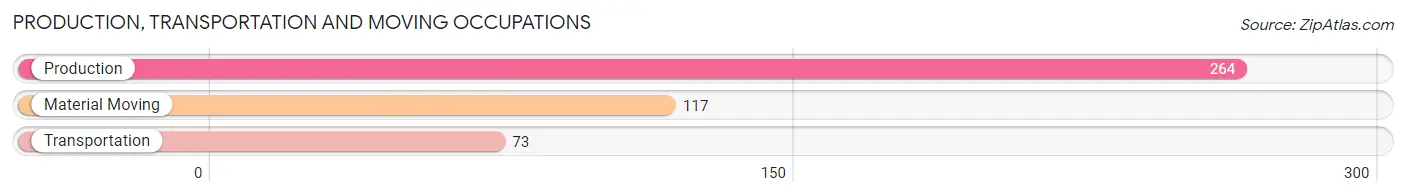
Production, Transportation and Moving Occupations by Sex
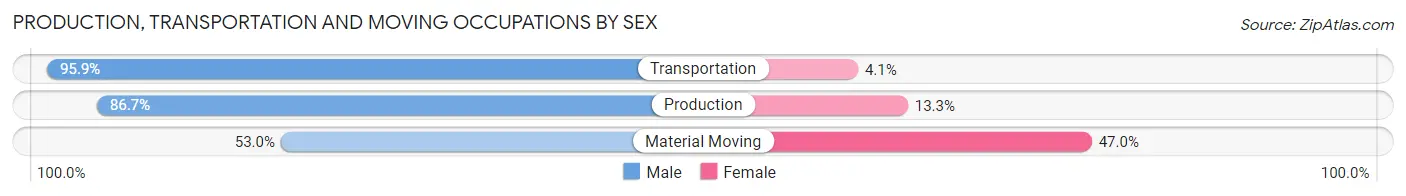
| Occupation | Male | Female |
| Production | 229 (86.7%) | 35 (13.3%) |
| Transportation | 70 (95.9%) | 3 (4.1%) |
| Material Moving | 62 (53.0%) | 55 (47.0%) |
| Total (Category) | 361 (79.5%) | 93 (20.5%) |
| Total (Overall) | 988 (56.9%) | 748 (43.1%) |
Employment Industries by Sex in East Greenville borough
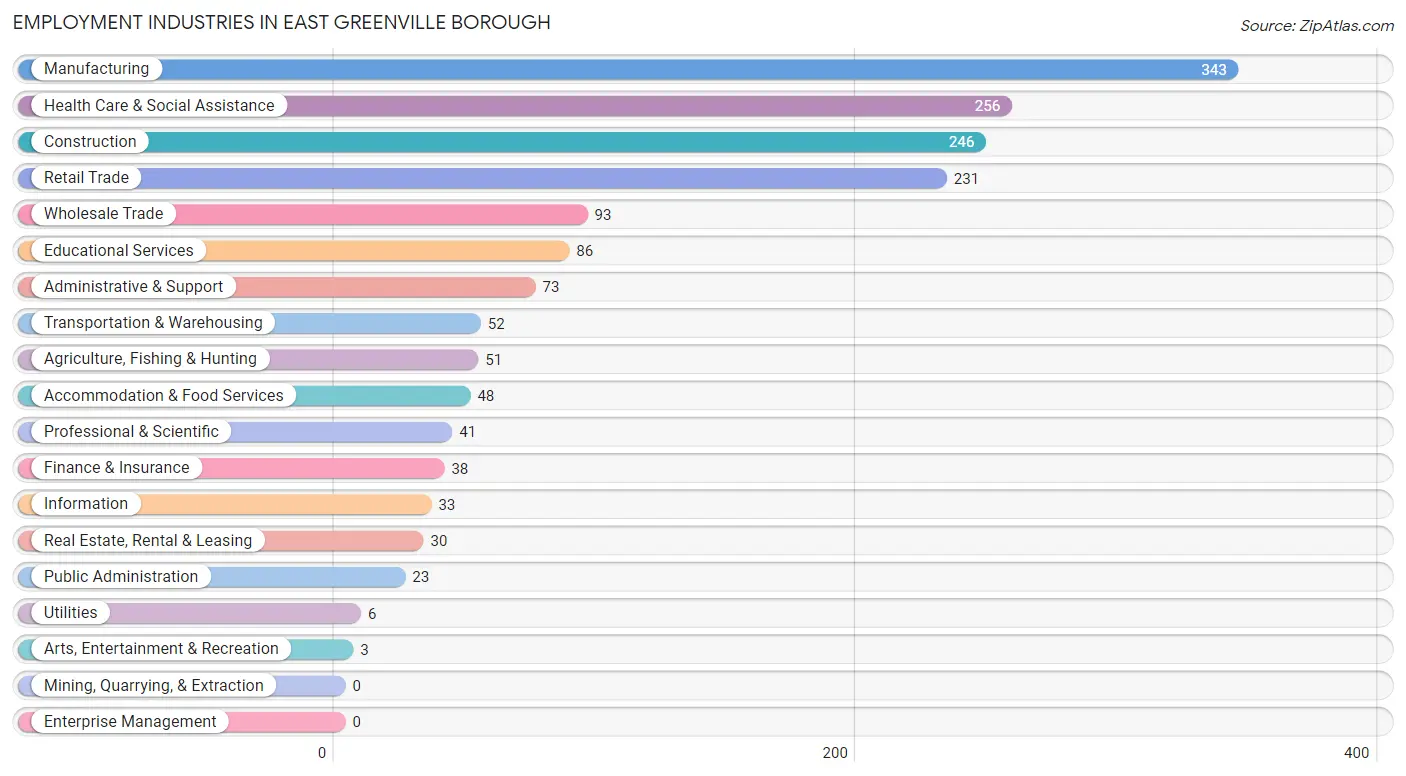
Employment Industries in East Greenville borough
The major employment industries in East Greenville borough include Manufacturing (343 | 19.8%), Health Care & Social Assistance (256 | 14.7%), Construction (246 | 14.2%), Retail Trade (231 | 13.3%), and Wholesale Trade (93 | 5.4%).
Employment Industries by Sex in East Greenville borough
The East Greenville borough industries that see more men than women are Utilities (100.0%), Transportation & Warehousing (94.2%), and Construction (89.0%), whereas the industries that tend to have a higher number of women are Information (100.0%), Finance & Insurance (100.0%), and Arts, Entertainment & Recreation (100.0%).
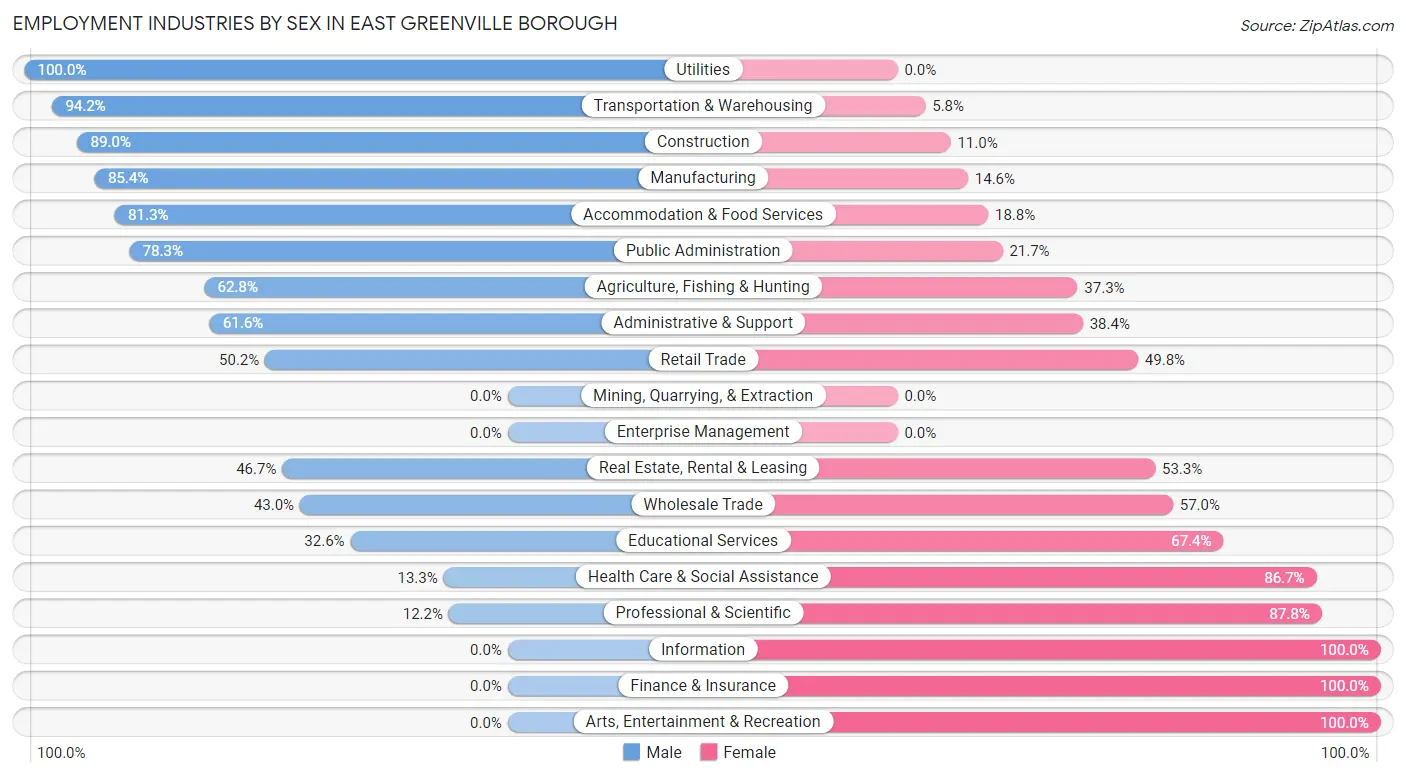
| Industry | Male | Female |
| Agriculture, Fishing & Hunting | 32 (62.7%) | 19 (37.2%) |
| Mining, Quarrying, & Extraction | 0 (0.0%) | 0 (0.0%) |
| Construction | 219 (89.0%) | 27 (11.0%) |
| Manufacturing | 293 (85.4%) | 50 (14.6%) |
| Wholesale Trade | 40 (43.0%) | 53 (57.0%) |
| Retail Trade | 116 (50.2%) | 115 (49.8%) |
| Transportation & Warehousing | 49 (94.2%) | 3 (5.8%) |
| Utilities | 6 (100.0%) | 0 (0.0%) |
| Information | 0 (0.0%) | 33 (100.0%) |
| Finance & Insurance | 0 (0.0%) | 38 (100.0%) |
| Real Estate, Rental & Leasing | 14 (46.7%) | 16 (53.3%) |
| Professional & Scientific | 5 (12.2%) | 36 (87.8%) |
| Enterprise Management | 0 (0.0%) | 0 (0.0%) |
| Administrative & Support | 45 (61.6%) | 28 (38.4%) |
| Educational Services | 28 (32.6%) | 58 (67.4%) |
| Health Care & Social Assistance | 34 (13.3%) | 222 (86.7%) |
| Arts, Entertainment & Recreation | 0 (0.0%) | 3 (100.0%) |
| Accommodation & Food Services | 39 (81.2%) | 9 (18.8%) |
| Public Administration | 18 (78.3%) | 5 (21.7%) |
| Total | 988 (56.9%) | 748 (43.1%) |
Education in East Greenville borough
School Enrollment in East Greenville borough
The most common levels of schooling among the 734 students in East Greenville borough are college / undergraduate (187 | 25.5%), elementary school (144 | 19.6%), and middle school (144 | 19.6%).
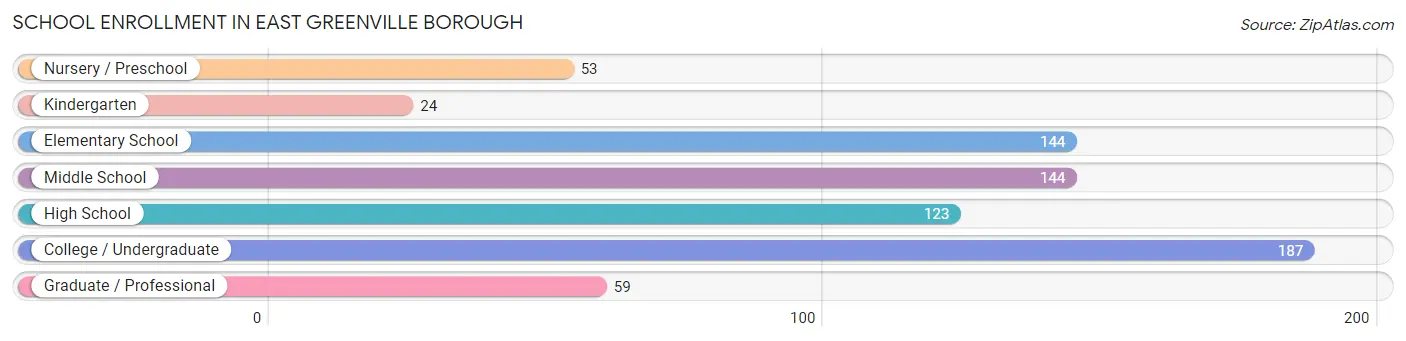
| School Level | # Students | % Students |
| Nursery / Preschool | 53 | 7.2% |
| Kindergarten | 24 | 3.3% |
| Elementary School | 144 | 19.6% |
| Middle School | 144 | 19.6% |
| High School | 123 | 16.8% |
| College / Undergraduate | 187 | 25.5% |
| Graduate / Professional | 59 | 8.0% |
| Total | 734 | 100.0% |
School Enrollment by Age by Funding Source in East Greenville borough
Out of a total of 734 students who are enrolled in schools in East Greenville borough, 153 (20.8%) attend a private institution, while the remaining 581 (79.2%) are enrolled in public schools. The age group of 3 to 4 year olds has the highest likelihood of being enrolled in private schools, with 16 (51.6% in the age bracket) enrolled. Conversely, the age group of 18 to 19 year olds has the lowest likelihood of being enrolled in a private school, with 37 (100.0% in the age bracket) attending a public institution.
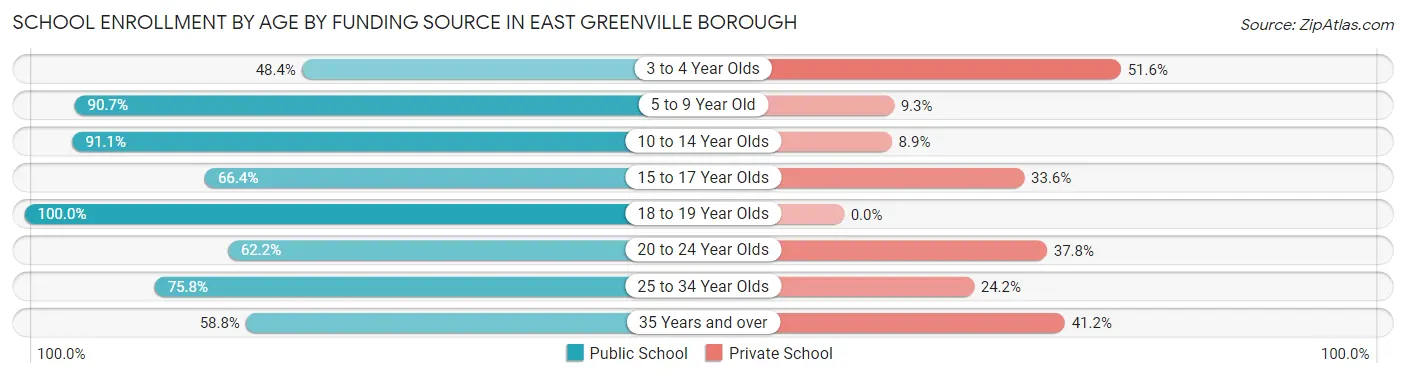
| Age Bracket | Public School | Private School |
| 3 to 4 Year Olds | 15 (48.4%) | 16 (51.6%) |
| 5 to 9 Year Old | 146 (90.7%) | 15 (9.3%) |
| 10 to 14 Year Olds | 163 (91.1%) | 16 (8.9%) |
| 15 to 17 Year Olds | 79 (66.4%) | 40 (33.6%) |
| 18 to 19 Year Olds | 37 (100.0%) | 0 (0.0%) |
| 20 to 24 Year Olds | 46 (62.2%) | 28 (37.8%) |
| 25 to 34 Year Olds | 75 (75.8%) | 24 (24.2%) |
| 35 Years and over | 20 (58.8%) | 14 (41.2%) |
| Total | 581 (79.2%) | 153 (20.8%) |
Educational Attainment by Field of Study in East Greenville borough
Business (101 | 19.4%), education (76 | 14.6%), science & technology (68 | 13.1%), arts & humanities (67 | 12.9%), and liberal arts & history (48 | 9.2%) are the most common fields of study among 520 individuals in East Greenville borough who have obtained a bachelor's degree or higher.
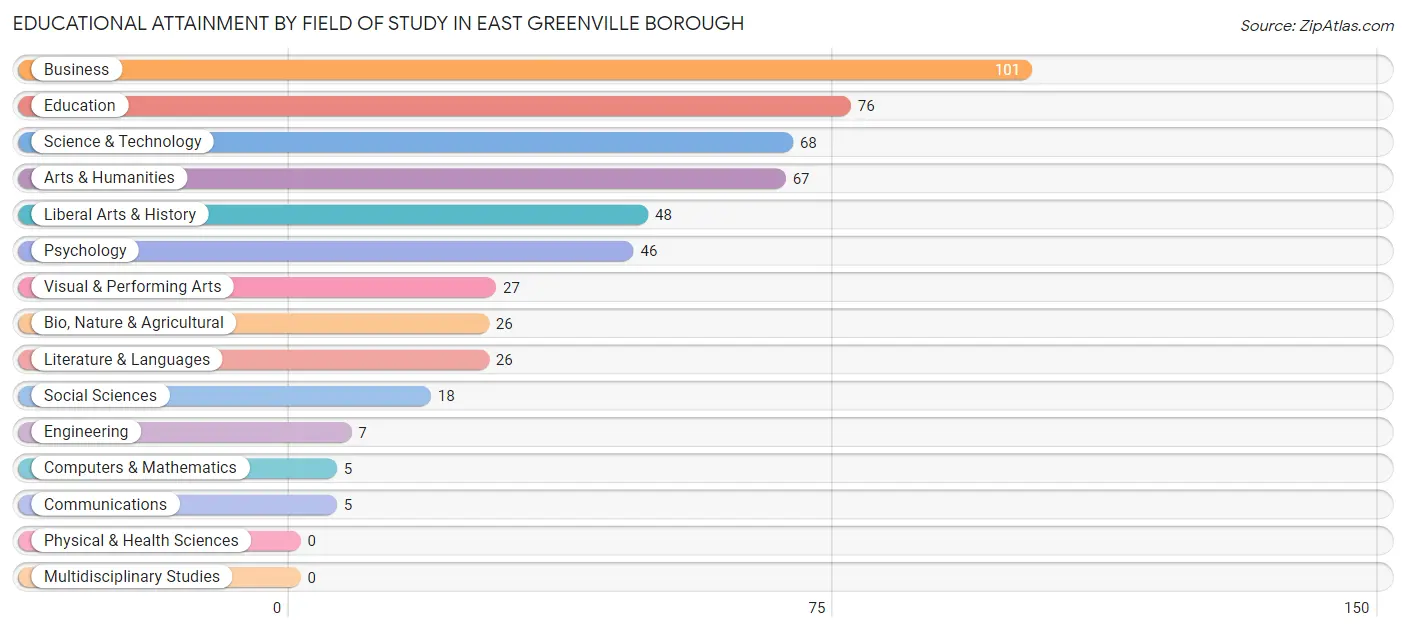
| Field of Study | # Graduates | % Graduates |
| Computers & Mathematics | 5 | 1.0% |
| Bio, Nature & Agricultural | 26 | 5.0% |
| Physical & Health Sciences | 0 | 0.0% |
| Psychology | 46 | 8.8% |
| Social Sciences | 18 | 3.5% |
| Engineering | 7 | 1.3% |
| Multidisciplinary Studies | 0 | 0.0% |
| Science & Technology | 68 | 13.1% |
| Business | 101 | 19.4% |
| Education | 76 | 14.6% |
| Literature & Languages | 26 | 5.0% |
| Liberal Arts & History | 48 | 9.2% |
| Visual & Performing Arts | 27 | 5.2% |
| Communications | 5 | 1.0% |
| Arts & Humanities | 67 | 12.9% |
| Total | 520 | 100.0% |
Transportation & Commute in East Greenville borough
Vehicle Availability by Sex in East Greenville borough
The most prevalent vehicle ownership categories in East Greenville borough are males with 2 vehicles (573, accounting for 59.2%) and females with 2 vehicles (342, making up 78.0%).
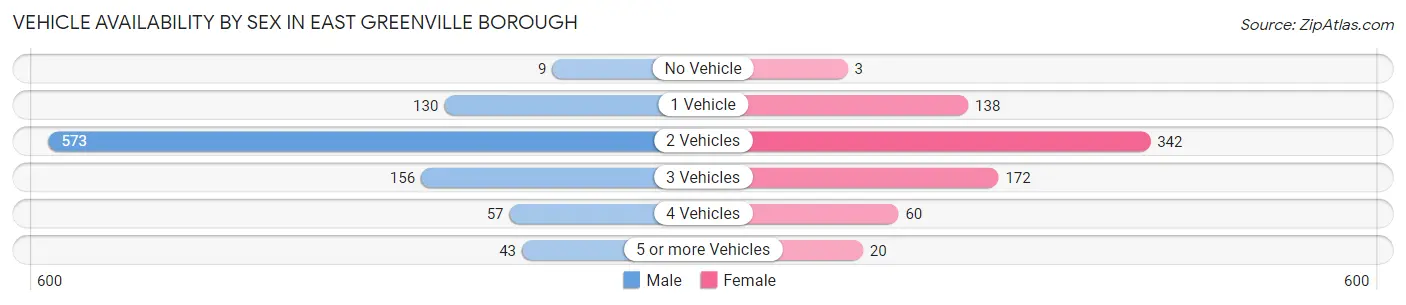
| Vehicles Available | Male | Female |
| No Vehicle | 9 (0.9%) | 3 (0.4%) |
| 1 Vehicle | 130 (13.4%) | 138 (18.8%) |
| 2 Vehicles | 573 (59.2%) | 342 (46.5%) |
| 3 Vehicles | 156 (16.1%) | 172 (23.4%) |
| 4 Vehicles | 57 (5.9%) | 60 (8.2%) |
| 5 or more Vehicles | 43 (4.4%) | 20 (2.7%) |
| Total | 968 (100.0%) | 735 (100.0%) |
Commute Time in East Greenville borough
The most frequently occuring commute durations in East Greenville borough are 30 to 34 minutes (216 commuters, 13.1%), 45 to 59 minutes (183 commuters, 11.1%), and 20 to 24 minutes (182 commuters, 11.0%).
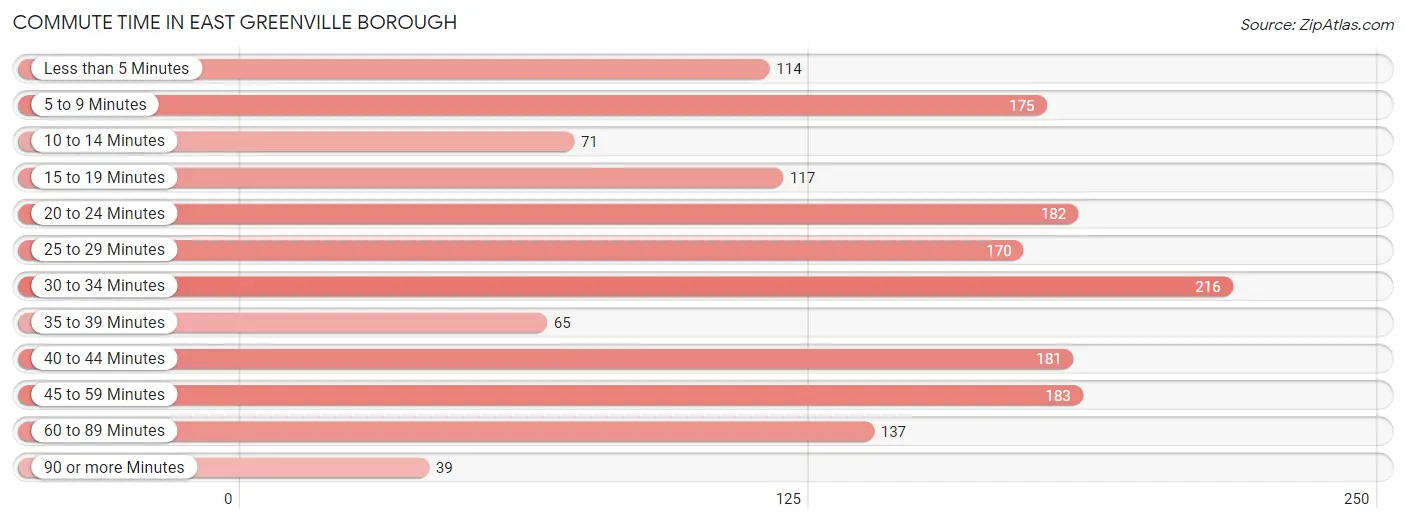
| Commute Time | # Commuters | % Commuters |
| Less than 5 Minutes | 114 | 6.9% |
| 5 to 9 Minutes | 175 | 10.6% |
| 10 to 14 Minutes | 71 | 4.3% |
| 15 to 19 Minutes | 117 | 7.1% |
| 20 to 24 Minutes | 182 | 11.0% |
| 25 to 29 Minutes | 170 | 10.3% |
| 30 to 34 Minutes | 216 | 13.1% |
| 35 to 39 Minutes | 65 | 3.9% |
| 40 to 44 Minutes | 181 | 11.0% |
| 45 to 59 Minutes | 183 | 11.1% |
| 60 to 89 Minutes | 137 | 8.3% |
| 90 or more Minutes | 39 | 2.4% |
Commute Time by Sex in East Greenville borough
The most common commute times in East Greenville borough are 30 to 34 minutes (123 commuters, 12.6%) for males and 20 to 24 minutes (121 commuters, 18.0%) for females.
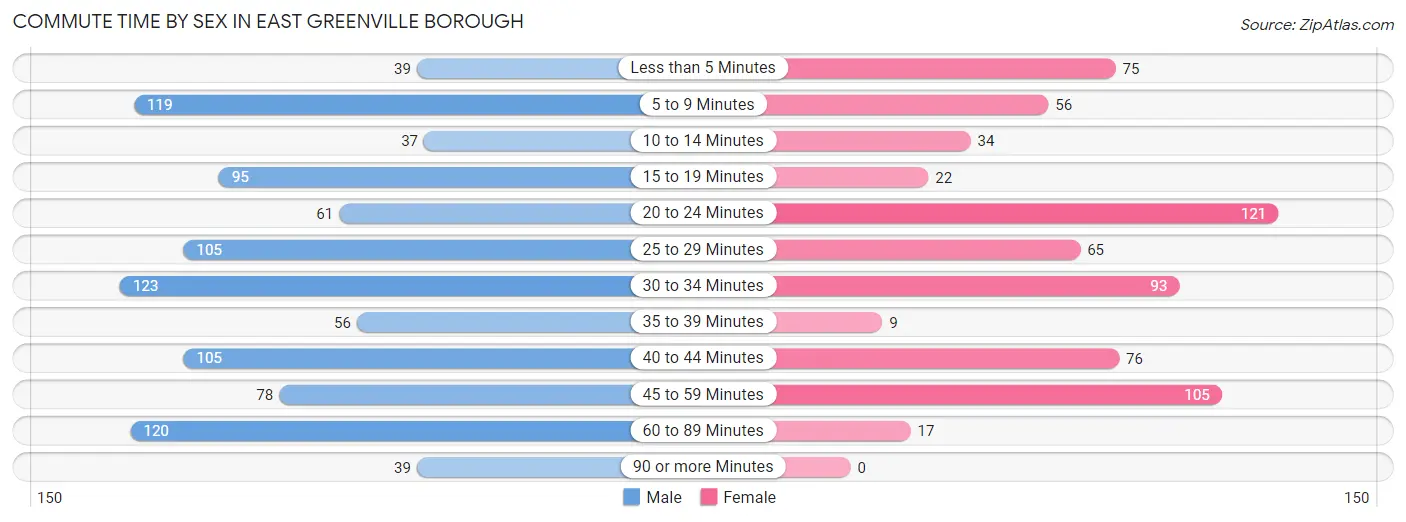
| Commute Time | Male | Female |
| Less than 5 Minutes | 39 (4.0%) | 75 (11.1%) |
| 5 to 9 Minutes | 119 (12.2%) | 56 (8.3%) |
| 10 to 14 Minutes | 37 (3.8%) | 34 (5.1%) |
| 15 to 19 Minutes | 95 (9.7%) | 22 (3.3%) |
| 20 to 24 Minutes | 61 (6.2%) | 121 (18.0%) |
| 25 to 29 Minutes | 105 (10.7%) | 65 (9.7%) |
| 30 to 34 Minutes | 123 (12.6%) | 93 (13.8%) |
| 35 to 39 Minutes | 56 (5.7%) | 9 (1.3%) |
| 40 to 44 Minutes | 105 (10.7%) | 76 (11.3%) |
| 45 to 59 Minutes | 78 (8.0%) | 105 (15.6%) |
| 60 to 89 Minutes | 120 (12.3%) | 17 (2.5%) |
| 90 or more Minutes | 39 (4.0%) | 0 (0.0%) |
Time of Departure to Work by Sex in East Greenville borough
The most frequent times of departure to work in East Greenville borough are 6:30 AM to 6:59 AM (149, 15.2%) for males and 4:00 PM to 11:59 PM (113, 16.8%) for females.
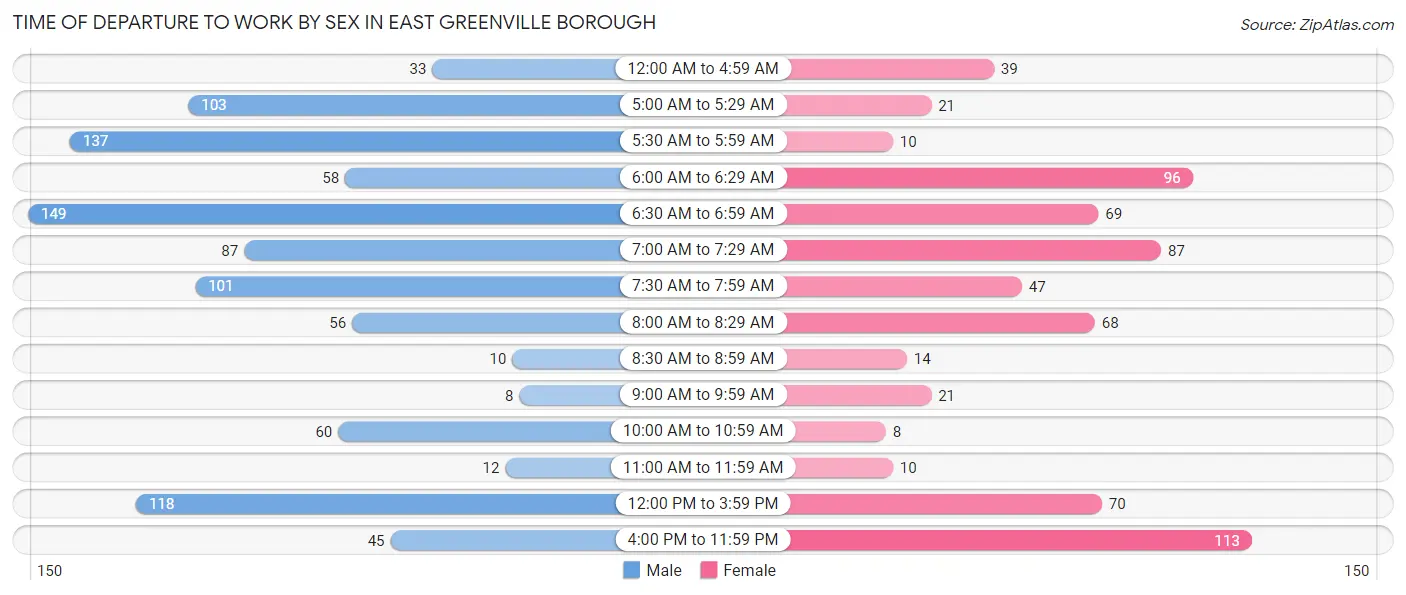
| Time of Departure | Male | Female |
| 12:00 AM to 4:59 AM | 33 (3.4%) | 39 (5.8%) |
| 5:00 AM to 5:29 AM | 103 (10.5%) | 21 (3.1%) |
| 5:30 AM to 5:59 AM | 137 (14.0%) | 10 (1.5%) |
| 6:00 AM to 6:29 AM | 58 (5.9%) | 96 (14.3%) |
| 6:30 AM to 6:59 AM | 149 (15.2%) | 69 (10.2%) |
| 7:00 AM to 7:29 AM | 87 (8.9%) | 87 (12.9%) |
| 7:30 AM to 7:59 AM | 101 (10.3%) | 47 (7.0%) |
| 8:00 AM to 8:29 AM | 56 (5.7%) | 68 (10.1%) |
| 8:30 AM to 8:59 AM | 10 (1.0%) | 14 (2.1%) |
| 9:00 AM to 9:59 AM | 8 (0.8%) | 21 (3.1%) |
| 10:00 AM to 10:59 AM | 60 (6.1%) | 8 (1.2%) |
| 11:00 AM to 11:59 AM | 12 (1.2%) | 10 (1.5%) |
| 12:00 PM to 3:59 PM | 118 (12.1%) | 70 (10.4%) |
| 4:00 PM to 11:59 PM | 45 (4.6%) | 113 (16.8%) |
| Total | 977 (100.0%) | 673 (100.0%) |
Housing Occupancy in East Greenville borough
Occupancy by Ownership in East Greenville borough
Of the total 1,135 dwellings in East Greenville borough, owner-occupied units account for 647 (57.0%), while renter-occupied units make up 488 (43.0%).
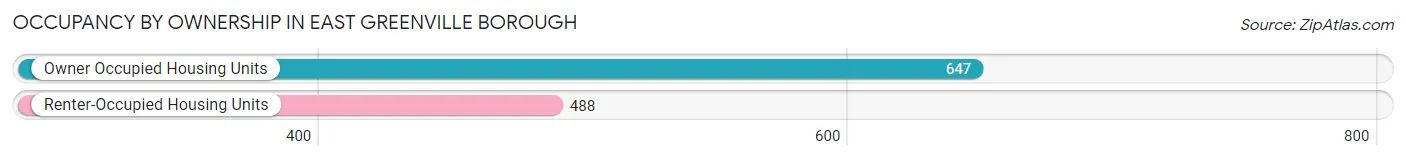
| Occupancy | # Housing Units | % Housing Units |
| Owner Occupied Housing Units | 647 | 57.0% |
| Renter-Occupied Housing Units | 488 | 43.0% |
| Total Occupied Housing Units | 1,135 | 100.0% |
Occupancy by Household Size in East Greenville borough
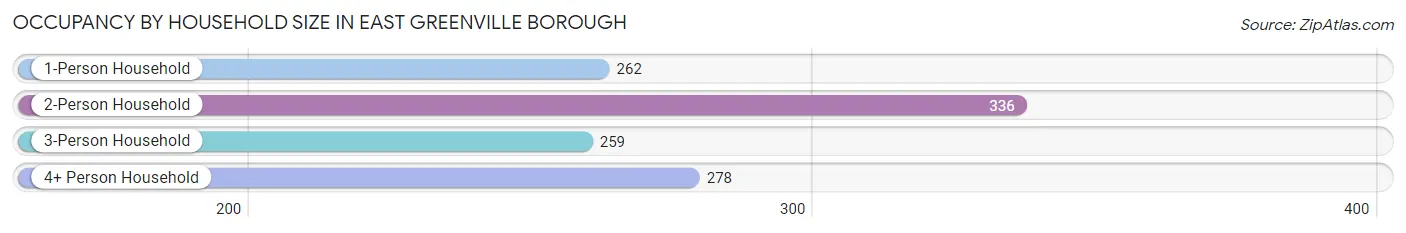
| Household Size | # Housing Units | % Housing Units |
| 1-Person Household | 262 | 23.1% |
| 2-Person Household | 336 | 29.6% |
| 3-Person Household | 259 | 22.8% |
| 4+ Person Household | 278 | 24.5% |
| Total Housing Units | 1,135 | 100.0% |
Occupancy by Ownership by Household Size in East Greenville borough
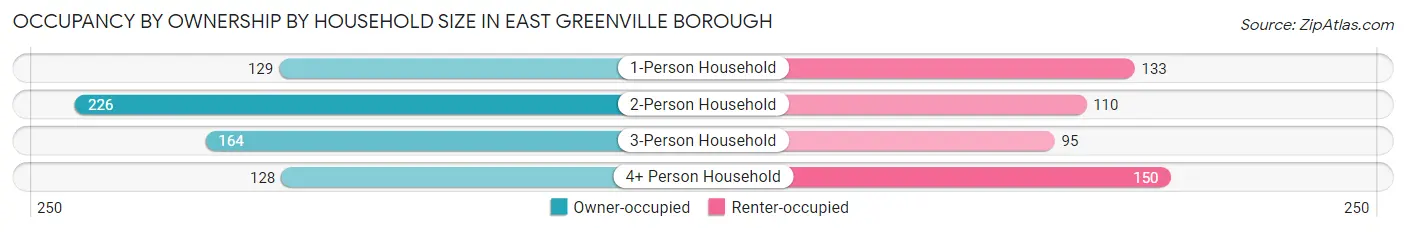
| Household Size | Owner-occupied | Renter-occupied |
| 1-Person Household | 129 (49.2%) | 133 (50.8%) |
| 2-Person Household | 226 (67.3%) | 110 (32.7%) |
| 3-Person Household | 164 (63.3%) | 95 (36.7%) |
| 4+ Person Household | 128 (46.0%) | 150 (54.0%) |
| Total Housing Units | 647 (57.0%) | 488 (43.0%) |
Occupancy by Educational Attainment in East Greenville borough
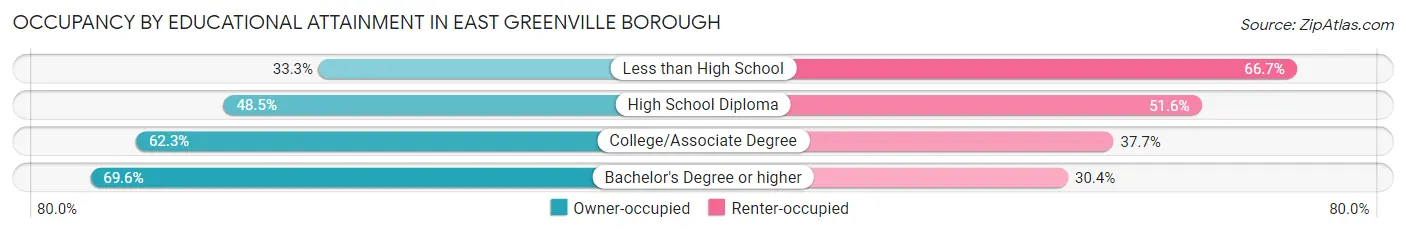
| Household Size | Owner-occupied | Renter-occupied |
| Less than High School | 17 (33.3%) | 34 (66.7%) |
| High School Diploma | 235 (48.4%) | 250 (51.5%) |
| College/Associate Degree | 187 (62.3%) | 113 (37.7%) |
| Bachelor's Degree or higher | 208 (69.6%) | 91 (30.4%) |
Occupancy by Age of Householder in East Greenville borough
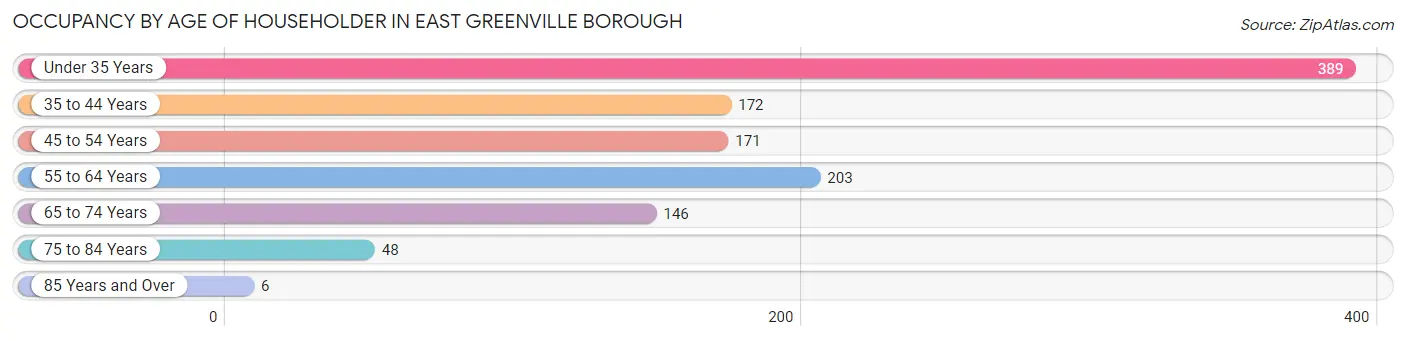
| Age Bracket | # Households | % Households |
| Under 35 Years | 389 | 34.3% |
| 35 to 44 Years | 172 | 15.1% |
| 45 to 54 Years | 171 | 15.1% |
| 55 to 64 Years | 203 | 17.9% |
| 65 to 74 Years | 146 | 12.9% |
| 75 to 84 Years | 48 | 4.2% |
| 85 Years and Over | 6 | 0.5% |
| Total | 1,135 | 100.0% |
Housing Finances in East Greenville borough
Median Income by Occupancy in East Greenville borough
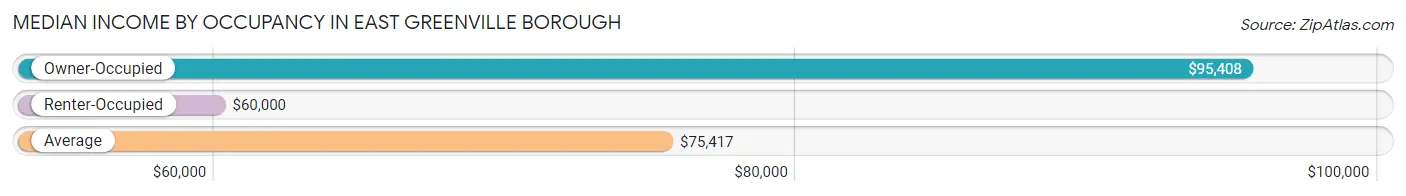
| Occupancy Type | # Households | Median Income |
| Owner-Occupied | 647 (57.0%) | $95,408 |
| Renter-Occupied | 488 (43.0%) | $60,000 |
| Average | 1,135 (100.0%) | $75,417 |
Occupancy by Householder Income Bracket in East Greenville borough
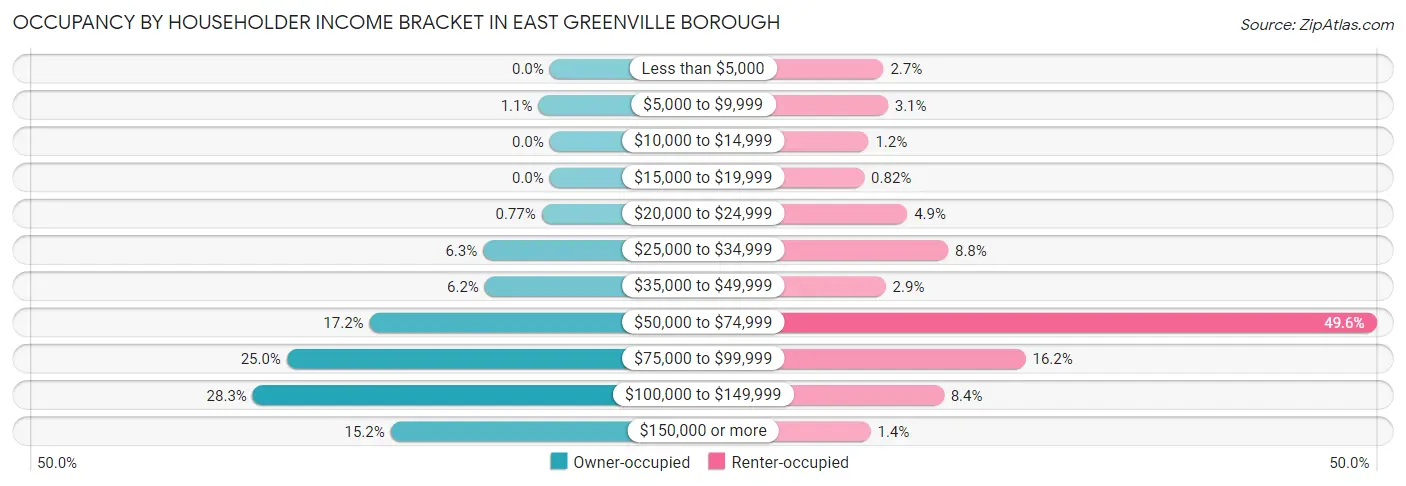
| Income Bracket | Owner-occupied | Renter-occupied |
| Less than $5,000 | 0 (0.0%) | 13 (2.7%) |
| $5,000 to $9,999 | 7 (1.1%) | 15 (3.1%) |
| $10,000 to $14,999 | 0 (0.0%) | 6 (1.2%) |
| $15,000 to $19,999 | 0 (0.0%) | 4 (0.8%) |
| $20,000 to $24,999 | 5 (0.8%) | 24 (4.9%) |
| $25,000 to $34,999 | 41 (6.3%) | 43 (8.8%) |
| $35,000 to $49,999 | 40 (6.2%) | 14 (2.9%) |
| $50,000 to $74,999 | 111 (17.2%) | 242 (49.6%) |
| $75,000 to $99,999 | 162 (25.0%) | 79 (16.2%) |
| $100,000 to $149,999 | 183 (28.3%) | 41 (8.4%) |
| $150,000 or more | 98 (15.1%) | 7 (1.4%) |
| Total | 647 (100.0%) | 488 (100.0%) |
Monthly Housing Cost Tiers in East Greenville borough
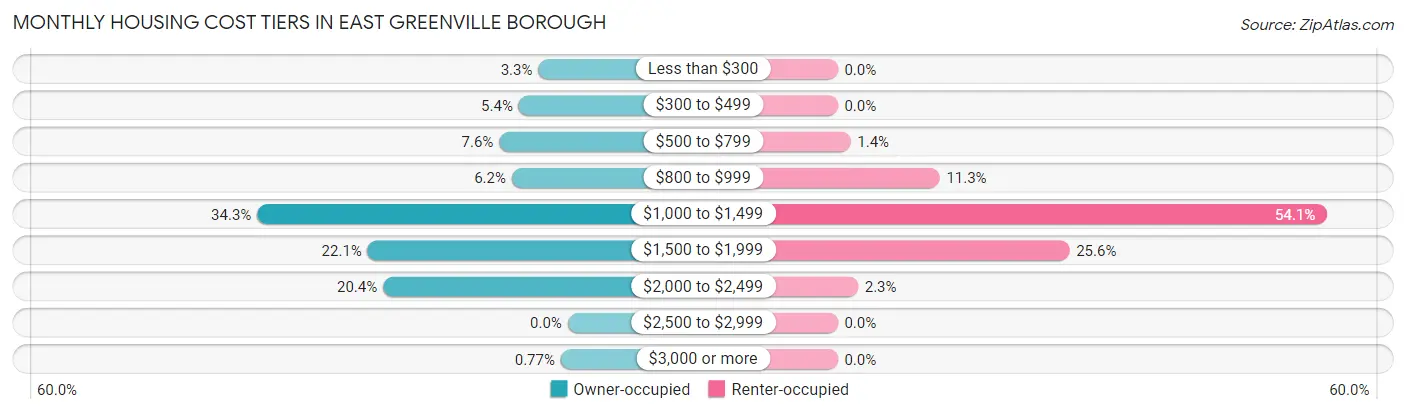
| Monthly Cost | Owner-occupied | Renter-occupied |
| Less than $300 | 21 (3.3%) | 0 (0.0%) |
| $300 to $499 | 35 (5.4%) | 0 (0.0%) |
| $500 to $799 | 49 (7.6%) | 7 (1.4%) |
| $800 to $999 | 40 (6.2%) | 55 (11.3%) |
| $1,000 to $1,499 | 222 (34.3%) | 264 (54.1%) |
| $1,500 to $1,999 | 143 (22.1%) | 125 (25.6%) |
| $2,000 to $2,499 | 132 (20.4%) | 11 (2.2%) |
| $2,500 to $2,999 | 0 (0.0%) | 0 (0.0%) |
| $3,000 or more | 5 (0.8%) | 0 (0.0%) |
| Total | 647 (100.0%) | 488 (100.0%) |
Physical Housing Characteristics in East Greenville borough
Housing Structures in East Greenville borough
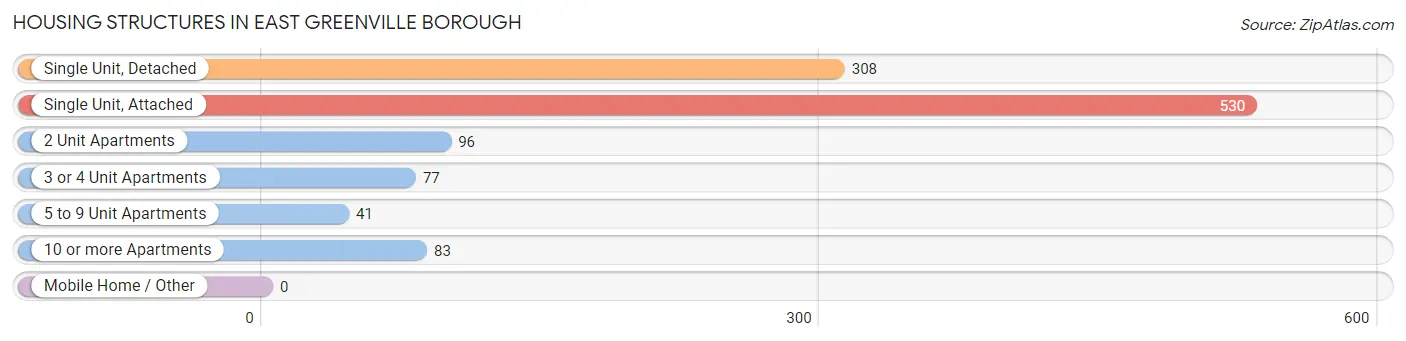
| Structure Type | # Housing Units | % Housing Units |
| Single Unit, Detached | 308 | 27.1% |
| Single Unit, Attached | 530 | 46.7% |
| 2 Unit Apartments | 96 | 8.5% |
| 3 or 4 Unit Apartments | 77 | 6.8% |
| 5 to 9 Unit Apartments | 41 | 3.6% |
| 10 or more Apartments | 83 | 7.3% |
| Mobile Home / Other | 0 | 0.0% |
| Total | 1,135 | 100.0% |
Housing Structures by Occupancy in East Greenville borough
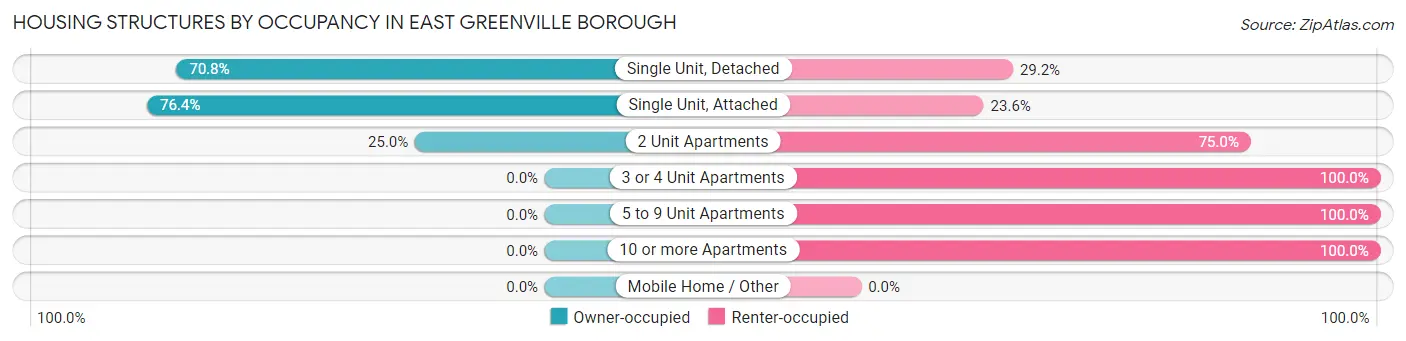
| Structure Type | Owner-occupied | Renter-occupied |
| Single Unit, Detached | 218 (70.8%) | 90 (29.2%) |
| Single Unit, Attached | 405 (76.4%) | 125 (23.6%) |
| 2 Unit Apartments | 24 (25.0%) | 72 (75.0%) |
| 3 or 4 Unit Apartments | 0 (0.0%) | 77 (100.0%) |
| 5 to 9 Unit Apartments | 0 (0.0%) | 41 (100.0%) |
| 10 or more Apartments | 0 (0.0%) | 83 (100.0%) |
| Mobile Home / Other | 0 (0.0%) | 0 (0.0%) |
| Total | 647 (57.0%) | 488 (43.0%) |
Housing Structures by Number of Rooms in East Greenville borough
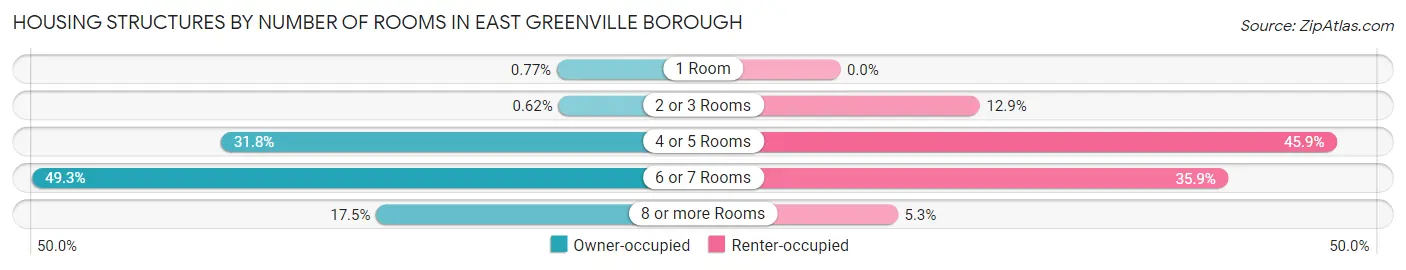
| Number of Rooms | Owner-occupied | Renter-occupied |
| 1 Room | 5 (0.8%) | 0 (0.0%) |
| 2 or 3 Rooms | 4 (0.6%) | 63 (12.9%) |
| 4 or 5 Rooms | 206 (31.8%) | 224 (45.9%) |
| 6 or 7 Rooms | 319 (49.3%) | 175 (35.9%) |
| 8 or more Rooms | 113 (17.5%) | 26 (5.3%) |
| Total | 647 (100.0%) | 488 (100.0%) |
Housing Structure by Heating Type in East Greenville borough
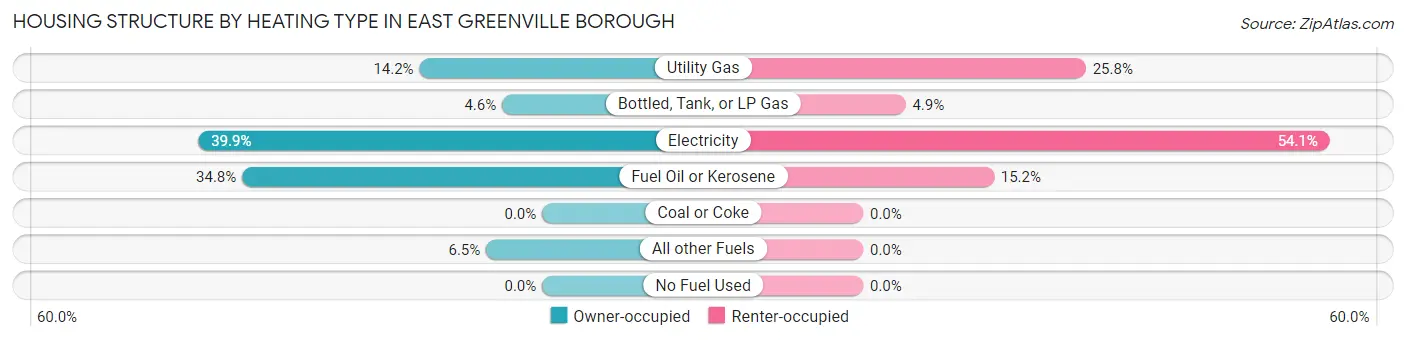
| Heating Type | Owner-occupied | Renter-occupied |
| Utility Gas | 92 (14.2%) | 126 (25.8%) |
| Bottled, Tank, or LP Gas | 30 (4.6%) | 24 (4.9%) |
| Electricity | 258 (39.9%) | 264 (54.1%) |
| Fuel Oil or Kerosene | 225 (34.8%) | 74 (15.2%) |
| Coal or Coke | 0 (0.0%) | 0 (0.0%) |
| All other Fuels | 42 (6.5%) | 0 (0.0%) |
| No Fuel Used | 0 (0.0%) | 0 (0.0%) |
| Total | 647 (100.0%) | 488 (100.0%) |
Household Vehicle Usage in East Greenville borough
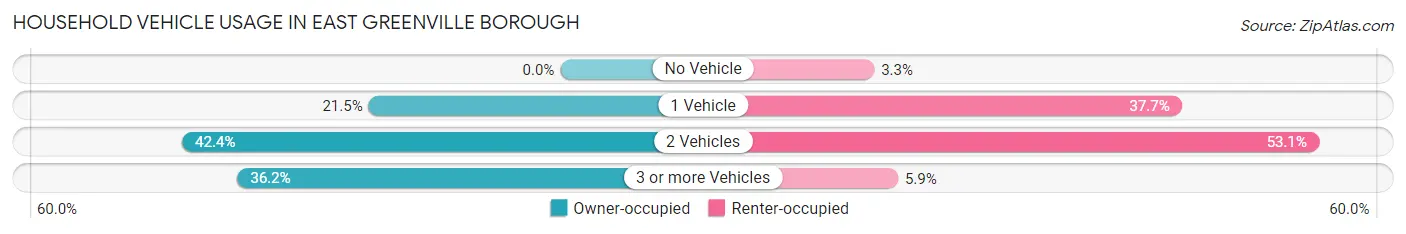
| Vehicles per Household | Owner-occupied | Renter-occupied |
| No Vehicle | 0 (0.0%) | 16 (3.3%) |
| 1 Vehicle | 139 (21.5%) | 184 (37.7%) |
| 2 Vehicles | 274 (42.3%) | 259 (53.1%) |
| 3 or more Vehicles | 234 (36.2%) | 29 (5.9%) |
| Total | 647 (100.0%) | 488 (100.0%) |
Real Estate & Mortgages in East Greenville borough
Real Estate and Mortgage Overview in East Greenville borough
| Characteristic | Without Mortgage | With Mortgage |
| Housing Units | 133 | 514 |
| Median Property Value | $173,100 | $197,700 |
| Median Household Income | $70,781 | $87 |
| Monthly Housing Costs | $575 | $5 |
| Real Estate Taxes | $3,075 | $11 |
Property Value by Mortgage Status in East Greenville borough
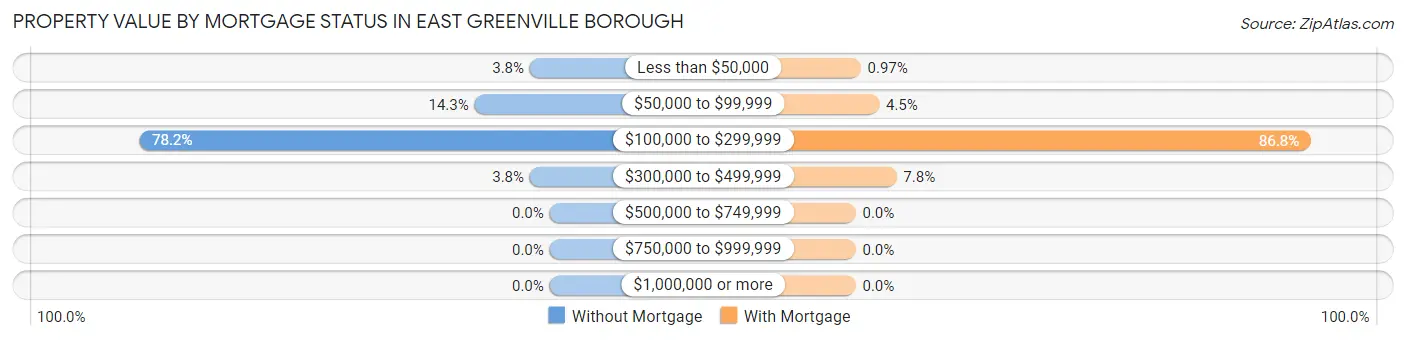
| Property Value | Without Mortgage | With Mortgage |
| Less than $50,000 | 5 (3.8%) | 5 (1.0%) |
| $50,000 to $99,999 | 19 (14.3%) | 23 (4.5%) |
| $100,000 to $299,999 | 104 (78.2%) | 446 (86.8%) |
| $300,000 to $499,999 | 5 (3.8%) | 40 (7.8%) |
| $500,000 to $749,999 | 0 (0.0%) | 0 (0.0%) |
| $750,000 to $999,999 | 0 (0.0%) | 0 (0.0%) |
| $1,000,000 or more | 0 (0.0%) | 0 (0.0%) |
| Total | 133 (100.0%) | 514 (100.0%) |
Household Income by Mortgage Status in East Greenville borough
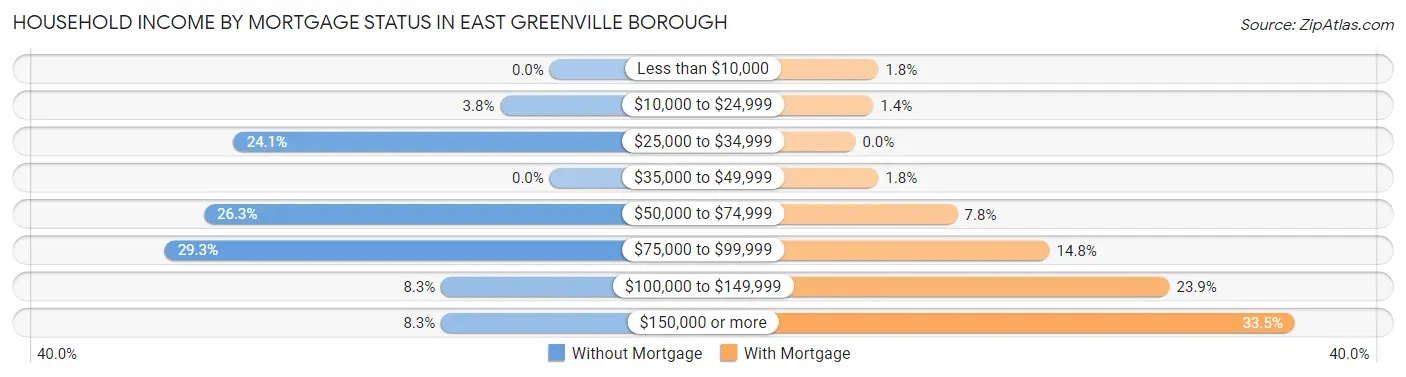
| Household Income | Without Mortgage | With Mortgage |
| Less than $10,000 | 0 (0.0%) | 9 (1.8%) |
| $10,000 to $24,999 | 5 (3.8%) | 7 (1.4%) |
| $25,000 to $34,999 | 32 (24.1%) | 0 (0.0%) |
| $35,000 to $49,999 | 0 (0.0%) | 9 (1.8%) |
| $50,000 to $74,999 | 35 (26.3%) | 40 (7.8%) |
| $75,000 to $99,999 | 39 (29.3%) | 76 (14.8%) |
| $100,000 to $149,999 | 11 (8.3%) | 123 (23.9%) |
| $150,000 or more | 11 (8.3%) | 172 (33.5%) |
| Total | 133 (100.0%) | 514 (100.0%) |
Property Value to Household Income Ratio in East Greenville borough
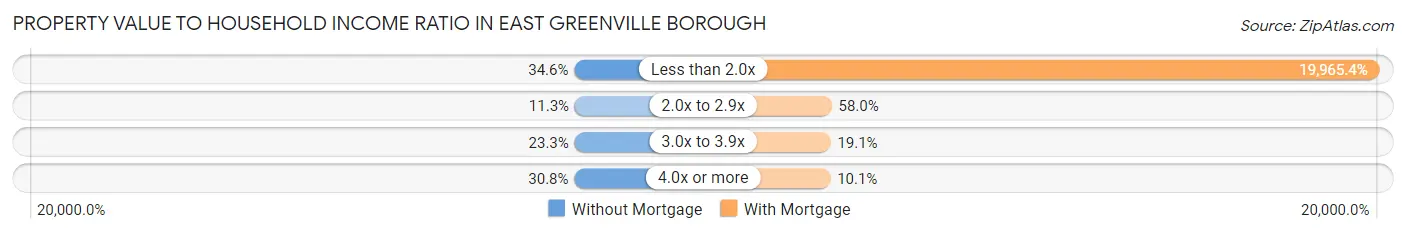
| Value-to-Income Ratio | Without Mortgage | With Mortgage |
| Less than 2.0x | 46 (34.6%) | 102,622 (19,965.4%) |
| 2.0x to 2.9x | 15 (11.3%) | 298 (58.0%) |
| 3.0x to 3.9x | 31 (23.3%) | 98 (19.1%) |
| 4.0x or more | 41 (30.8%) | 52 (10.1%) |
| Total | 133 (100.0%) | 514 (100.0%) |
Real Estate Taxes by Mortgage Status in East Greenville borough
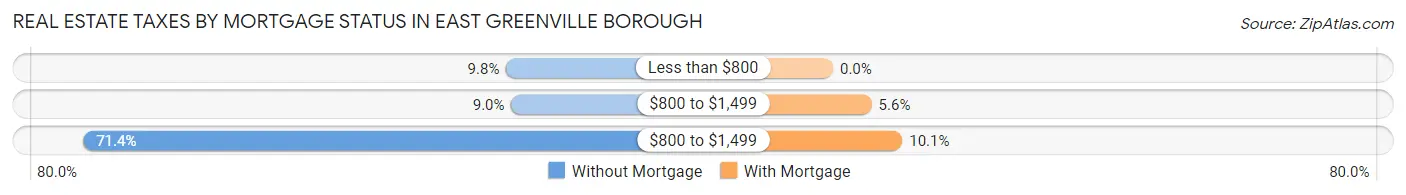
| Property Taxes | Without Mortgage | With Mortgage |
| Less than $800 | 13 (9.8%) | 0 (0.0%) |
| $800 to $1,499 | 12 (9.0%) | 29 (5.6%) |
| $800 to $1,499 | 95 (71.4%) | 52 (10.1%) |
| Total | 133 (100.0%) | 514 (100.0%) |
Health & Disability in East Greenville borough
Health Insurance Coverage by Age in East Greenville borough
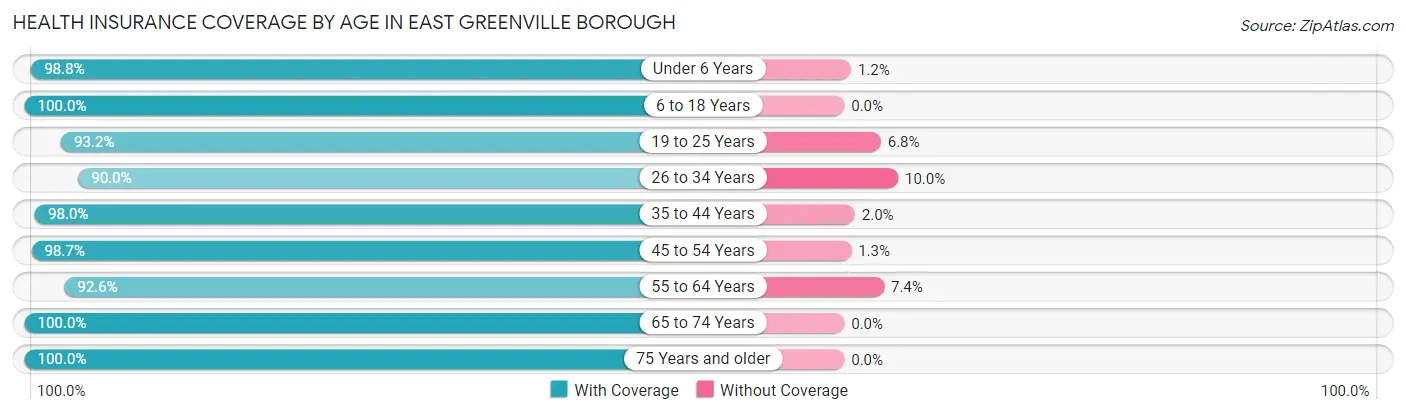
| Age Bracket | With Coverage | Without Coverage |
| Under 6 Years | 397 (98.8%) | 5 (1.2%) |
| 6 to 18 Years | 470 (100.0%) | 0 (0.0%) |
| 19 to 25 Years | 384 (93.2%) | 28 (6.8%) |
| 26 to 34 Years | 458 (90.0%) | 51 (10.0%) |
| 35 to 44 Years | 299 (98.0%) | 6 (2.0%) |
| 45 to 54 Years | 383 (98.7%) | 5 (1.3%) |
| 55 to 64 Years | 350 (92.6%) | 28 (7.4%) |
| 65 to 74 Years | 197 (100.0%) | 0 (0.0%) |
| 75 Years and older | 89 (100.0%) | 0 (0.0%) |
| Total | 3,027 (96.1%) | 123 (3.9%) |
Health Insurance Coverage by Citizenship Status in East Greenville borough
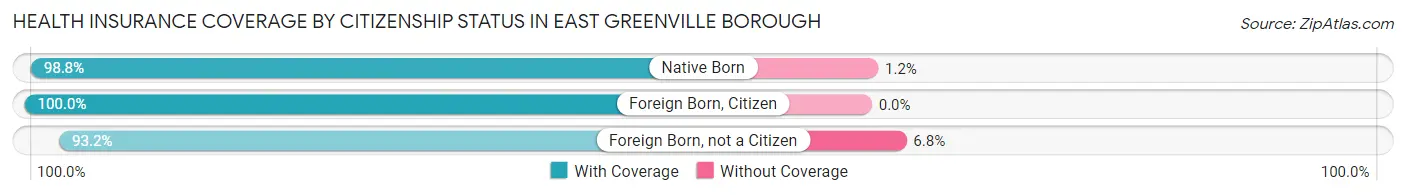
| Citizenship Status | With Coverage | Without Coverage |
| Native Born | 397 (98.8%) | 5 (1.2%) |
| Foreign Born, Citizen | 470 (100.0%) | 0 (0.0%) |
| Foreign Born, not a Citizen | 384 (93.2%) | 28 (6.8%) |
Health Insurance Coverage by Household Income in East Greenville borough
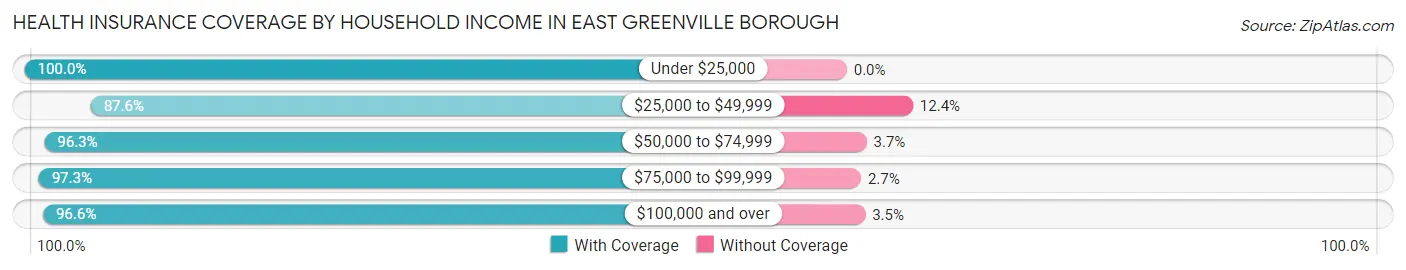
| Household Income | With Coverage | Without Coverage |
| Under $25,000 | 94 (100.0%) | 0 (0.0%) |
| $25,000 to $49,999 | 205 (87.6%) | 29 (12.4%) |
| $50,000 to $74,999 | 1,038 (96.3%) | 40 (3.7%) |
| $75,000 to $99,999 | 694 (97.3%) | 19 (2.7%) |
| $100,000 and over | 980 (96.6%) | 35 (3.5%) |
Public vs Private Health Insurance Coverage by Age in East Greenville borough
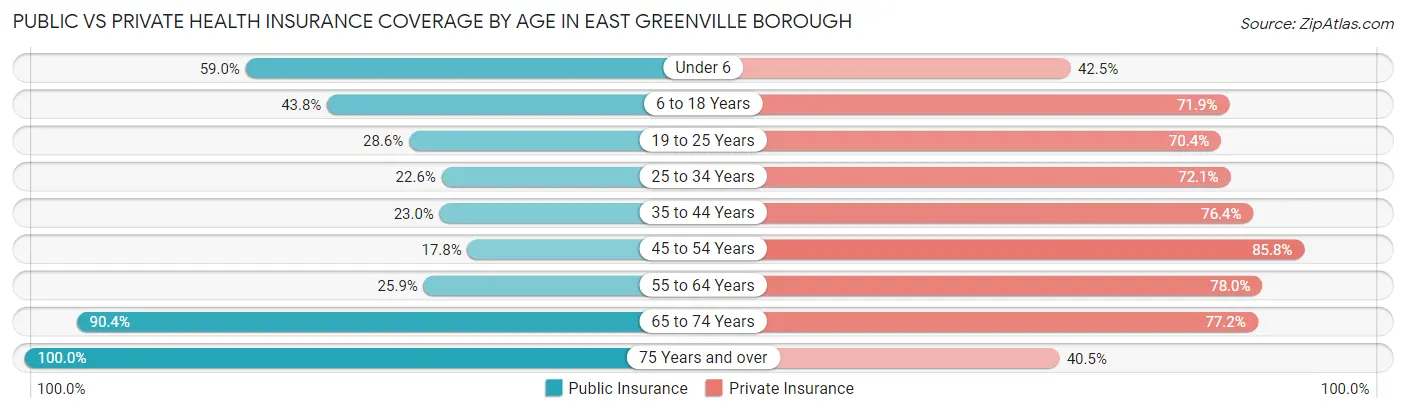
| Age Bracket | Public Insurance | Private Insurance |
| Under 6 | 237 (59.0%) | 171 (42.5%) |
| 6 to 18 Years | 206 (43.8%) | 338 (71.9%) |
| 19 to 25 Years | 118 (28.6%) | 290 (70.4%) |
| 25 to 34 Years | 115 (22.6%) | 367 (72.1%) |
| 35 to 44 Years | 70 (23.0%) | 233 (76.4%) |
| 45 to 54 Years | 69 (17.8%) | 333 (85.8%) |
| 55 to 64 Years | 98 (25.9%) | 295 (78.0%) |
| 65 to 74 Years | 178 (90.4%) | 152 (77.2%) |
| 75 Years and over | 89 (100.0%) | 36 (40.5%) |
| Total | 1,180 (37.5%) | 2,215 (70.3%) |
Disability Status by Sex by Age in East Greenville borough
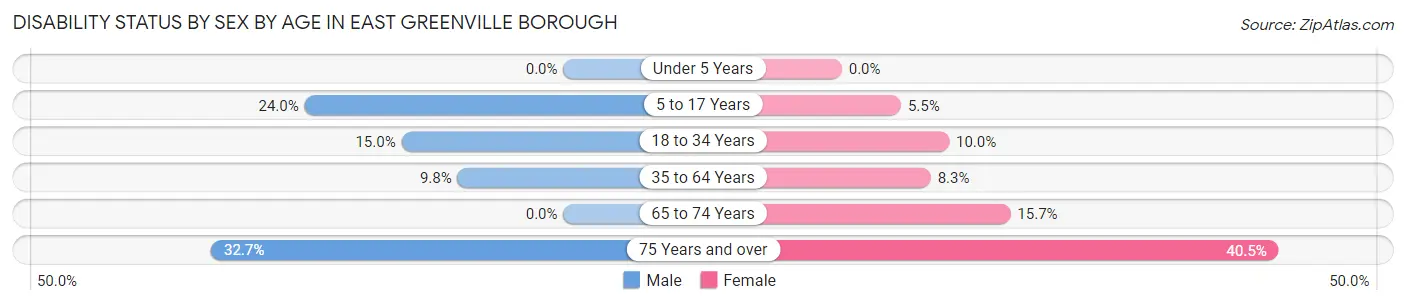
| Age Bracket | Male | Female |
| Under 5 Years | 0 (0.0%) | 0 (0.0%) |
| 5 to 17 Years | 55 (24.0%) | 13 (5.5%) |
| 18 to 34 Years | 79 (15.0%) | 43 (10.0%) |
| 35 to 64 Years | 54 (9.8%) | 43 (8.3%) |
| 65 to 74 Years | 0 (0.0%) | 18 (15.7%) |
| 75 Years and over | 17 (32.7%) | 15 (40.5%) |
Disability Class by Sex by Age in East Greenville borough
Disability Class: Hearing Difficulty
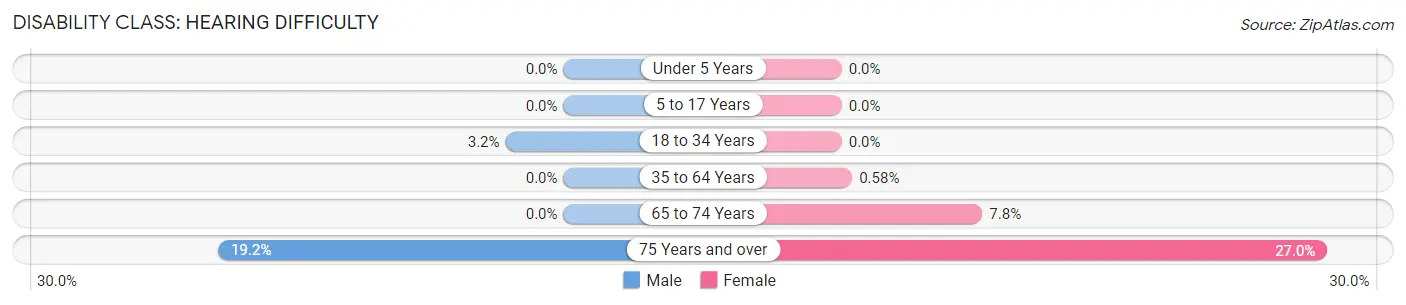
| Age Bracket | Male | Female |
| Under 5 Years | 0 (0.0%) | 0 (0.0%) |
| 5 to 17 Years | 0 (0.0%) | 0 (0.0%) |
| 18 to 34 Years | 17 (3.2%) | 0 (0.0%) |
| 35 to 64 Years | 0 (0.0%) | 3 (0.6%) |
| 65 to 74 Years | 0 (0.0%) | 9 (7.8%) |
| 75 Years and over | 10 (19.2%) | 10 (27.0%) |
Disability Class: Vision Difficulty
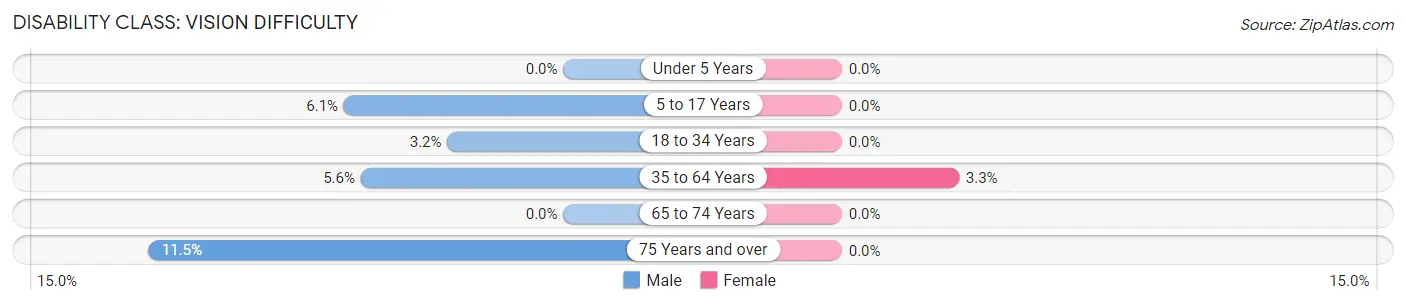
| Age Bracket | Male | Female |
| Under 5 Years | 0 (0.0%) | 0 (0.0%) |
| 5 to 17 Years | 14 (6.1%) | 0 (0.0%) |
| 18 to 34 Years | 17 (3.2%) | 0 (0.0%) |
| 35 to 64 Years | 31 (5.6%) | 17 (3.3%) |
| 65 to 74 Years | 0 (0.0%) | 0 (0.0%) |
| 75 Years and over | 6 (11.5%) | 0 (0.0%) |
Disability Class: Cognitive Difficulty
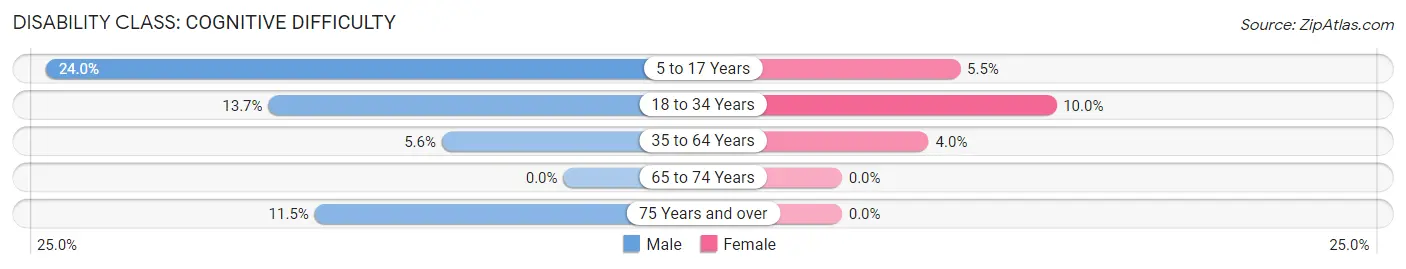
| Age Bracket | Male | Female |
| 5 to 17 Years | 55 (24.0%) | 13 (5.5%) |
| 18 to 34 Years | 72 (13.7%) | 43 (10.0%) |
| 35 to 64 Years | 31 (5.6%) | 21 (4.0%) |
| 65 to 74 Years | 0 (0.0%) | 0 (0.0%) |
| 75 Years and over | 6 (11.5%) | 0 (0.0%) |
Disability Class: Ambulatory Difficulty
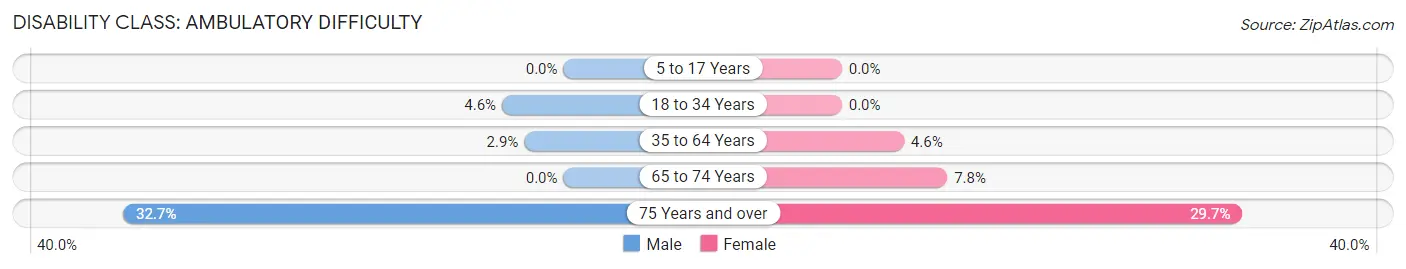
| Age Bracket | Male | Female |
| 5 to 17 Years | 0 (0.0%) | 0 (0.0%) |
| 18 to 34 Years | 24 (4.6%) | 0 (0.0%) |
| 35 to 64 Years | 16 (2.9%) | 24 (4.6%) |
| 65 to 74 Years | 0 (0.0%) | 9 (7.8%) |
| 75 Years and over | 17 (32.7%) | 11 (29.7%) |
Disability Class: Self-Care Difficulty
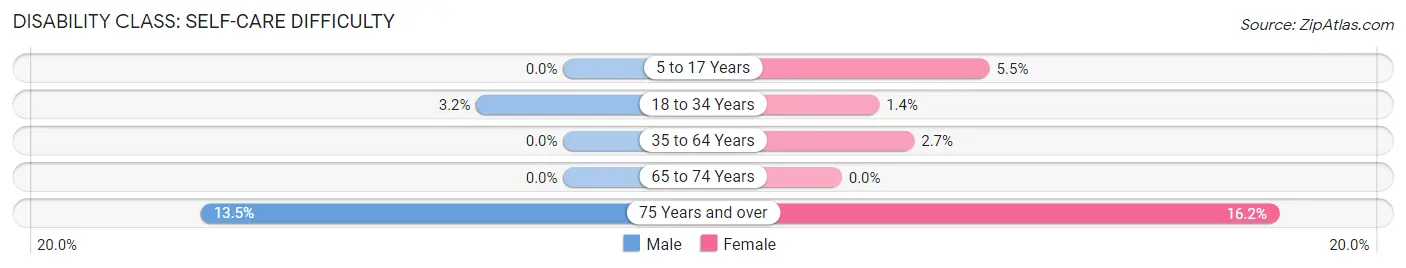
| Age Bracket | Male | Female |
| 5 to 17 Years | 0 (0.0%) | 13 (5.5%) |
| 18 to 34 Years | 17 (3.2%) | 6 (1.4%) |
| 35 to 64 Years | 0 (0.0%) | 14 (2.7%) |
| 65 to 74 Years | 0 (0.0%) | 0 (0.0%) |
| 75 Years and over | 7 (13.5%) | 6 (16.2%) |
Technology Access in East Greenville borough
Computing Device Access in East Greenville borough
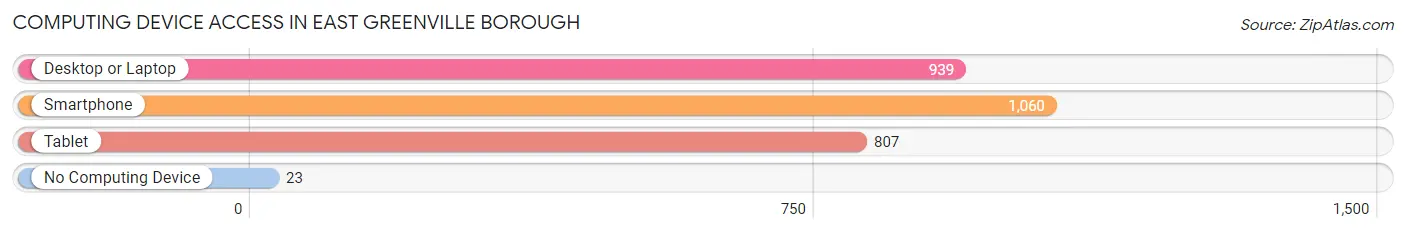
| Device Type | # Households | % Households |
| Desktop or Laptop | 939 | 82.7% |
| Smartphone | 1,060 | 93.4% |
| Tablet | 807 | 71.1% |
| No Computing Device | 23 | 2.0% |
| Total | 1,135 | 100.0% |
Internet Access in East Greenville borough
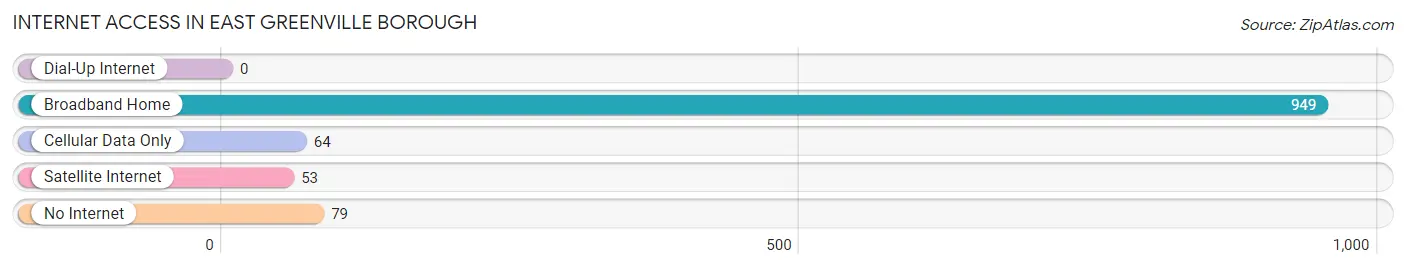
| Internet Type | # Households | % Households |
| Dial-Up Internet | 0 | 0.0% |
| Broadband Home | 949 | 83.6% |
| Cellular Data Only | 64 | 5.6% |
| Satellite Internet | 53 | 4.7% |
| No Internet | 79 | 7.0% |
| Total | 1,135 | 100.0% |
East Greenville borough Summary
Introduction
East Greenville Borough is a small borough located in Montgomery County, Pennsylvania. It is situated in the Upper Perkiomen Valley, approximately 30 miles northwest of Philadelphia. The borough was incorporated in 1874 and has a population of 2,717 as of the 2010 census. East Greenville is a small, rural community with a rich history and a strong sense of community.
History
East Greenville was first settled in 1717 by German immigrants. The area was originally known as “Grunenfeld”, which translates to “Green Field” in English. The area was part of the original land grant given to William Penn in 1681. The area was primarily agricultural, with the main crops being wheat, corn, and oats.
In 1874, the area was officially incorporated as the Borough of East Greenville. The borough was named after the nearby Greenville Creek, which was named after the green fields that surrounded it. The first mayor of East Greenville was John F. Kriebel, who served from 1874 to 1876.
The borough grew slowly over the years, with the population reaching 1,000 by the turn of the 20th century. The population peaked in the 1950s, with a population of 2,845. Since then, the population has slowly declined, with the 2010 census showing a population of 2,717.
Geography
East Greenville is located in the Upper Perkiomen Valley, approximately 30 miles northwest of Philadelphia. The borough is situated on the east bank of the Perkiomen Creek, which is a tributary of the Schuylkill River. The borough is bordered by Pennsburg to the north, Red Hill to the east, and Green Lane to the south.
The borough has a total area of 0.8 square miles, all of which is land. The terrain is mostly flat, with some rolling hills in the northern part of the borough. The climate is humid continental, with hot, humid summers and cold, snowy winters.
Economy
East Greenville’s economy is primarily based on agriculture and light manufacturing. The borough is home to several small businesses, including a lumber yard, a machine shop, and a printing company. The borough also has a small retail sector, with several small shops and restaurants.
The borough is also home to several large employers, including the East Greenville Manufacturing Company, which produces industrial machinery, and the East Greenville Foundry, which produces cast iron products. The borough also has a small tourism industry, with several bed and breakfasts and a few small attractions.
Demographics
As of the 2010 census, East Greenville had a population of 2,717. The racial makeup of the borough was 95.3% White, 1.2% African American, 0.3% Native American, 0.7% Asian, 0.1% Pacific Islander, 1.2% from other races, and 1.2% from two or more races. Hispanic or Latino of any race were 3.2% of the population.
The median household income in East Greenville was $50,938, and the median family income was $60,938. The per capita income was $25,938. About 6.2% of families and 8.2% of the population were below the poverty line, including 10.2% of those under age 18 and 5.2% of those age 65 or over.
Conclusion
East Greenville is a small borough located in Montgomery County, Pennsylvania. It is situated in the Upper Perkiomen Valley, approximately 30 miles northwest of Philadelphia. The borough was incorporated in 1874 and has a population of 2,717 as of the 2010 census. East Greenville is a small, rural community with a rich history and a strong sense of community. The borough’s economy is primarily based on agriculture and light manufacturing, and it is home to several large employers. The population of East Greenville is predominantly white, with a small percentage of African Americans, Native Americans, Asians, and other races. The median household income in East Greenville is $50,938, and the per capita income is $25,938.
Common Questions
What is Per Capita Income in East Greenville borough?
Per Capita income in East Greenville borough is $30,953.
What is the Median Family Income in East Greenville borough?
Median Family Income in East Greenville borough is $83,854.
What is the Median Household income in East Greenville borough?
Median Household Income in East Greenville borough is $75,417.
What is Income or Wage Gap in East Greenville borough?
Income or Wage Gap in East Greenville borough is 17.0%.
Women in East Greenville borough earn 83.0 cents for every dollar earned by a man.
What is Inequality or Gini Index in East Greenville borough?
Inequality or Gini Index in East Greenville borough is 0.30.
What is the Total Population of East Greenville borough?
Total Population of East Greenville borough is 3,150.
What is the Total Male Population of East Greenville borough?
Total Male Population of East Greenville borough is 1,651.
What is the Total Female Population of East Greenville borough?
Total Female Population of East Greenville borough is 1,499.
What is the Ratio of Males per 100 Females in East Greenville borough?
There are 110.14 Males per 100 Females in East Greenville borough.
What is the Ratio of Females per 100 Males in East Greenville borough?
There are 90.79 Females per 100 Males in East Greenville borough.
What is the Median Population Age in East Greenville borough?
Median Population Age in East Greenville borough is 32.3 Years.
What is the Average Family Size in East Greenville borough
Average Family Size in East Greenville borough is 3.2 People.
What is the Average Household Size in East Greenville borough
Average Household Size in East Greenville borough is 2.8 People.
How Large is the Labor Force in East Greenville borough?
There are 1,803 People in the Labor Forcein in East Greenville borough.
What is the Percentage of People in the Labor Force in East Greenville borough?
75.9% of People are in the Labor Force in East Greenville borough.
What is the Unemployment Rate in East Greenville borough?
Unemployment Rate in East Greenville borough is 3.7%.