Girardville borough, PA Map & Demographics
Girardville borough Overview
$29,557
PER CAPITA INCOME
$57,083
AVG FAMILY INCOME
$45,139
AVG HOUSEHOLD INCOME
54.5%
WAGE / INCOME GAP [ % ]
45.5¢/ $1
WAGE / INCOME GAP [ $ ]
0.53
INEQUALITY / GINI INDEX
1,260
TOTAL POPULATION
610
MALE POPULATION
650
FEMALE POPULATION
93.85
MALES / 100 FEMALES
106.56
FEMALES / 100 MALES
43.7
MEDIAN AGE
3.0
AVG FAMILY SIZE
2.1
AVG HOUSEHOLD SIZE
623
LABOR FORCE [ PEOPLE ]
60.7%
PERCENT IN LABOR FORCE
8.7%
UNEMPLOYMENT RATE
Income in Girardville borough
Income Overview in Girardville borough
Per Capita Income in Girardville borough is $29,557, while median incomes of families and households are $57,083 and $45,139 respectively.
| Characteristic | Number | Measure |
| Per Capita Income | 1,260 | $29,557 |
| Median Family Income | 281 | $57,083 |
| Mean Family Income | 281 | $62,365 |
| Median Household Income | 585 | $45,139 |
| Mean Household Income | 585 | $63,539 |
| Income Deficit | 281 | $0 |
| Wage / Income Gap (%) | 1,260 | 54.46% |
| Wage / Income Gap ($) | 1,260 | 45.54¢ per $1 |
| Gini / Inequality Index | 1,260 | 0.53 |
Earnings by Sex in Girardville borough
Average Earnings in Girardville borough are $30,568, $38,173 for men and $17,385 for women, a difference of 54.5%.
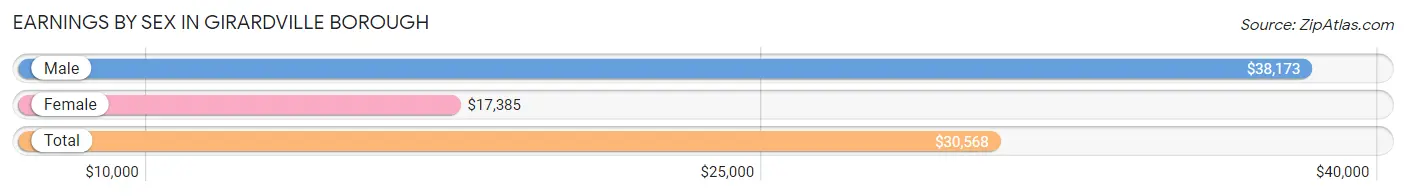
| Sex | Number | Average Earnings |
| Male | 315 (49.1%) | $38,173 |
| Female | 327 (50.9%) | $17,385 |
| Total | 642 (100.0%) | $30,568 |
Earnings by Sex by Income Bracket in Girardville borough
The most common earnings brackets in Girardville borough are $2,499 or less for men (48 | 15.2%) and $15,000 to $17,499 for women (76 | 23.2%).
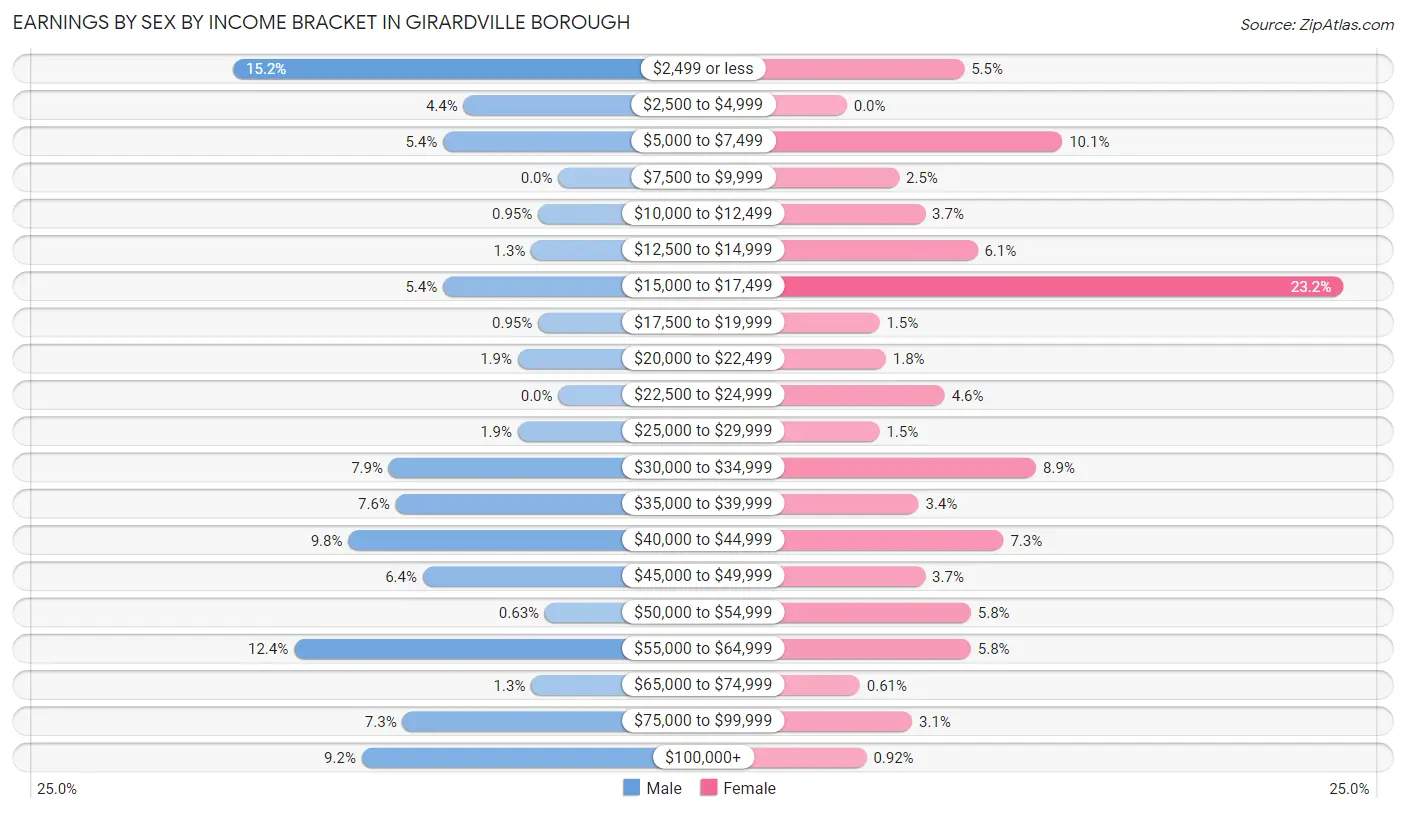
| Income | Male | Female |
| $2,499 or less | 48 (15.2%) | 18 (5.5%) |
| $2,500 to $4,999 | 14 (4.4%) | 0 (0.0%) |
| $5,000 to $7,499 | 17 (5.4%) | 33 (10.1%) |
| $7,500 to $9,999 | 0 (0.0%) | 8 (2.5%) |
| $10,000 to $12,499 | 3 (0.9%) | 12 (3.7%) |
| $12,500 to $14,999 | 4 (1.3%) | 20 (6.1%) |
| $15,000 to $17,499 | 17 (5.4%) | 76 (23.2%) |
| $17,500 to $19,999 | 3 (0.9%) | 5 (1.5%) |
| $20,000 to $22,499 | 6 (1.9%) | 6 (1.8%) |
| $22,500 to $24,999 | 0 (0.0%) | 15 (4.6%) |
| $25,000 to $29,999 | 6 (1.9%) | 5 (1.5%) |
| $30,000 to $34,999 | 25 (7.9%) | 29 (8.9%) |
| $35,000 to $39,999 | 24 (7.6%) | 11 (3.4%) |
| $40,000 to $44,999 | 31 (9.8%) | 24 (7.3%) |
| $45,000 to $49,999 | 20 (6.4%) | 12 (3.7%) |
| $50,000 to $54,999 | 2 (0.6%) | 19 (5.8%) |
| $55,000 to $64,999 | 39 (12.4%) | 19 (5.8%) |
| $65,000 to $74,999 | 4 (1.3%) | 2 (0.6%) |
| $75,000 to $99,999 | 23 (7.3%) | 10 (3.1%) |
| $100,000+ | 29 (9.2%) | 3 (0.9%) |
| Total | 315 (100.0%) | 327 (100.0%) |
Earnings by Sex by Educational Attainment in Girardville borough
Average earnings in Girardville borough are $40,645 for men and $17,465 for women, a difference of 57.0%. Men with an educational attainment of college or associate's degree enjoy the highest average annual earnings of $58,125, while those with high school diploma education earn the least with $40,714. Women with an educational attainment of graduate degree earn the most with the average annual earnings of $85,833, while those with high school diploma education have the smallest earnings of $15,893.
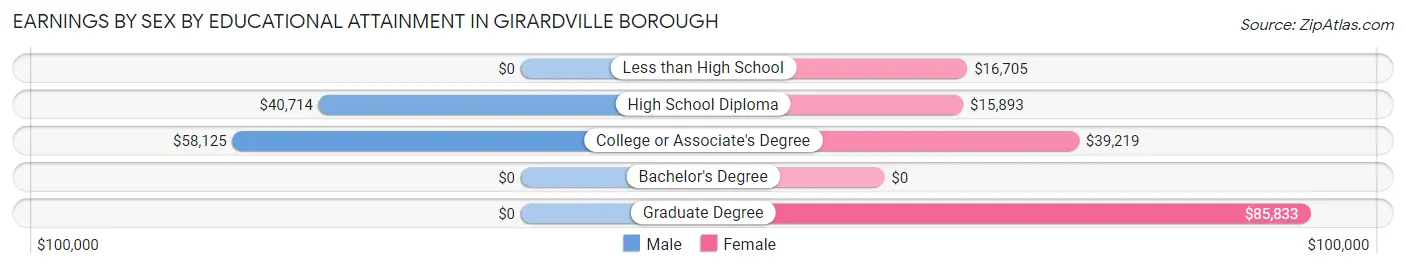
| Educational Attainment | Male Income | Female Income |
| Less than High School | - | - |
| High School Diploma | $40,714 | $15,893 |
| College or Associate's Degree | $58,125 | $39,219 |
| Bachelor's Degree | - | - |
| Graduate Degree | - | - |
| Total | $40,645 | $17,465 |
Family Income in Girardville borough
Family Income Brackets in Girardville borough
According to the Girardville borough family income data, there are 86 families falling into the $50,000 to $74,999 income range, which is the most common income bracket and makes up 30.6% of all families.
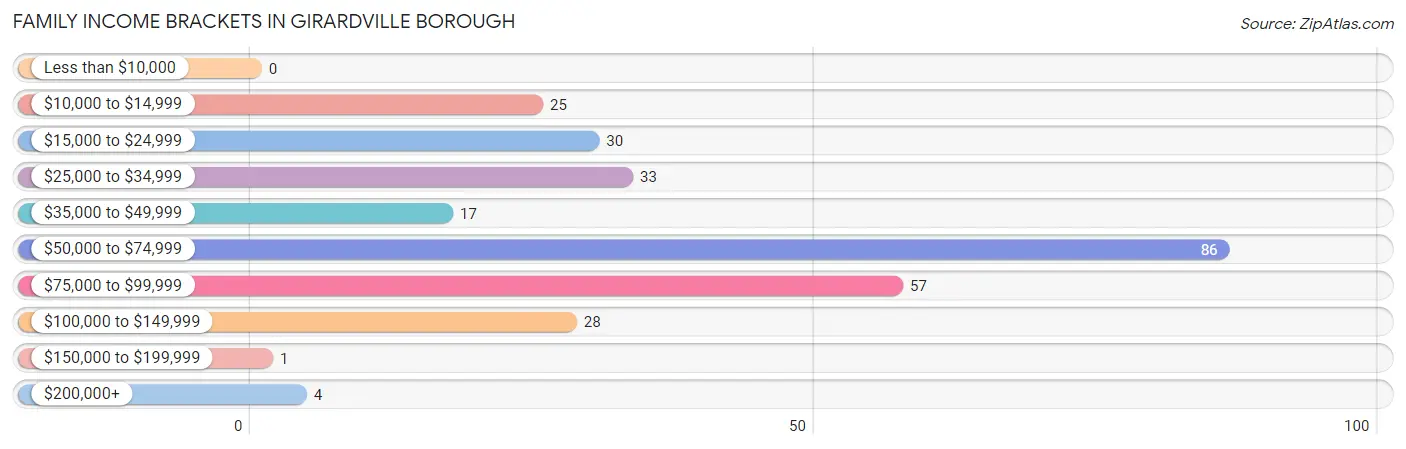
| Income Bracket | # Families | % Families |
| Less than $10,000 | 0 | 0.0% |
| $10,000 to $14,999 | 25 | 8.9% |
| $15,000 to $24,999 | 30 | 10.7% |
| $25,000 to $34,999 | 33 | 11.7% |
| $35,000 to $49,999 | 17 | 6.0% |
| $50,000 to $74,999 | 86 | 30.6% |
| $75,000 to $99,999 | 57 | 20.3% |
| $100,000 to $149,999 | 28 | 10.0% |
| $150,000 to $199,999 | 1 | 0.4% |
| $200,000+ | 4 | 1.4% |
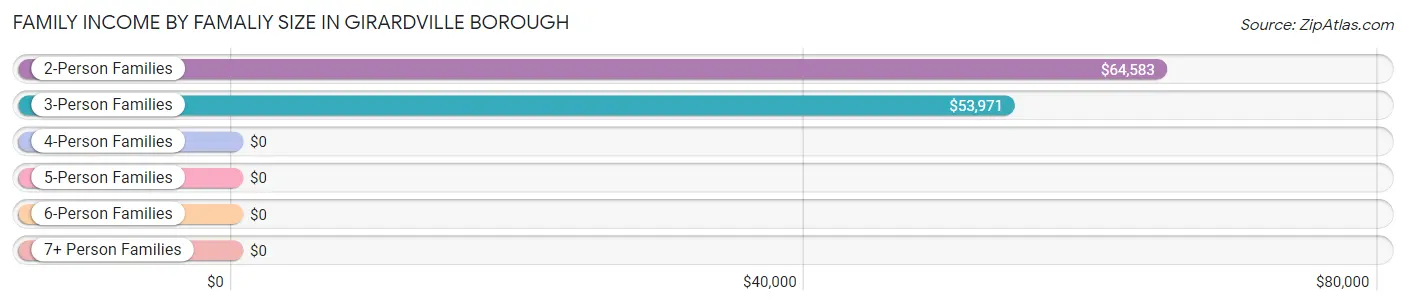
Family Income by Famaliy Size in Girardville borough
2-person families (119 | 42.3%) account for the highest median family income in Girardville borough with $64,583 per family, while 2-person families (119 | 42.3%) have the highest median income of $32,292 per family member.
| Income Bracket | # Families | Median Income |
| 2-Person Families | 119 (42.3%) | $64,583 |
| 3-Person Families | 100 (35.6%) | $53,971 |
| 4-Person Families | 30 (10.7%) | $0 |
| 5-Person Families | 17 (6.0%) | $0 |
| 6-Person Families | 15 (5.3%) | $0 |
| 7+ Person Families | 0 (0.0%) | $0 |
| Total | 281 (100.0%) | $57,083 |
Family Income by Number of Earners in Girardville borough
The median family income in Girardville borough is $57,083, with families comprising 3+ earners (28) having the highest median family income of $93,438, while families with no earners (61) have the lowest median family income of $39,688, accounting for 10.0% and 21.7% of families, respectively.
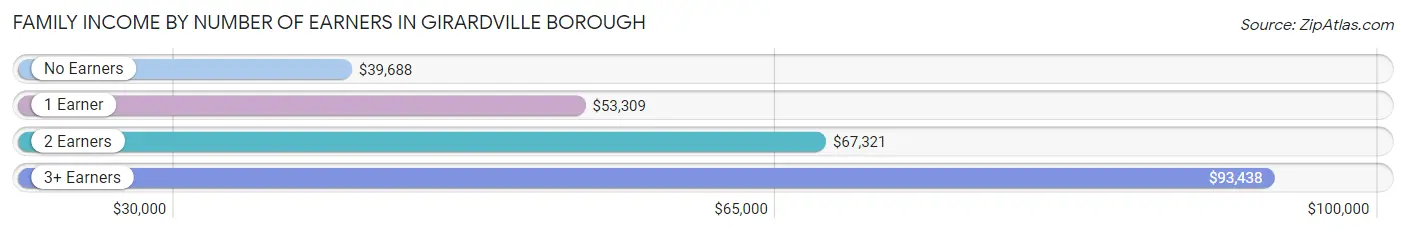
| Number of Earners | # Families | Median Income |
| No Earners | 61 (21.7%) | $39,688 |
| 1 Earner | 121 (43.1%) | $53,309 |
| 2 Earners | 71 (25.3%) | $67,321 |
| 3+ Earners | 28 (10.0%) | $93,438 |
| Total | 281 (100.0%) | $57,083 |
Household Income in Girardville borough
Household Income Brackets in Girardville borough
With 144 households falling in the category, the $50,000 to $74,999 income range is the most frequent in Girardville borough, accounting for 24.6% of all households. In contrast, only 5 households (0.9%) fall into the $150,000 to $199,999 income bracket, making it the least populous group.
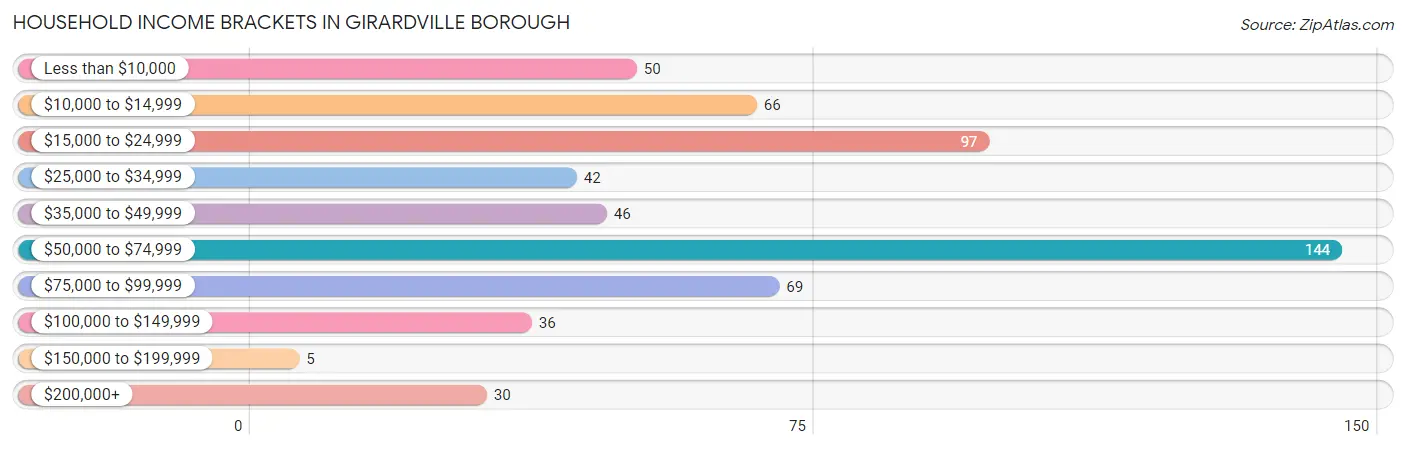
| Income Bracket | # Households | % Households |
| Less than $10,000 | 50 | 8.5% |
| $10,000 to $14,999 | 66 | 11.3% |
| $15,000 to $24,999 | 97 | 16.6% |
| $25,000 to $34,999 | 42 | 7.2% |
| $35,000 to $49,999 | 46 | 7.9% |
| $50,000 to $74,999 | 144 | 24.6% |
| $75,000 to $99,999 | 69 | 11.8% |
| $100,000 to $149,999 | 36 | 6.2% |
| $150,000 to $199,999 | 5 | 0.9% |
| $200,000+ | 30 | 5.1% |
Household Income by Householder Age in Girardville borough
The median household income in Girardville borough is $45,139, with the highest median household income of $63,389 found in the 25 to 44 years age bracket for the primary householder. A total of 158 households (27.0%) fall into this category.
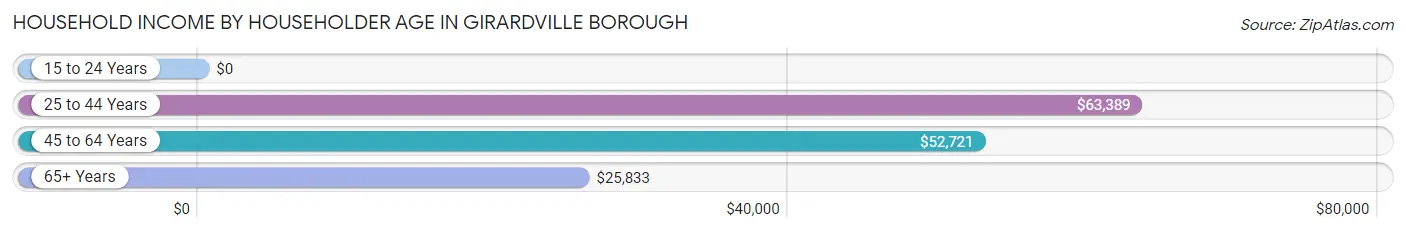
| Income Bracket | # Households | Median Income |
| 15 to 24 Years | 0 (0.0%) | $0 |
| 25 to 44 Years | 158 (27.0%) | $63,389 |
| 45 to 64 Years | 251 (42.9%) | $52,721 |
| 65+ Years | 176 (30.1%) | $25,833 |
| Total | 585 (100.0%) | $45,139 |
Poverty in Girardville borough
Income Below Poverty by Sex and Age in Girardville borough
With 26.4% poverty level for males and 14.6% for females among the residents of Girardville borough, 15 year old males and 75 year old and over females are the most vulnerable to poverty, with 6 males (100.0%) and 16 females (28.6%) in their respective age groups living below the poverty level.
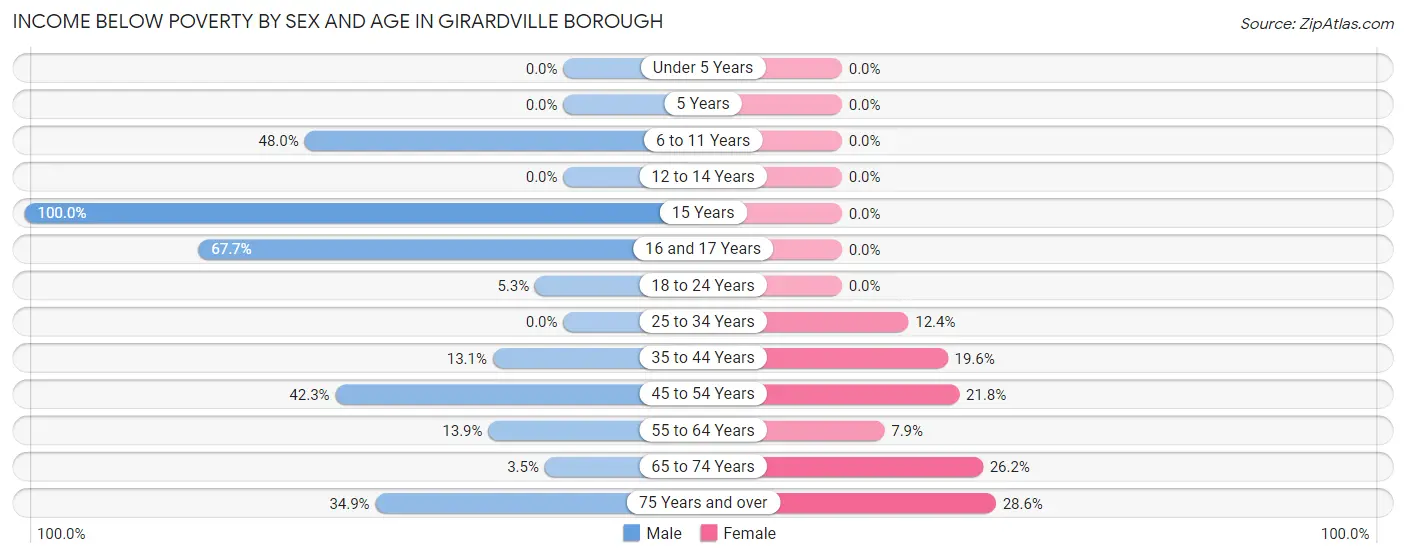
| Age Bracket | Male | Female |
| Under 5 Years | 0 (0.0%) | 0 (0.0%) |
| 5 Years | 0 (0.0%) | 0 (0.0%) |
| 6 to 11 Years | 49 (48.0%) | 0 (0.0%) |
| 12 to 14 Years | 0 (0.0%) | 0 (0.0%) |
| 15 Years | 6 (100.0%) | 0 (0.0%) |
| 16 and 17 Years | 21 (67.7%) | 0 (0.0%) |
| 18 to 24 Years | 2 (5.3%) | 0 (0.0%) |
| 25 to 34 Years | 0 (0.0%) | 10 (12.3%) |
| 35 to 44 Years | 11 (13.1%) | 21 (19.6%) |
| 45 to 54 Years | 44 (42.3%) | 22 (21.8%) |
| 55 to 64 Years | 11 (13.9%) | 9 (7.9%) |
| 65 to 74 Years | 2 (3.5%) | 17 (26.2%) |
| 75 Years and over | 15 (34.9%) | 16 (28.6%) |
| Total | 161 (26.4%) | 95 (14.6%) |
Income Above Poverty by Sex and Age in Girardville borough
According to the poverty statistics in Girardville borough, males aged under 5 years and females aged under 5 years are the age groups that are most secure financially, with 100.0% of males and 100.0% of females in these age groups living above the poverty line.
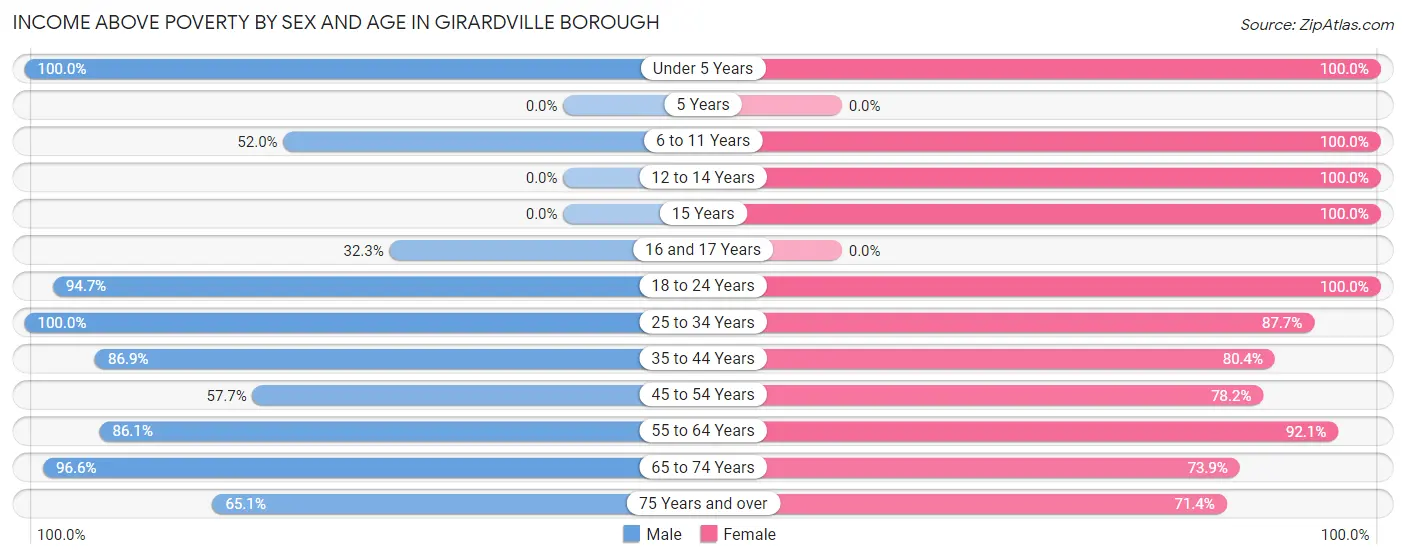
| Age Bracket | Male | Female |
| Under 5 Years | 4 (100.0%) | 7 (100.0%) |
| 5 Years | 0 (0.0%) | 0 (0.0%) |
| 6 to 11 Years | 53 (52.0%) | 101 (100.0%) |
| 12 to 14 Years | 0 (0.0%) | 8 (100.0%) |
| 15 Years | 0 (0.0%) | 5 (100.0%) |
| 16 and 17 Years | 10 (32.3%) | 0 (0.0%) |
| 18 to 24 Years | 36 (94.7%) | 5 (100.0%) |
| 25 to 34 Years | 61 (100.0%) | 71 (87.6%) |
| 35 to 44 Years | 73 (86.9%) | 86 (80.4%) |
| 45 to 54 Years | 60 (57.7%) | 79 (78.2%) |
| 55 to 64 Years | 68 (86.1%) | 105 (92.1%) |
| 65 to 74 Years | 56 (96.6%) | 48 (73.9%) |
| 75 Years and over | 28 (65.1%) | 40 (71.4%) |
| Total | 449 (73.6%) | 555 (85.4%) |
Income Below Poverty Among Married-Couple Families in Girardville borough
The poverty statistics for married-couple families in Girardville borough show that 2.9% or 5 of the total 170 families live below the poverty line. Families with no children have the highest poverty rate of 4.9%, comprising of 5 families. On the other hand, families with 1 or 2 children have the lowest poverty rate of 0.0%, which includes 0 families.
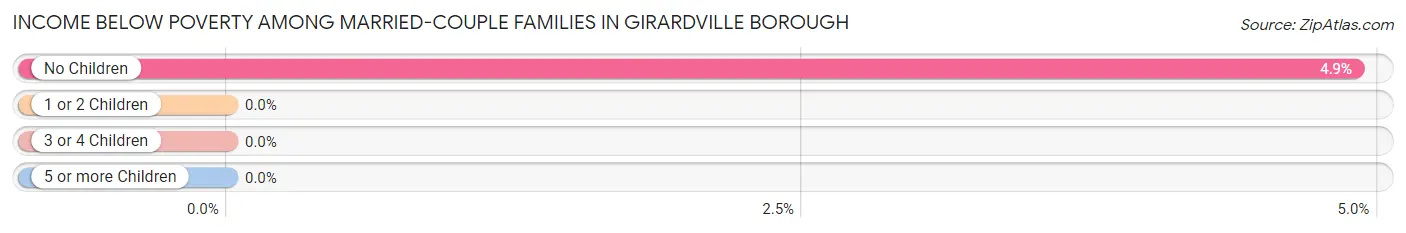
| Children | Above Poverty | Below Poverty |
| No Children | 97 (95.1%) | 5 (4.9%) |
| 1 or 2 Children | 52 (100.0%) | 0 (0.0%) |
| 3 or 4 Children | 16 (100.0%) | 0 (0.0%) |
| 5 or more Children | 0 (0.0%) | 0 (0.0%) |
| Total | 165 (97.1%) | 5 (2.9%) |
Income Below Poverty Among Single-Parent Households in Girardville borough
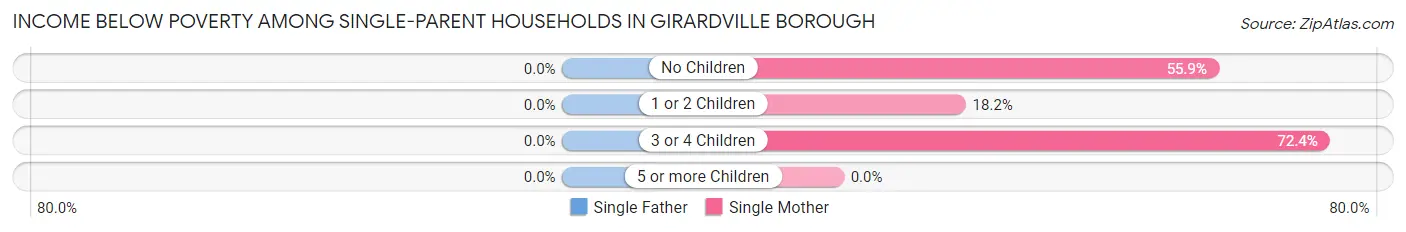
| Children | Single Father | Single Mother |
| No Children | 0 (0.0%) | 19 (55.9%) |
| 1 or 2 Children | 0 (0.0%) | 6 (18.2%) |
| 3 or 4 Children | 0 (0.0%) | 21 (72.4%) |
| 5 or more Children | 0 (0.0%) | 0 (0.0%) |
| Total | 0 (0.0%) | 46 (47.9%) |
Income Below Poverty Among Married-Couple vs Single-Parent Households in Girardville borough
The poverty data for Girardville borough shows that 5 of the married-couple family households (2.9%) and 46 of the single-parent households (41.4%) are living below the poverty level. Within the married-couple family households, those with no children have the highest poverty rate, with 5 households (4.9%) falling below the poverty line. Among the single-parent households, those with 3 or 4 children have the highest poverty rate, with 21 household (72.4%) living below poverty.
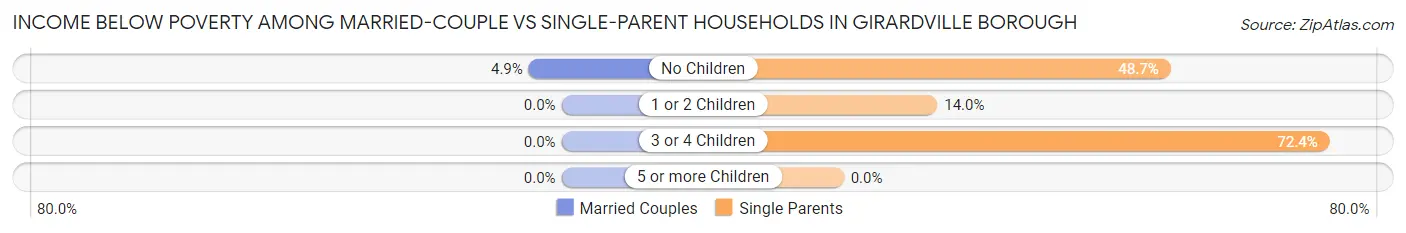
| Children | Married-Couple Families | Single-Parent Households |
| No Children | 5 (4.9%) | 19 (48.7%) |
| 1 or 2 Children | 0 (0.0%) | 6 (14.0%) |
| 3 or 4 Children | 0 (0.0%) | 21 (72.4%) |
| 5 or more Children | 0 (0.0%) | 0 (0.0%) |
| Total | 5 (2.9%) | 46 (41.4%) |
Race in Girardville borough
The most populous races in Girardville borough are White / Caucasian (1,184 | 94.0%), Hispanic or Latino (43 | 3.4%), and Some other Race (40 | 3.2%).
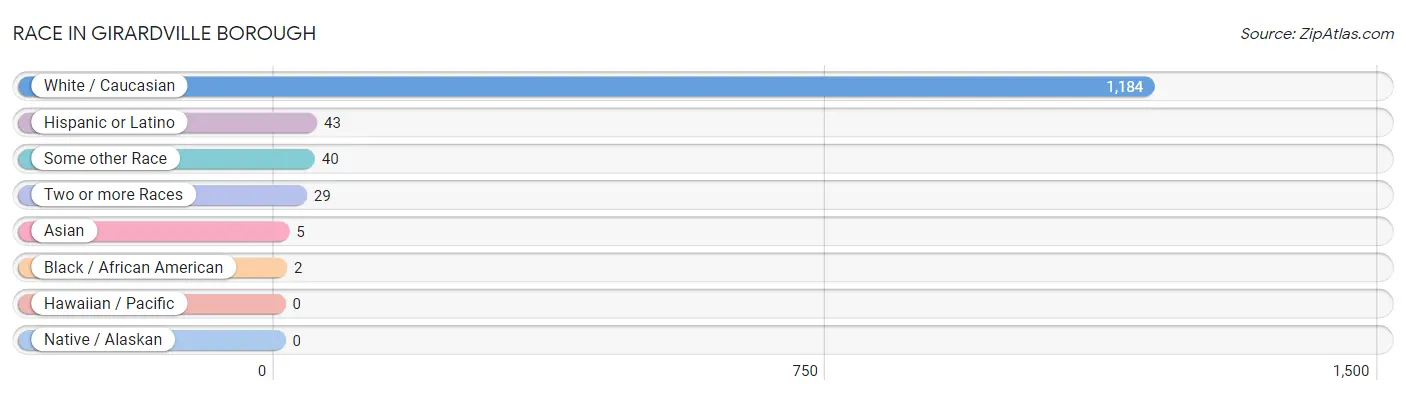
| Race | # Population | % Population |
| Asian | 5 | 0.4% |
| Black / African American | 2 | 0.2% |
| Hawaiian / Pacific | 0 | 0.0% |
| Hispanic or Latino | 43 | 3.4% |
| Native / Alaskan | 0 | 0.0% |
| White / Caucasian | 1,184 | 94.0% |
| Two or more Races | 29 | 2.3% |
| Some other Race | 40 | 3.2% |
| Total | 1,260 | 100.0% |
Ancestry in Girardville borough
The most populous ancestries reported in Girardville borough are Irish (291 | 23.1%), German (273 | 21.7%), Italian (247 | 19.6%), Polish (195 | 15.5%), and Lithuanian (182 | 14.4%), together accounting for 94.3% of all Girardville borough residents.
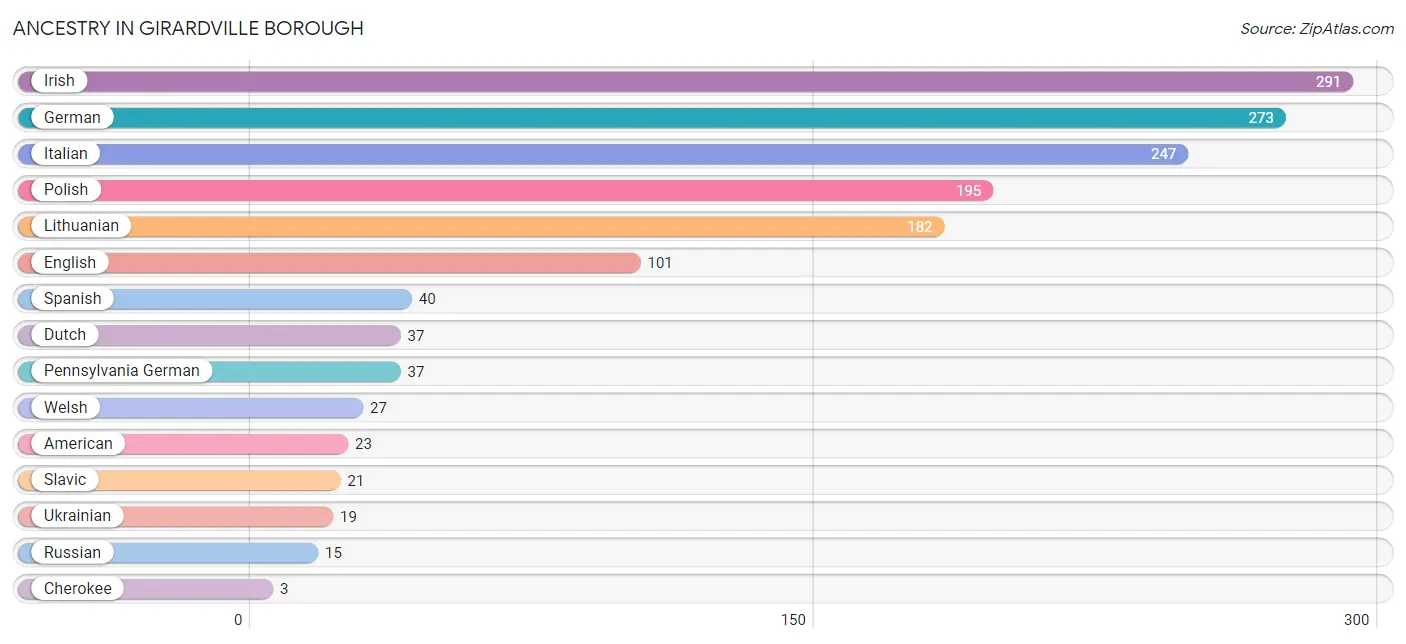
| Ancestry | # Population | % Population |
| American | 23 | 1.8% |
| Cherokee | 3 | 0.2% |
| Delaware | 3 | 0.2% |
| Dutch | 37 | 2.9% |
| English | 101 | 8.0% |
| European | 3 | 0.2% |
| Finnish | 3 | 0.2% |
| German | 273 | 21.7% |
| Indian (Asian) | 2 | 0.2% |
| Irish | 291 | 23.1% |
| Italian | 247 | 19.6% |
| Lithuanian | 182 | 14.4% |
| Mexican | 3 | 0.2% |
| Norwegian | 3 | 0.2% |
| Pennsylvania German | 37 | 2.9% |
| Polish | 195 | 15.5% |
| Russian | 15 | 1.2% |
| Scotch-Irish | 3 | 0.2% |
| Slavic | 21 | 1.7% |
| Spanish | 40 | 3.2% |
| Sri Lankan | 2 | 0.2% |
| Swedish | 3 | 0.2% |
| Thai | 3 | 0.2% |
| Ukrainian | 19 | 1.5% |
| Vietnamese | 3 | 0.2% |
| Welsh | 27 | 2.1% | View All 26 Rows |
Immigrants in Girardville borough
The most numerous immigrant groups reported in Girardville borough came from Central America (24 | 1.9%), Latin America (24 | 1.9%), Mexico (24 | 1.9%), Asia (2 | 0.2%), and South Eastern Asia (2 | 0.2%), together accounting for 6.0% of all Girardville borough residents.
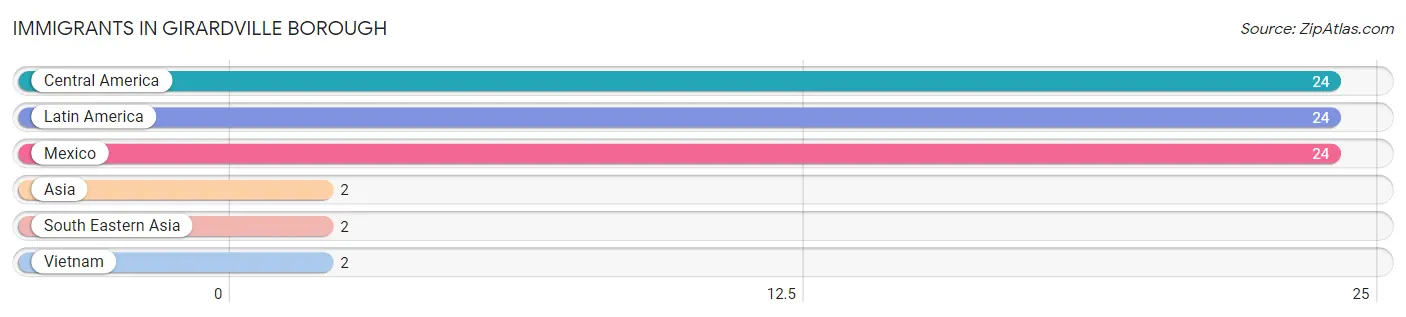
| Immigration Origin | # Population | % Population |
| Asia | 2 | 0.2% |
| Central America | 24 | 1.9% |
| Latin America | 24 | 1.9% |
| Mexico | 24 | 1.9% |
| South Eastern Asia | 2 | 0.2% |
| Vietnam | 2 | 0.2% | View All 6 Rows |
Sex and Age in Girardville borough
Sex and Age in Girardville borough
The most populous age groups in Girardville borough are 35 to 39 Years (80 | 13.1%) for men and 40 to 44 Years (93 | 14.3%) for women.
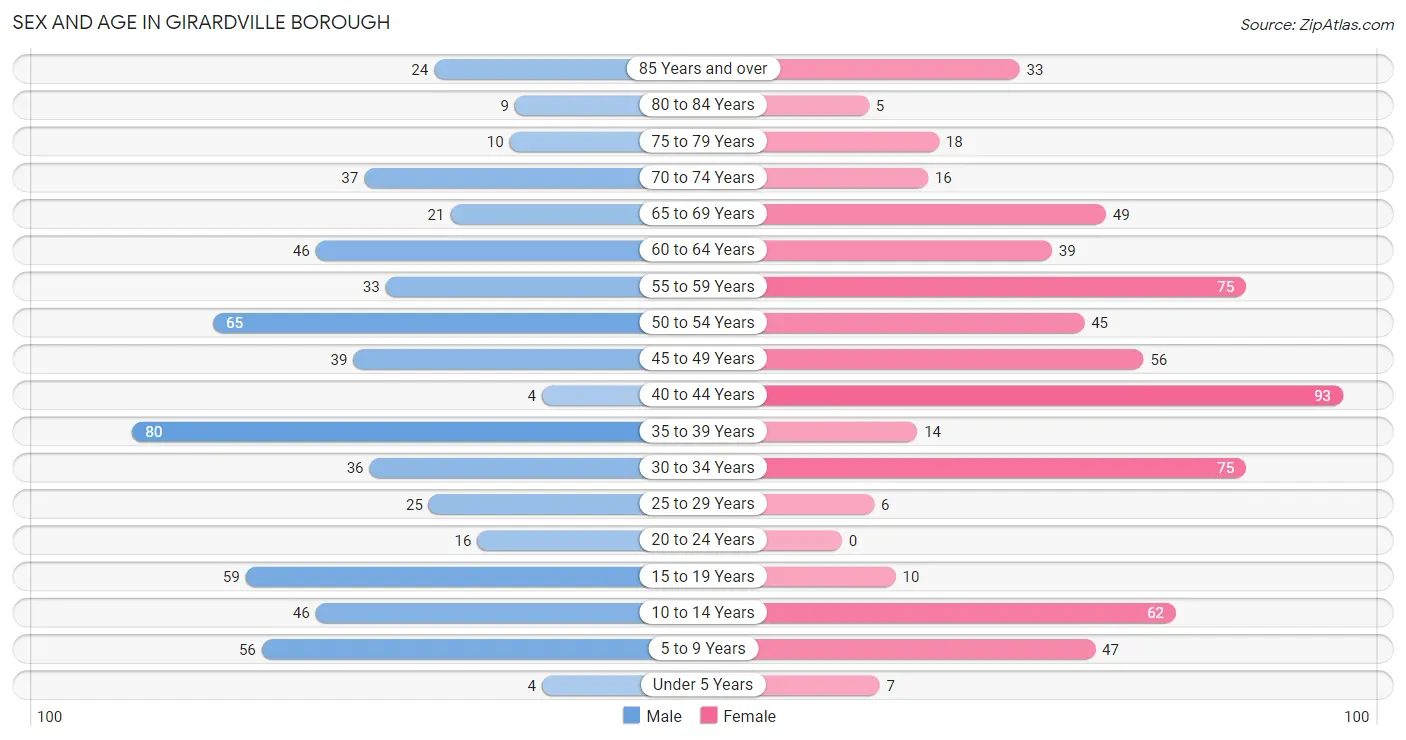
| Age Bracket | Male | Female |
| Under 5 Years | 4 (0.7%) | 7 (1.1%) |
| 5 to 9 Years | 56 (9.2%) | 47 (7.2%) |
| 10 to 14 Years | 46 (7.5%) | 62 (9.5%) |
| 15 to 19 Years | 59 (9.7%) | 10 (1.5%) |
| 20 to 24 Years | 16 (2.6%) | 0 (0.0%) |
| 25 to 29 Years | 25 (4.1%) | 6 (0.9%) |
| 30 to 34 Years | 36 (5.9%) | 75 (11.5%) |
| 35 to 39 Years | 80 (13.1%) | 14 (2.1%) |
| 40 to 44 Years | 4 (0.7%) | 93 (14.3%) |
| 45 to 49 Years | 39 (6.4%) | 56 (8.6%) |
| 50 to 54 Years | 65 (10.7%) | 45 (6.9%) |
| 55 to 59 Years | 33 (5.4%) | 75 (11.5%) |
| 60 to 64 Years | 46 (7.5%) | 39 (6.0%) |
| 65 to 69 Years | 21 (3.4%) | 49 (7.5%) |
| 70 to 74 Years | 37 (6.1%) | 16 (2.5%) |
| 75 to 79 Years | 10 (1.6%) | 18 (2.8%) |
| 80 to 84 Years | 9 (1.5%) | 5 (0.8%) |
| 85 Years and over | 24 (3.9%) | 33 (5.1%) |
| Total | 610 (100.0%) | 650 (100.0%) |
Families and Households in Girardville borough
Median Family Size in Girardville borough
The median family size in Girardville borough is 3.00 persons per family, with single female/mother families (96 | 34.2%) accounting for the largest median family size of 3.09 persons per family. On the other hand, single male/father families (15 | 5.3%) represent the smallest median family size with 2.27 persons per family.
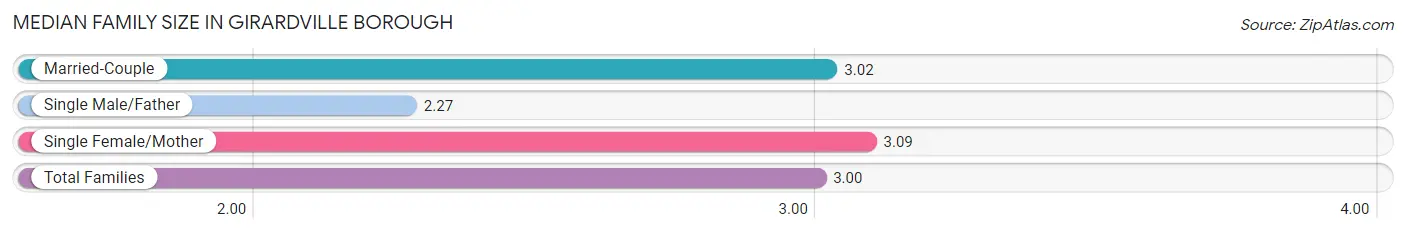
| Family Type | # Families | Family Size |
| Married-Couple | 170 (60.5%) | 3.02 |
| Single Male/Father | 15 (5.3%) | 2.27 |
| Single Female/Mother | 96 (34.2%) | 3.09 |
| Total Families | 281 (100.0%) | 3.00 |
Median Household Size in Girardville borough
The median household size in Girardville borough is 2.15 persons per household, with single female/mother households (96 | 16.4%) accounting for the largest median household size of 3.48 persons per household. non-family households (304 | 52.0%) represent the smallest median household size with 1.21 persons per household.
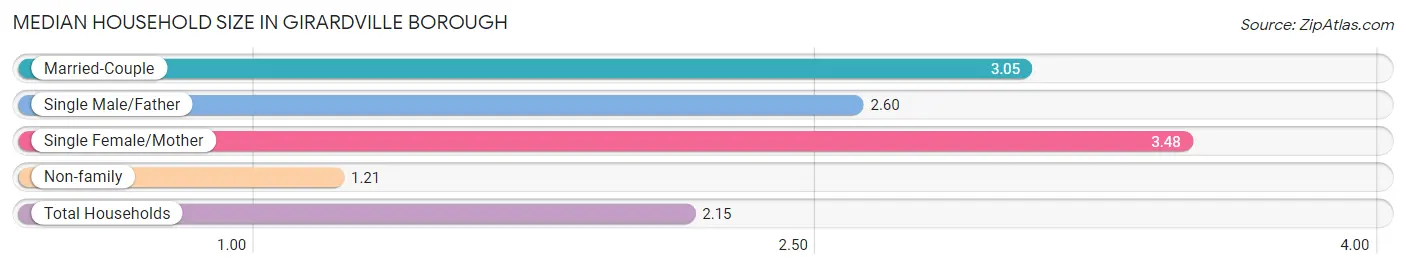
| Household Type | # Households | Household Size |
| Married-Couple | 170 (29.1%) | 3.05 |
| Single Male/Father | 15 (2.6%) | 2.60 |
| Single Female/Mother | 96 (16.4%) | 3.48 |
| Non-family | 304 (52.0%) | 1.21 |
| Total Households | 585 (100.0%) | 2.15 |
Household Size by Marriage Status in Girardville borough
Out of a total of 585 households in Girardville borough, 281 (48.0%) are family households, while 304 (52.0%) are nonfamily households. The most numerous type of family households are 3-person households, comprising 110, and the most common type of nonfamily households are 1-person households, comprising 240.
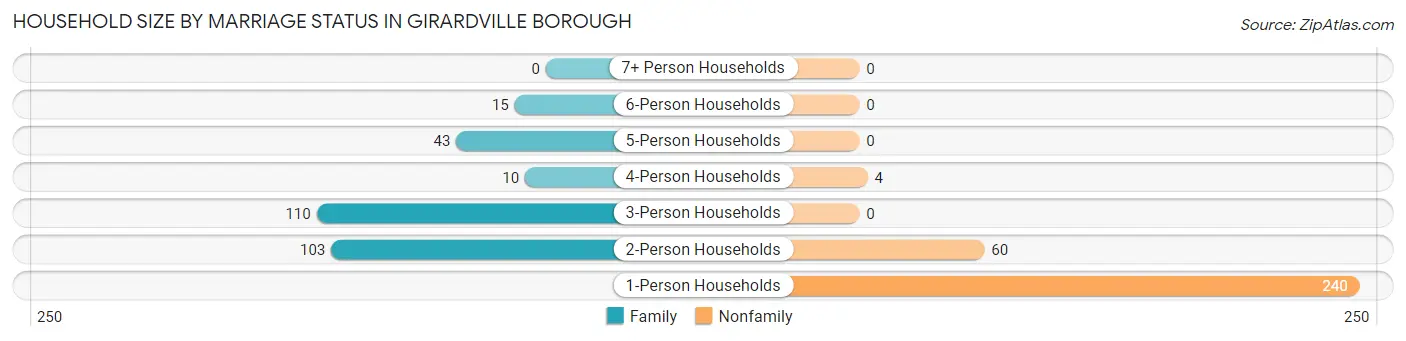
| Household Size | Family Households | Nonfamily Households |
| 1-Person Households | - | 240 (41.0%) |
| 2-Person Households | 103 (17.6%) | 60 (10.3%) |
| 3-Person Households | 110 (18.8%) | 0 (0.0%) |
| 4-Person Households | 10 (1.7%) | 4 (0.7%) |
| 5-Person Households | 43 (7.3%) | 0 (0.0%) |
| 6-Person Households | 15 (2.6%) | 0 (0.0%) |
| 7+ Person Households | 0 (0.0%) | 0 (0.0%) |
| Total | 281 (48.0%) | 304 (52.0%) |
Female Fertility in Girardville borough
Fertility by Age in Girardville borough
| Age Bracket | Women with Births | Births / 1,000 Women |
| 15 to 19 years | 0 (0.0%) | 0.0 |
| 20 to 34 years | 0 (0.0%) | 0.0 |
| 35 to 50 years | 0 (0.0%) | 0.0 |
| Total | 0 (0.0%) | 0.0 |
Fertility by Age by Marriage Status in Girardville borough
| Age Bracket | Married | Unmarried |
| 15 to 19 years | 0 (0.0%) | 0 (0.0%) |
| 20 to 34 years | 0 (0.0%) | 0 (0.0%) |
| 35 to 50 years | 0 (0.0%) | 0 (0.0%) |
| Total | 0 (0.0%) | 0 (0.0%) |
Fertility by Education in Girardville borough
| Educational Attainment | Women with Births | Births / 1,000 Women |
| Less than High School | 0 (0.0%) | 0.0 |
| High School Diploma | 0 (0.0%) | 0.0 |
| College or Associate's Degree | 0 (0.0%) | 0.0 |
| Bachelor's Degree | 0 (0.0%) | 0.0 |
| Graduate Degree | 0 (0.0%) | 0.0 |
| Total | 0 (0.0%) | 0.0 |
Fertility by Education by Marriage Status in Girardville borough
| Educational Attainment | Married | Unmarried |
| Less than High School | 0 (0.0%) | 0 (0.0%) |
| High School Diploma | 0 (0.0%) | 0 (0.0%) |
| College or Associate's Degree | 0 (0.0%) | 0 (0.0%) |
| Bachelor's Degree | 0 (0.0%) | 0 (0.0%) |
| Graduate Degree | 0 (0.0%) | 0 (0.0%) |
| Total | 0 (0.0%) | 0 (0.0%) |
Employment Characteristics in Girardville borough
Employment by Class of Employer in Girardville borough
Among the 538 employed individuals in Girardville borough, private company employees (391 | 72.7%), self-employed (not incorporated) (63 | 11.7%), and not-for-profit organizations (35 | 6.5%) make up the most common classes of employment.
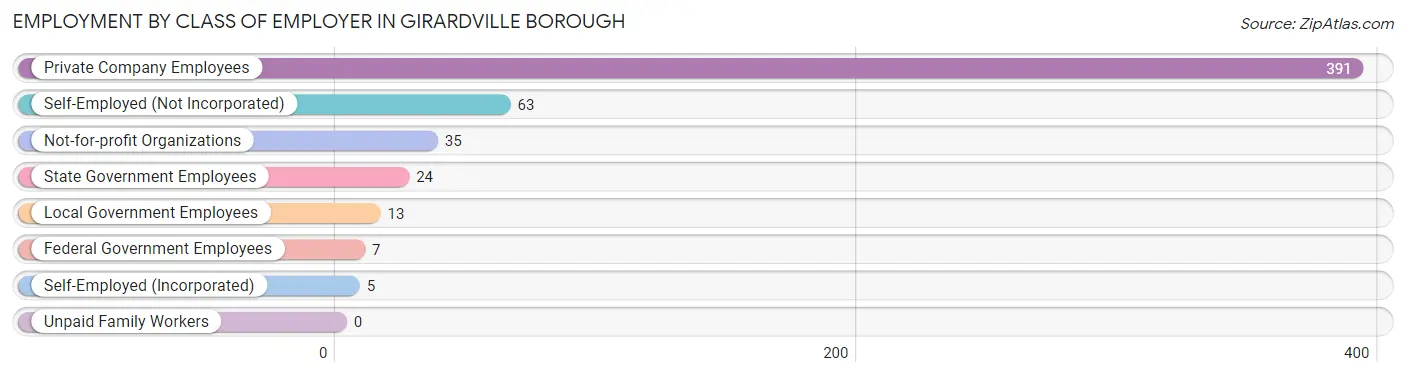
| Employer Class | # Employees | % Employees |
| Private Company Employees | 391 | 72.7% |
| Self-Employed (Incorporated) | 5 | 0.9% |
| Self-Employed (Not Incorporated) | 63 | 11.7% |
| Not-for-profit Organizations | 35 | 6.5% |
| Local Government Employees | 13 | 2.4% |
| State Government Employees | 24 | 4.5% |
| Federal Government Employees | 7 | 1.3% |
| Unpaid Family Workers | 0 | 0.0% |
| Total | 538 | 100.0% |
Employment Status by Age in Girardville borough
According to the labor force statistics for Girardville borough, out of the total population over 16 years of age (1,027), 60.7% or 623 individuals are in the labor force, with 8.7% or 54 of them unemployed. The age group with the highest labor force participation rate is 25 to 29 years, with 90.3% or 28 individuals in the labor force. Within the labor force, the 30 to 34 years age range has the highest percentage of unemployed individuals, with 17.1% or 13 of them being unemployed.
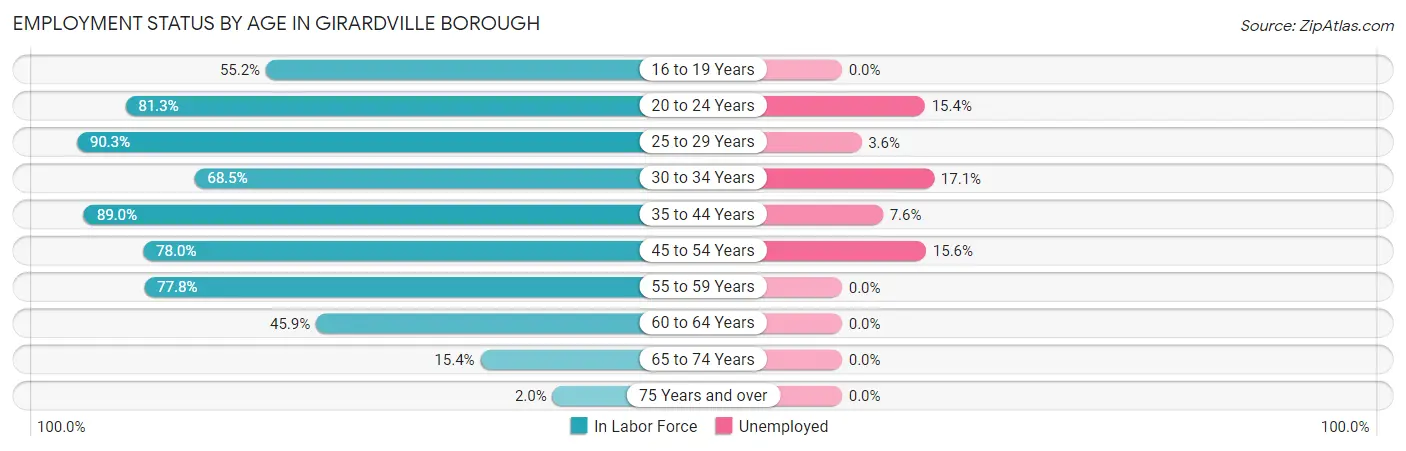
| Age Bracket | In Labor Force | Unemployed |
| 16 to 19 Years | 32 (55.2%) | 0 (0.0%) |
| 20 to 24 Years | 13 (81.3%) | 2 (15.4%) |
| 25 to 29 Years | 28 (90.3%) | 1 (3.6%) |
| 30 to 34 Years | 76 (68.5%) | 13 (17.1%) |
| 35 to 44 Years | 170 (89.0%) | 13 (7.6%) |
| 45 to 54 Years | 160 (78.0%) | 25 (15.6%) |
| 55 to 59 Years | 84 (77.8%) | 0 (0.0%) |
| 60 to 64 Years | 39 (45.9%) | 0 (0.0%) |
| 65 to 74 Years | 19 (15.4%) | 0 (0.0%) |
| 75 Years and over | 2 (2.0%) | 0 (0.0%) |
| Total | 623 (60.7%) | 54 (8.7%) |
Employment Status by Educational Attainment in Girardville borough
According to labor force statistics for Girardville borough, 76.2% of individuals (557) out of the total population between 25 and 64 years of age (731) are in the labor force, with 9.3% or 52 of them being unemployed. The group with the highest labor force participation rate are those with the educational attainment of high school diploma, with 80.0% or 328 individuals in the labor force. Within the labor force, individuals with less than high school education have the highest percentage of unemployment, with 43.5% or 30 of them being unemployed.
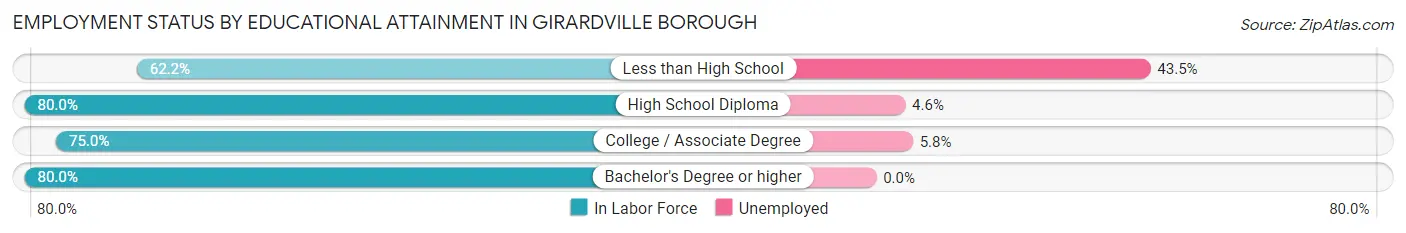
| Educational Attainment | In Labor Force | Unemployed |
| Less than High School | 69 (62.2%) | 48 (43.5%) |
| High School Diploma | 328 (80.0%) | 19 (4.6%) |
| College / Associate Degree | 120 (75.0%) | 9 (5.8%) |
| Bachelor's Degree or higher | 40 (80.0%) | 0 (0.0%) |
| Total | 557 (76.2%) | 68 (9.3%) |
Employment Occupations by Sex in Girardville borough
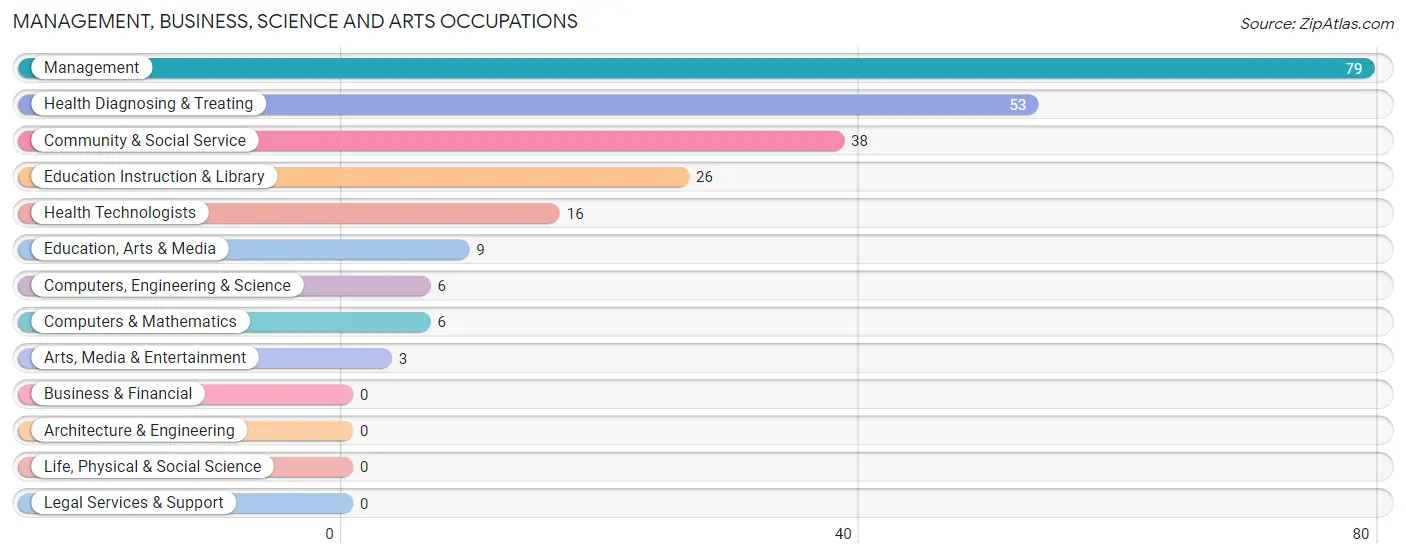
Management, Business, Science and Arts Occupations
The most common Management, Business, Science and Arts occupations in Girardville borough are Management (79 | 13.9%), Health Diagnosing & Treating (53 | 9.3%), Community & Social Service (38 | 6.7%), Education Instruction & Library (26 | 4.6%), and Health Technologists (16 | 2.8%).
Management, Business, Science and Arts Occupations by Sex
Within the Management, Business, Science and Arts occupations in Girardville borough, the most male-oriented occupations are Arts, Media & Entertainment (100.0%), Management (63.3%), and Health Diagnosing & Treating (49.1%), while the most female-oriented occupations are Health Technologists (100.0%), Education, Arts & Media (77.8%), and Computers, Engineering & Science (66.7%).
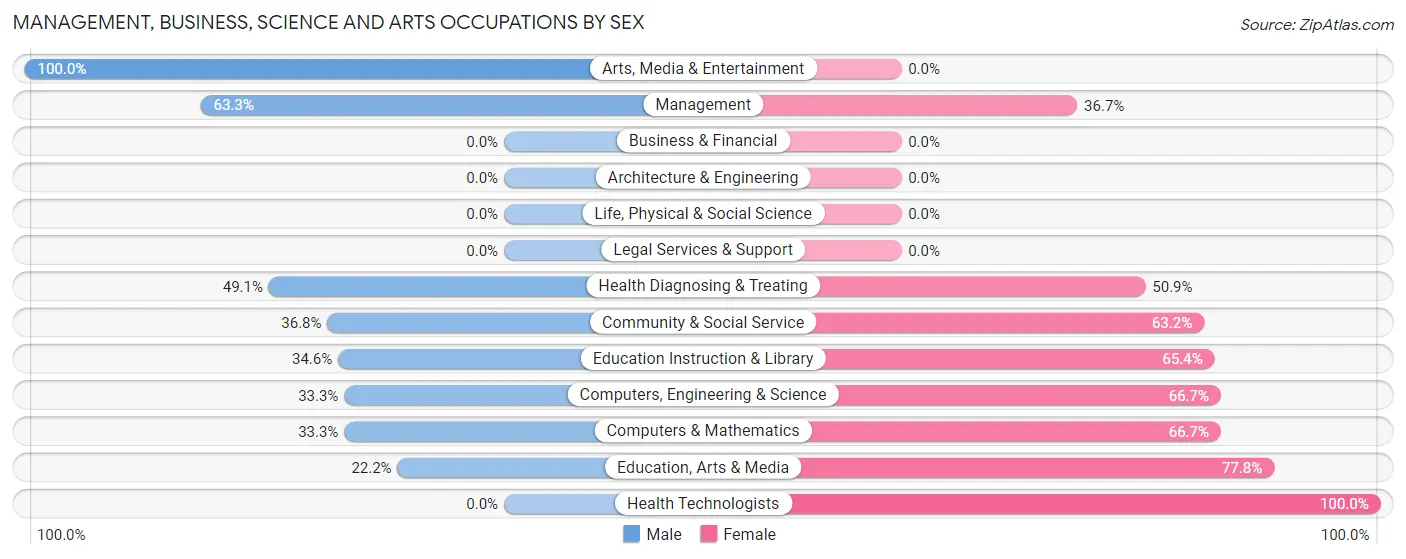
| Occupation | Male | Female |
| Management | 50 (63.3%) | 29 (36.7%) |
| Business & Financial | 0 (0.0%) | 0 (0.0%) |
| Computers, Engineering & Science | 2 (33.3%) | 4 (66.7%) |
| Computers & Mathematics | 2 (33.3%) | 4 (66.7%) |
| Architecture & Engineering | 0 (0.0%) | 0 (0.0%) |
| Life, Physical & Social Science | 0 (0.0%) | 0 (0.0%) |
| Community & Social Service | 14 (36.8%) | 24 (63.2%) |
| Education, Arts & Media | 2 (22.2%) | 7 (77.8%) |
| Legal Services & Support | 0 (0.0%) | 0 (0.0%) |
| Education Instruction & Library | 9 (34.6%) | 17 (65.4%) |
| Arts, Media & Entertainment | 3 (100.0%) | 0 (0.0%) |
| Health Diagnosing & Treating | 26 (49.1%) | 27 (50.9%) |
| Health Technologists | 0 (0.0%) | 16 (100.0%) |
| Total (Category) | 92 (52.3%) | 84 (47.7%) |
| Total (Overall) | 288 (50.6%) | 281 (49.4%) |
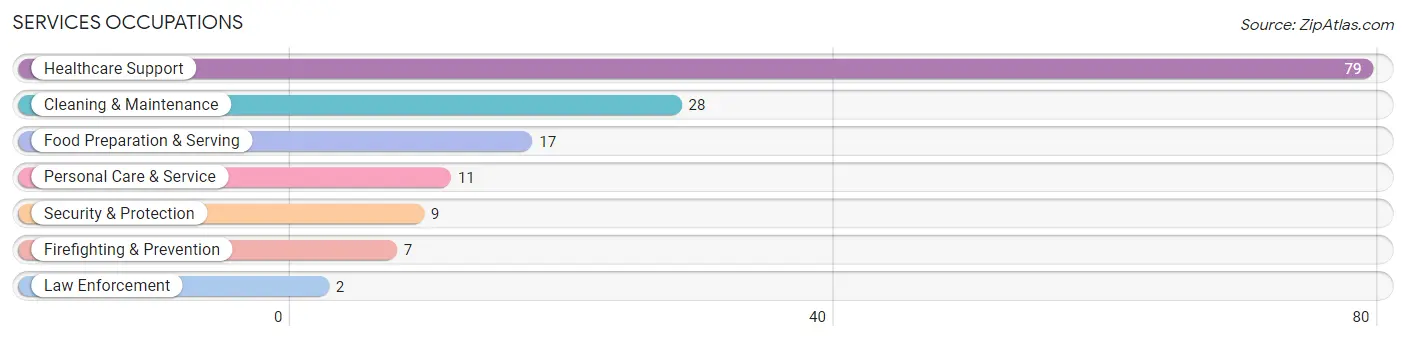
Services Occupations
The most common Services occupations in Girardville borough are Healthcare Support (79 | 13.9%), Cleaning & Maintenance (28 | 4.9%), Food Preparation & Serving (17 | 3.0%), Personal Care & Service (11 | 1.9%), and Security & Protection (9 | 1.6%).
Services Occupations by Sex
Within the Services occupations in Girardville borough, the most male-oriented occupations are Law Enforcement (100.0%), Personal Care & Service (54.5%), and Cleaning & Maintenance (25.0%), while the most female-oriented occupations are Healthcare Support (100.0%), Firefighting & Prevention (100.0%), and Food Preparation & Serving (88.2%).
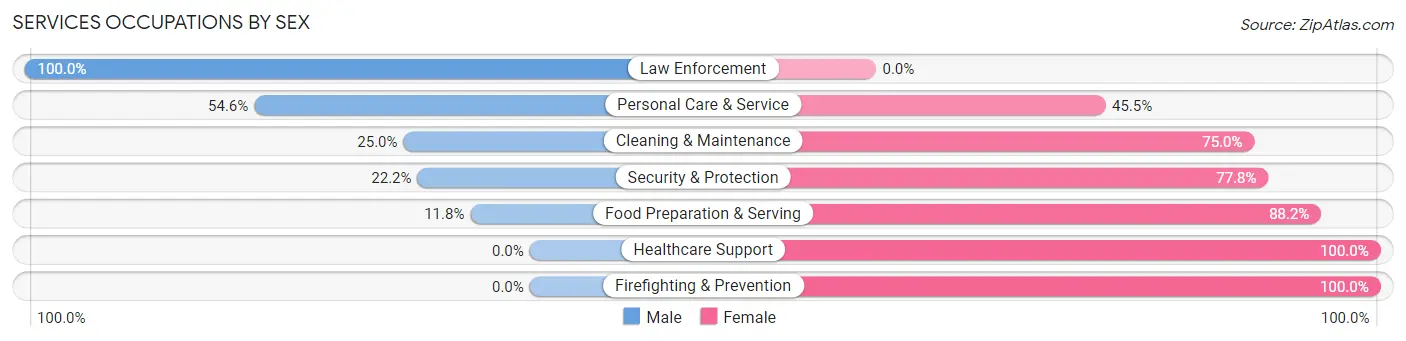
| Occupation | Male | Female |
| Healthcare Support | 0 (0.0%) | 79 (100.0%) |
| Security & Protection | 2 (22.2%) | 7 (77.8%) |
| Firefighting & Prevention | 0 (0.0%) | 7 (100.0%) |
| Law Enforcement | 2 (100.0%) | 0 (0.0%) |
| Food Preparation & Serving | 2 (11.8%) | 15 (88.2%) |
| Cleaning & Maintenance | 7 (25.0%) | 21 (75.0%) |
| Personal Care & Service | 6 (54.5%) | 5 (45.5%) |
| Total (Category) | 17 (11.8%) | 127 (88.2%) |
| Total (Overall) | 288 (50.6%) | 281 (49.4%) |
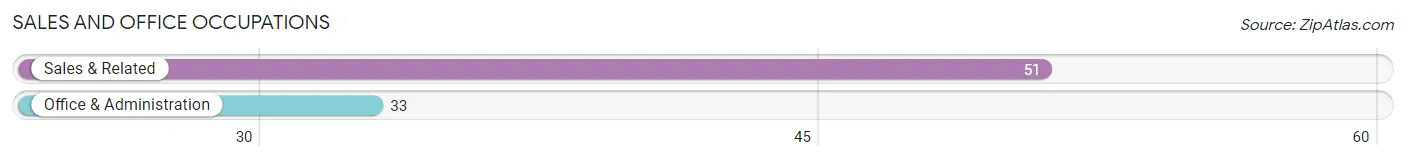
Sales and Office Occupations
The most common Sales and Office occupations in Girardville borough are Sales & Related (51 | 9.0%), and Office & Administration (33 | 5.8%).
Sales and Office Occupations by Sex

| Occupation | Male | Female |
| Sales & Related | 36 (70.6%) | 15 (29.4%) |
| Office & Administration | 4 (12.1%) | 29 (87.9%) |
| Total (Category) | 40 (47.6%) | 44 (52.4%) |
| Total (Overall) | 288 (50.6%) | 281 (49.4%) |
Natural Resources, Construction and Maintenance Occupations
The most common Natural Resources, Construction and Maintenance occupations in Girardville borough are Installation, Maintenance & Repair (20 | 3.5%), Construction & Extraction (15 | 2.6%), and Farming, Fishing & Forestry (4 | 0.7%).

Natural Resources, Construction and Maintenance Occupations by Sex

| Occupation | Male | Female |
| Farming, Fishing & Forestry | 4 (100.0%) | 0 (0.0%) |
| Construction & Extraction | 15 (100.0%) | 0 (0.0%) |
| Installation, Maintenance & Repair | 20 (100.0%) | 0 (0.0%) |
| Total (Category) | 39 (100.0%) | 0 (0.0%) |
| Total (Overall) | 288 (50.6%) | 281 (49.4%) |
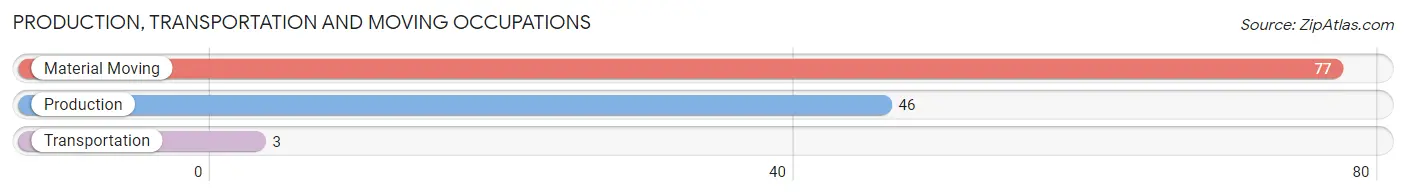
Production, Transportation and Moving Occupations
The most common Production, Transportation and Moving occupations in Girardville borough are Material Moving (77 | 13.5%), Production (46 | 8.1%), and Transportation (3 | 0.5%).
Production, Transportation and Moving Occupations by Sex
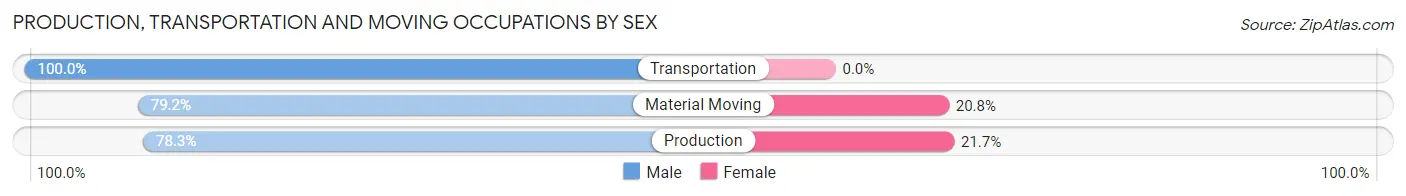
| Occupation | Male | Female |
| Production | 36 (78.3%) | 10 (21.7%) |
| Transportation | 3 (100.0%) | 0 (0.0%) |
| Material Moving | 61 (79.2%) | 16 (20.8%) |
| Total (Category) | 100 (79.4%) | 26 (20.6%) |
| Total (Overall) | 288 (50.6%) | 281 (49.4%) |
Employment Industries by Sex in Girardville borough
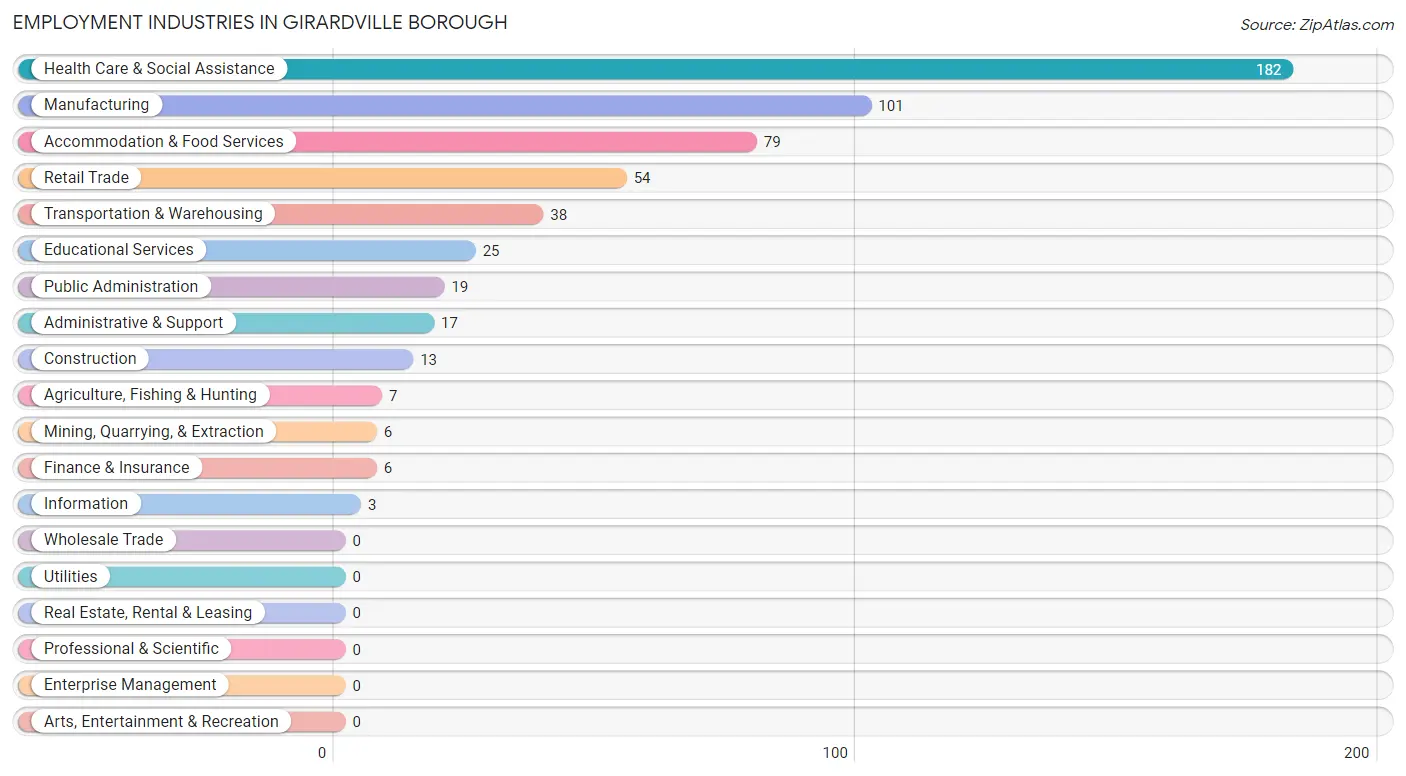
Employment Industries in Girardville borough
The major employment industries in Girardville borough include Health Care & Social Assistance (182 | 32.0%), Manufacturing (101 | 17.7%), Accommodation & Food Services (79 | 13.9%), Retail Trade (54 | 9.5%), and Transportation & Warehousing (38 | 6.7%).
Employment Industries by Sex in Girardville borough
The Girardville borough industries that see more men than women are Agriculture, Fishing & Hunting (100.0%), Mining, Quarrying, & Extraction (100.0%), and Construction (100.0%), whereas the industries that tend to have a higher number of women are Administrative & Support (100.0%), Health Care & Social Assistance (84.6%), and Educational Services (48.0%).
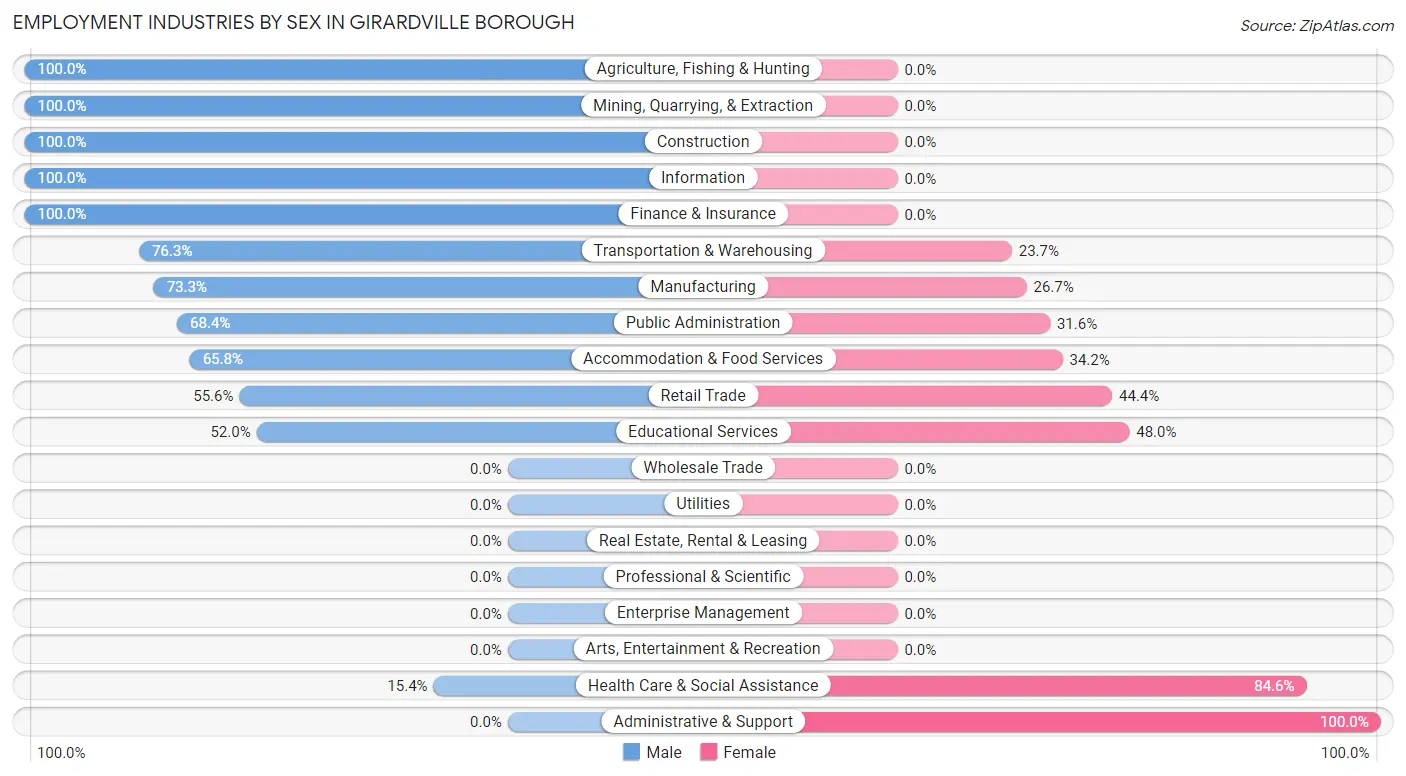
| Industry | Male | Female |
| Agriculture, Fishing & Hunting | 7 (100.0%) | 0 (0.0%) |
| Mining, Quarrying, & Extraction | 6 (100.0%) | 0 (0.0%) |
| Construction | 13 (100.0%) | 0 (0.0%) |
| Manufacturing | 74 (73.3%) | 27 (26.7%) |
| Wholesale Trade | 0 (0.0%) | 0 (0.0%) |
| Retail Trade | 30 (55.6%) | 24 (44.4%) |
| Transportation & Warehousing | 29 (76.3%) | 9 (23.7%) |
| Utilities | 0 (0.0%) | 0 (0.0%) |
| Information | 3 (100.0%) | 0 (0.0%) |
| Finance & Insurance | 6 (100.0%) | 0 (0.0%) |
| Real Estate, Rental & Leasing | 0 (0.0%) | 0 (0.0%) |
| Professional & Scientific | 0 (0.0%) | 0 (0.0%) |
| Enterprise Management | 0 (0.0%) | 0 (0.0%) |
| Administrative & Support | 0 (0.0%) | 17 (100.0%) |
| Educational Services | 13 (52.0%) | 12 (48.0%) |
| Health Care & Social Assistance | 28 (15.4%) | 154 (84.6%) |
| Arts, Entertainment & Recreation | 0 (0.0%) | 0 (0.0%) |
| Accommodation & Food Services | 52 (65.8%) | 27 (34.2%) |
| Public Administration | 13 (68.4%) | 6 (31.6%) |
| Total | 288 (50.6%) | 281 (49.4%) |
Education in Girardville borough
School Enrollment in Girardville borough
The most common levels of schooling among the 275 students in Girardville borough are elementary school (115 | 41.8%), middle school (88 | 32.0%), and high school (47 | 17.1%).
| School Level | # Students | % Students |
| Nursery / Preschool | 7 | 2.5% |
| Kindergarten | 8 | 2.9% |
| Elementary School | 115 | 41.8% |
| Middle School | 88 | 32.0% |
| High School | 47 | 17.1% |
| College / Undergraduate | 10 | 3.6% |
| Graduate / Professional | 0 | 0.0% |
| Total | 275 | 100.0% |
School Enrollment by Age by Funding Source in Girardville borough
Out of a total of 275 students who are enrolled in schools in Girardville borough, 49 (17.8%) attend a private institution, while the remaining 226 (82.2%) are enrolled in public schools. The age group of 3 to 4 year olds has the highest likelihood of being enrolled in private schools, with 7 (100.0% in the age bracket) enrolled. Conversely, the age group of 18 to 19 year olds has the lowest likelihood of being enrolled in a private school, with 5 (100.0% in the age bracket) attending a public institution.
| Age Bracket | Public School | Private School |
| 3 to 4 Year Olds | 0 (0.0%) | 7 (100.0%) |
| 5 to 9 Year Old | 74 (71.8%) | 29 (28.2%) |
| 10 to 14 Year Olds | 100 (92.6%) | 8 (7.4%) |
| 15 to 17 Year Olds | 37 (88.1%) | 5 (11.9%) |
| 18 to 19 Year Olds | 5 (100.0%) | 0 (0.0%) |
| 20 to 24 Year Olds | 0 (0.0%) | 0 (0.0%) |
| 25 to 34 Year Olds | 6 (100.0%) | 0 (0.0%) |
| 35 Years and over | 4 (100.0%) | 0 (0.0%) |
| Total | 226 (82.2%) | 49 (17.8%) |
Educational Attainment by Field of Study in Girardville borough
Education (19 | 31.1%), psychology (15 | 24.6%), business (10 | 16.4%), arts & humanities (6 | 9.8%), and literature & languages (4 | 6.6%) are the most common fields of study among 61 individuals in Girardville borough who have obtained a bachelor's degree or higher.
| Field of Study | # Graduates | % Graduates |
| Computers & Mathematics | 0 | 0.0% |
| Bio, Nature & Agricultural | 0 | 0.0% |
| Physical & Health Sciences | 0 | 0.0% |
| Psychology | 15 | 24.6% |
| Social Sciences | 2 | 3.3% |
| Engineering | 0 | 0.0% |
| Multidisciplinary Studies | 2 | 3.3% |
| Science & Technology | 0 | 0.0% |
| Business | 10 | 16.4% |
| Education | 19 | 31.1% |
| Literature & Languages | 4 | 6.6% |
| Liberal Arts & History | 0 | 0.0% |
| Visual & Performing Arts | 0 | 0.0% |
| Communications | 3 | 4.9% |
| Arts & Humanities | 6 | 9.8% |
| Total | 61 | 100.0% |
Transportation & Commute in Girardville borough
Vehicle Availability by Sex in Girardville borough
The most prevalent vehicle ownership categories in Girardville borough are males with 1 vehicle (111, accounting for 43.2%) and females with 1 vehicle (95, making up 39.5%).
| Vehicles Available | Male | Female |
| No Vehicle | 3 (1.2%) | 8 (2.9%) |
| 1 Vehicle | 111 (43.2%) | 95 (33.8%) |
| 2 Vehicles | 68 (26.5%) | 96 (34.2%) |
| 3 Vehicles | 53 (20.6%) | 64 (22.8%) |
| 4 Vehicles | 0 (0.0%) | 0 (0.0%) |
| 5 or more Vehicles | 22 (8.6%) | 18 (6.4%) |
| Total | 257 (100.0%) | 281 (100.0%) |
Commute Time in Girardville borough
The most frequently occuring commute durations in Girardville borough are 15 to 19 minutes (149 commuters, 27.7%), 20 to 24 minutes (112 commuters, 20.8%), and 30 to 34 minutes (104 commuters, 19.3%).
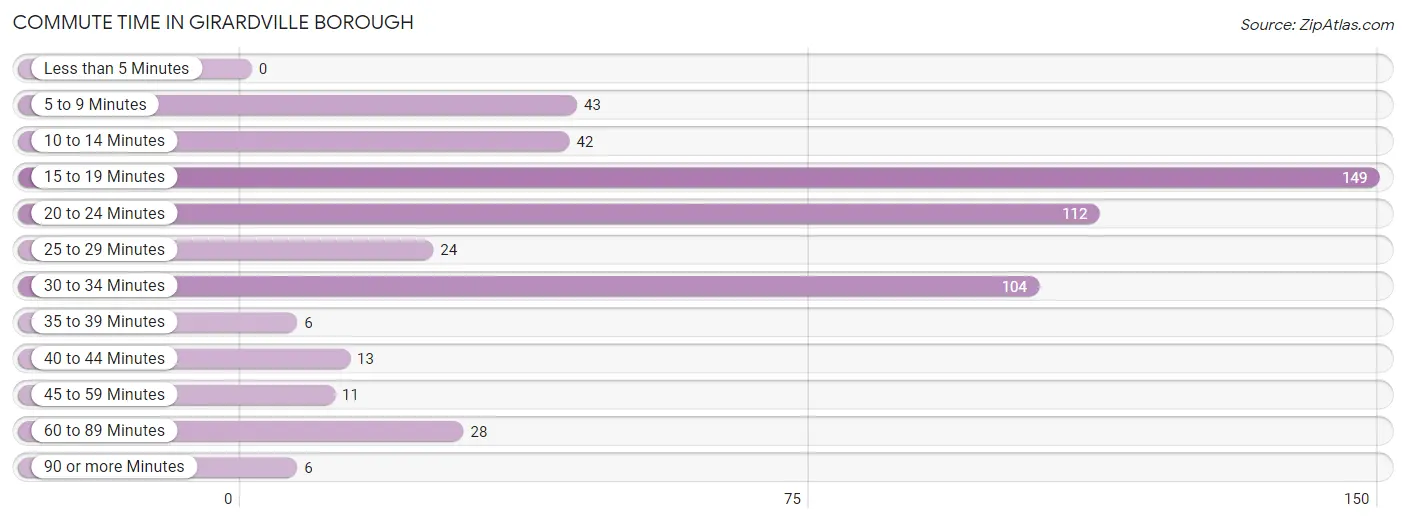
| Commute Time | # Commuters | % Commuters |
| Less than 5 Minutes | 0 | 0.0% |
| 5 to 9 Minutes | 43 | 8.0% |
| 10 to 14 Minutes | 42 | 7.8% |
| 15 to 19 Minutes | 149 | 27.7% |
| 20 to 24 Minutes | 112 | 20.8% |
| 25 to 29 Minutes | 24 | 4.5% |
| 30 to 34 Minutes | 104 | 19.3% |
| 35 to 39 Minutes | 6 | 1.1% |
| 40 to 44 Minutes | 13 | 2.4% |
| 45 to 59 Minutes | 11 | 2.0% |
| 60 to 89 Minutes | 28 | 5.2% |
| 90 or more Minutes | 6 | 1.1% |
Commute Time by Sex in Girardville borough
The most common commute times in Girardville borough are 30 to 34 minutes (71 commuters, 27.6%) for males and 15 to 19 minutes (98 commuters, 34.9%) for females.
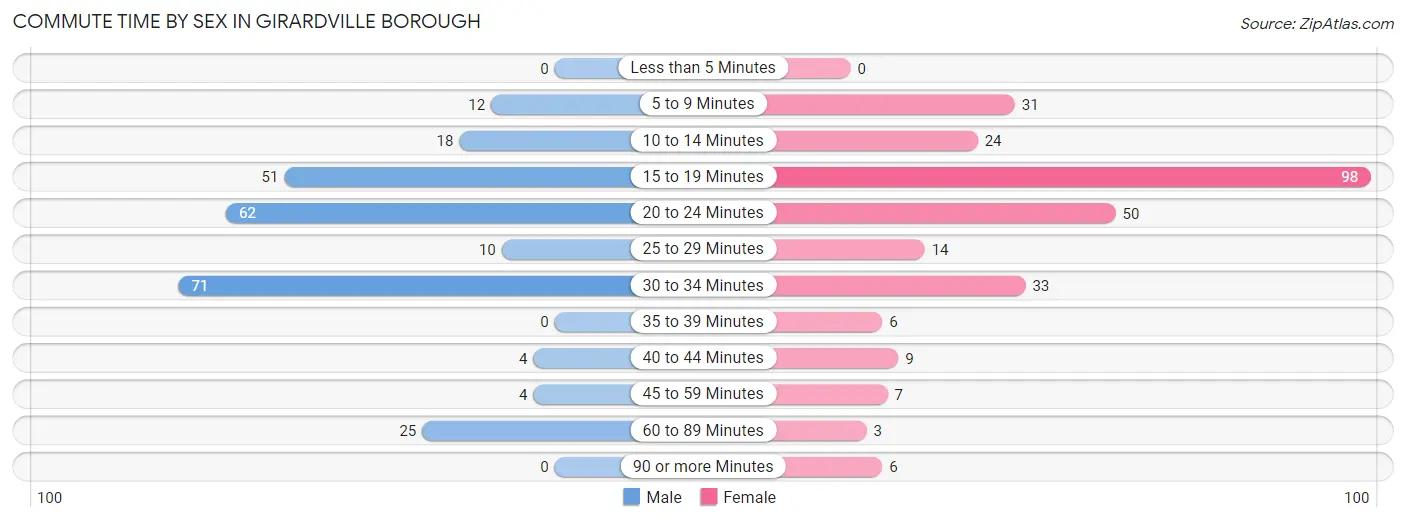
| Commute Time | Male | Female |
| Less than 5 Minutes | 0 (0.0%) | 0 (0.0%) |
| 5 to 9 Minutes | 12 (4.7%) | 31 (11.0%) |
| 10 to 14 Minutes | 18 (7.0%) | 24 (8.5%) |
| 15 to 19 Minutes | 51 (19.8%) | 98 (34.9%) |
| 20 to 24 Minutes | 62 (24.1%) | 50 (17.8%) |
| 25 to 29 Minutes | 10 (3.9%) | 14 (5.0%) |
| 30 to 34 Minutes | 71 (27.6%) | 33 (11.7%) |
| 35 to 39 Minutes | 0 (0.0%) | 6 (2.1%) |
| 40 to 44 Minutes | 4 (1.6%) | 9 (3.2%) |
| 45 to 59 Minutes | 4 (1.6%) | 7 (2.5%) |
| 60 to 89 Minutes | 25 (9.7%) | 3 (1.1%) |
| 90 or more Minutes | 0 (0.0%) | 6 (2.1%) |
Time of Departure to Work by Sex in Girardville borough
The most frequent times of departure to work in Girardville borough are 12:00 PM to 3:59 PM (57, 22.2%) for males and 8:30 AM to 8:59 AM (66, 23.5%) for females.
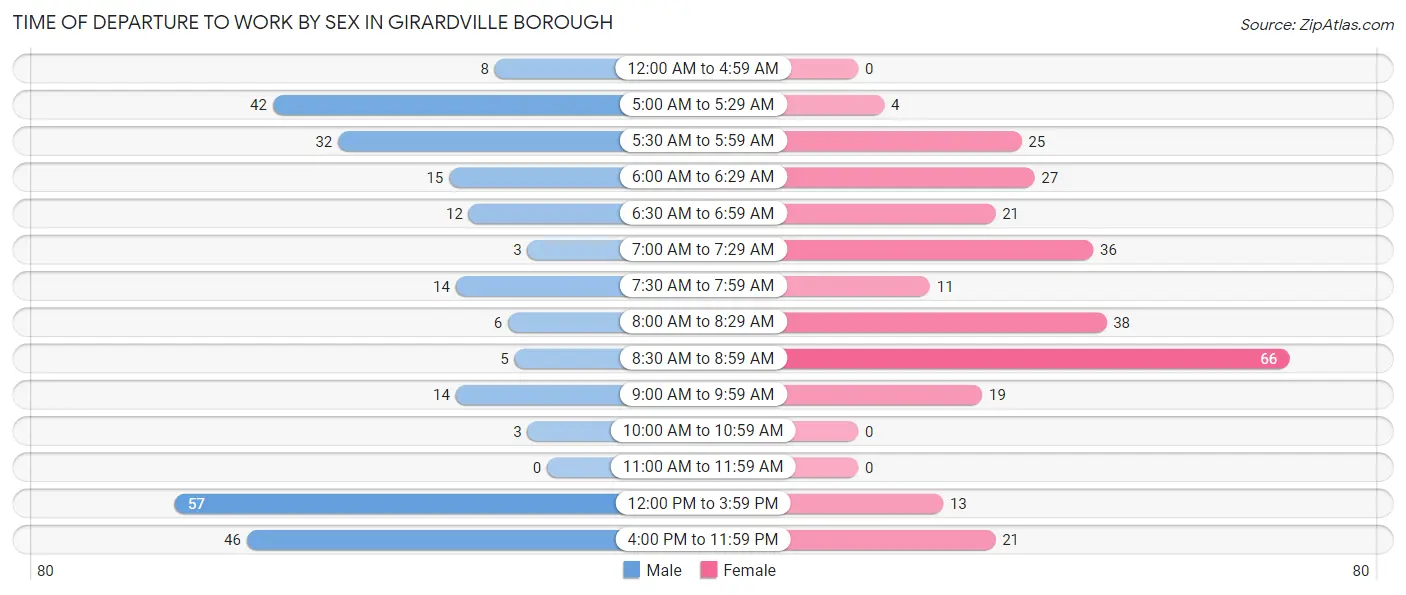
| Time of Departure | Male | Female |
| 12:00 AM to 4:59 AM | 8 (3.1%) | 0 (0.0%) |
| 5:00 AM to 5:29 AM | 42 (16.3%) | 4 (1.4%) |
| 5:30 AM to 5:59 AM | 32 (12.4%) | 25 (8.9%) |
| 6:00 AM to 6:29 AM | 15 (5.8%) | 27 (9.6%) |
| 6:30 AM to 6:59 AM | 12 (4.7%) | 21 (7.5%) |
| 7:00 AM to 7:29 AM | 3 (1.2%) | 36 (12.8%) |
| 7:30 AM to 7:59 AM | 14 (5.4%) | 11 (3.9%) |
| 8:00 AM to 8:29 AM | 6 (2.3%) | 38 (13.5%) |
| 8:30 AM to 8:59 AM | 5 (1.9%) | 66 (23.5%) |
| 9:00 AM to 9:59 AM | 14 (5.4%) | 19 (6.8%) |
| 10:00 AM to 10:59 AM | 3 (1.2%) | 0 (0.0%) |
| 11:00 AM to 11:59 AM | 0 (0.0%) | 0 (0.0%) |
| 12:00 PM to 3:59 PM | 57 (22.2%) | 13 (4.6%) |
| 4:00 PM to 11:59 PM | 46 (17.9%) | 21 (7.5%) |
| Total | 257 (100.0%) | 281 (100.0%) |
Housing Occupancy in Girardville borough
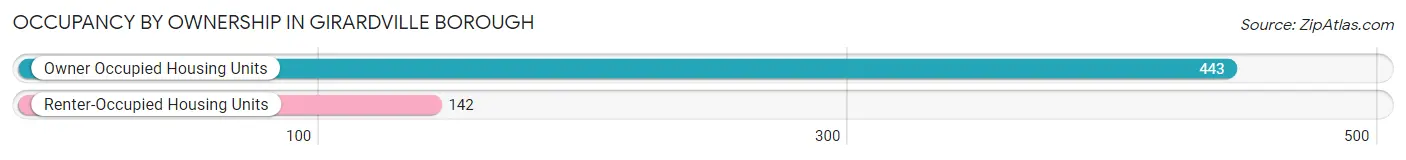
Occupancy by Ownership in Girardville borough
Of the total 585 dwellings in Girardville borough, owner-occupied units account for 443 (75.7%), while renter-occupied units make up 142 (24.3%).
| Occupancy | # Housing Units | % Housing Units |
| Owner Occupied Housing Units | 443 | 75.7% |
| Renter-Occupied Housing Units | 142 | 24.3% |
| Total Occupied Housing Units | 585 | 100.0% |
Occupancy by Household Size in Girardville borough
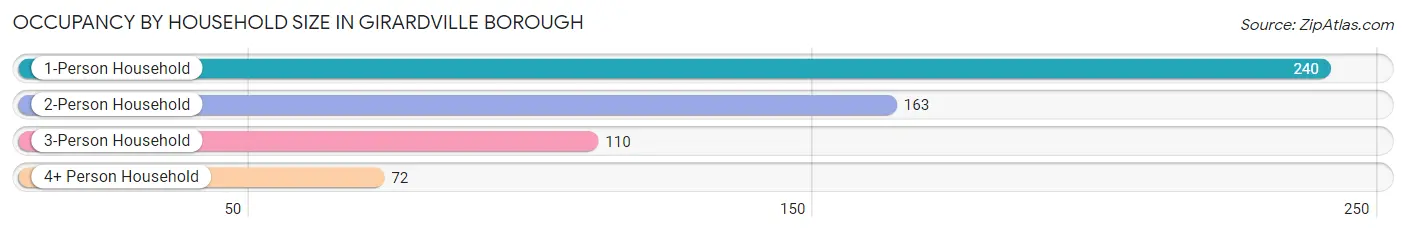
| Household Size | # Housing Units | % Housing Units |
| 1-Person Household | 240 | 41.0% |
| 2-Person Household | 163 | 27.9% |
| 3-Person Household | 110 | 18.8% |
| 4+ Person Household | 72 | 12.3% |
| Total Housing Units | 585 | 100.0% |
Occupancy by Ownership by Household Size in Girardville borough
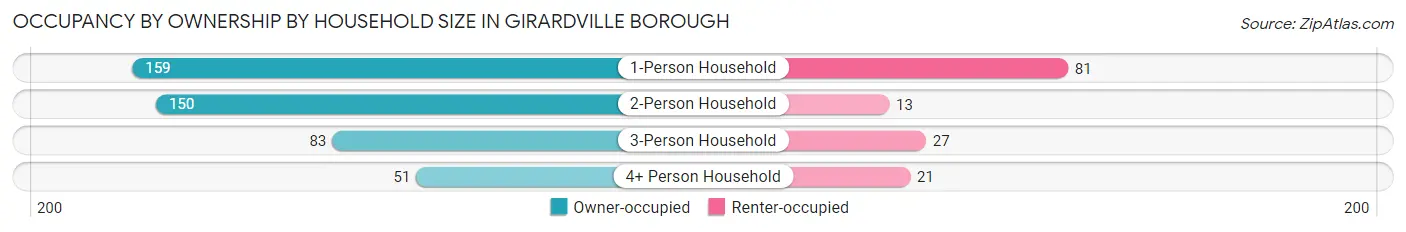
| Household Size | Owner-occupied | Renter-occupied |
| 1-Person Household | 159 (66.2%) | 81 (33.8%) |
| 2-Person Household | 150 (92.0%) | 13 (8.0%) |
| 3-Person Household | 83 (75.4%) | 27 (24.5%) |
| 4+ Person Household | 51 (70.8%) | 21 (29.2%) |
| Total Housing Units | 443 (75.7%) | 142 (24.3%) |
Occupancy by Educational Attainment in Girardville borough
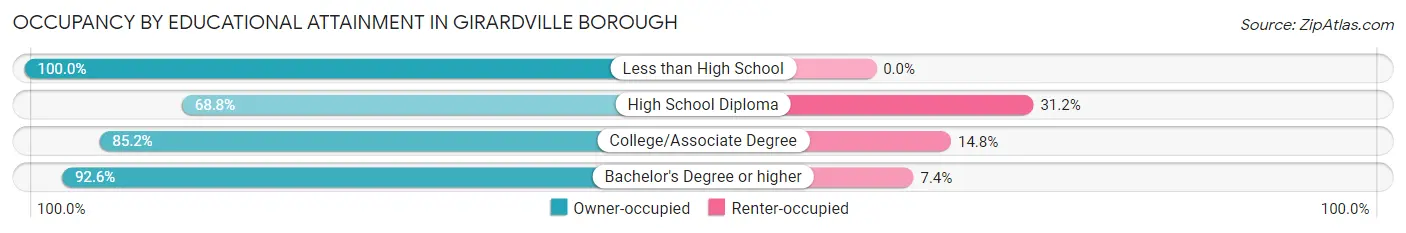
| Household Size | Owner-occupied | Renter-occupied |
| Less than High School | 42 (100.0%) | 0 (0.0%) |
| High School Diploma | 267 (68.8%) | 121 (31.2%) |
| College/Associate Degree | 109 (85.2%) | 19 (14.8%) |
| Bachelor's Degree or higher | 25 (92.6%) | 2 (7.4%) |
Occupancy by Age of Householder in Girardville borough
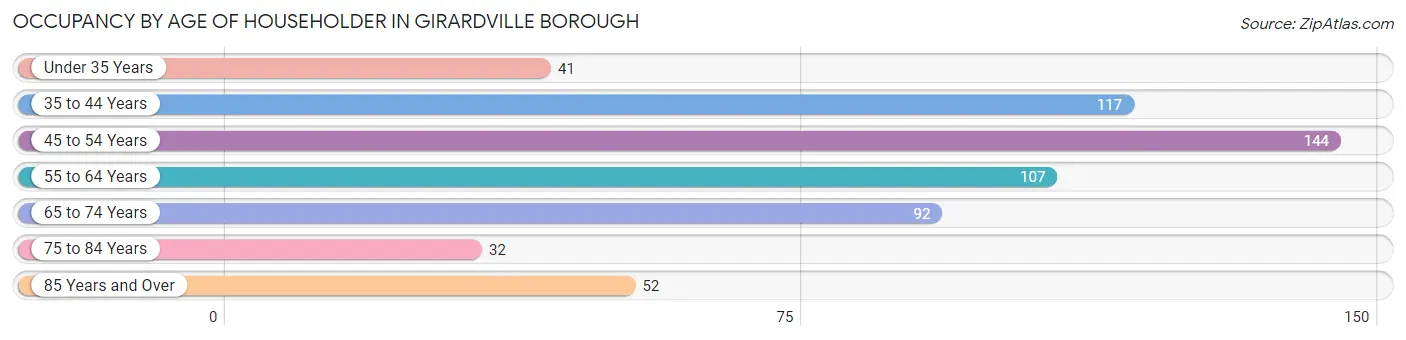
| Age Bracket | # Households | % Households |
| Under 35 Years | 41 | 7.0% |
| 35 to 44 Years | 117 | 20.0% |
| 45 to 54 Years | 144 | 24.6% |
| 55 to 64 Years | 107 | 18.3% |
| 65 to 74 Years | 92 | 15.7% |
| 75 to 84 Years | 32 | 5.5% |
| 85 Years and Over | 52 | 8.9% |
| Total | 585 | 100.0% |
Housing Finances in Girardville borough
Median Income by Occupancy in Girardville borough
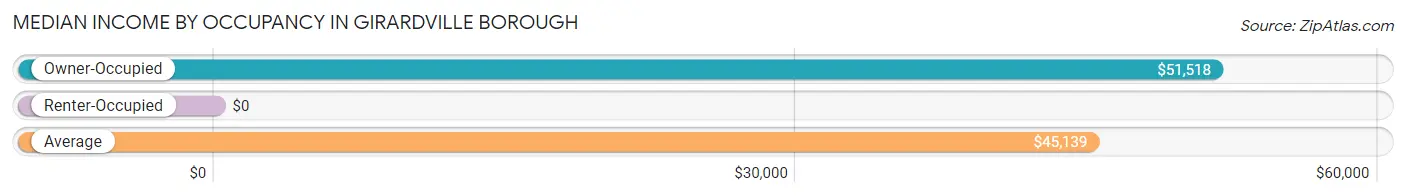
| Occupancy Type | # Households | Median Income |
| Owner-Occupied | 443 (75.7%) | $51,518 |
| Renter-Occupied | 142 (24.3%) | $0 |
| Average | 585 (100.0%) | $45,139 |
Occupancy by Householder Income Bracket in Girardville borough
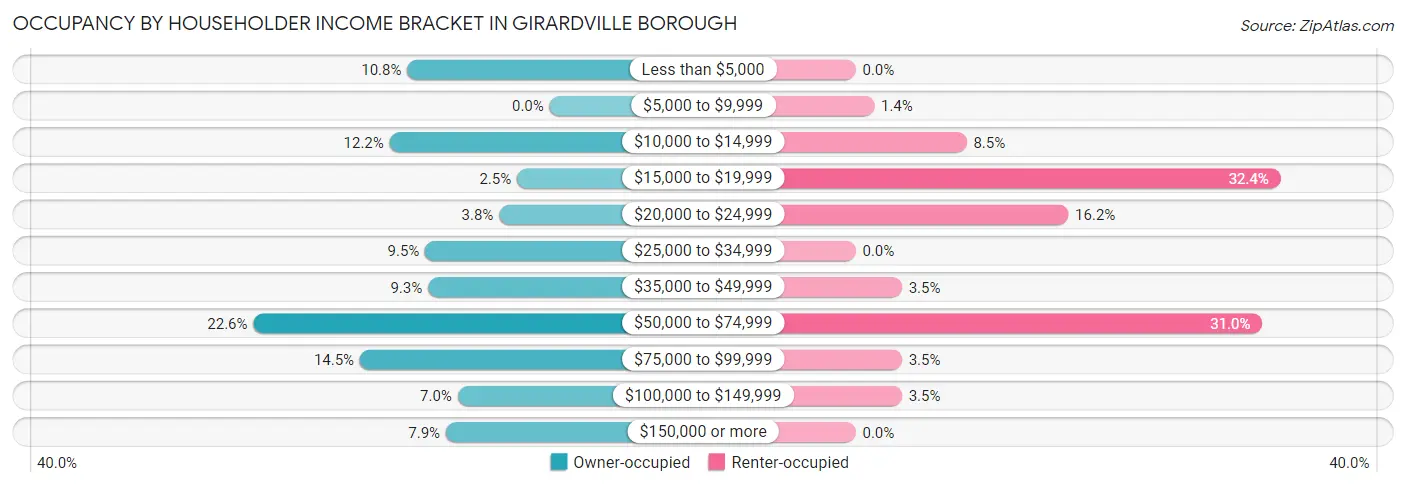
| Income Bracket | Owner-occupied | Renter-occupied |
| Less than $5,000 | 48 (10.8%) | 0 (0.0%) |
| $5,000 to $9,999 | 0 (0.0%) | 2 (1.4%) |
| $10,000 to $14,999 | 54 (12.2%) | 12 (8.5%) |
| $15,000 to $19,999 | 11 (2.5%) | 46 (32.4%) |
| $20,000 to $24,999 | 17 (3.8%) | 23 (16.2%) |
| $25,000 to $34,999 | 42 (9.5%) | 0 (0.0%) |
| $35,000 to $49,999 | 41 (9.3%) | 5 (3.5%) |
| $50,000 to $74,999 | 100 (22.6%) | 44 (31.0%) |
| $75,000 to $99,999 | 64 (14.4%) | 5 (3.5%) |
| $100,000 to $149,999 | 31 (7.0%) | 5 (3.5%) |
| $150,000 or more | 35 (7.9%) | 0 (0.0%) |
| Total | 443 (100.0%) | 142 (100.0%) |
Monthly Housing Cost Tiers in Girardville borough
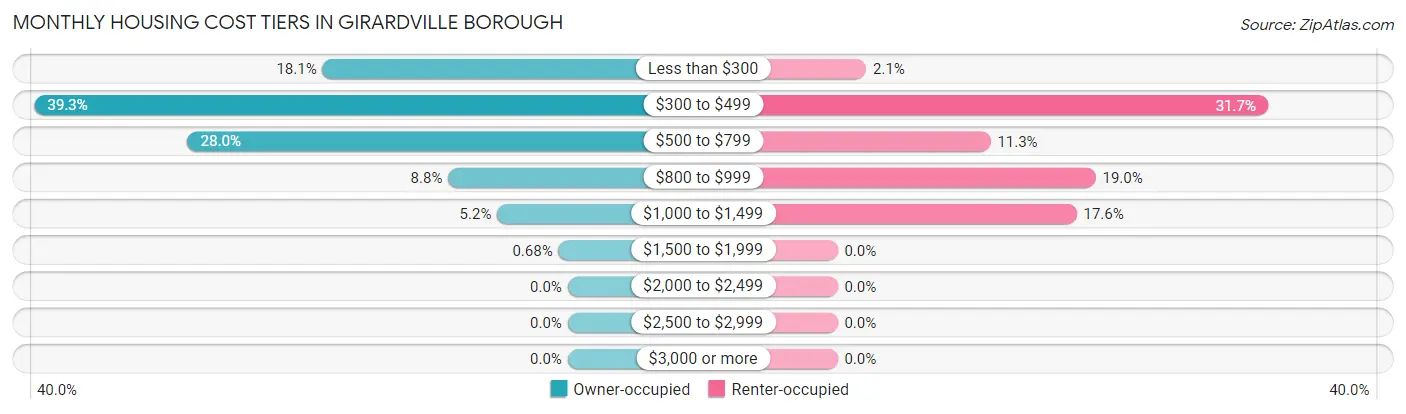
| Monthly Cost | Owner-occupied | Renter-occupied |
| Less than $300 | 80 (18.1%) | 3 (2.1%) |
| $300 to $499 | 174 (39.3%) | 45 (31.7%) |
| $500 to $799 | 124 (28.0%) | 16 (11.3%) |
| $800 to $999 | 39 (8.8%) | 27 (19.0%) |
| $1,000 to $1,499 | 23 (5.2%) | 25 (17.6%) |
| $1,500 to $1,999 | 3 (0.7%) | 0 (0.0%) |
| $2,000 to $2,499 | 0 (0.0%) | 0 (0.0%) |
| $2,500 to $2,999 | 0 (0.0%) | 0 (0.0%) |
| $3,000 or more | 0 (0.0%) | 0 (0.0%) |
| Total | 443 (100.0%) | 142 (100.0%) |
Physical Housing Characteristics in Girardville borough
Housing Structures in Girardville borough
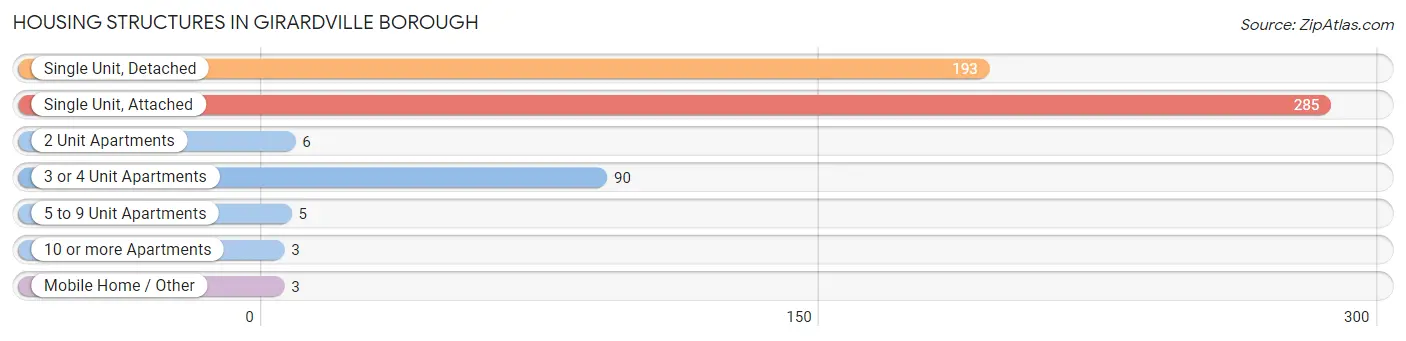
| Structure Type | # Housing Units | % Housing Units |
| Single Unit, Detached | 193 | 33.0% |
| Single Unit, Attached | 285 | 48.7% |
| 2 Unit Apartments | 6 | 1.0% |
| 3 or 4 Unit Apartments | 90 | 15.4% |
| 5 to 9 Unit Apartments | 5 | 0.9% |
| 10 or more Apartments | 3 | 0.5% |
| Mobile Home / Other | 3 | 0.5% |
| Total | 585 | 100.0% |
Housing Structures by Occupancy in Girardville borough
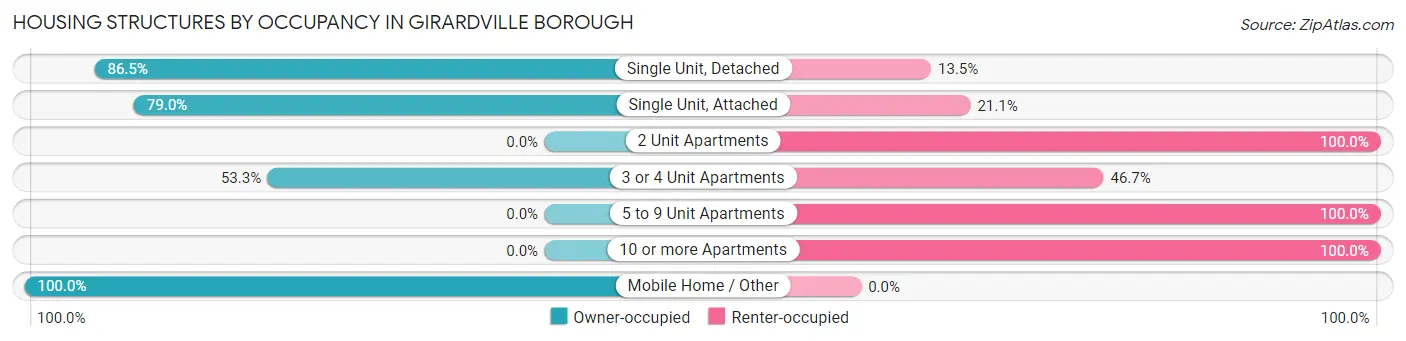
| Structure Type | Owner-occupied | Renter-occupied |
| Single Unit, Detached | 167 (86.5%) | 26 (13.5%) |
| Single Unit, Attached | 225 (78.9%) | 60 (21.0%) |
| 2 Unit Apartments | 0 (0.0%) | 6 (100.0%) |
| 3 or 4 Unit Apartments | 48 (53.3%) | 42 (46.7%) |
| 5 to 9 Unit Apartments | 0 (0.0%) | 5 (100.0%) |
| 10 or more Apartments | 0 (0.0%) | 3 (100.0%) |
| Mobile Home / Other | 3 (100.0%) | 0 (0.0%) |
| Total | 443 (75.7%) | 142 (24.3%) |
Housing Structures by Number of Rooms in Girardville borough
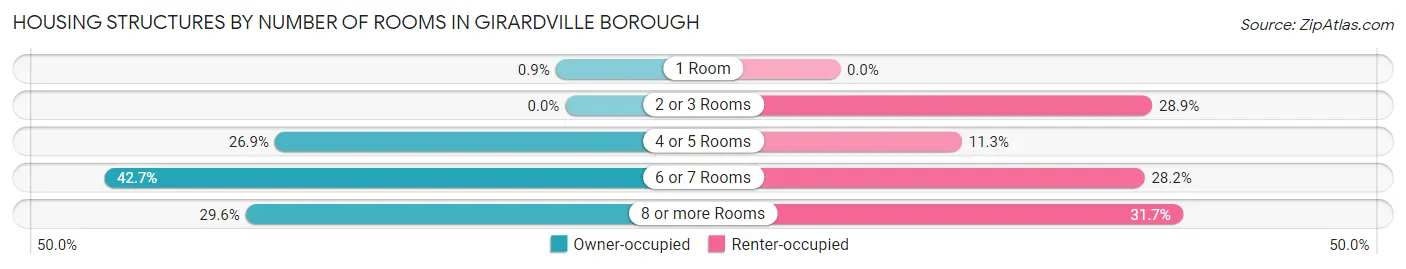
| Number of Rooms | Owner-occupied | Renter-occupied |
| 1 Room | 4 (0.9%) | 0 (0.0%) |
| 2 or 3 Rooms | 0 (0.0%) | 41 (28.9%) |
| 4 or 5 Rooms | 119 (26.9%) | 16 (11.3%) |
| 6 or 7 Rooms | 189 (42.7%) | 40 (28.2%) |
| 8 or more Rooms | 131 (29.6%) | 45 (31.7%) |
| Total | 443 (100.0%) | 142 (100.0%) |
Housing Structure by Heating Type in Girardville borough
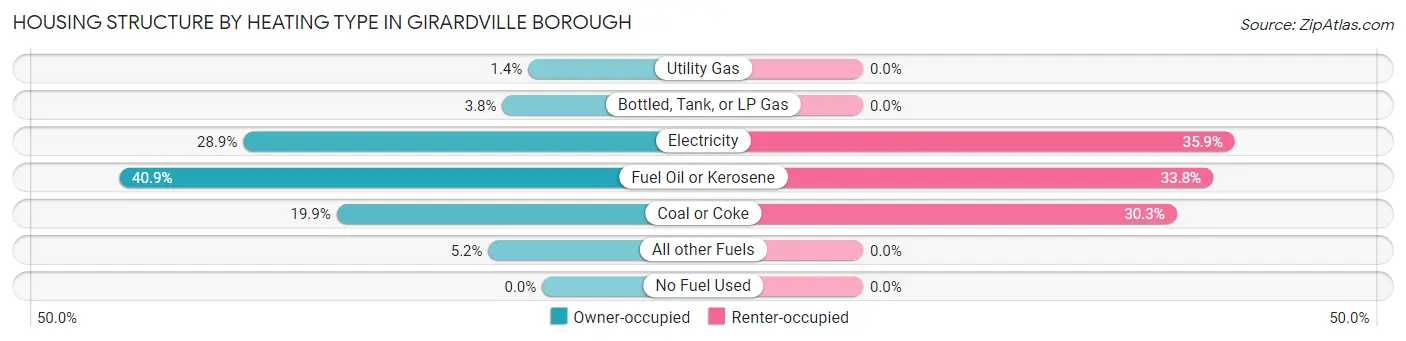
| Heating Type | Owner-occupied | Renter-occupied |
| Utility Gas | 6 (1.3%) | 0 (0.0%) |
| Bottled, Tank, or LP Gas | 17 (3.8%) | 0 (0.0%) |
| Electricity | 128 (28.9%) | 51 (35.9%) |
| Fuel Oil or Kerosene | 181 (40.9%) | 48 (33.8%) |
| Coal or Coke | 88 (19.9%) | 43 (30.3%) |
| All other Fuels | 23 (5.2%) | 0 (0.0%) |
| No Fuel Used | 0 (0.0%) | 0 (0.0%) |
| Total | 443 (100.0%) | 142 (100.0%) |
Household Vehicle Usage in Girardville borough
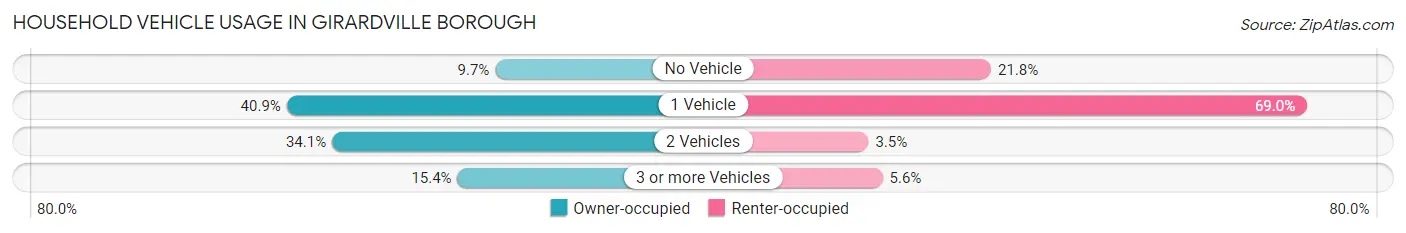
| Vehicles per Household | Owner-occupied | Renter-occupied |
| No Vehicle | 43 (9.7%) | 31 (21.8%) |
| 1 Vehicle | 181 (40.9%) | 98 (69.0%) |
| 2 Vehicles | 151 (34.1%) | 5 (3.5%) |
| 3 or more Vehicles | 68 (15.3%) | 8 (5.6%) |
| Total | 443 (100.0%) | 142 (100.0%) |
Real Estate & Mortgages in Girardville borough
Real Estate and Mortgage Overview in Girardville borough
| Characteristic | Without Mortgage | With Mortgage |
| Housing Units | 408 | 35 |
| Median Property Value | $36,100 | $176,000 |
| Median Household Income | $46,944 | $0 |
| Monthly Housing Costs | $406 | $0 |
| Real Estate Taxes | $833 | $0 |
Property Value by Mortgage Status in Girardville borough
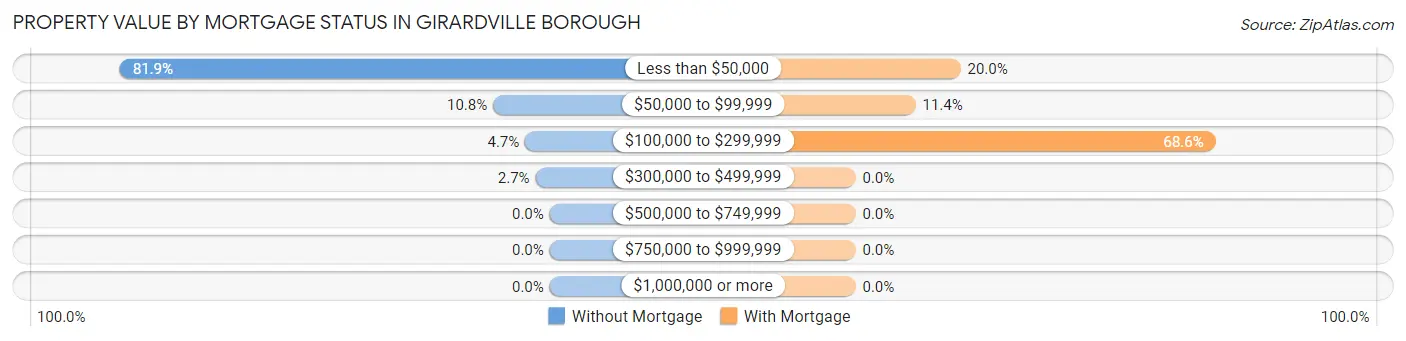
| Property Value | Without Mortgage | With Mortgage |
| Less than $50,000 | 334 (81.9%) | 7 (20.0%) |
| $50,000 to $99,999 | 44 (10.8%) | 4 (11.4%) |
| $100,000 to $299,999 | 19 (4.7%) | 24 (68.6%) |
| $300,000 to $499,999 | 11 (2.7%) | 0 (0.0%) |
| $500,000 to $749,999 | 0 (0.0%) | 0 (0.0%) |
| $750,000 to $999,999 | 0 (0.0%) | 0 (0.0%) |
| $1,000,000 or more | 0 (0.0%) | 0 (0.0%) |
| Total | 408 (100.0%) | 35 (100.0%) |
Household Income by Mortgage Status in Girardville borough
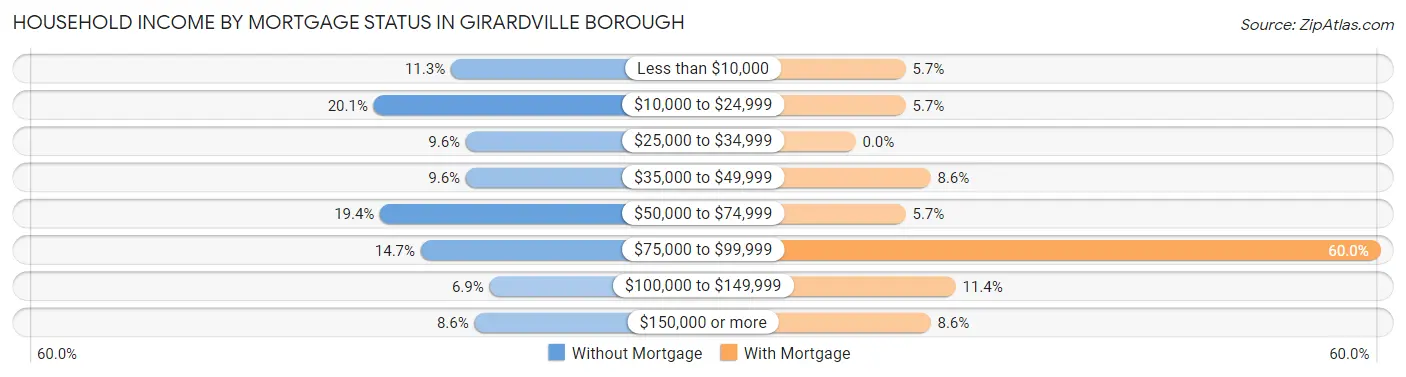
| Household Income | Without Mortgage | With Mortgage |
| Less than $10,000 | 46 (11.3%) | 2 (5.7%) |
| $10,000 to $24,999 | 82 (20.1%) | 2 (5.7%) |
| $25,000 to $34,999 | 39 (9.6%) | 0 (0.0%) |
| $35,000 to $49,999 | 39 (9.6%) | 3 (8.6%) |
| $50,000 to $74,999 | 79 (19.4%) | 2 (5.7%) |
| $75,000 to $99,999 | 60 (14.7%) | 21 (60.0%) |
| $100,000 to $149,999 | 28 (6.9%) | 4 (11.4%) |
| $150,000 or more | 35 (8.6%) | 3 (8.6%) |
| Total | 408 (100.0%) | 35 (100.0%) |
Property Value to Household Income Ratio in Girardville borough
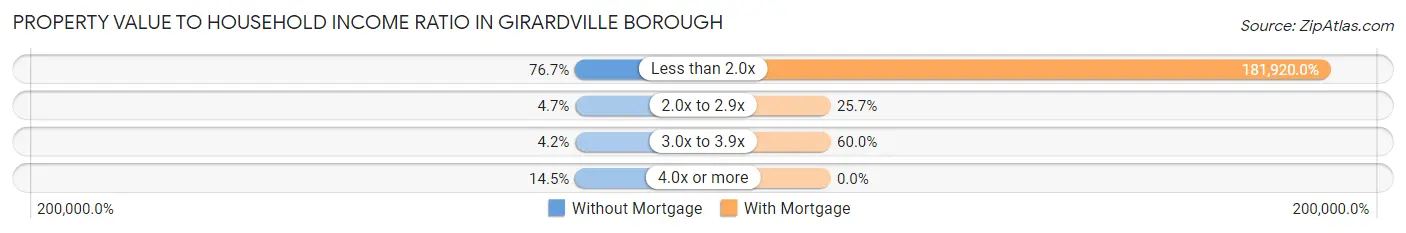
| Value-to-Income Ratio | Without Mortgage | With Mortgage |
| Less than 2.0x | 313 (76.7%) | 63,672 (181,920.0%) |
| 2.0x to 2.9x | 19 (4.7%) | 9 (25.7%) |
| 3.0x to 3.9x | 17 (4.2%) | 21 (60.0%) |
| 4.0x or more | 59 (14.5%) | 0 (0.0%) |
| Total | 408 (100.0%) | 35 (100.0%) |
Real Estate Taxes by Mortgage Status in Girardville borough
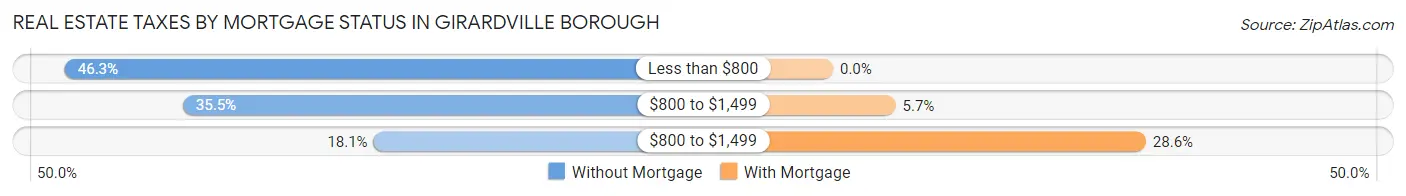
| Property Taxes | Without Mortgage | With Mortgage |
| Less than $800 | 189 (46.3%) | 0 (0.0%) |
| $800 to $1,499 | 145 (35.5%) | 2 (5.7%) |
| $800 to $1,499 | 74 (18.1%) | 10 (28.6%) |
| Total | 408 (100.0%) | 35 (100.0%) |
Health & Disability in Girardville borough
Health Insurance Coverage by Age in Girardville borough
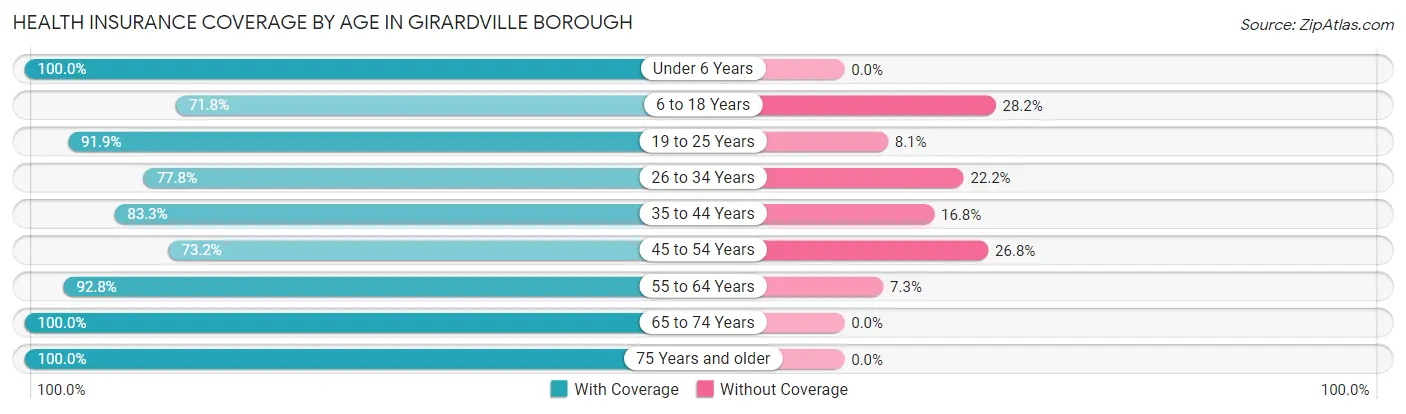
| Age Bracket | With Coverage | Without Coverage |
| Under 6 Years | 11 (100.0%) | 0 (0.0%) |
| 6 to 18 Years | 191 (71.8%) | 75 (28.2%) |
| 19 to 25 Years | 34 (91.9%) | 3 (8.1%) |
| 26 to 34 Years | 105 (77.8%) | 30 (22.2%) |
| 35 to 44 Years | 159 (83.3%) | 32 (16.8%) |
| 45 to 54 Years | 150 (73.2%) | 55 (26.8%) |
| 55 to 64 Years | 179 (92.7%) | 14 (7.2%) |
| 65 to 74 Years | 123 (100.0%) | 0 (0.0%) |
| 75 Years and older | 99 (100.0%) | 0 (0.0%) |
| Total | 1,051 (83.4%) | 209 (16.6%) |
Health Insurance Coverage by Citizenship Status in Girardville borough
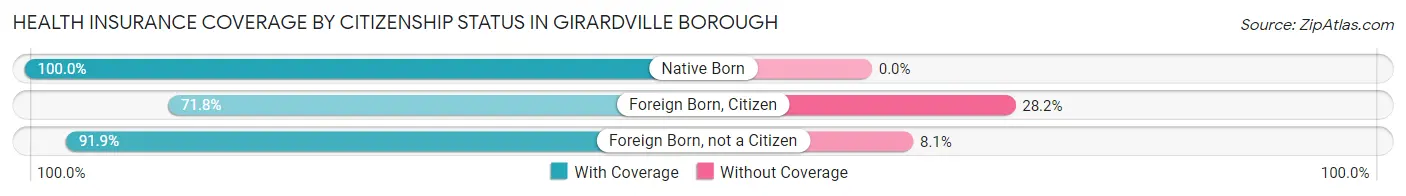
| Citizenship Status | With Coverage | Without Coverage |
| Native Born | 11 (100.0%) | 0 (0.0%) |
| Foreign Born, Citizen | 191 (71.8%) | 75 (28.2%) |
| Foreign Born, not a Citizen | 34 (91.9%) | 3 (8.1%) |
Health Insurance Coverage by Household Income in Girardville borough
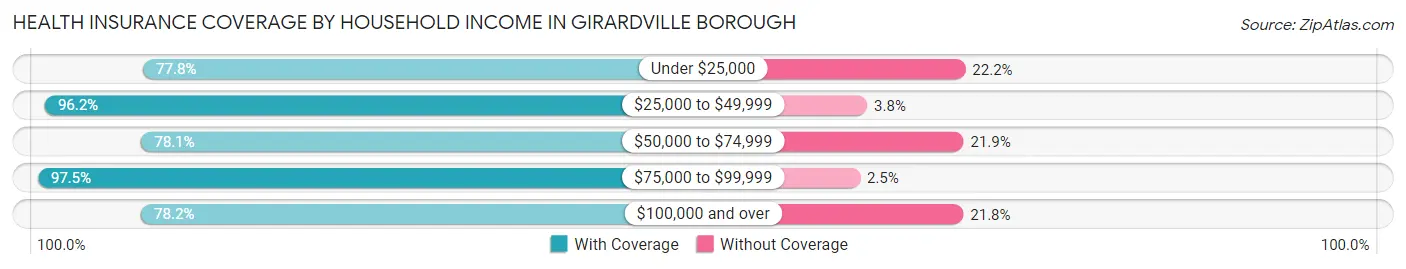
| Household Income | With Coverage | Without Coverage |
| Under $25,000 | 210 (77.8%) | 60 (22.2%) |
| $25,000 to $49,999 | 151 (96.2%) | 6 (3.8%) |
| $50,000 to $74,999 | 357 (78.1%) | 100 (21.9%) |
| $75,000 to $99,999 | 197 (97.5%) | 5 (2.5%) |
| $100,000 and over | 136 (78.2%) | 38 (21.8%) |
Public vs Private Health Insurance Coverage by Age in Girardville borough
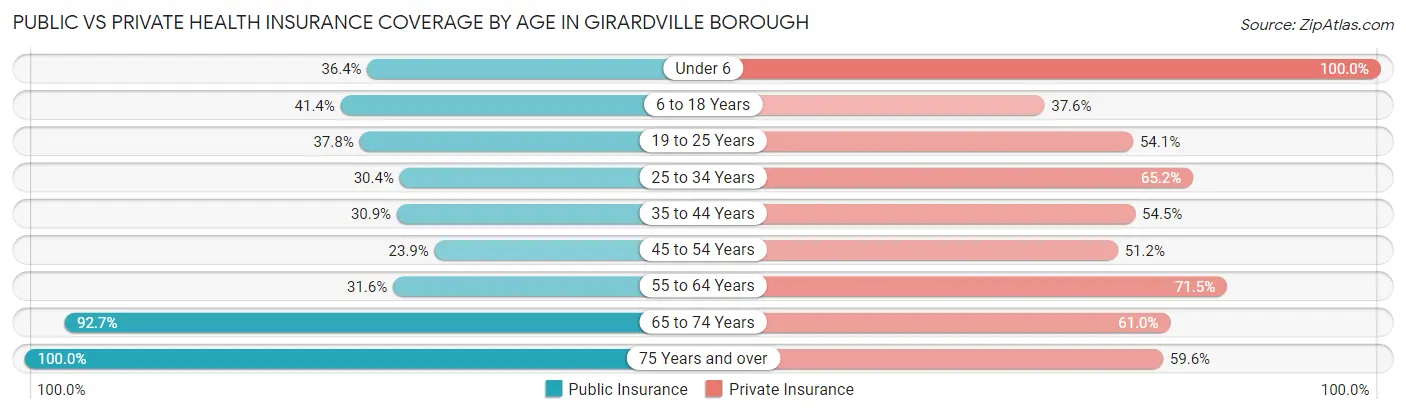
| Age Bracket | Public Insurance | Private Insurance |
| Under 6 | 4 (36.4%) | 11 (100.0%) |
| 6 to 18 Years | 110 (41.3%) | 100 (37.6%) |
| 19 to 25 Years | 14 (37.8%) | 20 (54.0%) |
| 25 to 34 Years | 41 (30.4%) | 88 (65.2%) |
| 35 to 44 Years | 59 (30.9%) | 104 (54.4%) |
| 45 to 54 Years | 49 (23.9%) | 105 (51.2%) |
| 55 to 64 Years | 61 (31.6%) | 138 (71.5%) |
| 65 to 74 Years | 114 (92.7%) | 75 (61.0%) |
| 75 Years and over | 99 (100.0%) | 59 (59.6%) |
| Total | 551 (43.7%) | 700 (55.6%) |
Disability Status by Sex by Age in Girardville borough
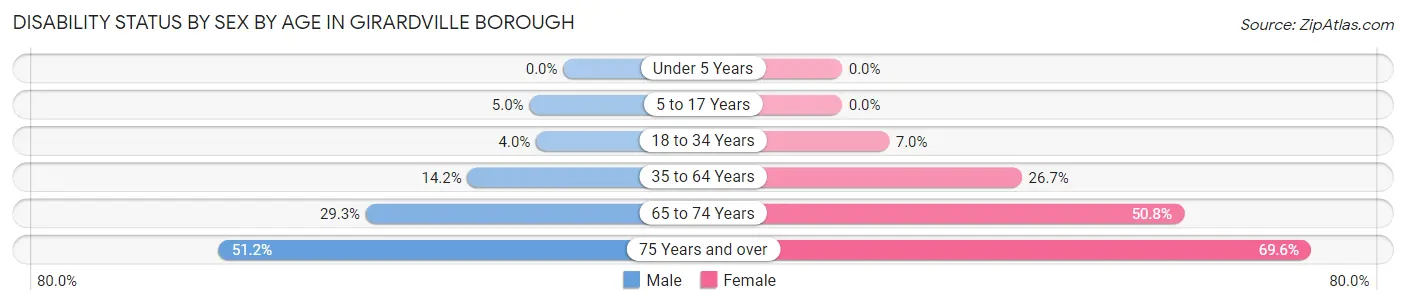
| Age Bracket | Male | Female |
| Under 5 Years | 0 (0.0%) | 0 (0.0%) |
| 5 to 17 Years | 7 (5.0%) | 0 (0.0%) |
| 18 to 34 Years | 4 (4.0%) | 6 (7.0%) |
| 35 to 64 Years | 38 (14.2%) | 86 (26.7%) |
| 65 to 74 Years | 17 (29.3%) | 33 (50.8%) |
| 75 Years and over | 22 (51.2%) | 39 (69.6%) |
Disability Class by Sex by Age in Girardville borough
Disability Class: Hearing Difficulty
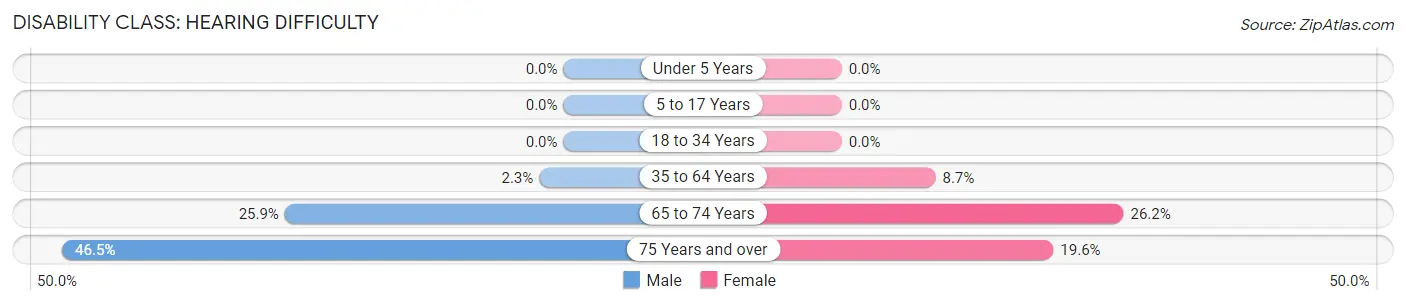
| Age Bracket | Male | Female |
| Under 5 Years | 0 (0.0%) | 0 (0.0%) |
| 5 to 17 Years | 0 (0.0%) | 0 (0.0%) |
| 18 to 34 Years | 0 (0.0%) | 0 (0.0%) |
| 35 to 64 Years | 6 (2.2%) | 28 (8.7%) |
| 65 to 74 Years | 15 (25.9%) | 17 (26.2%) |
| 75 Years and over | 20 (46.5%) | 11 (19.6%) |
Disability Class: Vision Difficulty
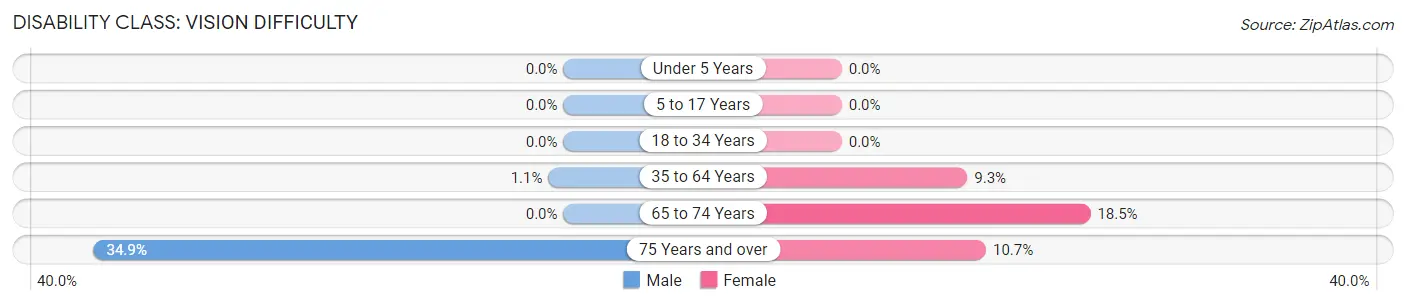
| Age Bracket | Male | Female |
| Under 5 Years | 0 (0.0%) | 0 (0.0%) |
| 5 to 17 Years | 0 (0.0%) | 0 (0.0%) |
| 18 to 34 Years | 0 (0.0%) | 0 (0.0%) |
| 35 to 64 Years | 3 (1.1%) | 30 (9.3%) |
| 65 to 74 Years | 0 (0.0%) | 12 (18.5%) |
| 75 Years and over | 15 (34.9%) | 6 (10.7%) |
Disability Class: Cognitive Difficulty
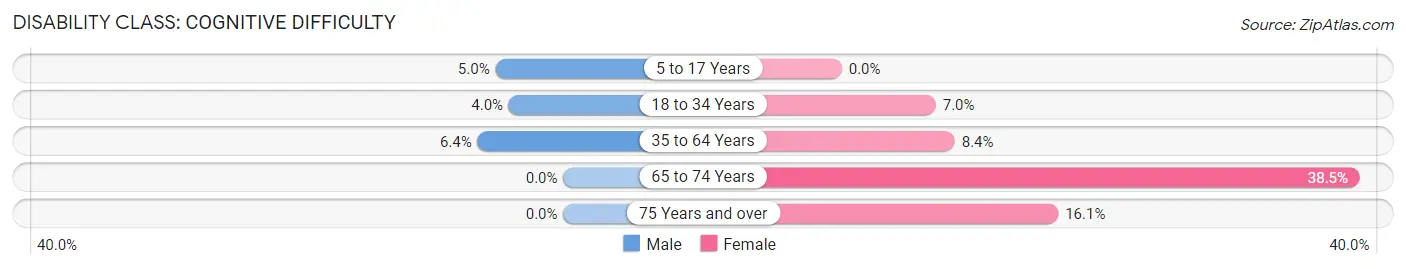
| Age Bracket | Male | Female |
| 5 to 17 Years | 7 (5.0%) | 0 (0.0%) |
| 18 to 34 Years | 4 (4.0%) | 6 (7.0%) |
| 35 to 64 Years | 17 (6.4%) | 27 (8.4%) |
| 65 to 74 Years | 0 (0.0%) | 25 (38.5%) |
| 75 Years and over | 0 (0.0%) | 9 (16.1%) |
Disability Class: Ambulatory Difficulty
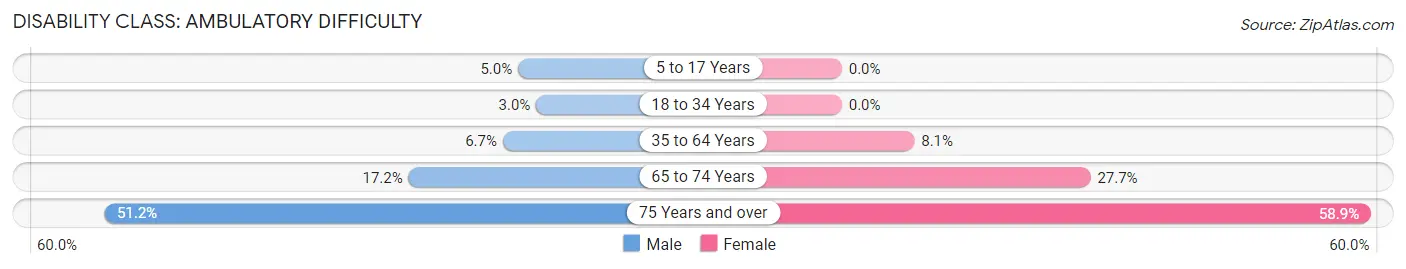
| Age Bracket | Male | Female |
| 5 to 17 Years | 7 (5.0%) | 0 (0.0%) |
| 18 to 34 Years | 3 (3.0%) | 0 (0.0%) |
| 35 to 64 Years | 18 (6.7%) | 26 (8.1%) |
| 65 to 74 Years | 10 (17.2%) | 18 (27.7%) |
| 75 Years and over | 22 (51.2%) | 33 (58.9%) |
Disability Class: Self-Care Difficulty
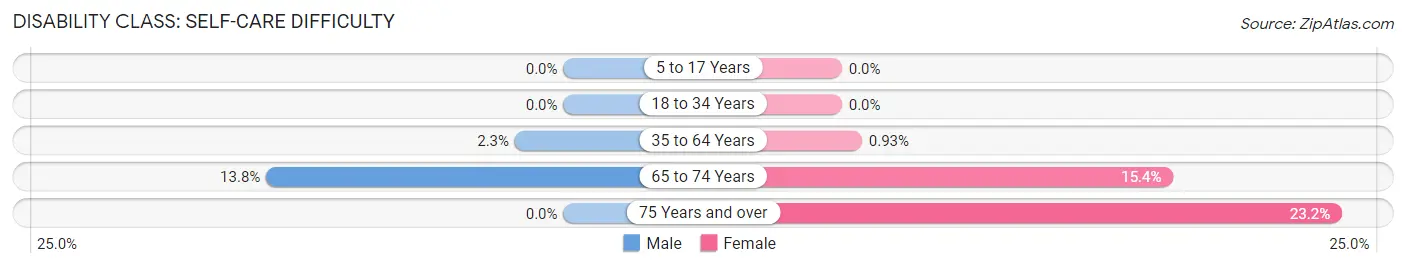
| Age Bracket | Male | Female |
| 5 to 17 Years | 0 (0.0%) | 0 (0.0%) |
| 18 to 34 Years | 0 (0.0%) | 0 (0.0%) |
| 35 to 64 Years | 6 (2.2%) | 3 (0.9%) |
| 65 to 74 Years | 8 (13.8%) | 10 (15.4%) |
| 75 Years and over | 0 (0.0%) | 13 (23.2%) |
Technology Access in Girardville borough
Computing Device Access in Girardville borough
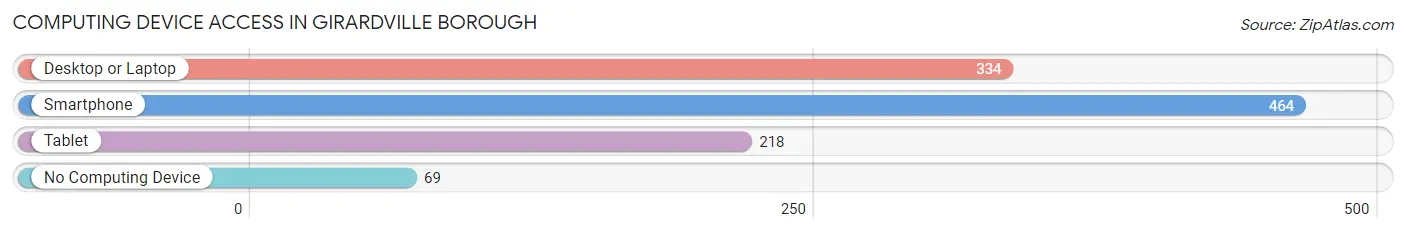
| Device Type | # Households | % Households |
| Desktop or Laptop | 334 | 57.1% |
| Smartphone | 464 | 79.3% |
| Tablet | 218 | 37.3% |
| No Computing Device | 69 | 11.8% |
| Total | 585 | 100.0% |
Internet Access in Girardville borough
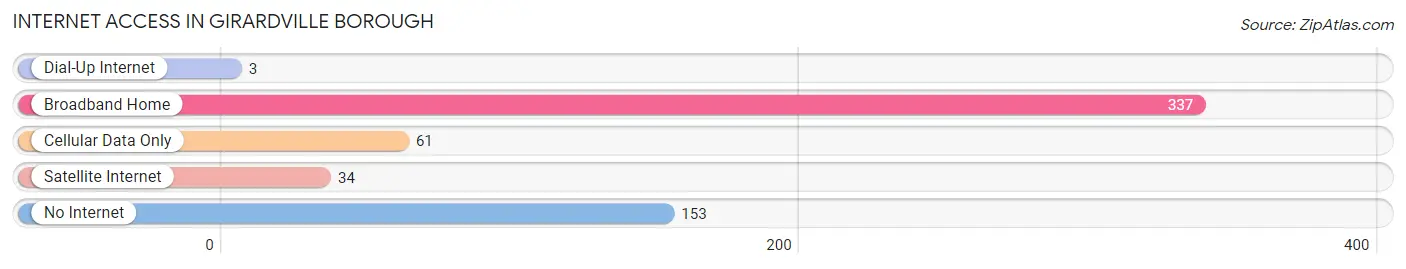
| Internet Type | # Households | % Households |
| Dial-Up Internet | 3 | 0.5% |
| Broadband Home | 337 | 57.6% |
| Cellular Data Only | 61 | 10.4% |
| Satellite Internet | 34 | 5.8% |
| No Internet | 153 | 26.2% |
| Total | 585 | 100.0% |
Girardville borough Summary
Girardville Borough is a small borough located in Schuylkill County, Pennsylvania. It is situated in the Mahanoy Valley, approximately five miles south of Mahanoy City and seven miles north of Ashland. The borough is part of the Pottsville Micropolitan Statistical Area and has a population of 1,717 as of the 2010 census.
History
Girardville was founded in 1832 by John Girard, a French-Canadian immigrant who had previously settled in the area. Girard purchased a large tract of land in the Mahanoy Valley and began to develop the area. He built a grist mill, a saw mill, a store, and a hotel, and the area quickly grew into a thriving community. Girardville was incorporated as a borough in 1851.
Girardville was a major coal mining center in the late 19th and early 20th centuries. The borough was home to several coal mines, including the Girard Colliery, the Girardville Coal Company, and the Girardville and Mahanoy Railroad. The coal industry was the primary source of employment for the borough’s residents, and the mines provided the majority of the borough’s income.
Geography
Girardville is located in the Mahanoy Valley, approximately five miles south of Mahanoy City and seven miles north of Ashland. The borough is situated in the southern part of Schuylkill County, and is bordered by Mahanoy Township to the north, East Union Township to the east, West Mahanoy Township to the south, and Mahanoy City to the west.
The borough has a total area of 0.6 square miles, all of which is land. The terrain is mostly flat, with some rolling hills in the northern part of the borough. The Mahanoy Creek runs through the borough, and there are several small ponds and streams in the area.
Economy
Girardville’s economy is largely based on the coal mining industry. The borough is home to several coal mines, including the Girard Colliery, the Girardville Coal Company, and the Girardville and Mahanoy Railroad. The coal industry is the primary source of employment for the borough’s residents, and the mines provide the majority of the borough’s income.
In addition to the coal industry, Girardville is home to several small businesses, including restaurants, retail stores, and service providers. The borough also has a small manufacturing sector, which produces a variety of products, including furniture, clothing, and textiles.
Demographics
As of the 2010 census, Girardville had a population of 1,717. The racial makeup of the borough was 97.3% White, 0.9% African American, 0.2% Native American, 0.2% Asian, 0.1% from other races, and 1.3% from two or more races. Hispanic or Latino of any race were 0.7% of the population.
The median household income in Girardville was $37,917, and the median family income was $45,000. The per capita income was $18,945. About 11.3% of the population was below the poverty line.
Common Questions
What is Per Capita Income in Girardville borough?
Per Capita income in Girardville borough is $29,557.
What is the Median Family Income in Girardville borough?
Median Family Income in Girardville borough is $57,083.
What is the Median Household income in Girardville borough?
Median Household Income in Girardville borough is $45,139.
What is Income or Wage Gap in Girardville borough?
Income or Wage Gap in Girardville borough is 54.5%.
Women in Girardville borough earn 45.5 cents for every dollar earned by a man.
What is Inequality or Gini Index in Girardville borough?
Inequality or Gini Index in Girardville borough is 0.53.
What is the Total Population of Girardville borough?
Total Population of Girardville borough is 1,260.
What is the Total Male Population of Girardville borough?
Total Male Population of Girardville borough is 610.
What is the Total Female Population of Girardville borough?
Total Female Population of Girardville borough is 650.
What is the Ratio of Males per 100 Females in Girardville borough?
There are 93.85 Males per 100 Females in Girardville borough.
What is the Ratio of Females per 100 Males in Girardville borough?
There are 106.56 Females per 100 Males in Girardville borough.
What is the Median Population Age in Girardville borough?
Median Population Age in Girardville borough is 43.7 Years.
What is the Average Family Size in Girardville borough
Average Family Size in Girardville borough is 3.0 People.
What is the Average Household Size in Girardville borough
Average Household Size in Girardville borough is 2.1 People.
How Large is the Labor Force in Girardville borough?
There are 623 People in the Labor Forcein in Girardville borough.
What is the Percentage of People in the Labor Force in Girardville borough?
60.7% of People are in the Labor Force in Girardville borough.
What is the Unemployment Rate in Girardville borough?
Unemployment Rate in Girardville borough is 8.7%.