Cities with the Highest Percentage of Immigrants from Mexico in Georgia
RELATED REPORTS & OPTIONS
Mexico
Georgia
Compare Cities
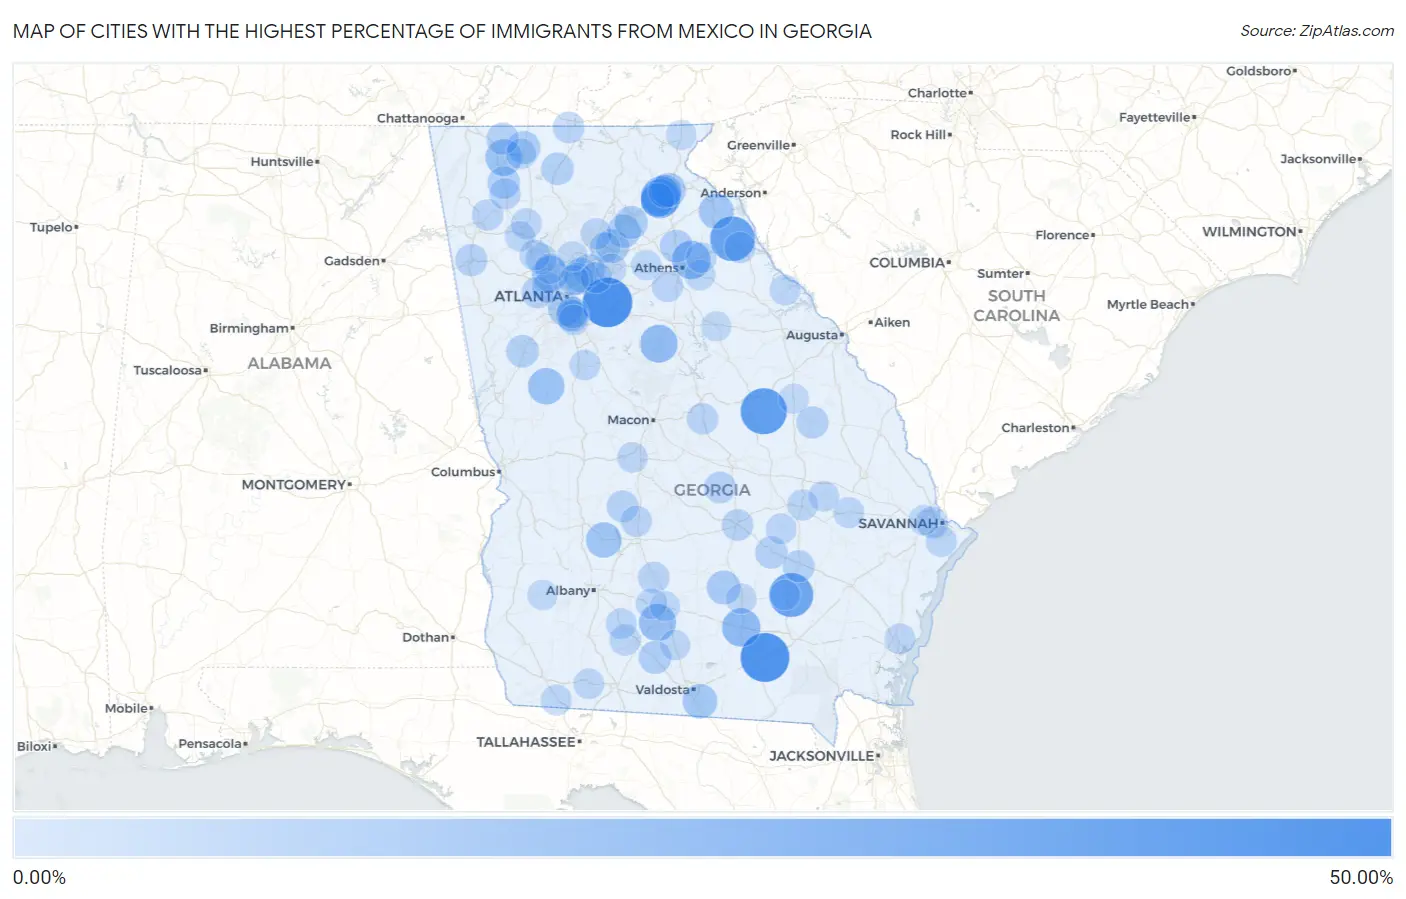
Map of Cities with the Highest Percentage of Immigrants from Mexico in Georgia
0.00%
50.00%
Cities with the Highest Percentage of Immigrants from Mexico in Georgia
| City | Mexico | vs State | vs National | |
| 1. | Lakeview Estates | 46.76% | 2.08%(+44.7)#-1 | 3.25%(+43.5)#0 |
| 2. | Argyle | 45.04% | 2.08%(+43.0)#0 | 3.25%(+41.8)#1 |
| 3. | Riddleville | 39.09% | 2.08%(+37.0)#1 | 3.25%(+35.8)#2 |
| 4. | Dewy Rose | 35.69% | 2.08%(+33.6)#2 | 3.25%(+32.4)#3 |
| 5. | Rockingham | 34.44% | 2.08%(+32.4)#3 | 3.25%(+31.2)#4 |
| 6. | Axson | 32.81% | 2.08%(+30.7)#4 | 3.25%(+29.6)#5 |
| 7. | Baldwin | 24.47% | 2.08%(+22.4)#5 | 3.25%(+21.2)#6 |
| 8. | Alto | 23.04% | 2.08%(+21.0)#6 | 3.25%(+19.8)#7 |
| 9. | Pearson | 21.47% | 2.08%(+19.4)#7 | 3.25%(+18.2)#8 |
| 10. | Hull | 21.46% | 2.08%(+19.4)#8 | 3.25%(+18.2)#9 |
| 11. | Shady Dale | 20.49% | 2.08%(+18.4)#9 | 3.25%(+17.2)#10 |
| 12. | Omega | 18.82% | 2.08%(+16.7)#10 | 3.25%(+15.6)#11 |
| 13. | Dalton | 17.52% | 2.08%(+15.4)#11 | 3.25%(+14.3)#12 |
| 14. | Gay | 17.21% | 2.08%(+15.1)#12 | 3.25%(+14.0)#13 |
| 15. | Fair Oaks | 16.20% | 2.08%(+14.1)#13 | 3.25%(+12.9)#14 |
| 16. | De Soto | 14.93% | 2.08%(+12.8)#14 | 3.25%(+11.7)#15 |
| 17. | Bowersville | 13.86% | 2.08%(+11.8)#15 | 3.25%(+10.6)#16 |
| 18. | Dasher | 13.26% | 2.08%(+11.2)#16 | 3.25%(+10.0)#17 |
| 19. | Mount Airy | 12.16% | 2.08%(+10.1)#17 | 3.25%(+8.91)#18 |
| 20. | Doraville | 11.98% | 2.08%(+9.90)#18 | 3.25%(+8.73)#19 |
| 21. | Ambrose | 11.76% | 2.08%(+9.68)#19 | 3.25%(+8.51)#20 |
| 22. | Hapeville | 11.74% | 2.08%(+9.66)#20 | 3.25%(+8.49)#21 |
| 23. | Raoul | 11.66% | 2.08%(+9.58)#21 | 3.25%(+8.41)#22 |
| 24. | Faceville | 11.26% | 2.08%(+9.17)#22 | 3.25%(+8.01)#23 |
| 25. | Buford | 10.64% | 2.08%(+8.56)#23 | 3.25%(+7.39)#24 |
| 26. | Oakwood | 10.48% | 2.08%(+8.40)#24 | 3.25%(+7.23)#25 |
| 27. | Cornelia | 10.11% | 2.08%(+8.03)#25 | 3.25%(+6.86)#26 |
| 28. | Eton | 9.97% | 2.08%(+7.89)#26 | 3.25%(+6.72)#27 |
| 29. | Gainesville | 9.86% | 2.08%(+7.78)#27 | 3.25%(+6.61)#28 |
| 30. | Berlin | 9.23% | 2.08%(+7.15)#28 | 3.25%(+5.98)#29 |
| 31. | Nicholson | 9.05% | 2.08%(+6.96)#29 | 3.25%(+5.79)#30 |
| 32. | East Newnan | 8.94% | 2.08%(+6.86)#30 | 3.25%(+5.69)#31 |
| 33. | Ellijay | 8.69% | 2.08%(+6.60)#31 | 3.25%(+5.43)#32 |
| 34. | Resaca | 8.66% | 2.08%(+6.57)#32 | 3.25%(+5.41)#33 |
| 35. | Hazlehurst | 8.12% | 2.08%(+6.04)#33 | 3.25%(+4.87)#34 |
| 36. | Varnell | 8.05% | 2.08%(+5.97)#34 | 3.25%(+4.80)#35 |
| 37. | Midville | 8.04% | 2.08%(+5.95)#35 | 3.25%(+4.79)#36 |
| 38. | Norcross | 7.93% | 2.08%(+5.85)#36 | 3.25%(+4.68)#37 |
| 39. | Chamblee | 7.82% | 2.08%(+5.73)#37 | 3.25%(+4.56)#38 |
| 40. | Cedartown | 7.58% | 2.08%(+5.50)#38 | 3.25%(+4.33)#39 |
| 41. | Baxley | 7.58% | 2.08%(+5.50)#39 | 3.25%(+4.33)#40 |
| 42. | Cadwell | 7.11% | 2.08%(+5.03)#40 | 3.25%(+3.86)#41 |
| 43. | Byromville | 7.03% | 2.08%(+4.95)#41 | 3.25%(+3.78)#42 |
| 44. | Echols County Consolidated Government | 7.01% | 2.08%(+4.93)#42 | 3.25%(+3.76)#43 |
| 45. | Lithia Springs | 6.87% | 2.08%(+4.78)#43 | 3.25%(+3.61)#44 |
| 46. | Mcrae Helena | 6.75% | 2.08%(+4.67)#44 | 3.25%(+3.50)#45 |
| 47. | Garden City | 6.72% | 2.08%(+4.64)#45 | 3.25%(+3.47)#46 |
| 48. | Lake City | 6.65% | 2.08%(+4.57)#46 | 3.25%(+3.40)#47 |
| 49. | Forest Park | 6.54% | 2.08%(+4.46)#47 | 3.25%(+3.29)#48 |
| 50. | Conley | 6.47% | 2.08%(+4.38)#48 | 3.25%(+3.21)#49 |
| 51. | Sycamore | 6.46% | 2.08%(+4.38)#49 | 3.25%(+3.21)#50 |
| 52. | Mccaysville | 6.35% | 2.08%(+4.26)#50 | 3.25%(+3.09)#51 |
| 53. | Mcintyre | 6.27% | 2.08%(+4.18)#51 | 3.25%(+3.02)#52 |
| 54. | Mableton | 6.19% | 2.08%(+4.11)#52 | 3.25%(+2.94)#53 |
| 55. | Shannon | 6.10% | 2.08%(+4.01)#53 | 3.25%(+2.84)#54 |
| 56. | Elberton | 5.96% | 2.08%(+3.88)#54 | 3.25%(+2.71)#55 |
| 57. | Calhoun | 5.95% | 2.08%(+3.86)#55 | 3.25%(+2.70)#56 |
| 58. | Vienna | 5.94% | 2.08%(+3.86)#56 | 3.25%(+2.69)#57 |
| 59. | North High Shoals | 5.93% | 2.08%(+3.85)#57 | 3.25%(+2.68)#58 |
| 60. | Lilburn | 5.90% | 2.08%(+3.82)#58 | 3.25%(+2.65)#59 |
| 61. | Cumming | 5.83% | 2.08%(+3.75)#59 | 3.25%(+2.58)#60 |
| 62. | Montgomery | 5.64% | 2.08%(+3.56)#60 | 3.25%(+2.39)#61 |
| 63. | Kennesaw | 5.61% | 2.08%(+3.53)#61 | 3.25%(+2.36)#62 |
| 64. | Lyons | 5.52% | 2.08%(+3.44)#62 | 3.25%(+2.27)#63 |
| 65. | Funston | 5.49% | 2.08%(+3.41)#63 | 3.25%(+2.24)#64 |
| 66. | White | 5.37% | 2.08%(+3.29)#64 | 3.25%(+2.12)#65 |
| 67. | Claxton | 5.32% | 2.08%(+3.24)#65 | 3.25%(+2.07)#66 |
| 68. | Doerun | 5.24% | 2.08%(+3.16)#66 | 3.25%(+1.99)#67 |
| 69. | Attapulgus | 5.17% | 2.08%(+3.09)#67 | 3.25%(+1.92)#68 |
| 70. | Ty Ty | 5.06% | 2.08%(+2.97)#68 | 3.25%(+1.81)#69 |
| 71. | Arnoldsville | 4.94% | 2.08%(+2.85)#69 | 3.25%(+1.69)#70 |
| 72. | Uvalda | 4.91% | 2.08%(+2.83)#70 | 3.25%(+1.66)#71 |
| 73. | Lincolnton | 4.90% | 2.08%(+2.82)#71 | 3.25%(+1.65)#72 |
| 74. | Cairo | 4.78% | 2.08%(+2.69)#72 | 3.25%(+1.52)#73 |
| 75. | Country Club Estates | 4.77% | 2.08%(+2.69)#73 | 3.25%(+1.52)#74 |
| 76. | Colbert | 4.66% | 2.08%(+2.58)#74 | 3.25%(+1.41)#75 |
| 77. | Cobbtown | 4.60% | 2.08%(+2.52)#75 | 3.25%(+1.35)#76 |
| 78. | Sterling | 4.57% | 2.08%(+2.49)#76 | 3.25%(+1.32)#77 |
| 79. | Chatsworth | 4.57% | 2.08%(+2.48)#77 | 3.25%(+1.31)#78 |
| 80. | East Griffin | 4.56% | 2.08%(+2.48)#78 | 3.25%(+1.31)#79 |
| 81. | Brookhaven | 4.54% | 2.08%(+2.46)#79 | 3.25%(+1.29)#80 |
| 82. | Acworth | 4.50% | 2.08%(+2.42)#80 | 3.25%(+1.25)#81 |
| 83. | Morrow | 4.48% | 2.08%(+2.40)#81 | 3.25%(+1.23)#82 |
| 84. | Fort Valley | 4.44% | 2.08%(+2.36)#82 | 3.25%(+1.19)#83 |
| 85. | Sugar Hill | 4.38% | 2.08%(+2.30)#83 | 3.25%(+1.13)#84 |
| 86. | Webster County Unified Government | 4.38% | 2.08%(+2.29)#84 | 3.25%(+1.12)#85 |
| 87. | Douglas | 4.34% | 2.08%(+2.26)#85 | 3.25%(+1.09)#86 |
| 88. | Sparks | 4.31% | 2.08%(+2.23)#86 | 3.25%(+1.06)#87 |
| 89. | Cartersville | 4.25% | 2.08%(+2.16)#87 | 3.25%(+0.994)#88 |
| 90. | Russell | 4.21% | 2.08%(+2.12)#88 | 3.25%(+0.956)#89 |
| 91. | Alma | 4.17% | 2.08%(+2.08)#89 | 3.25%(+0.914)#90 |
| 92. | Marietta | 4.15% | 2.08%(+2.07)#90 | 3.25%(+0.900)#91 |
| 93. | Lawrenceville | 4.13% | 2.08%(+2.05)#91 | 3.25%(+0.881)#92 |
| 94. | Roswell | 4.07% | 2.08%(+1.99)#92 | 3.25%(+0.817)#186 |
| 95. | Pooler | 4.00% | 2.08%(+1.91)#93 | 3.25%(+0.746)#187 |
| 96. | Louisville | 3.96% | 2.08%(+1.87)#94 | 3.25%(+0.705)#188 |
| 97. | Tifton | 3.95% | 2.08%(+1.87)#95 | 3.25%(+0.699)#189 |
| 98. | Morgan | 3.88% | 2.08%(+1.79)#96 | 3.25%(+0.624)#190 |
| 99. | Mountain City | 3.83% | 2.08%(+1.75)#97 | 3.25%(+0.583)#191 |
| 100. | Siloam | 3.79% | 2.08%(+1.70)#98 | 3.25%(+0.536)#192 |
Common Questions
What are the Top 10 Cities with the Highest Percentage of Immigrants from Mexico in Georgia?
Top 10 Cities with the Highest Percentage of Immigrants from Mexico in Georgia are:
#1
46.76%
#2
45.04%
#3
39.09%
#4
35.69%
#5
34.44%
#6
24.47%
#7
23.04%
#8
21.47%
#9
21.46%
#10
20.49%
What city has the Highest Percentage of Immigrants from Mexico in Georgia?
Lakeview Estates has the Highest Percentage of Immigrants from Mexico in Georgia with 46.76%.
What is the Percentage of Immigrants from Mexico in the State of Georgia?
Percentage of Immigrants from Mexico in Georgia is 2.08%.
What is the Percentage of Immigrants from Mexico in the United States?
Percentage of Immigrants from Mexico in the United States is 3.25%.