Salladasburg borough, PA Map & Demographics
Salladasburg borough Overview
$30,095
PER CAPITA INCOME
$73,438
AVG FAMILY INCOME
$72,656
AVG HOUSEHOLD INCOME
30.5%
WAGE / INCOME GAP [ % ]
69.5¢/ $1
WAGE / INCOME GAP [ $ ]
0.29
INEQUALITY / GINI INDEX
176
TOTAL POPULATION
93
MALE POPULATION
83
FEMALE POPULATION
112.05
MALES / 100 FEMALES
89.25
FEMALES / 100 MALES
34.7
MEDIAN AGE
2.7
AVG FAMILY SIZE
2.3
AVG HOUSEHOLD SIZE
106
LABOR FORCE [ PEOPLE ]
76.3%
PERCENT IN LABOR FORCE
10.4%
UNEMPLOYMENT RATE
Income in Salladasburg borough
Income Overview in Salladasburg borough
Per Capita Income in Salladasburg borough is $30,095, while median incomes of families and households are $73,438 and $72,656 respectively.
| Characteristic | Number | Measure |
| Per Capita Income | 176 | $30,095 |
| Median Family Income | 50 | $73,438 |
| Mean Family Income | 50 | $71,776 |
| Median Household Income | 77 | $72,656 |
| Mean Household Income | 77 | $67,470 |
| Income Deficit | 50 | $0 |
| Wage / Income Gap (%) | 176 | 30.48% |
| Wage / Income Gap ($) | 176 | 69.52¢ per $1 |
| Gini / Inequality Index | 176 | 0.29 |
Earnings by Sex in Salladasburg borough
Average Earnings in Salladasburg borough are $39,904, $55,139 for men and $38,333 for women, a difference of 30.5%.
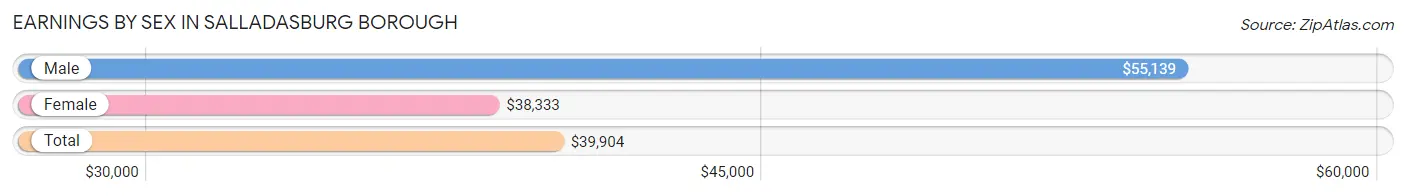
| Sex | Number | Average Earnings |
| Male | 57 (56.4%) | $55,139 |
| Female | 44 (43.6%) | $38,333 |
| Total | 101 (100.0%) | $39,904 |
Earnings by Sex by Income Bracket in Salladasburg borough
The most common earnings brackets in Salladasburg borough are $55,000 to $64,999 for men (17 | 29.8%) and $35,000 to $39,999 for women (12 | 27.3%).
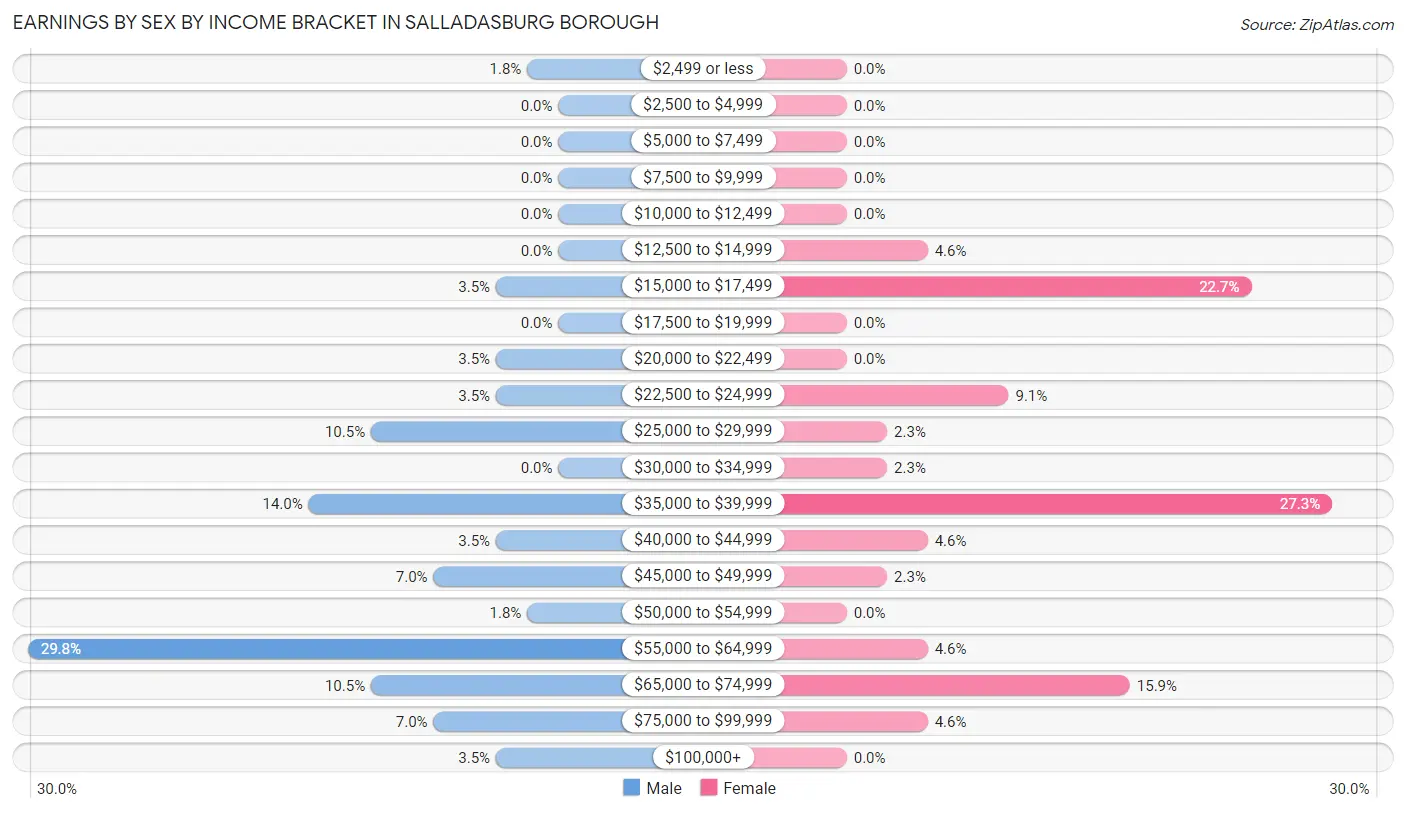
| Income | Male | Female |
| $2,499 or less | 1 (1.8%) | 0 (0.0%) |
| $2,500 to $4,999 | 0 (0.0%) | 0 (0.0%) |
| $5,000 to $7,499 | 0 (0.0%) | 0 (0.0%) |
| $7,500 to $9,999 | 0 (0.0%) | 0 (0.0%) |
| $10,000 to $12,499 | 0 (0.0%) | 0 (0.0%) |
| $12,500 to $14,999 | 0 (0.0%) | 2 (4.5%) |
| $15,000 to $17,499 | 2 (3.5%) | 10 (22.7%) |
| $17,500 to $19,999 | 0 (0.0%) | 0 (0.0%) |
| $20,000 to $22,499 | 2 (3.5%) | 0 (0.0%) |
| $22,500 to $24,999 | 2 (3.5%) | 4 (9.1%) |
| $25,000 to $29,999 | 6 (10.5%) | 1 (2.3%) |
| $30,000 to $34,999 | 0 (0.0%) | 1 (2.3%) |
| $35,000 to $39,999 | 8 (14.0%) | 12 (27.3%) |
| $40,000 to $44,999 | 2 (3.5%) | 2 (4.5%) |
| $45,000 to $49,999 | 4 (7.0%) | 1 (2.3%) |
| $50,000 to $54,999 | 1 (1.8%) | 0 (0.0%) |
| $55,000 to $64,999 | 17 (29.8%) | 2 (4.5%) |
| $65,000 to $74,999 | 6 (10.5%) | 7 (15.9%) |
| $75,000 to $99,999 | 4 (7.0%) | 2 (4.5%) |
| $100,000+ | 2 (3.5%) | 0 (0.0%) |
| Total | 57 (100.0%) | 44 (100.0%) |
Earnings by Sex by Educational Attainment in Salladasburg borough
Average earnings in Salladasburg borough are $55,417 for men and $37,708 for women, a difference of 32.0%. Men with an educational attainment of college or associate's degree enjoy the highest average annual earnings of $60,357, while those with high school diploma education earn the least with $55,625. Women with an educational attainment of college or associate's degree earn the most with the average annual earnings of $39,375, while those with high school diploma education have the smallest earnings of $16,944.
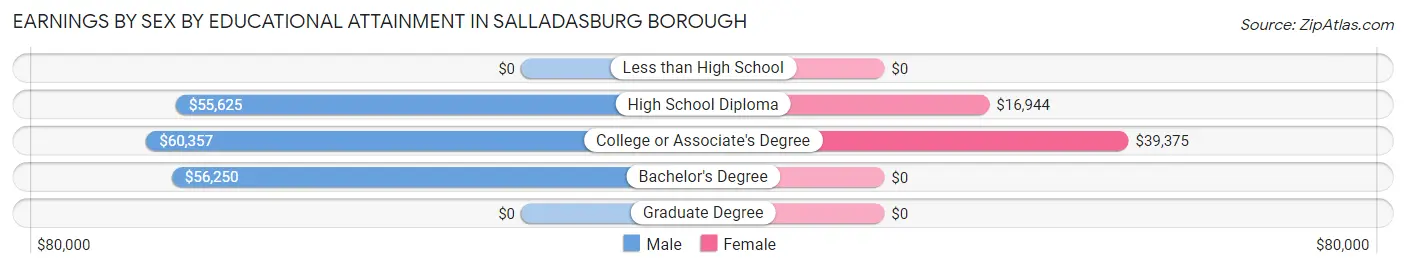
| Educational Attainment | Male Income | Female Income |
| Less than High School | - | - |
| High School Diploma | $55,625 | $16,944 |
| College or Associate's Degree | $60,357 | $39,375 |
| Bachelor's Degree | $56,250 | $0 |
| Graduate Degree | - | - |
| Total | $55,417 | $37,708 |
Family Income in Salladasburg borough
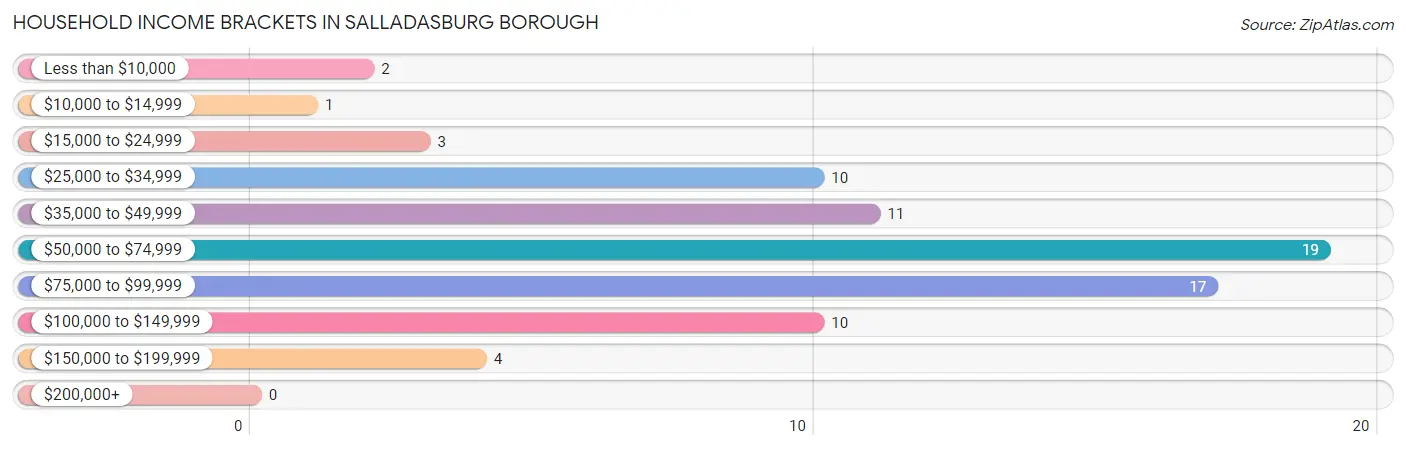
Family Income Brackets in Salladasburg borough
According to the Salladasburg borough family income data, there are 16 families falling into the $50,000 to $74,999 income range, which is the most common income bracket and makes up 32.0% of all families.
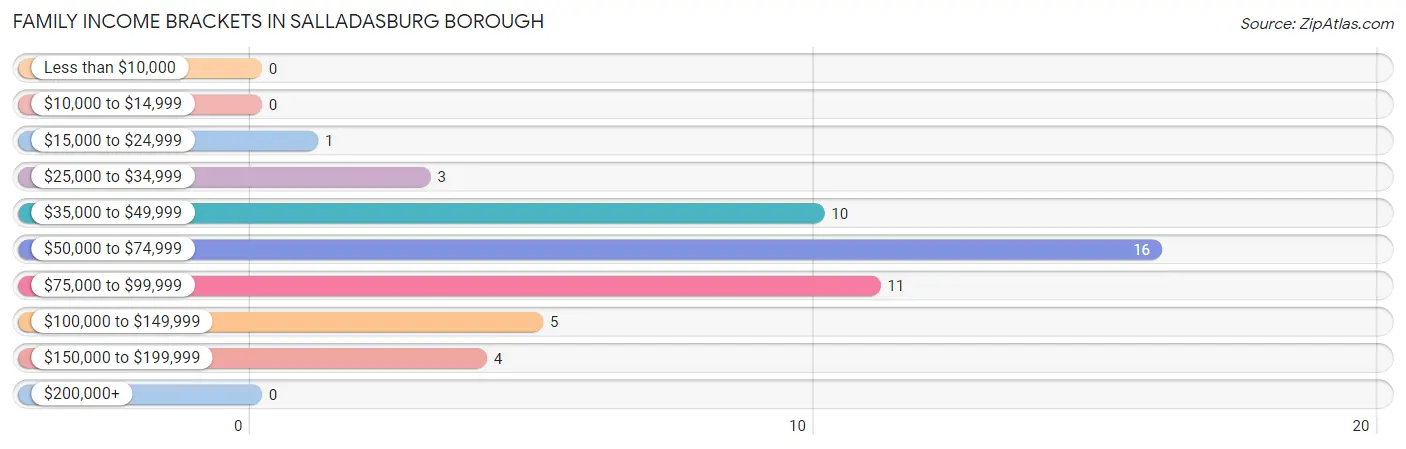
| Income Bracket | # Families | % Families |
| Less than $10,000 | 0 | 0.0% |
| $10,000 to $14,999 | 0 | 0.0% |
| $15,000 to $24,999 | 1 | 2.0% |
| $25,000 to $34,999 | 3 | 6.0% |
| $35,000 to $49,999 | 10 | 20.0% |
| $50,000 to $74,999 | 16 | 32.0% |
| $75,000 to $99,999 | 11 | 22.0% |
| $100,000 to $149,999 | 5 | 10.0% |
| $150,000 to $199,999 | 4 | 8.0% |
| $200,000+ | 0 | 0.0% |
Family Income by Famaliy Size in Salladasburg borough
4-person families (7 | 14.0%) account for the highest median family income in Salladasburg borough with $86,250 per family, while 2-person families (24 | 48.0%) have the highest median income of $25,625 per family member.
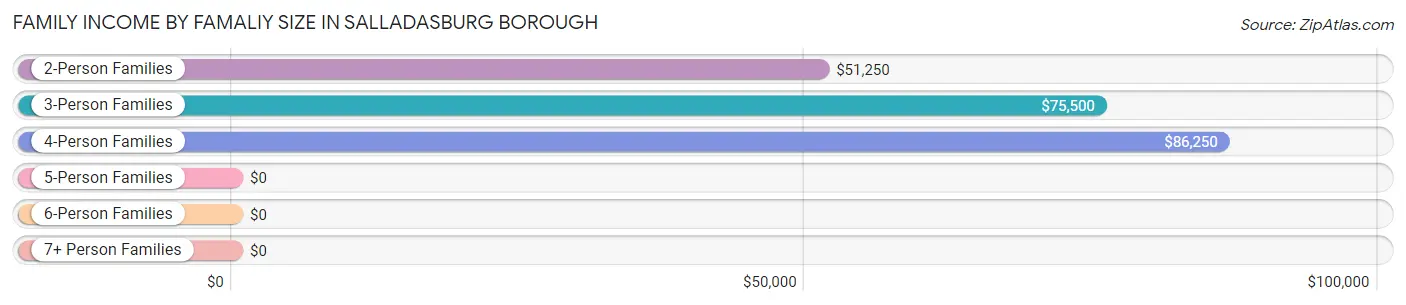
| Income Bracket | # Families | Median Income |
| 2-Person Families | 24 (48.0%) | $51,250 |
| 3-Person Families | 14 (28.0%) | $75,500 |
| 4-Person Families | 7 (14.0%) | $86,250 |
| 5-Person Families | 3 (6.0%) | $0 |
| 6-Person Families | 2 (4.0%) | $0 |
| 7+ Person Families | 0 (0.0%) | $0 |
| Total | 50 (100.0%) | $73,438 |
Family Income by Number of Earners in Salladasburg borough
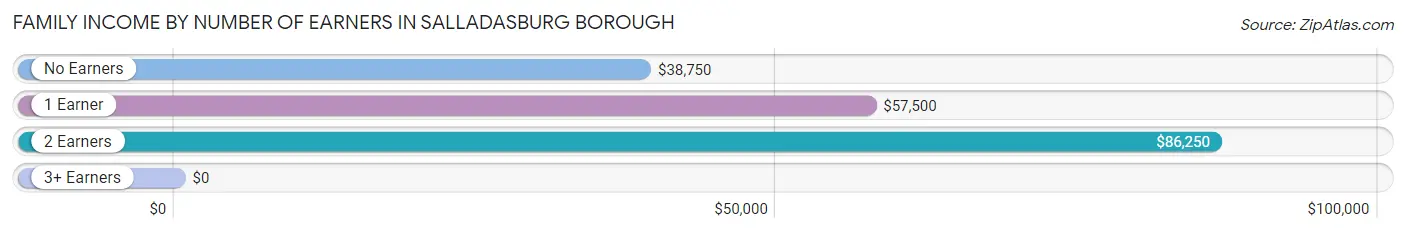
| Number of Earners | # Families | Median Income |
| No Earners | 3 (6.0%) | $38,750 |
| 1 Earner | 28 (56.0%) | $57,500 |
| 2 Earners | 17 (34.0%) | $86,250 |
| 3+ Earners | 2 (4.0%) | $0 |
| Total | 50 (100.0%) | $73,438 |
Household Income in Salladasburg borough
Household Income Brackets in Salladasburg borough
With 19 households falling in the category, the $50,000 to $74,999 income range is the most frequent in Salladasburg borough, accounting for 24.7% of all households.
| Income Bracket | # Households | % Households |
| Less than $10,000 | 2 | 2.6% |
| $10,000 to $14,999 | 1 | 1.3% |
| $15,000 to $24,999 | 3 | 3.9% |
| $25,000 to $34,999 | 10 | 13.0% |
| $35,000 to $49,999 | 11 | 14.3% |
| $50,000 to $74,999 | 19 | 24.7% |
| $75,000 to $99,999 | 17 | 22.1% |
| $100,000 to $149,999 | 10 | 13.0% |
| $150,000 to $199,999 | 4 | 5.2% |
| $200,000+ | 0 | 0.0% |
Household Income by Householder Age in Salladasburg borough
The median household income in Salladasburg borough is $72,656, with the highest median household income of $76,042 found in the 25 to 44 years age bracket for the primary householder. A total of 39 households (50.6%) fall into this category.
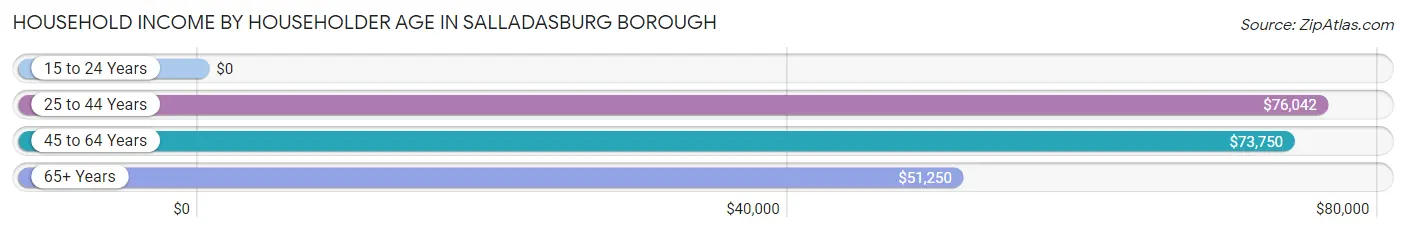
| Income Bracket | # Households | Median Income |
| 15 to 24 Years | 0 (0.0%) | $0 |
| 25 to 44 Years | 39 (50.6%) | $76,042 |
| 45 to 64 Years | 20 (26.0%) | $73,750 |
| 65+ Years | 18 (23.4%) | $51,250 |
| Total | 77 (100.0%) | $72,656 |
Poverty in Salladasburg borough
Income Below Poverty by Sex and Age in Salladasburg borough
With 3.2% poverty level for males and 10.8% for females among the residents of Salladasburg borough, 35 to 44 year old males and 15 year old females are the most vulnerable to poverty, with 2 males (14.3%) and 1 females (100.0%) in their respective age groups living below the poverty level.
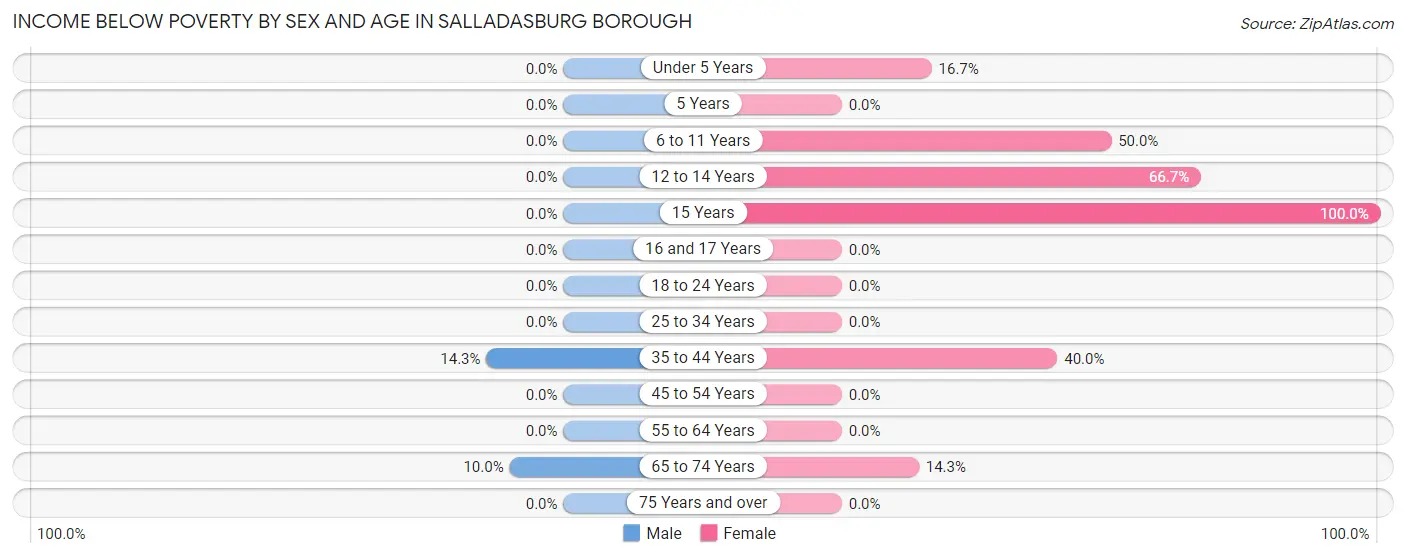
| Age Bracket | Male | Female |
| Under 5 Years | 0 (0.0%) | 1 (16.7%) |
| 5 Years | 0 (0.0%) | 0 (0.0%) |
| 6 to 11 Years | 0 (0.0%) | 2 (50.0%) |
| 12 to 14 Years | 0 (0.0%) | 2 (66.7%) |
| 15 Years | 0 (0.0%) | 1 (100.0%) |
| 16 and 17 Years | 0 (0.0%) | 0 (0.0%) |
| 18 to 24 Years | 0 (0.0%) | 0 (0.0%) |
| 25 to 34 Years | 0 (0.0%) | 0 (0.0%) |
| 35 to 44 Years | 2 (14.3%) | 2 (40.0%) |
| 45 to 54 Years | 0 (0.0%) | 0 (0.0%) |
| 55 to 64 Years | 0 (0.0%) | 0 (0.0%) |
| 65 to 74 Years | 1 (10.0%) | 1 (14.3%) |
| 75 Years and over | 0 (0.0%) | 0 (0.0%) |
| Total | 3 (3.2%) | 9 (10.8%) |
Income Above Poverty by Sex and Age in Salladasburg borough
According to the poverty statistics in Salladasburg borough, males aged under 5 years and females aged 5 years are the age groups that are most secure financially, with 100.0% of males and 100.0% of females in these age groups living above the poverty line.
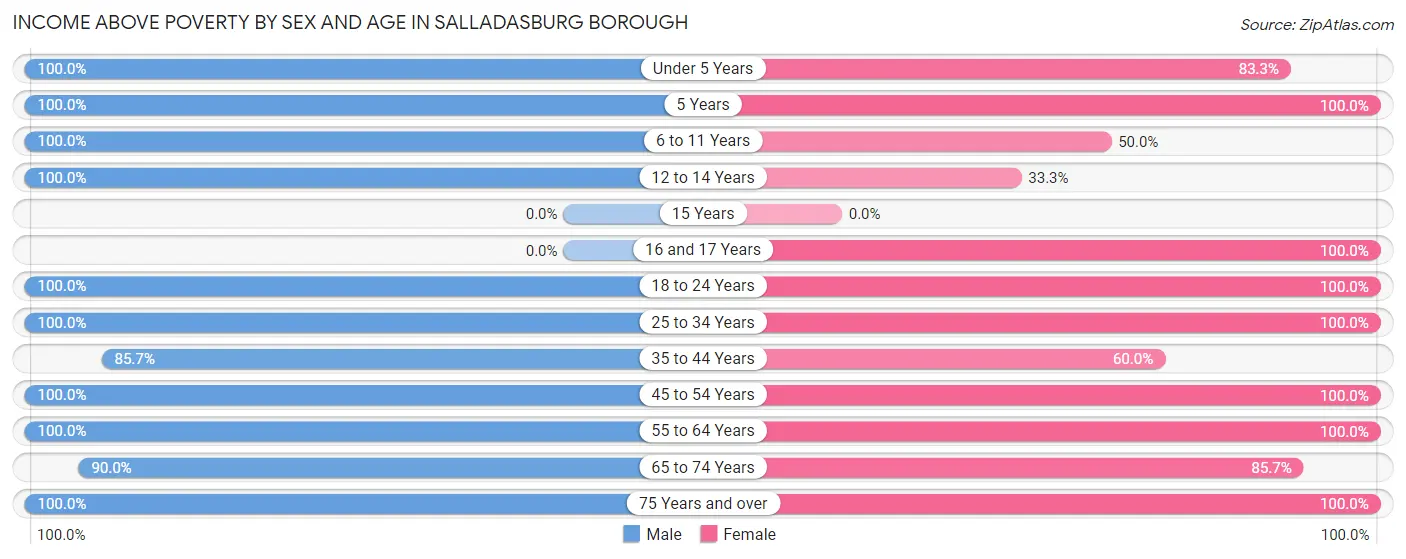
| Age Bracket | Male | Female |
| Under 5 Years | 9 (100.0%) | 5 (83.3%) |
| 5 Years | 3 (100.0%) | 5 (100.0%) |
| 6 to 11 Years | 3 (100.0%) | 2 (50.0%) |
| 12 to 14 Years | 3 (100.0%) | 1 (33.3%) |
| 15 Years | 0 (0.0%) | 0 (0.0%) |
| 16 and 17 Years | 0 (0.0%) | 4 (100.0%) |
| 18 to 24 Years | 2 (100.0%) | 8 (100.0%) |
| 25 to 34 Years | 30 (100.0%) | 12 (100.0%) |
| 35 to 44 Years | 12 (85.7%) | 3 (60.0%) |
| 45 to 54 Years | 9 (100.0%) | 12 (100.0%) |
| 55 to 64 Years | 7 (100.0%) | 12 (100.0%) |
| 65 to 74 Years | 9 (90.0%) | 6 (85.7%) |
| 75 Years and over | 3 (100.0%) | 4 (100.0%) |
| Total | 90 (96.8%) | 74 (89.2%) |
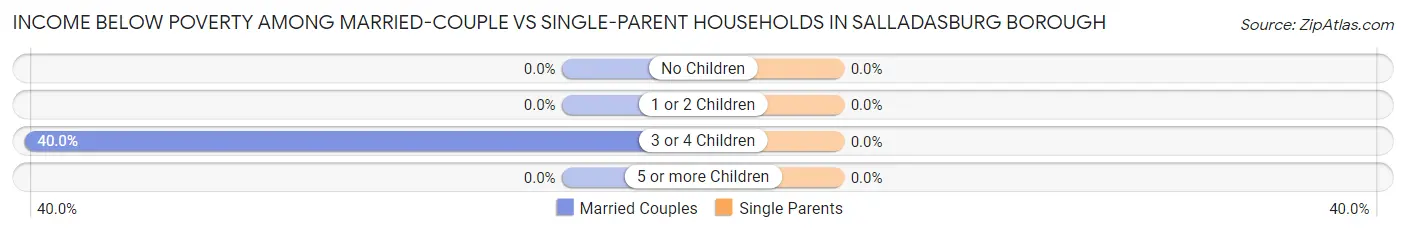
Income Below Poverty Among Married-Couple Families in Salladasburg borough
The poverty statistics for married-couple families in Salladasburg borough show that 5.6% or 2 of the total 36 families live below the poverty line. Families with 3 or 4 children have the highest poverty rate of 40.0%, comprising of 2 families. On the other hand, families with no children have the lowest poverty rate of 0.0%, which includes 0 families.
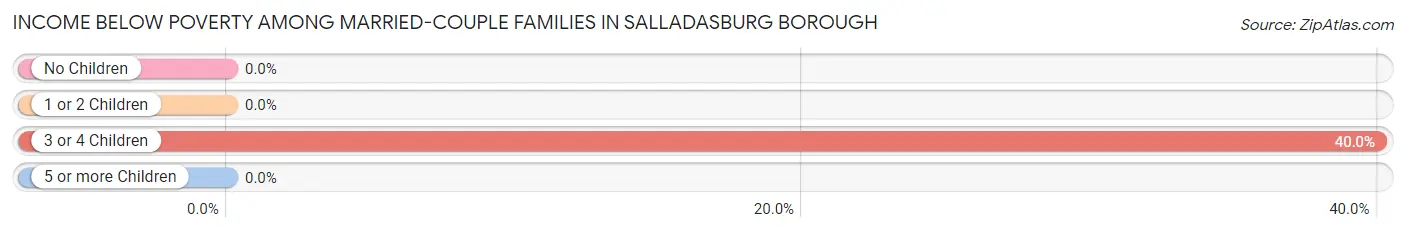
| Children | Above Poverty | Below Poverty |
| No Children | 18 (100.0%) | 0 (0.0%) |
| 1 or 2 Children | 13 (100.0%) | 0 (0.0%) |
| 3 or 4 Children | 3 (60.0%) | 2 (40.0%) |
| 5 or more Children | 0 (0.0%) | 0 (0.0%) |
| Total | 34 (94.4%) | 2 (5.6%) |
Income Below Poverty Among Single-Parent Households in Salladasburg borough
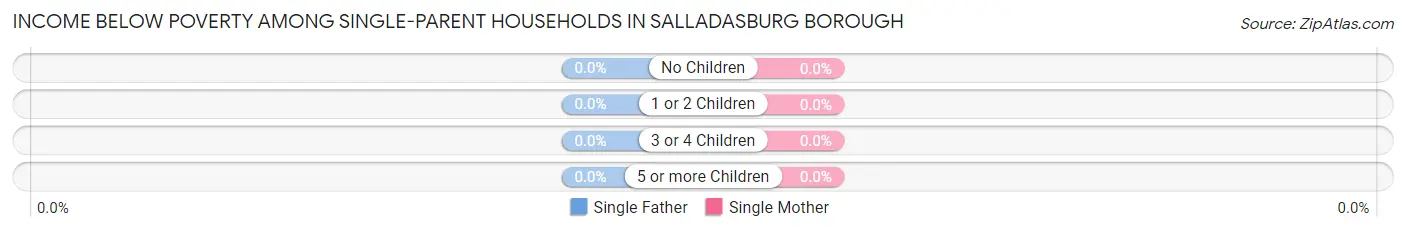
| Children | Single Father | Single Mother |
| No Children | 0 (0.0%) | 0 (0.0%) |
| 1 or 2 Children | 0 (0.0%) | 0 (0.0%) |
| 3 or 4 Children | 0 (0.0%) | 0 (0.0%) |
| 5 or more Children | 0 (0.0%) | 0 (0.0%) |
| Total | 0 (0.0%) | 0 (0.0%) |
Income Below Poverty Among Married-Couple vs Single-Parent Households in Salladasburg borough
| Children | Married-Couple Families | Single-Parent Households |
| No Children | 0 (0.0%) | 0 (0.0%) |
| 1 or 2 Children | 0 (0.0%) | 0 (0.0%) |
| 3 or 4 Children | 2 (40.0%) | 0 (0.0%) |
| 5 or more Children | 0 (0.0%) | 0 (0.0%) |
| Total | 2 (5.6%) | 0 (0.0%) |
Race in Salladasburg borough
The most populous races in Salladasburg borough are White / Caucasian (175 | 99.4%), and Asian (1 | 0.6%).
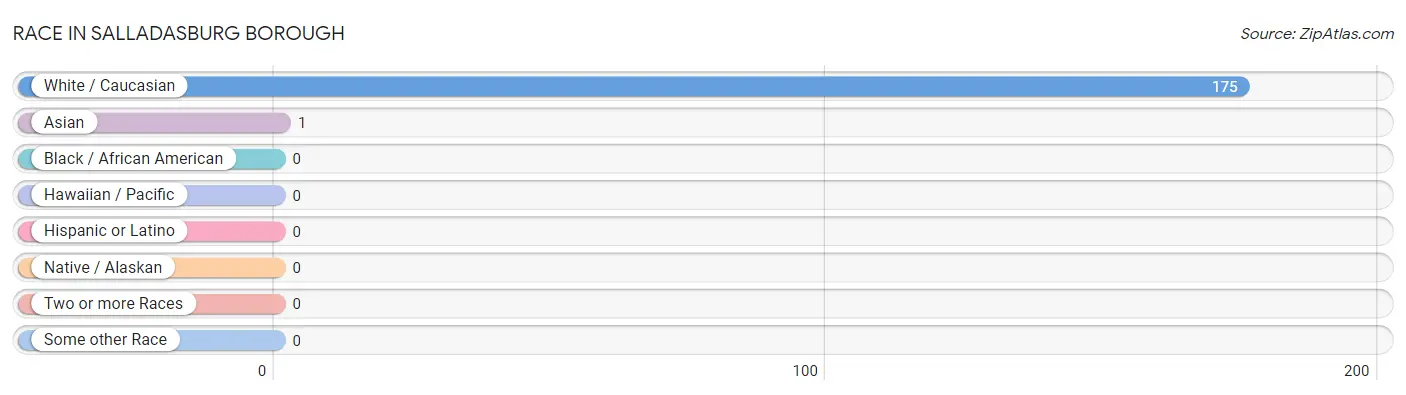
| Race | # Population | % Population |
| Asian | 1 | 0.6% |
| Black / African American | 0 | 0.0% |
| Hawaiian / Pacific | 0 | 0.0% |
| Hispanic or Latino | 0 | 0.0% |
| Native / Alaskan | 0 | 0.0% |
| White / Caucasian | 175 | 99.4% |
| Two or more Races | 0 | 0.0% |
| Some other Race | 0 | 0.0% |
| Total | 176 | 100.0% |
Ancestry in Salladasburg borough
The most populous ancestries reported in Salladasburg borough are German (57 | 32.4%), Italian (17 | 9.7%), Irish (14 | 8.0%), English (11 | 6.2%), and American (10 | 5.7%), together accounting for 61.9% of all Salladasburg borough residents.
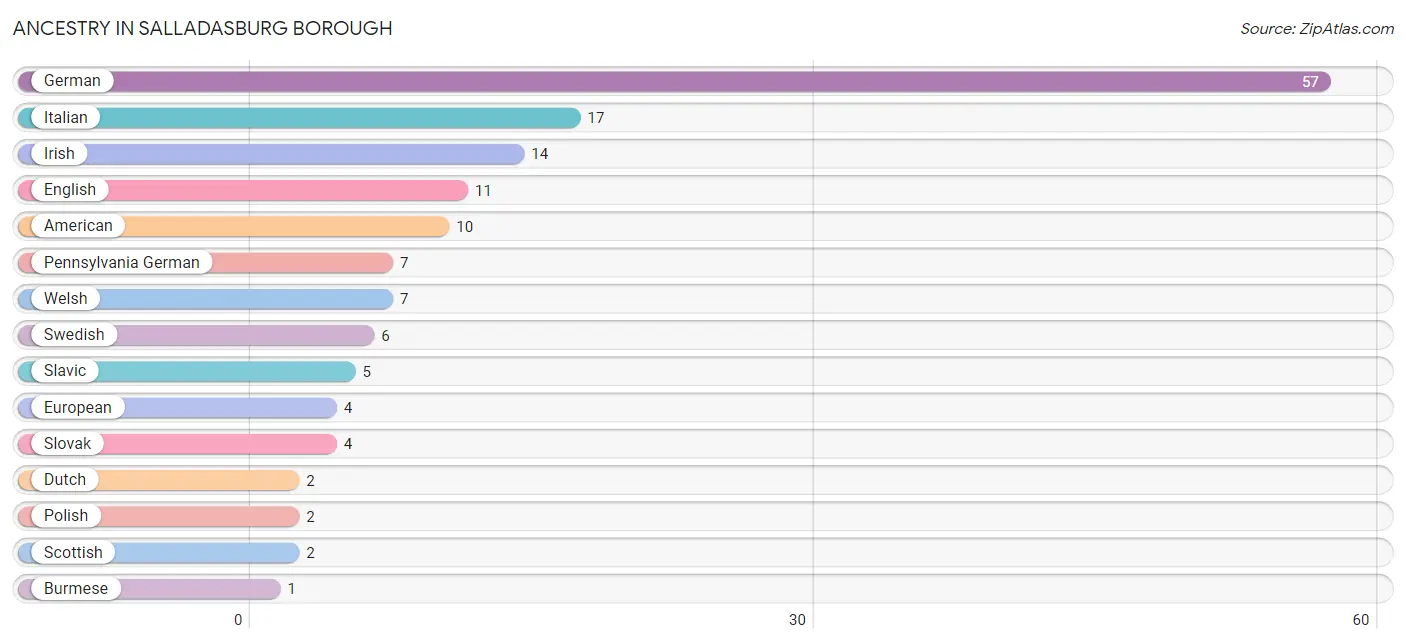
| Ancestry | # Population | % Population |
| American | 10 | 5.7% |
| Burmese | 1 | 0.6% |
| Dutch | 2 | 1.1% |
| English | 11 | 6.2% |
| European | 4 | 2.3% |
| German | 57 | 32.4% |
| Irish | 14 | 8.0% |
| Italian | 17 | 9.7% |
| Pennsylvania German | 7 | 4.0% |
| Polish | 2 | 1.1% |
| Scotch-Irish | 1 | 0.6% |
| Scottish | 2 | 1.1% |
| Slavic | 5 | 2.8% |
| Slovak | 4 | 2.3% |
| Swedish | 6 | 3.4% |
| Welsh | 7 | 4.0% | View All 16 Rows |
Immigrants in Salladasburg borough
The most numerous immigrant groups reported in Salladasburg borough came from Asia (1 | 0.6%), Eastern Asia (1 | 0.6%), Europe (1 | 0.6%), Germany (1 | 0.6%), and Korea (1 | 0.6%), together accounting for 2.9% of all Salladasburg borough residents.
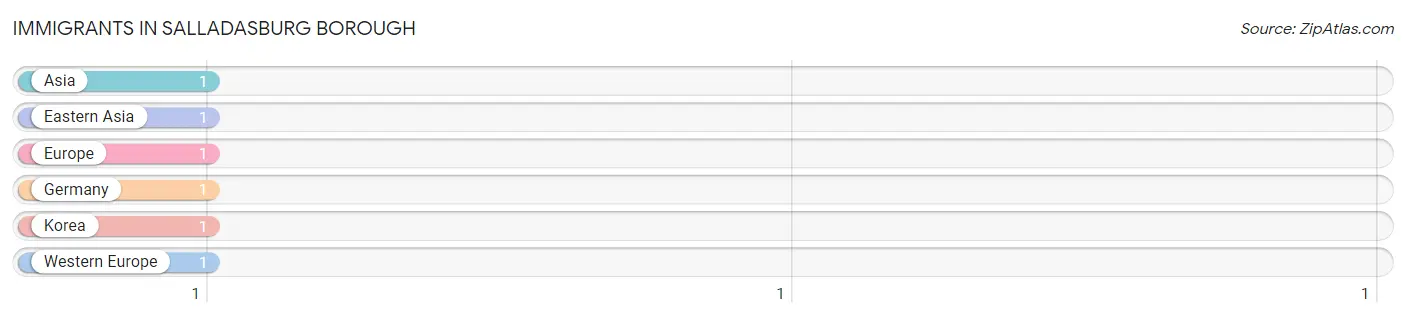
| Immigration Origin | # Population | % Population |
| Asia | 1 | 0.6% |
| Eastern Asia | 1 | 0.6% |
| Europe | 1 | 0.6% |
| Germany | 1 | 0.6% |
| Korea | 1 | 0.6% |
| Western Europe | 1 | 0.6% | View All 6 Rows |
Sex and Age in Salladasburg borough
Sex and Age in Salladasburg borough
The most populous age groups in Salladasburg borough are 30 to 34 Years (27 | 29.0%) for men and 55 to 59 Years (11 | 13.3%) for women.
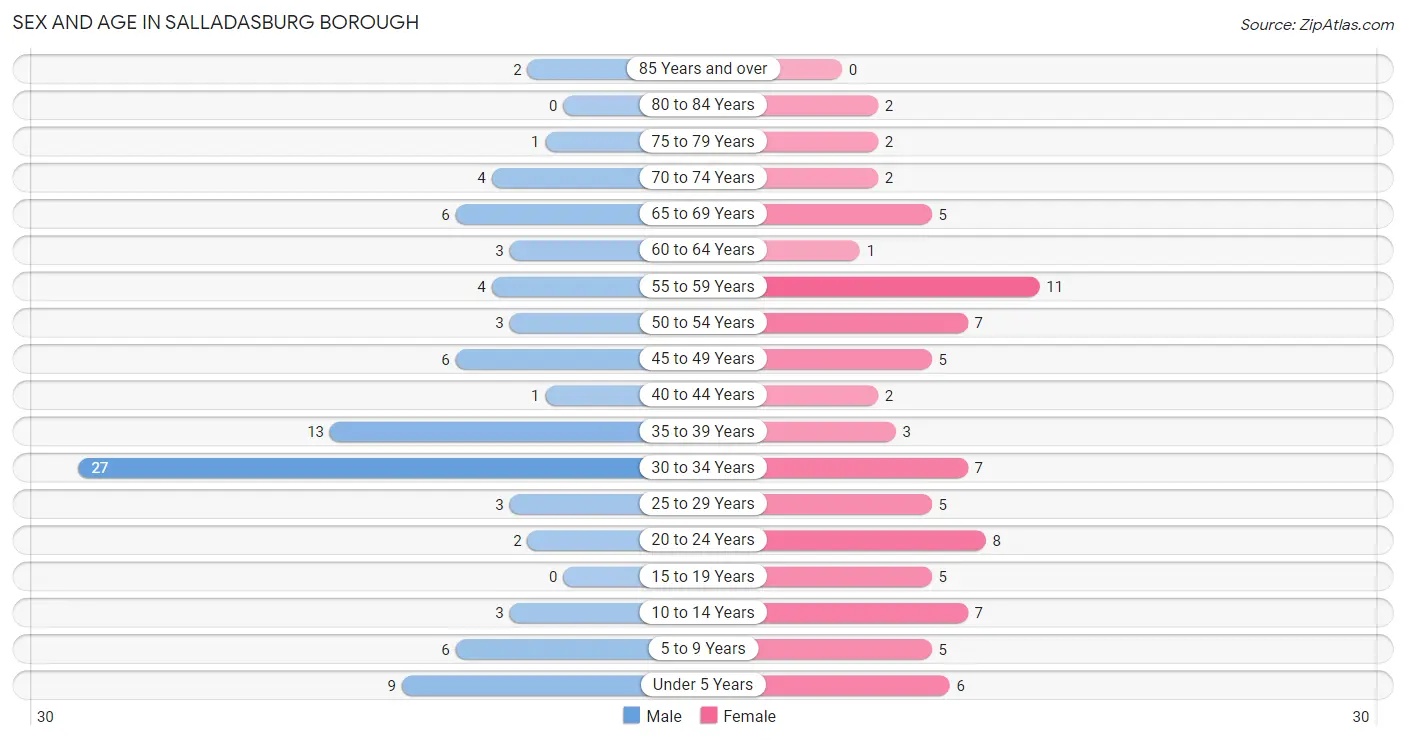
| Age Bracket | Male | Female |
| Under 5 Years | 9 (9.7%) | 6 (7.2%) |
| 5 to 9 Years | 6 (6.5%) | 5 (6.0%) |
| 10 to 14 Years | 3 (3.2%) | 7 (8.4%) |
| 15 to 19 Years | 0 (0.0%) | 5 (6.0%) |
| 20 to 24 Years | 2 (2.1%) | 8 (9.6%) |
| 25 to 29 Years | 3 (3.2%) | 5 (6.0%) |
| 30 to 34 Years | 27 (29.0%) | 7 (8.4%) |
| 35 to 39 Years | 13 (14.0%) | 3 (3.6%) |
| 40 to 44 Years | 1 (1.1%) | 2 (2.4%) |
| 45 to 49 Years | 6 (6.5%) | 5 (6.0%) |
| 50 to 54 Years | 3 (3.2%) | 7 (8.4%) |
| 55 to 59 Years | 4 (4.3%) | 11 (13.3%) |
| 60 to 64 Years | 3 (3.2%) | 1 (1.2%) |
| 65 to 69 Years | 6 (6.5%) | 5 (6.0%) |
| 70 to 74 Years | 4 (4.3%) | 2 (2.4%) |
| 75 to 79 Years | 1 (1.1%) | 2 (2.4%) |
| 80 to 84 Years | 0 (0.0%) | 2 (2.4%) |
| 85 Years and over | 2 (2.1%) | 0 (0.0%) |
| Total | 93 (100.0%) | 83 (100.0%) |
Families and Households in Salladasburg borough
Median Family Size in Salladasburg borough
The median family size in Salladasburg borough is 2.72 persons per family, with married-couple families (36 | 72.0%) accounting for the largest median family size of 3 persons per family. On the other hand, single male/father families (13 | 26.0%) represent the smallest median family size with 1.92 persons per family.
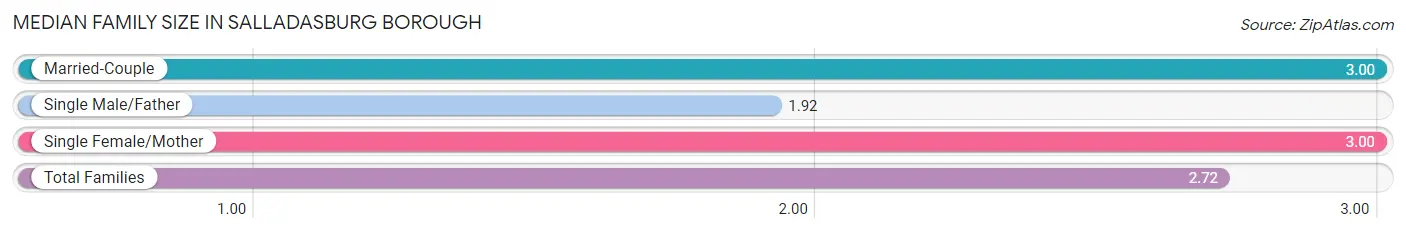
| Family Type | # Families | Family Size |
| Married-Couple | 36 (72.0%) | 3.00 |
| Single Male/Father | 13 (26.0%) | 1.92 |
| Single Female/Mother | 1 (2.0%) | 3.00 |
| Total Families | 50 (100.0%) | 2.72 |
Median Household Size in Salladasburg borough
The median household size in Salladasburg borough is 2.29 persons per household, with married-couple households (36 | 46.8%) accounting for the largest median household size of 3 persons per household. non-family households (27 | 35.1%) represent the smallest median household size with 1.26 persons per household.
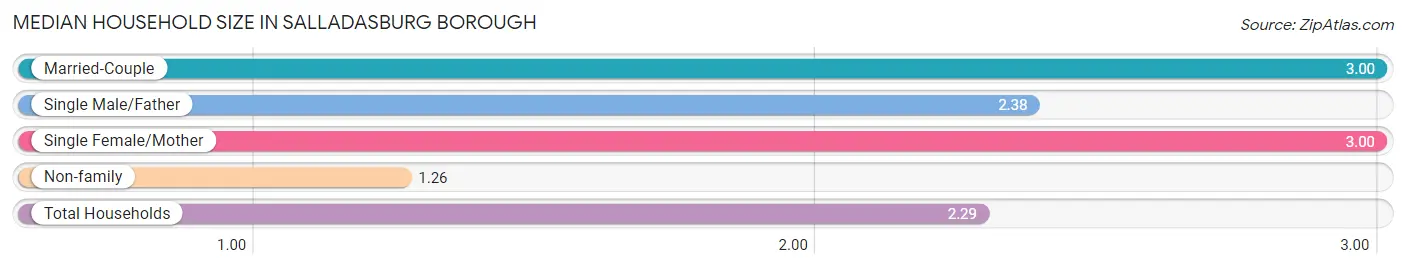
| Household Type | # Households | Household Size |
| Married-Couple | 36 (46.8%) | 3.00 |
| Single Male/Father | 13 (16.9%) | 2.38 |
| Single Female/Mother | 1 (1.3%) | 3.00 |
| Non-family | 27 (35.1%) | 1.26 |
| Total Households | 77 (100.0%) | 2.29 |
Household Size by Marriage Status in Salladasburg borough
Out of a total of 77 households in Salladasburg borough, 50 (64.9%) are family households, while 27 (35.1%) are nonfamily households. The most numerous type of family households are 2-person households, comprising 19, and the most common type of nonfamily households are 1-person households, comprising 22.
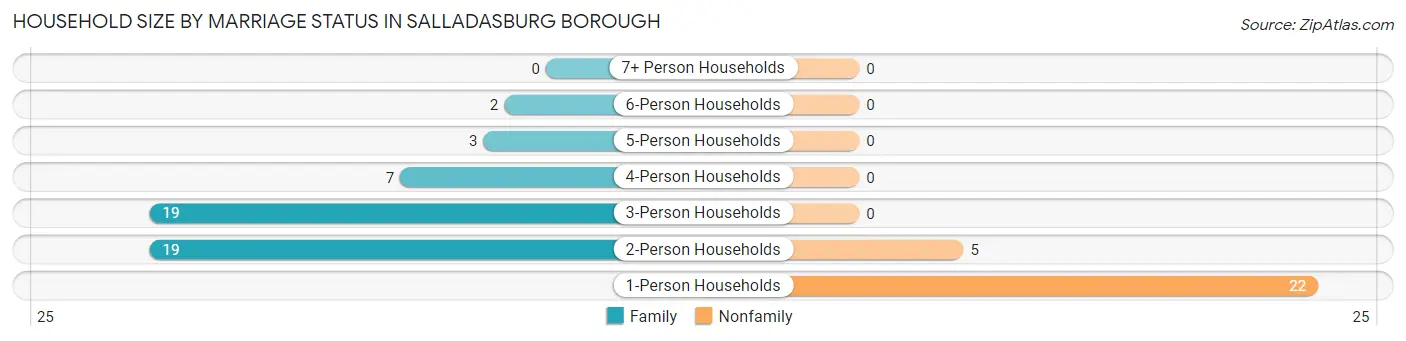
| Household Size | Family Households | Nonfamily Households |
| 1-Person Households | - | 22 (28.6%) |
| 2-Person Households | 19 (24.7%) | 5 (6.5%) |
| 3-Person Households | 19 (24.7%) | 0 (0.0%) |
| 4-Person Households | 7 (9.1%) | 0 (0.0%) |
| 5-Person Households | 3 (3.9%) | 0 (0.0%) |
| 6-Person Households | 2 (2.6%) | 0 (0.0%) |
| 7+ Person Households | 0 (0.0%) | 0 (0.0%) |
| Total | 50 (64.9%) | 27 (35.1%) |
Female Fertility in Salladasburg borough
Fertility by Age in Salladasburg borough
Average fertility rate in Salladasburg borough is 29.0 births per 1,000 women. Women in the age bracket of 20 to 34 years have the highest fertility rate with 50.0 births per 1,000 women. Women in the age bracket of 20 to 34 years acount for 100.0% of all women with births.
| Age Bracket | Women with Births | Births / 1,000 Women |
| 15 to 19 years | 0 (0.0%) | 0.0 |
| 20 to 34 years | 1 (100.0%) | 50.0 |
| 35 to 50 years | 0 (0.0%) | 0.0 |
| Total | 1 (100.0%) | 29.0 |
Fertility by Age by Marriage Status in Salladasburg borough
| Age Bracket | Married | Unmarried |
| 15 to 19 years | 0 (0.0%) | 0 (0.0%) |
| 20 to 34 years | 1 (100.0%) | 0 (0.0%) |
| 35 to 50 years | 0 (0.0%) | 0 (0.0%) |
| Total | 1 (100.0%) | 0 (0.0%) |
Fertility by Education in Salladasburg borough
| Educational Attainment | Women with Births | Births / 1,000 Women |
| Less than High School | 0 (0.0%) | 0.0 |
| High School Diploma | 1 (100.0%) | 100.0 |
| College or Associate's Degree | 0 (0.0%) | 0.0 |
| Bachelor's Degree | 0 (0.0%) | 0.0 |
| Graduate Degree | 0 (0.0%) | 0.0 |
| Total | 1 (100.0%) | 29.0 |
Fertility by Education by Marriage Status in Salladasburg borough
| Educational Attainment | Married | Unmarried |
| Less than High School | 0 (0.0%) | 0 (0.0%) |
| High School Diploma | 1 (100.0%) | 0 (0.0%) |
| College or Associate's Degree | 0 (0.0%) | 0 (0.0%) |
| Bachelor's Degree | 0 (0.0%) | 0 (0.0%) |
| Graduate Degree | 0 (0.0%) | 0 (0.0%) |
| Total | 1 (100.0%) | 0 (0.0%) |
Employment Characteristics in Salladasburg borough
Employment by Class of Employer in Salladasburg borough
Among the 85 employed individuals in Salladasburg borough, private company employees (45 | 52.9%), not-for-profit organizations (16 | 18.8%), and local government employees (9 | 10.6%) make up the most common classes of employment.
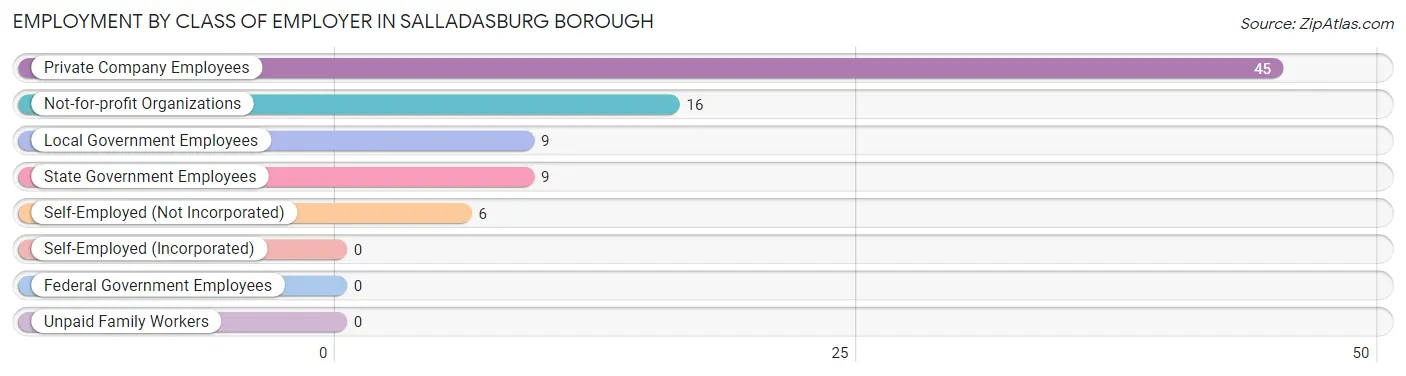
| Employer Class | # Employees | % Employees |
| Private Company Employees | 45 | 52.9% |
| Self-Employed (Incorporated) | 0 | 0.0% |
| Self-Employed (Not Incorporated) | 6 | 7.1% |
| Not-for-profit Organizations | 16 | 18.8% |
| Local Government Employees | 9 | 10.6% |
| State Government Employees | 9 | 10.6% |
| Federal Government Employees | 0 | 0.0% |
| Unpaid Family Workers | 0 | 0.0% |
| Total | 85 | 100.0% |
Employment Status by Age in Salladasburg borough
According to the labor force statistics for Salladasburg borough, out of the total population over 16 years of age (139), 76.3% or 106 individuals are in the labor force, with 10.4% or 11 of them unemployed. The age group with the highest labor force participation rate is 20 to 24 years, with 100.0% or 10 individuals in the labor force. Within the labor force, the 30 to 34 years age range has the highest percentage of unemployed individuals, with 33.3% or 11 of them being unemployed.
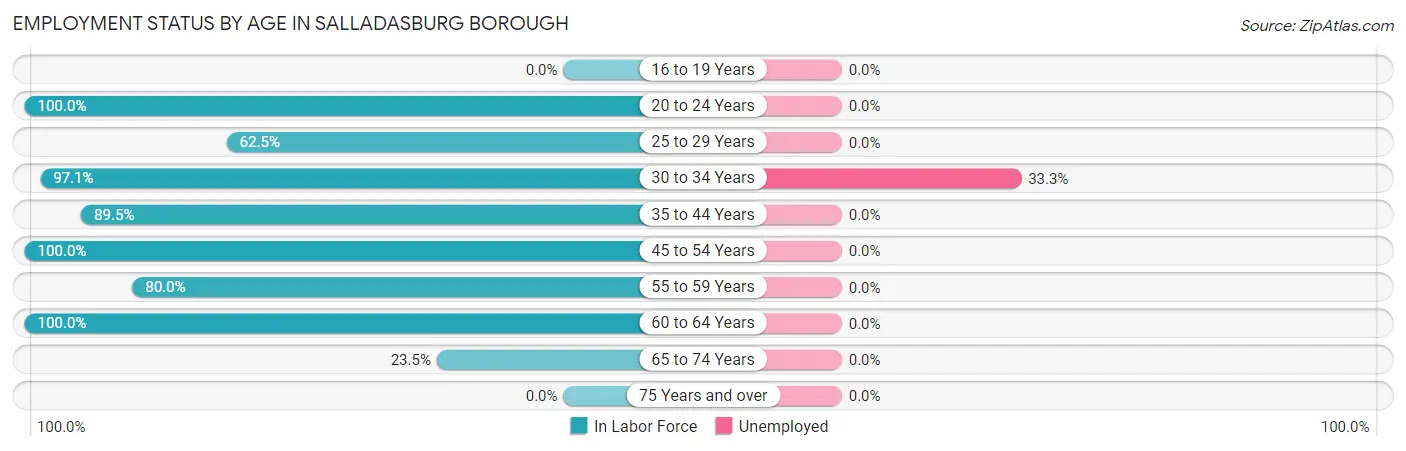
| Age Bracket | In Labor Force | Unemployed |
| 16 to 19 Years | 0 (0.0%) | 0 (0.0%) |
| 20 to 24 Years | 10 (100.0%) | 0 (0.0%) |
| 25 to 29 Years | 5 (62.5%) | 0 (0.0%) |
| 30 to 34 Years | 33 (97.1%) | 11 (33.3%) |
| 35 to 44 Years | 17 (89.5%) | 0 (0.0%) |
| 45 to 54 Years | 21 (100.0%) | 0 (0.0%) |
| 55 to 59 Years | 12 (80.0%) | 0 (0.0%) |
| 60 to 64 Years | 4 (100.0%) | 0 (0.0%) |
| 65 to 74 Years | 4 (23.5%) | 0 (0.0%) |
| 75 Years and over | 0 (0.0%) | 0 (0.0%) |
| Total | 106 (76.3%) | 11 (10.4%) |
Employment Status by Educational Attainment in Salladasburg borough
According to labor force statistics for Salladasburg borough, 91.1% of individuals (92) out of the total population between 25 and 64 years of age (101) are in the labor force, with 12.0% or 11 of them being unemployed. The group with the highest labor force participation rate are those with the educational attainment of bachelor's degree or higher, with 100.0% or 17 individuals in the labor force. Within the labor force, individuals with high school diploma education have the highest percentage of unemployment, with 27.3% or 9 of them being unemployed.
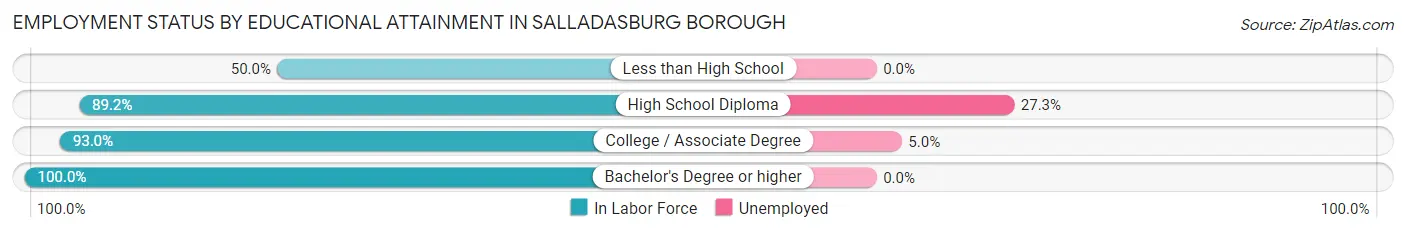
| Educational Attainment | In Labor Force | Unemployed |
| Less than High School | 2 (50.0%) | 0 (0.0%) |
| High School Diploma | 33 (89.2%) | 10 (27.3%) |
| College / Associate Degree | 40 (93.0%) | 2 (5.0%) |
| Bachelor's Degree or higher | 17 (100.0%) | 0 (0.0%) |
| Total | 92 (91.1%) | 12 (12.0%) |
Employment Occupations by Sex in Salladasburg borough
Management, Business, Science and Arts Occupations
The most common Management, Business, Science and Arts occupations in Salladasburg borough are Health Diagnosing & Treating (7 | 7.4%), Business & Financial (6 | 6.3%), Community & Social Service (6 | 6.3%), Education Instruction & Library (5 | 5.3%), and Computers, Engineering & Science (4 | 4.2%).
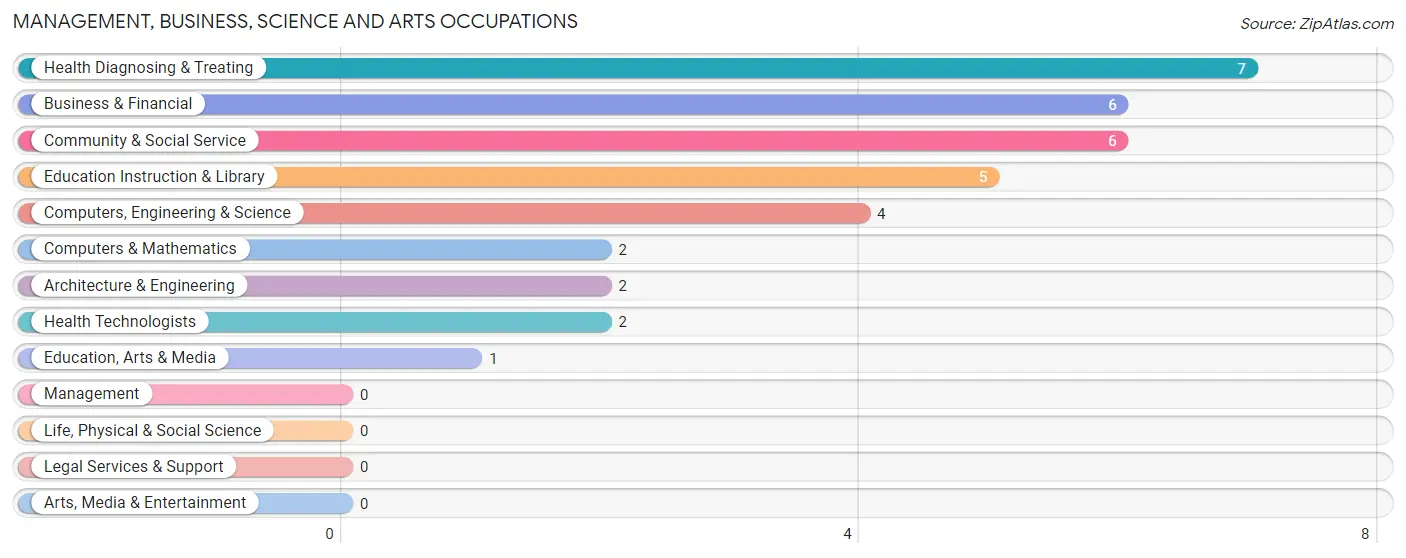
Management, Business, Science and Arts Occupations by Sex
Within the Management, Business, Science and Arts occupations in Salladasburg borough, the most male-oriented occupations are Computers, Engineering & Science (100.0%), Computers & Mathematics (100.0%), and Architecture & Engineering (100.0%), while the most female-oriented occupations are Community & Social Service (100.0%), Education, Arts & Media (100.0%), and Education Instruction & Library (100.0%).
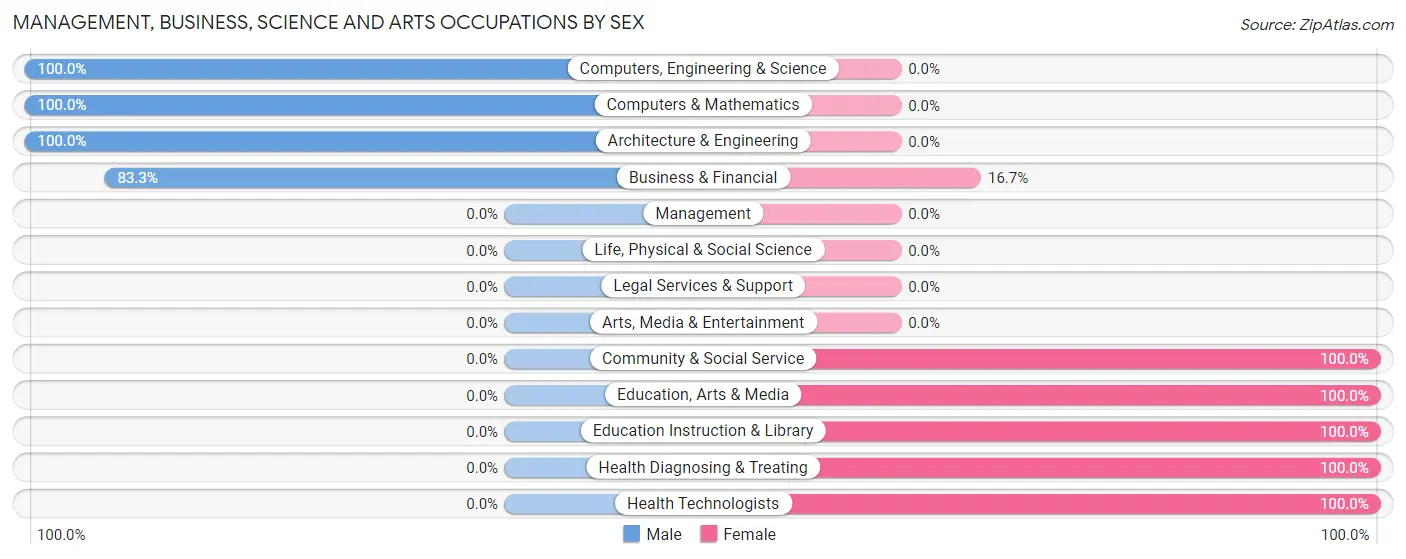
| Occupation | Male | Female |
| Management | 0 (0.0%) | 0 (0.0%) |
| Business & Financial | 5 (83.3%) | 1 (16.7%) |
| Computers, Engineering & Science | 4 (100.0%) | 0 (0.0%) |
| Computers & Mathematics | 2 (100.0%) | 0 (0.0%) |
| Architecture & Engineering | 2 (100.0%) | 0 (0.0%) |
| Life, Physical & Social Science | 0 (0.0%) | 0 (0.0%) |
| Community & Social Service | 0 (0.0%) | 6 (100.0%) |
| Education, Arts & Media | 0 (0.0%) | 1 (100.0%) |
| Legal Services & Support | 0 (0.0%) | 0 (0.0%) |
| Education Instruction & Library | 0 (0.0%) | 5 (100.0%) |
| Arts, Media & Entertainment | 0 (0.0%) | 0 (0.0%) |
| Health Diagnosing & Treating | 0 (0.0%) | 7 (100.0%) |
| Health Technologists | 0 (0.0%) | 2 (100.0%) |
| Total (Category) | 9 (39.1%) | 14 (60.9%) |
| Total (Overall) | 51 (53.7%) | 44 (46.3%) |
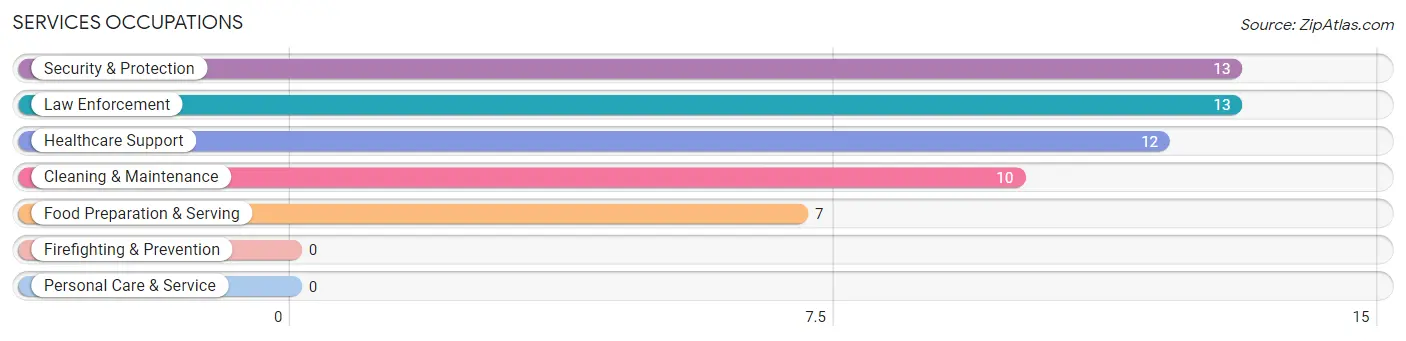
Services Occupations
The most common Services occupations in Salladasburg borough are Security & Protection (13 | 13.7%), Law Enforcement (13 | 13.7%), Healthcare Support (12 | 12.6%), Cleaning & Maintenance (10 | 10.5%), and Food Preparation & Serving (7 | 7.4%).
Services Occupations by Sex
Within the Services occupations in Salladasburg borough, the most male-oriented occupations are Healthcare Support (66.7%), Cleaning & Maintenance (50.0%), and Security & Protection (46.2%), while the most female-oriented occupations are Food Preparation & Serving (100.0%), Security & Protection (53.8%), and Law Enforcement (53.8%).
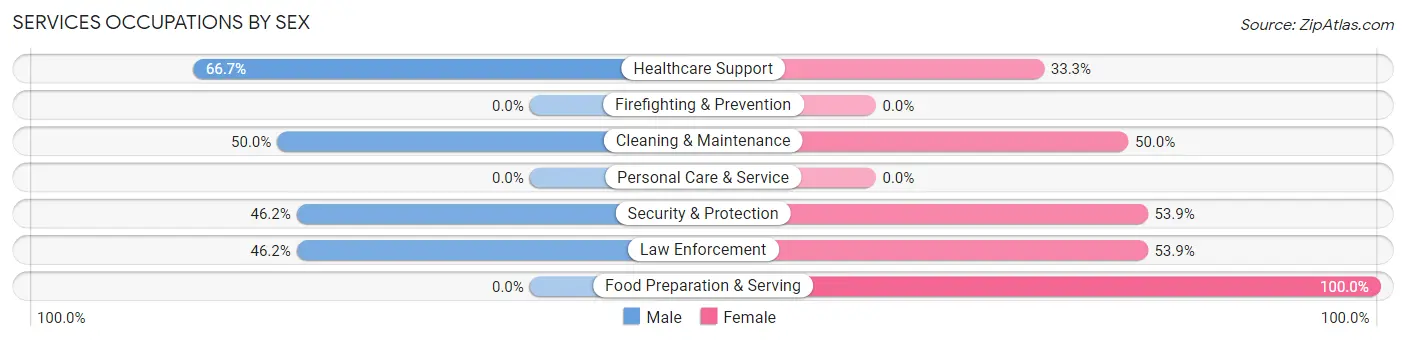
| Occupation | Male | Female |
| Healthcare Support | 8 (66.7%) | 4 (33.3%) |
| Security & Protection | 6 (46.2%) | 7 (53.8%) |
| Firefighting & Prevention | 0 (0.0%) | 0 (0.0%) |
| Law Enforcement | 6 (46.2%) | 7 (53.8%) |
| Food Preparation & Serving | 0 (0.0%) | 7 (100.0%) |
| Cleaning & Maintenance | 5 (50.0%) | 5 (50.0%) |
| Personal Care & Service | 0 (0.0%) | 0 (0.0%) |
| Total (Category) | 19 (45.2%) | 23 (54.8%) |
| Total (Overall) | 51 (53.7%) | 44 (46.3%) |
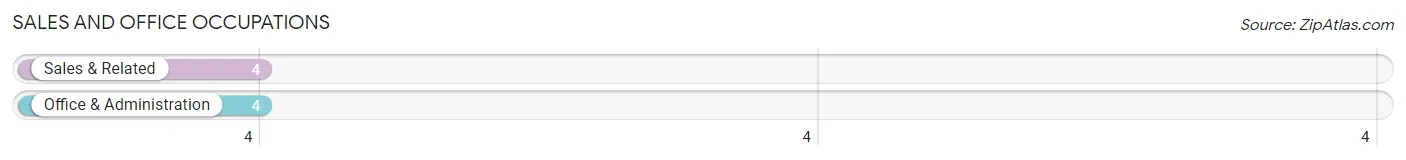
Sales and Office Occupations
The most common Sales and Office occupations in Salladasburg borough are Sales & Related (4 | 4.2%), and Office & Administration (4 | 4.2%).
Sales and Office Occupations by Sex

| Occupation | Male | Female |
| Sales & Related | 4 (100.0%) | 0 (0.0%) |
| Office & Administration | 1 (25.0%) | 3 (75.0%) |
| Total (Category) | 5 (62.5%) | 3 (37.5%) |
| Total (Overall) | 51 (53.7%) | 44 (46.3%) |
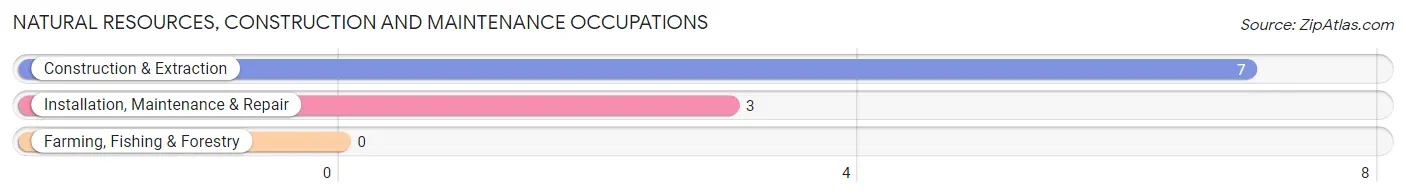
Natural Resources, Construction and Maintenance Occupations
The most common Natural Resources, Construction and Maintenance occupations in Salladasburg borough are Construction & Extraction (7 | 7.4%), and Installation, Maintenance & Repair (3 | 3.2%).
Natural Resources, Construction and Maintenance Occupations by Sex
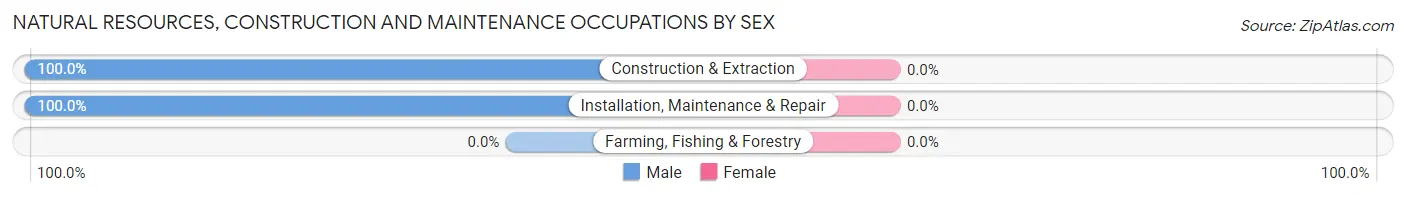
| Occupation | Male | Female |
| Farming, Fishing & Forestry | 0 (0.0%) | 0 (0.0%) |
| Construction & Extraction | 7 (100.0%) | 0 (0.0%) |
| Installation, Maintenance & Repair | 3 (100.0%) | 0 (0.0%) |
| Total (Category) | 10 (100.0%) | 0 (0.0%) |
| Total (Overall) | 51 (53.7%) | 44 (46.3%) |
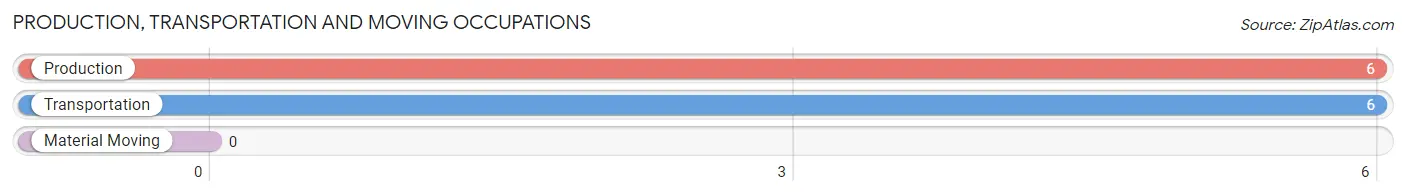
Production, Transportation and Moving Occupations
The most common Production, Transportation and Moving occupations in Salladasburg borough are Production (6 | 6.3%), and Transportation (6 | 6.3%).
Production, Transportation and Moving Occupations by Sex
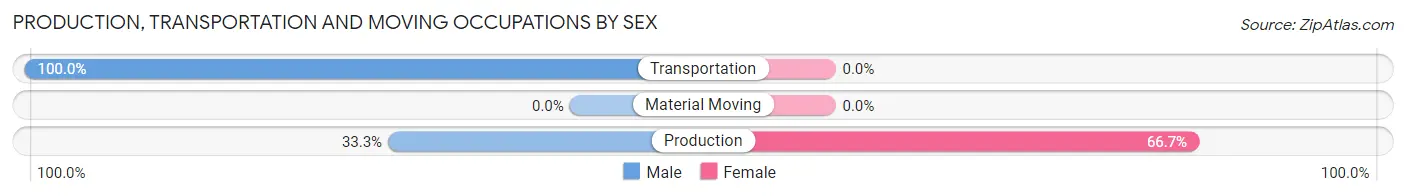
| Occupation | Male | Female |
| Production | 2 (33.3%) | 4 (66.7%) |
| Transportation | 6 (100.0%) | 0 (0.0%) |
| Material Moving | 0 (0.0%) | 0 (0.0%) |
| Total (Category) | 8 (66.7%) | 4 (33.3%) |
| Total (Overall) | 51 (53.7%) | 44 (46.3%) |
Employment Industries by Sex in Salladasburg borough
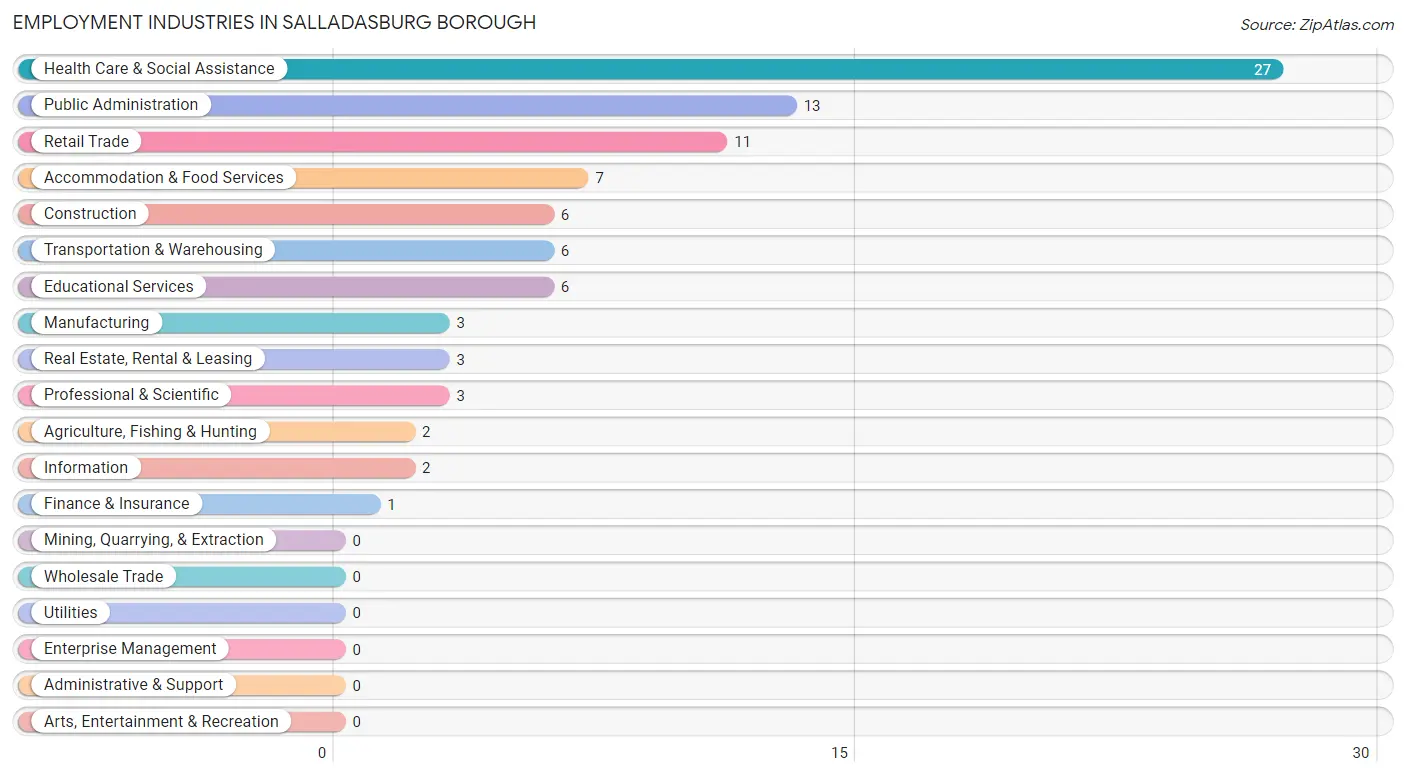
Employment Industries in Salladasburg borough
The major employment industries in Salladasburg borough include Health Care & Social Assistance (27 | 28.4%), Public Administration (13 | 13.7%), Retail Trade (11 | 11.6%), Accommodation & Food Services (7 | 7.4%), and Construction (6 | 6.3%).
Employment Industries by Sex in Salladasburg borough
The Salladasburg borough industries that see more men than women are Agriculture, Fishing & Hunting (100.0%), Construction (100.0%), and Manufacturing (100.0%), whereas the industries that tend to have a higher number of women are Information (100.0%), Accommodation & Food Services (100.0%), and Health Care & Social Assistance (70.4%).
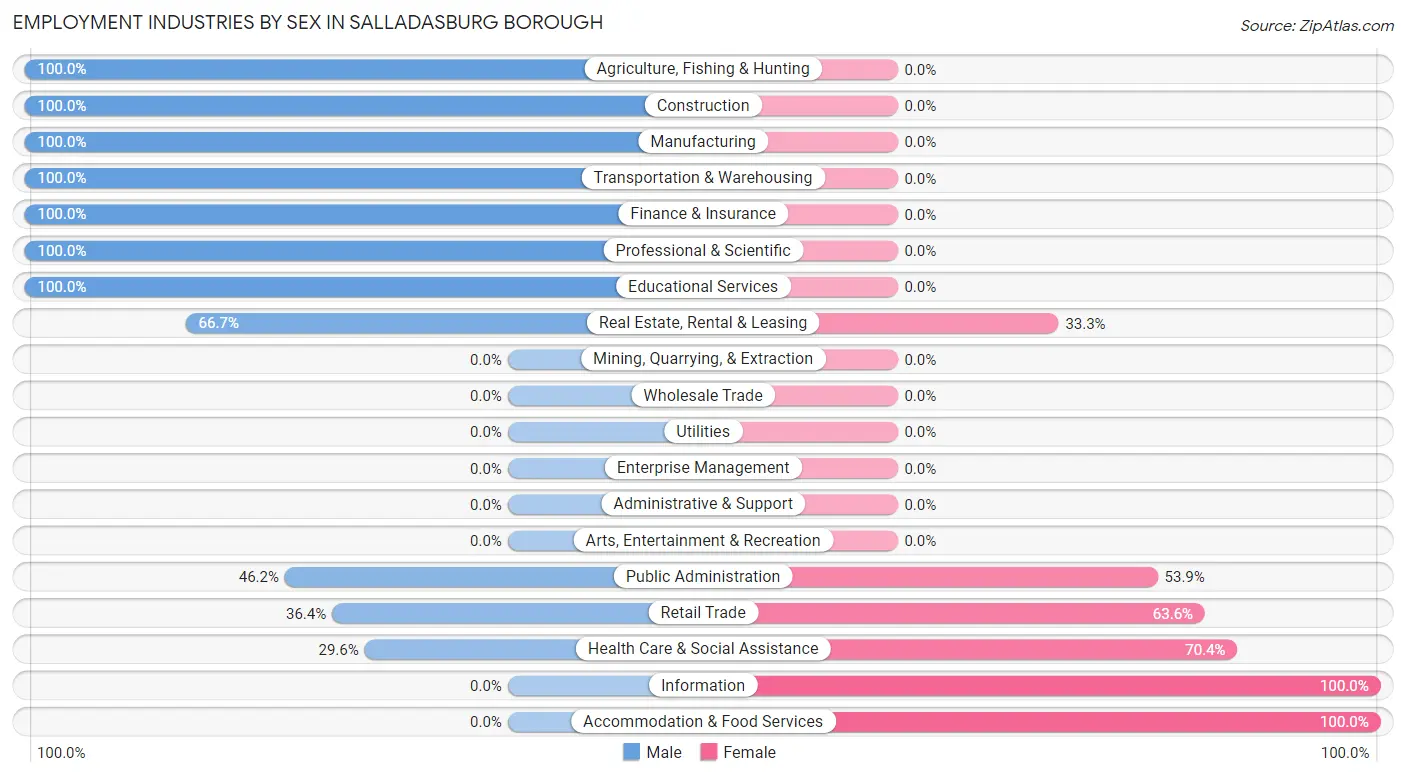
| Industry | Male | Female |
| Agriculture, Fishing & Hunting | 2 (100.0%) | 0 (0.0%) |
| Mining, Quarrying, & Extraction | 0 (0.0%) | 0 (0.0%) |
| Construction | 6 (100.0%) | 0 (0.0%) |
| Manufacturing | 3 (100.0%) | 0 (0.0%) |
| Wholesale Trade | 0 (0.0%) | 0 (0.0%) |
| Retail Trade | 4 (36.4%) | 7 (63.6%) |
| Transportation & Warehousing | 6 (100.0%) | 0 (0.0%) |
| Utilities | 0 (0.0%) | 0 (0.0%) |
| Information | 0 (0.0%) | 2 (100.0%) |
| Finance & Insurance | 1 (100.0%) | 0 (0.0%) |
| Real Estate, Rental & Leasing | 2 (66.7%) | 1 (33.3%) |
| Professional & Scientific | 3 (100.0%) | 0 (0.0%) |
| Enterprise Management | 0 (0.0%) | 0 (0.0%) |
| Administrative & Support | 0 (0.0%) | 0 (0.0%) |
| Educational Services | 6 (100.0%) | 0 (0.0%) |
| Health Care & Social Assistance | 8 (29.6%) | 19 (70.4%) |
| Arts, Entertainment & Recreation | 0 (0.0%) | 0 (0.0%) |
| Accommodation & Food Services | 0 (0.0%) | 7 (100.0%) |
| Public Administration | 6 (46.2%) | 7 (53.8%) |
| Total | 51 (53.7%) | 44 (46.3%) |
Education in Salladasburg borough
School Enrollment in Salladasburg borough
The most common levels of schooling among the 29 students in Salladasburg borough are middle school (7 | 24.1%), elementary school (6 | 20.7%), and kindergarten (5 | 17.2%).
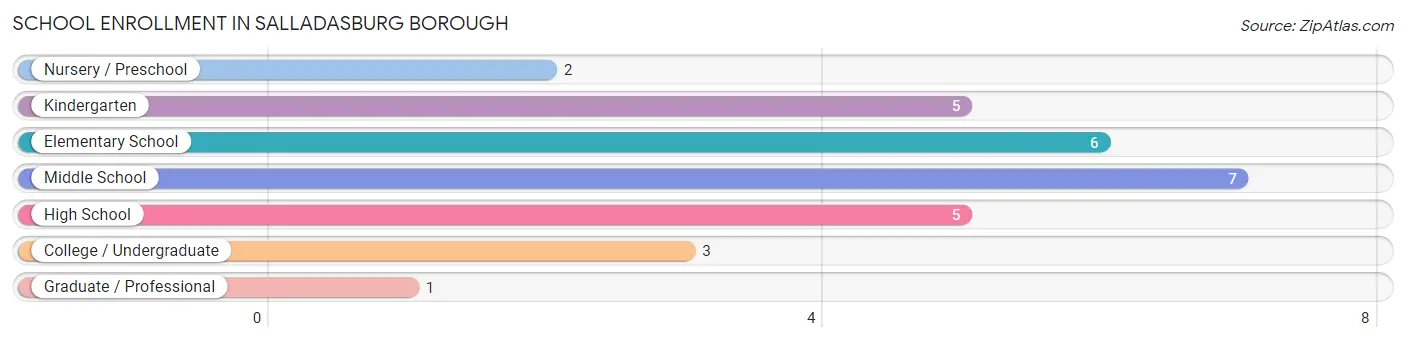
| School Level | # Students | % Students |
| Nursery / Preschool | 2 | 6.9% |
| Kindergarten | 5 | 17.2% |
| Elementary School | 6 | 20.7% |
| Middle School | 7 | 24.1% |
| High School | 5 | 17.2% |
| College / Undergraduate | 3 | 10.3% |
| Graduate / Professional | 1 | 3.5% |
| Total | 29 | 100.0% |
School Enrollment by Age by Funding Source in Salladasburg borough
Out of a total of 29 students who are enrolled in schools in Salladasburg borough, 6 (20.7%) attend a private institution, while the remaining 23 (79.3%) are enrolled in public schools. The age group of 35 years and over has the highest likelihood of being enrolled in private schools, with 1 (100.0% in the age bracket) enrolled. Conversely, the age group of 25 to 34 year olds has the lowest likelihood of being enrolled in a private school, with 3 (100.0% in the age bracket) attending a public institution.
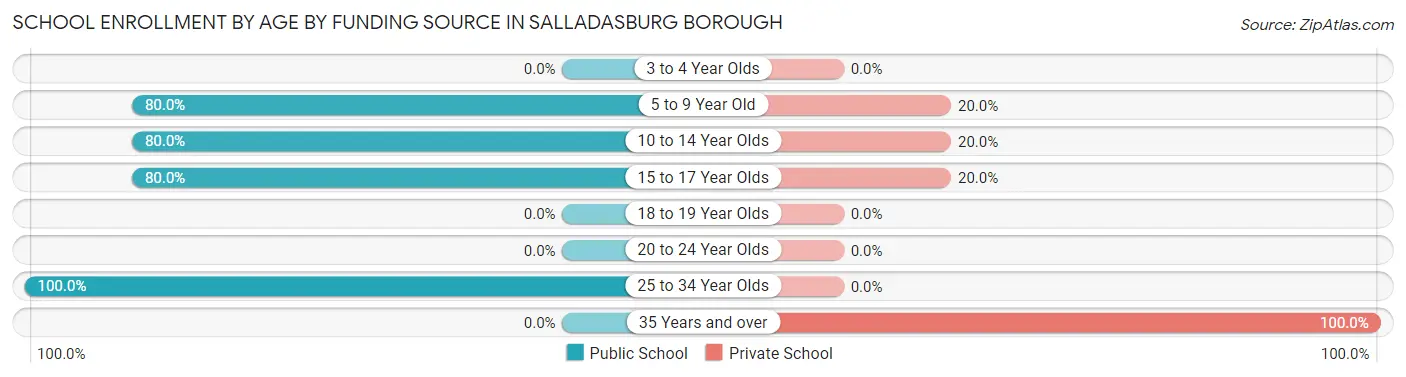
| Age Bracket | Public School | Private School |
| 3 to 4 Year Olds | 0 (0.0%) | 0 (0.0%) |
| 5 to 9 Year Old | 8 (80.0%) | 2 (20.0%) |
| 10 to 14 Year Olds | 8 (80.0%) | 2 (20.0%) |
| 15 to 17 Year Olds | 4 (80.0%) | 1 (20.0%) |
| 18 to 19 Year Olds | 0 (0.0%) | 0 (0.0%) |
| 20 to 24 Year Olds | 0 (0.0%) | 0 (0.0%) |
| 25 to 34 Year Olds | 3 (100.0%) | 0 (0.0%) |
| 35 Years and over | 0 (0.0%) | 1 (100.0%) |
| Total | 23 (79.3%) | 6 (20.7%) |
Educational Attainment by Field of Study in Salladasburg borough
Multidisciplinary studies (6 | 28.6%), business (4 | 19.1%), education (4 | 19.1%), arts & humanities (3 | 14.3%), and social sciences (1 | 4.8%) are the most common fields of study among 21 individuals in Salladasburg borough who have obtained a bachelor's degree or higher.
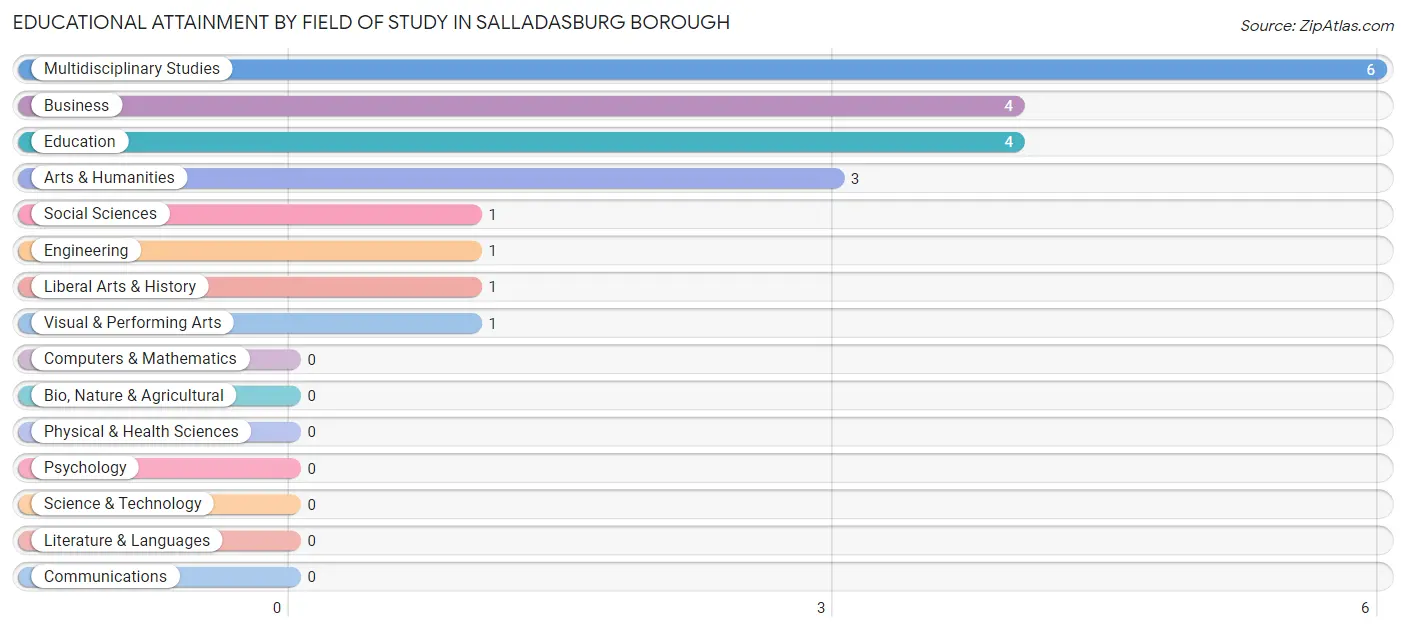
| Field of Study | # Graduates | % Graduates |
| Computers & Mathematics | 0 | 0.0% |
| Bio, Nature & Agricultural | 0 | 0.0% |
| Physical & Health Sciences | 0 | 0.0% |
| Psychology | 0 | 0.0% |
| Social Sciences | 1 | 4.8% |
| Engineering | 1 | 4.8% |
| Multidisciplinary Studies | 6 | 28.6% |
| Science & Technology | 0 | 0.0% |
| Business | 4 | 19.1% |
| Education | 4 | 19.1% |
| Literature & Languages | 0 | 0.0% |
| Liberal Arts & History | 1 | 4.8% |
| Visual & Performing Arts | 1 | 4.8% |
| Communications | 0 | 0.0% |
| Arts & Humanities | 3 | 14.3% |
| Total | 21 | 100.0% |
Transportation & Commute in Salladasburg borough
Vehicle Availability by Sex in Salladasburg borough
The most prevalent vehicle ownership categories in Salladasburg borough are males with 2 vehicles (20, accounting for 44.4%) and females with 2 vehicles (13, making up 50.0%).
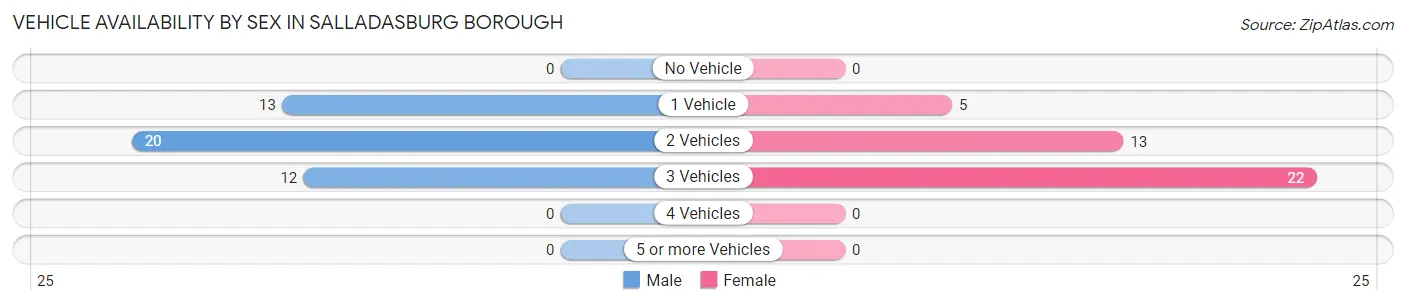
| Vehicles Available | Male | Female |
| No Vehicle | 0 (0.0%) | 0 (0.0%) |
| 1 Vehicle | 13 (28.9%) | 5 (12.5%) |
| 2 Vehicles | 20 (44.4%) | 13 (32.5%) |
| 3 Vehicles | 12 (26.7%) | 22 (55.0%) |
| 4 Vehicles | 0 (0.0%) | 0 (0.0%) |
| 5 or more Vehicles | 0 (0.0%) | 0 (0.0%) |
| Total | 45 (100.0%) | 40 (100.0%) |
Commute Time in Salladasburg borough
The most frequently occuring commute durations in Salladasburg borough are 25 to 29 minutes (20 commuters, 24.4%), 10 to 14 minutes (14 commuters, 17.1%), and 30 to 34 minutes (13 commuters, 15.9%).
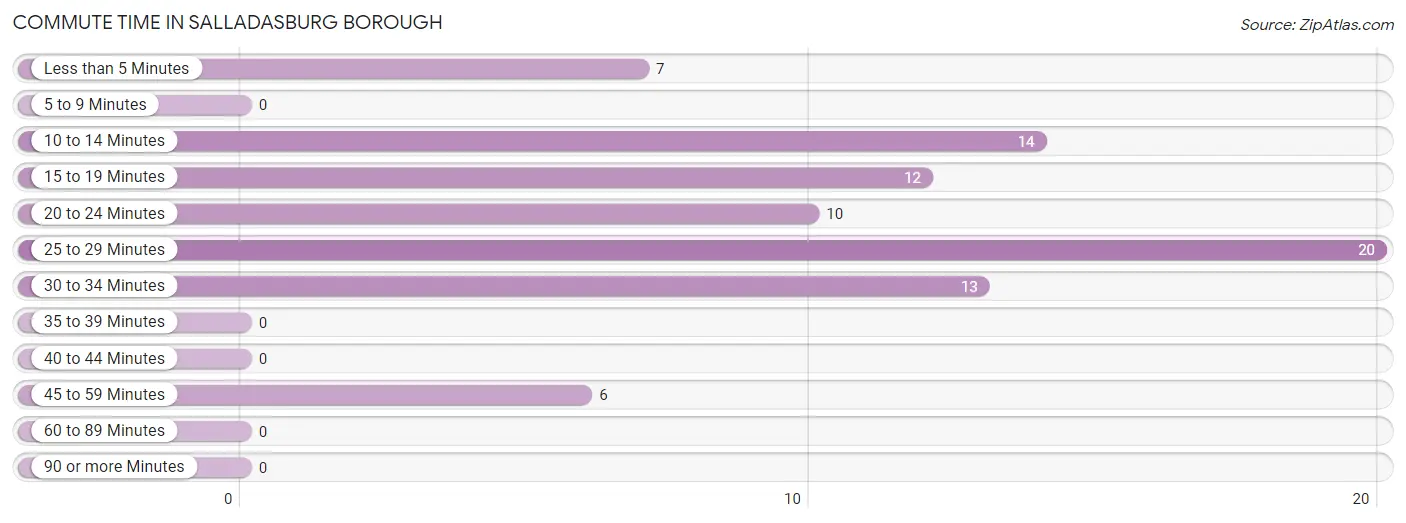
| Commute Time | # Commuters | % Commuters |
| Less than 5 Minutes | 7 | 8.5% |
| 5 to 9 Minutes | 0 | 0.0% |
| 10 to 14 Minutes | 14 | 17.1% |
| 15 to 19 Minutes | 12 | 14.6% |
| 20 to 24 Minutes | 10 | 12.2% |
| 25 to 29 Minutes | 20 | 24.4% |
| 30 to 34 Minutes | 13 | 15.9% |
| 35 to 39 Minutes | 0 | 0.0% |
| 40 to 44 Minutes | 0 | 0.0% |
| 45 to 59 Minutes | 6 | 7.3% |
| 60 to 89 Minutes | 0 | 0.0% |
| 90 or more Minutes | 0 | 0.0% |
Commute Time by Sex in Salladasburg borough
The most common commute times in Salladasburg borough are 25 to 29 minutes (12 commuters, 27.9%) for males and 10 to 14 minutes (9 commuters, 23.1%) for females.
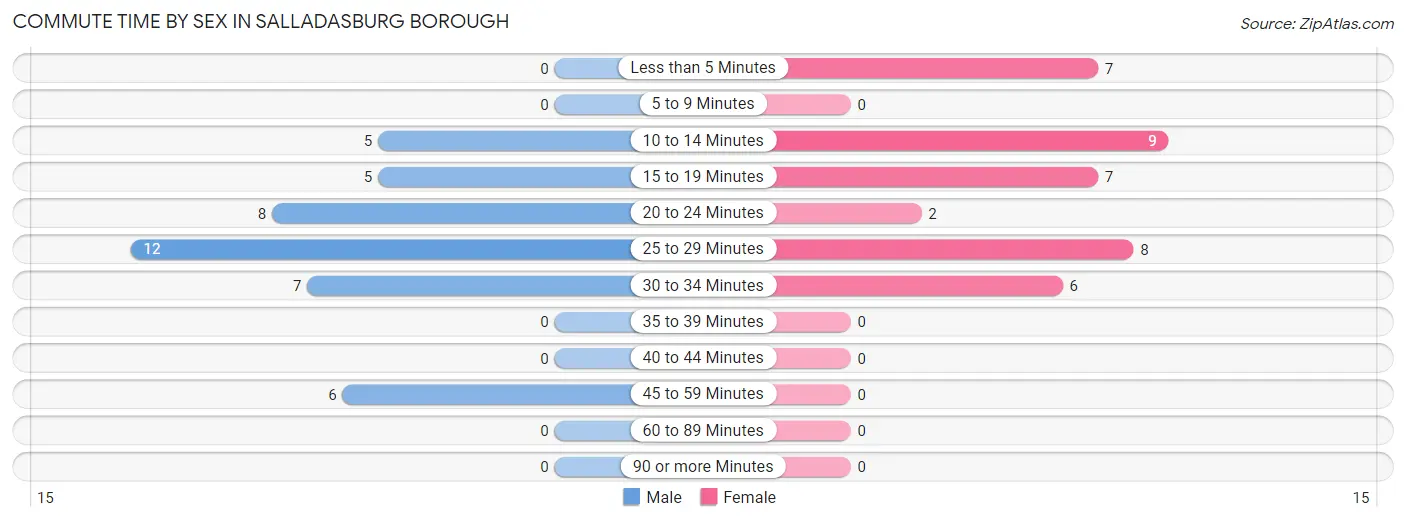
| Commute Time | Male | Female |
| Less than 5 Minutes | 0 (0.0%) | 7 (17.9%) |
| 5 to 9 Minutes | 0 (0.0%) | 0 (0.0%) |
| 10 to 14 Minutes | 5 (11.6%) | 9 (23.1%) |
| 15 to 19 Minutes | 5 (11.6%) | 7 (17.9%) |
| 20 to 24 Minutes | 8 (18.6%) | 2 (5.1%) |
| 25 to 29 Minutes | 12 (27.9%) | 8 (20.5%) |
| 30 to 34 Minutes | 7 (16.3%) | 6 (15.4%) |
| 35 to 39 Minutes | 0 (0.0%) | 0 (0.0%) |
| 40 to 44 Minutes | 0 (0.0%) | 0 (0.0%) |
| 45 to 59 Minutes | 6 (14.0%) | 0 (0.0%) |
| 60 to 89 Minutes | 0 (0.0%) | 0 (0.0%) |
| 90 or more Minutes | 0 (0.0%) | 0 (0.0%) |
Time of Departure to Work by Sex in Salladasburg borough
The most frequent times of departure to work in Salladasburg borough are 7:00 AM to 7:29 AM (13, 30.2%) for males and 6:00 AM to 6:29 AM (13, 33.3%) for females.
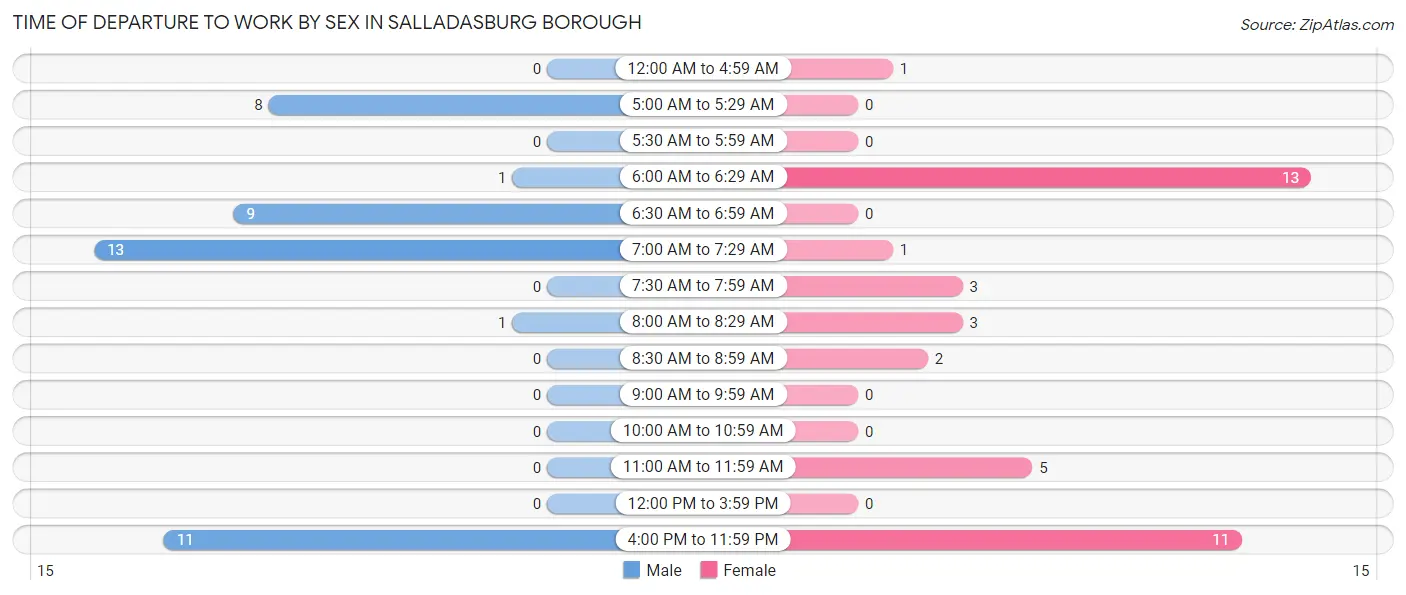
| Time of Departure | Male | Female |
| 12:00 AM to 4:59 AM | 0 (0.0%) | 1 (2.6%) |
| 5:00 AM to 5:29 AM | 8 (18.6%) | 0 (0.0%) |
| 5:30 AM to 5:59 AM | 0 (0.0%) | 0 (0.0%) |
| 6:00 AM to 6:29 AM | 1 (2.3%) | 13 (33.3%) |
| 6:30 AM to 6:59 AM | 9 (20.9%) | 0 (0.0%) |
| 7:00 AM to 7:29 AM | 13 (30.2%) | 1 (2.6%) |
| 7:30 AM to 7:59 AM | 0 (0.0%) | 3 (7.7%) |
| 8:00 AM to 8:29 AM | 1 (2.3%) | 3 (7.7%) |
| 8:30 AM to 8:59 AM | 0 (0.0%) | 2 (5.1%) |
| 9:00 AM to 9:59 AM | 0 (0.0%) | 0 (0.0%) |
| 10:00 AM to 10:59 AM | 0 (0.0%) | 0 (0.0%) |
| 11:00 AM to 11:59 AM | 0 (0.0%) | 5 (12.8%) |
| 12:00 PM to 3:59 PM | 0 (0.0%) | 0 (0.0%) |
| 4:00 PM to 11:59 PM | 11 (25.6%) | 11 (28.2%) |
| Total | 43 (100.0%) | 39 (100.0%) |
Housing Occupancy in Salladasburg borough
Occupancy by Ownership in Salladasburg borough
Of the total 77 dwellings in Salladasburg borough, owner-occupied units account for 58 (75.3%), while renter-occupied units make up 19 (24.7%).
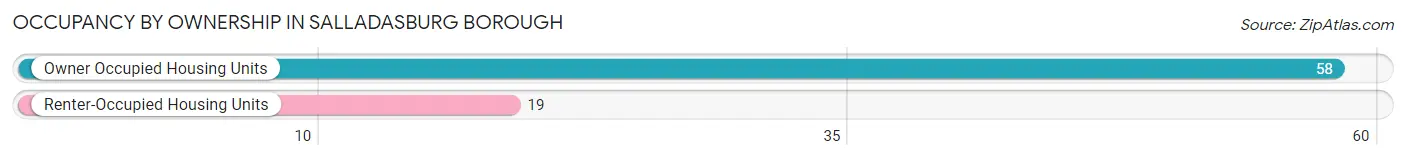
| Occupancy | # Housing Units | % Housing Units |
| Owner Occupied Housing Units | 58 | 75.3% |
| Renter-Occupied Housing Units | 19 | 24.7% |
| Total Occupied Housing Units | 77 | 100.0% |
Occupancy by Household Size in Salladasburg borough
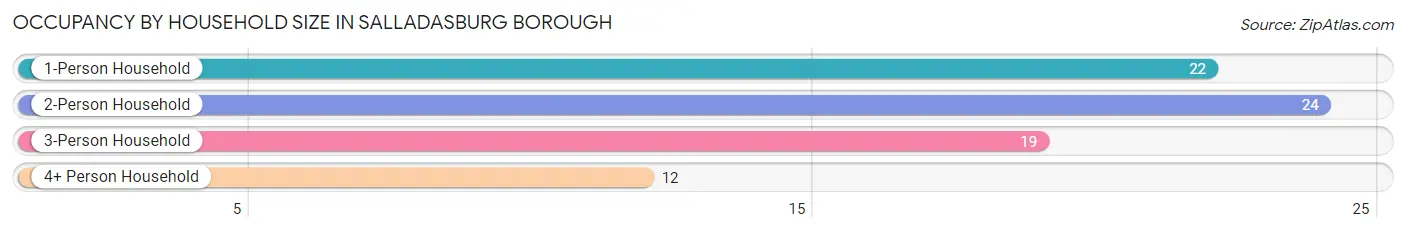
| Household Size | # Housing Units | % Housing Units |
| 1-Person Household | 22 | 28.6% |
| 2-Person Household | 24 | 31.2% |
| 3-Person Household | 19 | 24.7% |
| 4+ Person Household | 12 | 15.6% |
| Total Housing Units | 77 | 100.0% |
Occupancy by Ownership by Household Size in Salladasburg borough
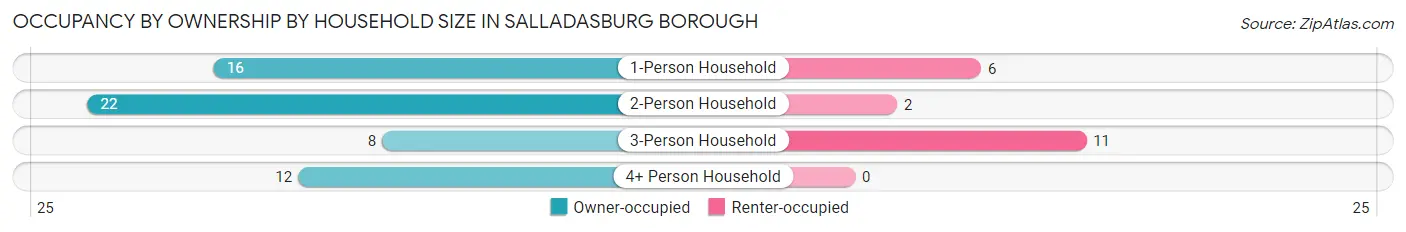
| Household Size | Owner-occupied | Renter-occupied |
| 1-Person Household | 16 (72.7%) | 6 (27.3%) |
| 2-Person Household | 22 (91.7%) | 2 (8.3%) |
| 3-Person Household | 8 (42.1%) | 11 (57.9%) |
| 4+ Person Household | 12 (100.0%) | 0 (0.0%) |
| Total Housing Units | 58 (75.3%) | 19 (24.7%) |
Occupancy by Educational Attainment in Salladasburg borough
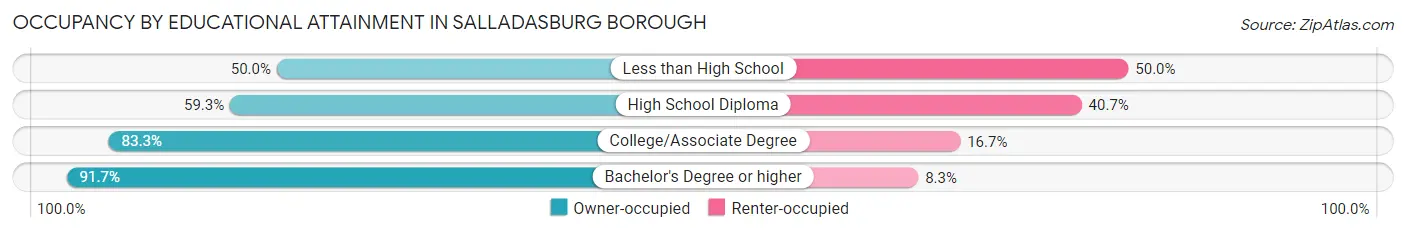
| Household Size | Owner-occupied | Renter-occupied |
| Less than High School | 1 (50.0%) | 1 (50.0%) |
| High School Diploma | 16 (59.3%) | 11 (40.7%) |
| College/Associate Degree | 30 (83.3%) | 6 (16.7%) |
| Bachelor's Degree or higher | 11 (91.7%) | 1 (8.3%) |
Occupancy by Age of Householder in Salladasburg borough
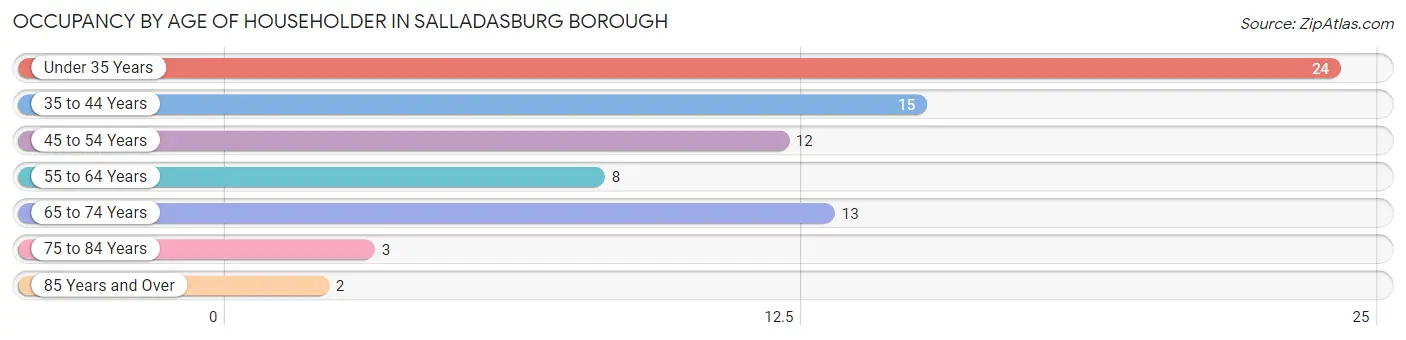
| Age Bracket | # Households | % Households |
| Under 35 Years | 24 | 31.2% |
| 35 to 44 Years | 15 | 19.5% |
| 45 to 54 Years | 12 | 15.6% |
| 55 to 64 Years | 8 | 10.4% |
| 65 to 74 Years | 13 | 16.9% |
| 75 to 84 Years | 3 | 3.9% |
| 85 Years and Over | 2 | 2.6% |
| Total | 77 | 100.0% |
Housing Finances in Salladasburg borough
Median Income by Occupancy in Salladasburg borough
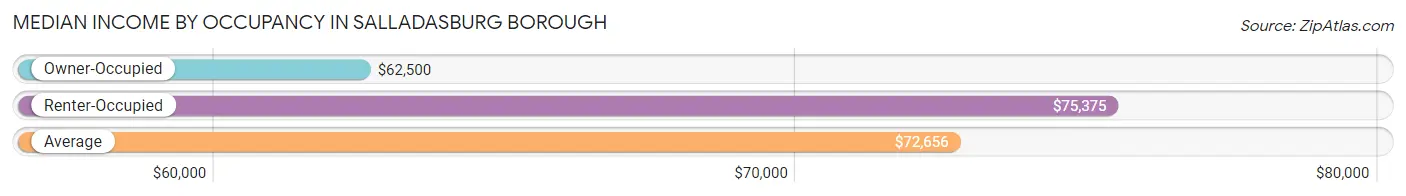
| Occupancy Type | # Households | Median Income |
| Owner-Occupied | 58 (75.3%) | $62,500 |
| Renter-Occupied | 19 (24.7%) | $75,375 |
| Average | 77 (100.0%) | $72,656 |
Occupancy by Householder Income Bracket in Salladasburg borough
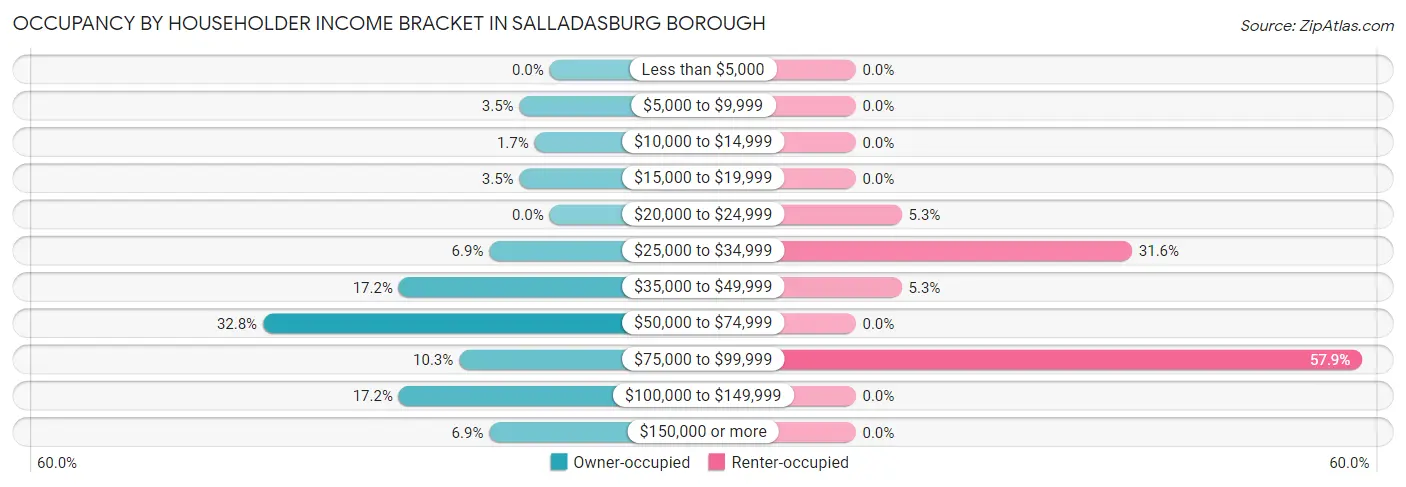
| Income Bracket | Owner-occupied | Renter-occupied |
| Less than $5,000 | 0 (0.0%) | 0 (0.0%) |
| $5,000 to $9,999 | 2 (3.5%) | 0 (0.0%) |
| $10,000 to $14,999 | 1 (1.7%) | 0 (0.0%) |
| $15,000 to $19,999 | 2 (3.5%) | 0 (0.0%) |
| $20,000 to $24,999 | 0 (0.0%) | 1 (5.3%) |
| $25,000 to $34,999 | 4 (6.9%) | 6 (31.6%) |
| $35,000 to $49,999 | 10 (17.2%) | 1 (5.3%) |
| $50,000 to $74,999 | 19 (32.8%) | 0 (0.0%) |
| $75,000 to $99,999 | 6 (10.3%) | 11 (57.9%) |
| $100,000 to $149,999 | 10 (17.2%) | 0 (0.0%) |
| $150,000 or more | 4 (6.9%) | 0 (0.0%) |
| Total | 58 (100.0%) | 19 (100.0%) |
Monthly Housing Cost Tiers in Salladasburg borough
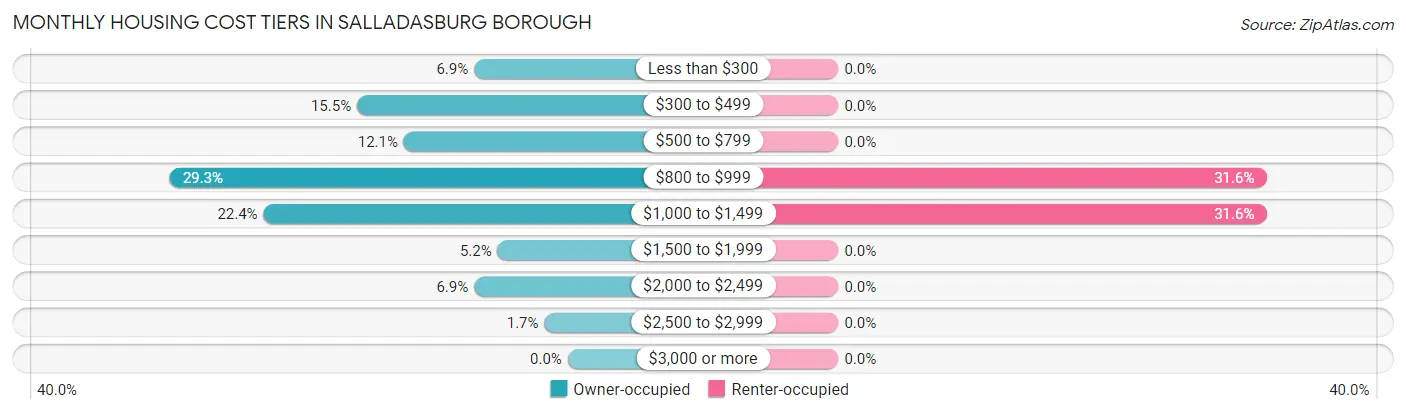
| Monthly Cost | Owner-occupied | Renter-occupied |
| Less than $300 | 4 (6.9%) | 0 (0.0%) |
| $300 to $499 | 9 (15.5%) | 0 (0.0%) |
| $500 to $799 | 7 (12.1%) | 0 (0.0%) |
| $800 to $999 | 17 (29.3%) | 6 (31.6%) |
| $1,000 to $1,499 | 13 (22.4%) | 6 (31.6%) |
| $1,500 to $1,999 | 3 (5.2%) | 0 (0.0%) |
| $2,000 to $2,499 | 4 (6.9%) | 0 (0.0%) |
| $2,500 to $2,999 | 1 (1.7%) | 0 (0.0%) |
| $3,000 or more | 0 (0.0%) | 0 (0.0%) |
| Total | 58 (100.0%) | 19 (100.0%) |
Physical Housing Characteristics in Salladasburg borough
Housing Structures in Salladasburg borough
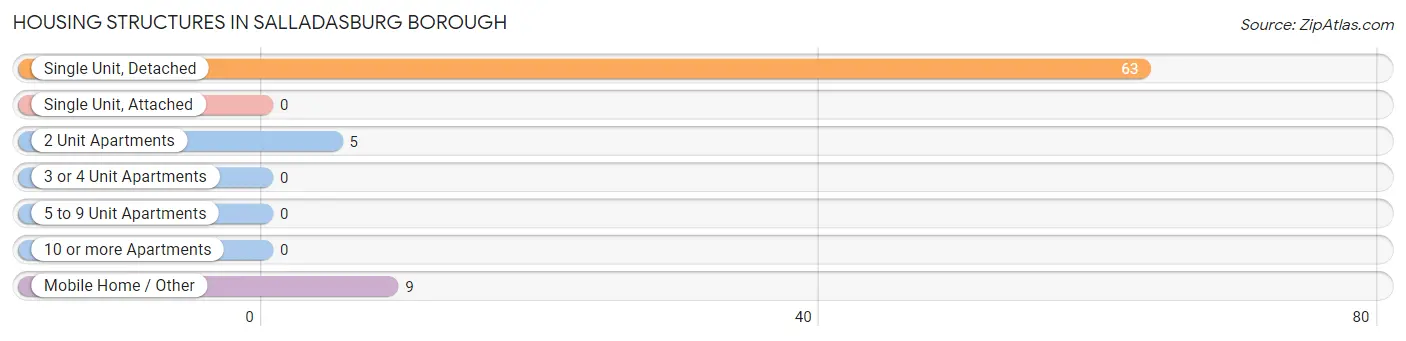
| Structure Type | # Housing Units | % Housing Units |
| Single Unit, Detached | 63 | 81.8% |
| Single Unit, Attached | 0 | 0.0% |
| 2 Unit Apartments | 5 | 6.5% |
| 3 or 4 Unit Apartments | 0 | 0.0% |
| 5 to 9 Unit Apartments | 0 | 0.0% |
| 10 or more Apartments | 0 | 0.0% |
| Mobile Home / Other | 9 | 11.7% |
| Total | 77 | 100.0% |
Housing Structures by Occupancy in Salladasburg borough
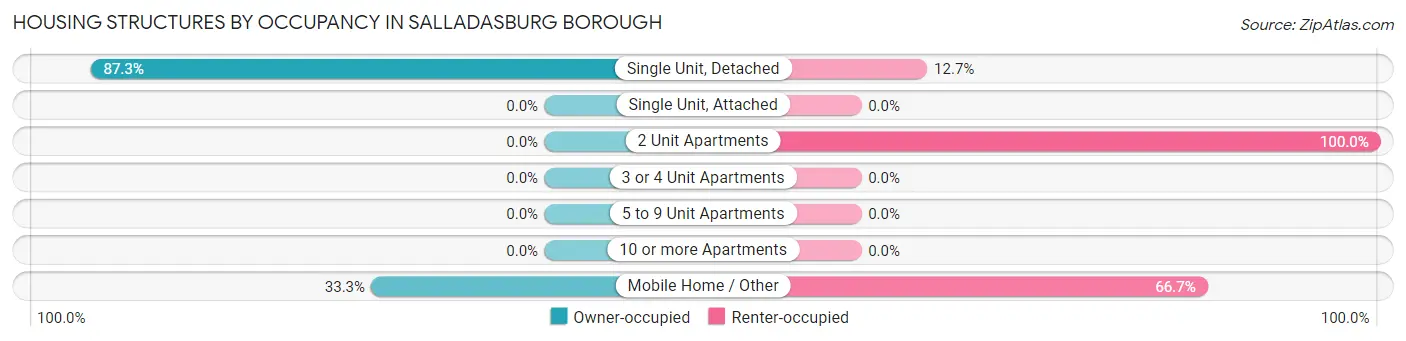
| Structure Type | Owner-occupied | Renter-occupied |
| Single Unit, Detached | 55 (87.3%) | 8 (12.7%) |
| Single Unit, Attached | 0 (0.0%) | 0 (0.0%) |
| 2 Unit Apartments | 0 (0.0%) | 5 (100.0%) |
| 3 or 4 Unit Apartments | 0 (0.0%) | 0 (0.0%) |
| 5 to 9 Unit Apartments | 0 (0.0%) | 0 (0.0%) |
| 10 or more Apartments | 0 (0.0%) | 0 (0.0%) |
| Mobile Home / Other | 3 (33.3%) | 6 (66.7%) |
| Total | 58 (75.3%) | 19 (24.7%) |
Housing Structures by Number of Rooms in Salladasburg borough
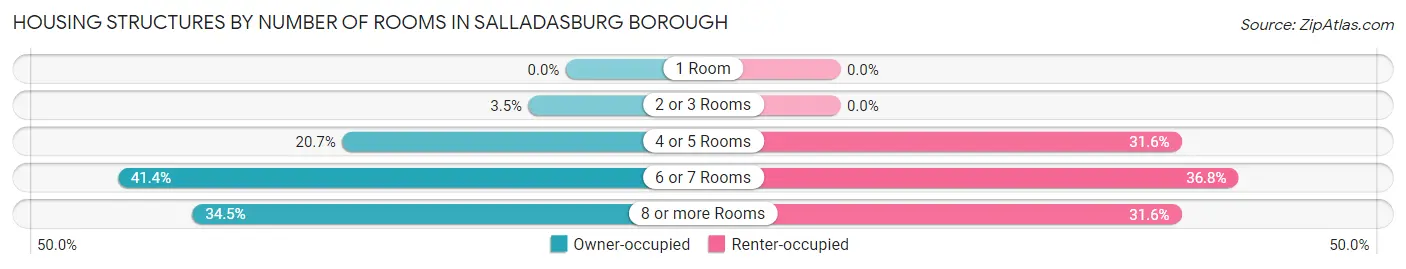
| Number of Rooms | Owner-occupied | Renter-occupied |
| 1 Room | 0 (0.0%) | 0 (0.0%) |
| 2 or 3 Rooms | 2 (3.5%) | 0 (0.0%) |
| 4 or 5 Rooms | 12 (20.7%) | 6 (31.6%) |
| 6 or 7 Rooms | 24 (41.4%) | 7 (36.8%) |
| 8 or more Rooms | 20 (34.5%) | 6 (31.6%) |
| Total | 58 (100.0%) | 19 (100.0%) |
Housing Structure by Heating Type in Salladasburg borough
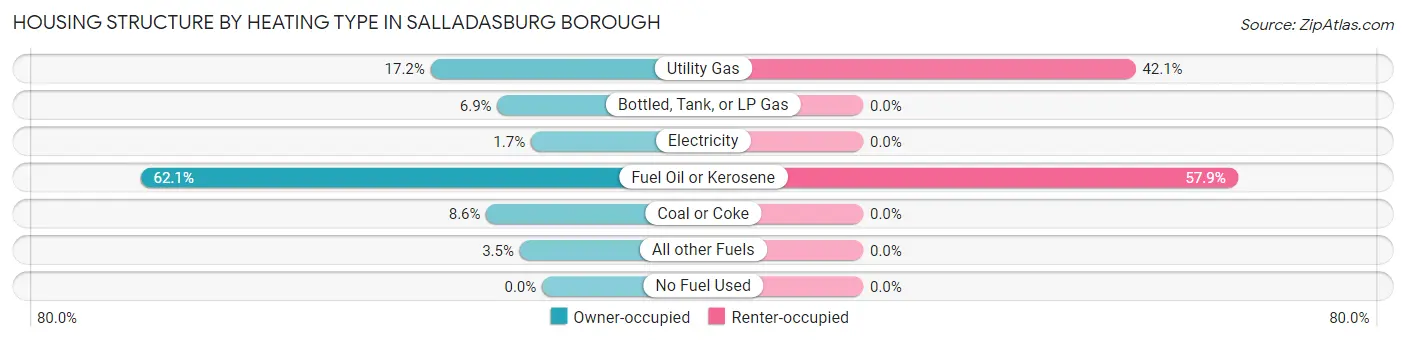
| Heating Type | Owner-occupied | Renter-occupied |
| Utility Gas | 10 (17.2%) | 8 (42.1%) |
| Bottled, Tank, or LP Gas | 4 (6.9%) | 0 (0.0%) |
| Electricity | 1 (1.7%) | 0 (0.0%) |
| Fuel Oil or Kerosene | 36 (62.1%) | 11 (57.9%) |
| Coal or Coke | 5 (8.6%) | 0 (0.0%) |
| All other Fuels | 2 (3.5%) | 0 (0.0%) |
| No Fuel Used | 0 (0.0%) | 0 (0.0%) |
| Total | 58 (100.0%) | 19 (100.0%) |
Household Vehicle Usage in Salladasburg borough
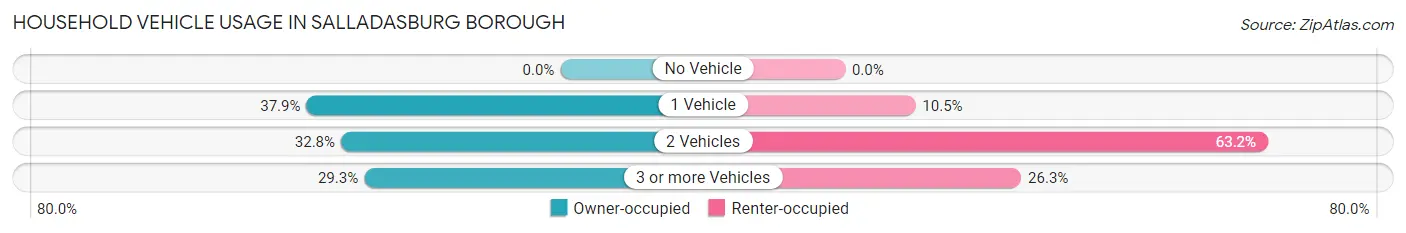
| Vehicles per Household | Owner-occupied | Renter-occupied |
| No Vehicle | 0 (0.0%) | 0 (0.0%) |
| 1 Vehicle | 22 (37.9%) | 2 (10.5%) |
| 2 Vehicles | 19 (32.8%) | 12 (63.2%) |
| 3 or more Vehicles | 17 (29.3%) | 5 (26.3%) |
| Total | 58 (100.0%) | 19 (100.0%) |
Real Estate & Mortgages in Salladasburg borough
Real Estate and Mortgage Overview in Salladasburg borough
| Characteristic | Without Mortgage | With Mortgage |
| Housing Units | 10 | 48 |
| Median Property Value | $100,000 | $163,600 |
| Median Household Income | $33,333 | $4 |
| Monthly Housing Costs | $325 | $0 |
| Real Estate Taxes | $1,333 | $3 |
Property Value by Mortgage Status in Salladasburg borough
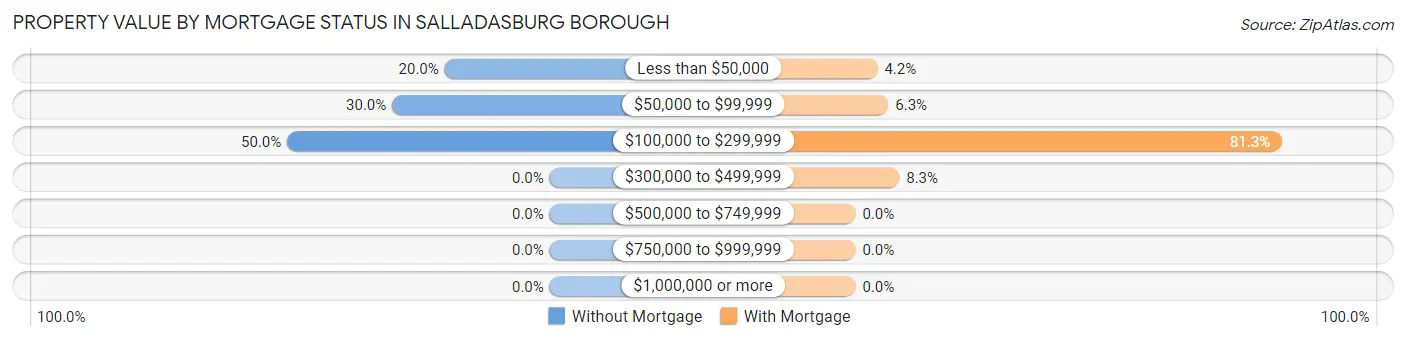
| Property Value | Without Mortgage | With Mortgage |
| Less than $50,000 | 2 (20.0%) | 2 (4.2%) |
| $50,000 to $99,999 | 3 (30.0%) | 3 (6.2%) |
| $100,000 to $299,999 | 5 (50.0%) | 39 (81.2%) |
| $300,000 to $499,999 | 0 (0.0%) | 4 (8.3%) |
| $500,000 to $749,999 | 0 (0.0%) | 0 (0.0%) |
| $750,000 to $999,999 | 0 (0.0%) | 0 (0.0%) |
| $1,000,000 or more | 0 (0.0%) | 0 (0.0%) |
| Total | 10 (100.0%) | 48 (100.0%) |
Household Income by Mortgage Status in Salladasburg borough
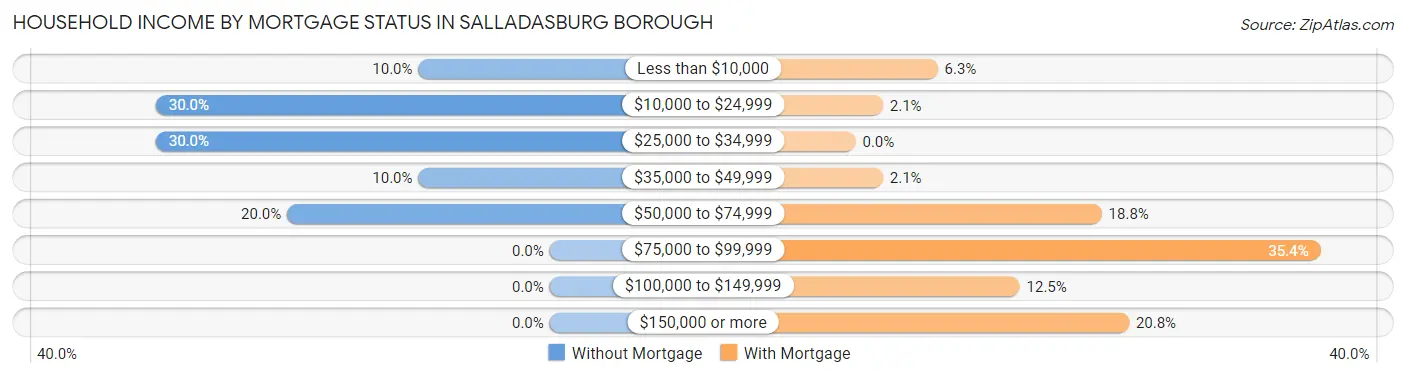
| Household Income | Without Mortgage | With Mortgage |
| Less than $10,000 | 1 (10.0%) | 3 (6.2%) |
| $10,000 to $24,999 | 3 (30.0%) | 1 (2.1%) |
| $25,000 to $34,999 | 3 (30.0%) | 0 (0.0%) |
| $35,000 to $49,999 | 1 (10.0%) | 1 (2.1%) |
| $50,000 to $74,999 | 2 (20.0%) | 9 (18.8%) |
| $75,000 to $99,999 | 0 (0.0%) | 17 (35.4%) |
| $100,000 to $149,999 | 0 (0.0%) | 6 (12.5%) |
| $150,000 or more | 0 (0.0%) | 10 (20.8%) |
| Total | 10 (100.0%) | 48 (100.0%) |
Property Value to Household Income Ratio in Salladasburg borough
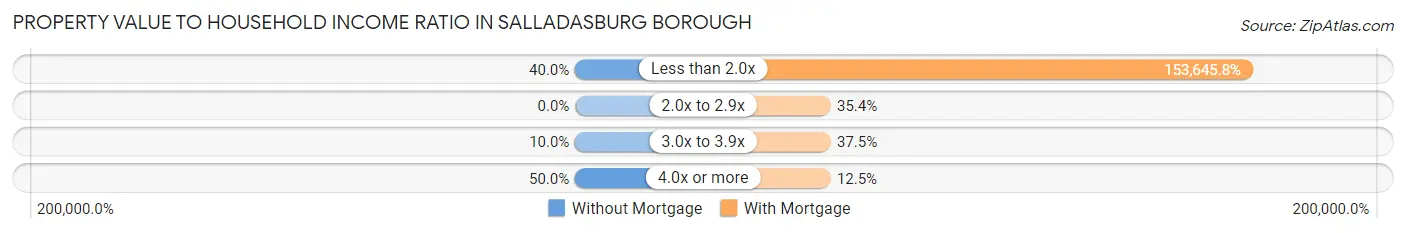
| Value-to-Income Ratio | Without Mortgage | With Mortgage |
| Less than 2.0x | 4 (40.0%) | 73,750 (153,645.8%) |
| 2.0x to 2.9x | 0 (0.0%) | 17 (35.4%) |
| 3.0x to 3.9x | 1 (10.0%) | 18 (37.5%) |
| 4.0x or more | 5 (50.0%) | 6 (12.5%) |
| Total | 10 (100.0%) | 48 (100.0%) |
Real Estate Taxes by Mortgage Status in Salladasburg borough
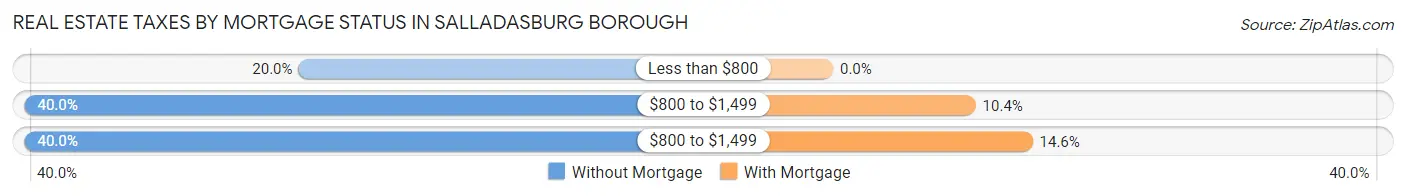
| Property Taxes | Without Mortgage | With Mortgage |
| Less than $800 | 2 (20.0%) | 0 (0.0%) |
| $800 to $1,499 | 4 (40.0%) | 5 (10.4%) |
| $800 to $1,499 | 4 (40.0%) | 7 (14.6%) |
| Total | 10 (100.0%) | 48 (100.0%) |
Health & Disability in Salladasburg borough
Health Insurance Coverage by Age in Salladasburg borough
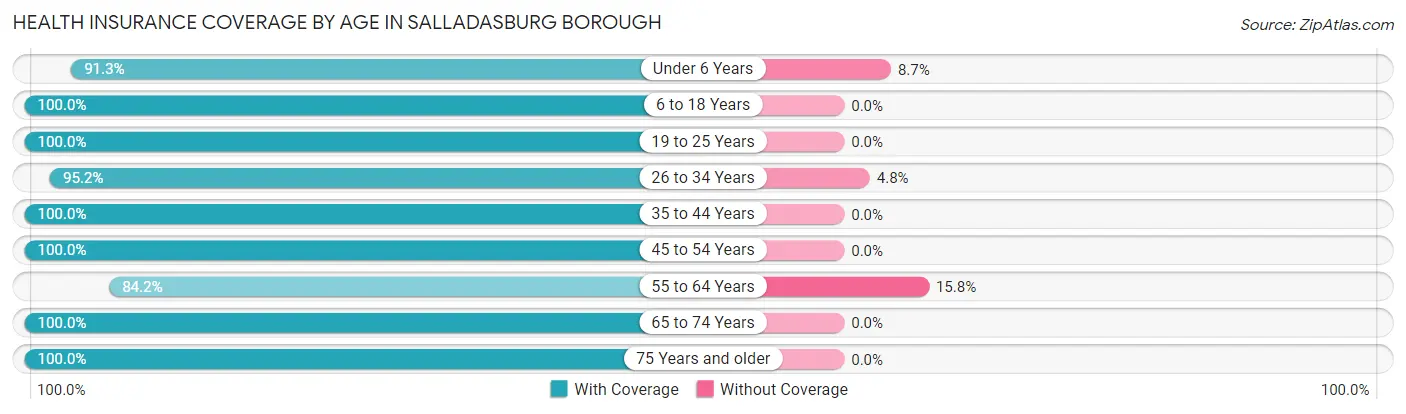
| Age Bracket | With Coverage | Without Coverage |
| Under 6 Years | 21 (91.3%) | 2 (8.7%) |
| 6 to 18 Years | 18 (100.0%) | 0 (0.0%) |
| 19 to 25 Years | 10 (100.0%) | 0 (0.0%) |
| 26 to 34 Years | 40 (95.2%) | 2 (4.8%) |
| 35 to 44 Years | 19 (100.0%) | 0 (0.0%) |
| 45 to 54 Years | 21 (100.0%) | 0 (0.0%) |
| 55 to 64 Years | 16 (84.2%) | 3 (15.8%) |
| 65 to 74 Years | 17 (100.0%) | 0 (0.0%) |
| 75 Years and older | 7 (100.0%) | 0 (0.0%) |
| Total | 169 (96.0%) | 7 (4.0%) |
Health Insurance Coverage by Citizenship Status in Salladasburg borough
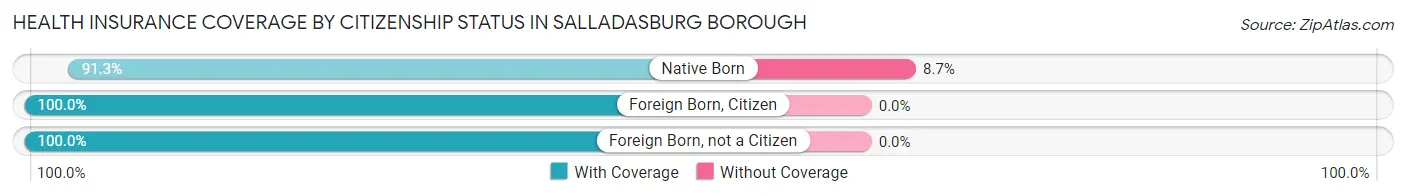
| Citizenship Status | With Coverage | Without Coverage |
| Native Born | 21 (91.3%) | 2 (8.7%) |
| Foreign Born, Citizen | 18 (100.0%) | 0 (0.0%) |
| Foreign Born, not a Citizen | 10 (100.0%) | 0 (0.0%) |
Health Insurance Coverage by Household Income in Salladasburg borough
| Household Income | With Coverage | Without Coverage |
| Under $25,000 | 7 (100.0%) | 0 (0.0%) |
| $25,000 to $49,999 | 34 (91.9%) | 3 (8.1%) |
| $50,000 to $74,999 | 37 (94.9%) | 2 (5.1%) |
| $75,000 to $99,999 | 55 (96.5%) | 2 (3.5%) |
| $100,000 and over | 36 (100.0%) | 0 (0.0%) |
Public vs Private Health Insurance Coverage by Age in Salladasburg borough
| Age Bracket | Public Insurance | Private Insurance |
| Under 6 | 8 (34.8%) | 13 (56.5%) |
| 6 to 18 Years | 10 (55.6%) | 9 (50.0%) |
| 19 to 25 Years | 0 (0.0%) | 10 (100.0%) |
| 25 to 34 Years | 15 (35.7%) | 29 (69.1%) |
| 35 to 44 Years | 6 (31.6%) | 13 (68.4%) |
| 45 to 54 Years | 11 (52.4%) | 16 (76.2%) |
| 55 to 64 Years | 3 (15.8%) | 13 (68.4%) |
| 65 to 74 Years | 17 (100.0%) | 13 (76.5%) |
| 75 Years and over | 7 (100.0%) | 3 (42.9%) |
| Total | 77 (43.8%) | 119 (67.6%) |
Disability Status by Sex by Age in Salladasburg borough
| Age Bracket | Male | Female |
| Under 5 Years | 0 (0.0%) | 0 (0.0%) |
| 5 to 17 Years | 1 (11.1%) | 1 (5.9%) |
| 18 to 34 Years | 11 (34.4%) | 1 (5.0%) |
| 35 to 64 Years | 3 (10.0%) | 2 (6.9%) |
| 65 to 74 Years | 7 (70.0%) | 5 (71.4%) |
| 75 Years and over | 1 (33.3%) | 0 (0.0%) |
Disability Class by Sex by Age in Salladasburg borough
Disability Class: Hearing Difficulty
| Age Bracket | Male | Female |
| Under 5 Years | 0 (0.0%) | 0 (0.0%) |
| 5 to 17 Years | 0 (0.0%) | 0 (0.0%) |
| 18 to 34 Years | 11 (34.4%) | 0 (0.0%) |
| 35 to 64 Years | 0 (0.0%) | 0 (0.0%) |
| 65 to 74 Years | 7 (70.0%) | 4 (57.1%) |
| 75 Years and over | 1 (33.3%) | 0 (0.0%) |
Disability Class: Vision Difficulty
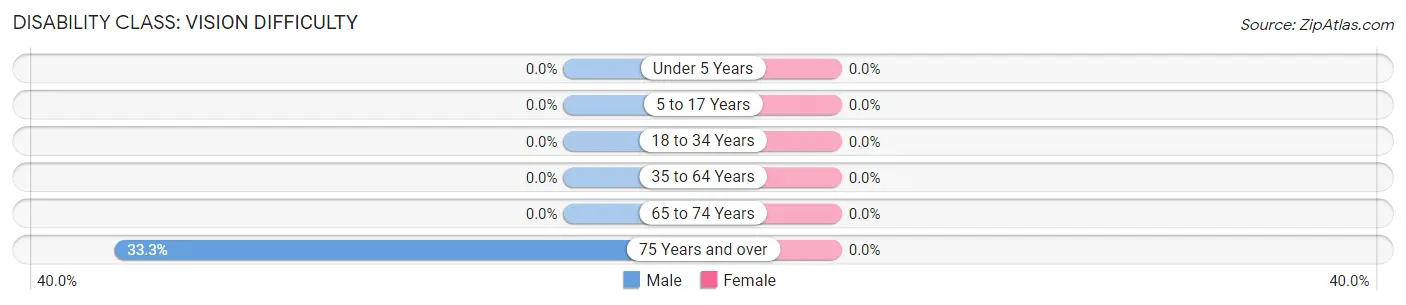
| Age Bracket | Male | Female |
| Under 5 Years | 0 (0.0%) | 0 (0.0%) |
| 5 to 17 Years | 0 (0.0%) | 0 (0.0%) |
| 18 to 34 Years | 0 (0.0%) | 0 (0.0%) |
| 35 to 64 Years | 0 (0.0%) | 0 (0.0%) |
| 65 to 74 Years | 0 (0.0%) | 0 (0.0%) |
| 75 Years and over | 1 (33.3%) | 0 (0.0%) |
Disability Class: Cognitive Difficulty
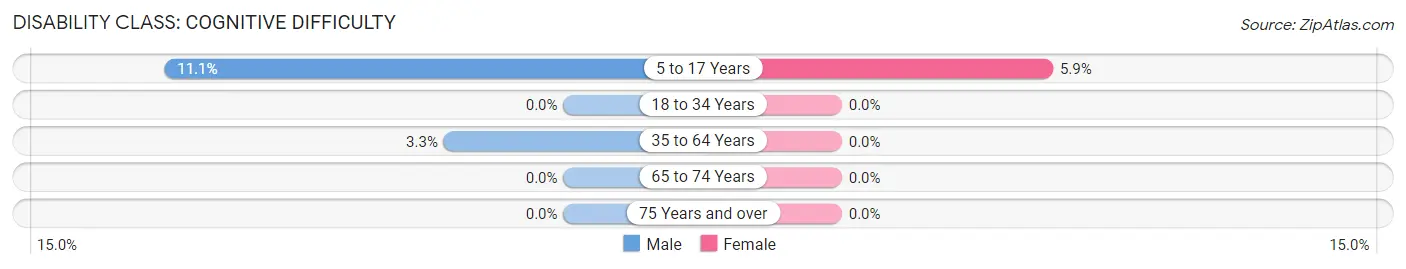
| Age Bracket | Male | Female |
| 5 to 17 Years | 1 (11.1%) | 1 (5.9%) |
| 18 to 34 Years | 0 (0.0%) | 0 (0.0%) |
| 35 to 64 Years | 1 (3.3%) | 0 (0.0%) |
| 65 to 74 Years | 0 (0.0%) | 0 (0.0%) |
| 75 Years and over | 0 (0.0%) | 0 (0.0%) |
Disability Class: Ambulatory Difficulty
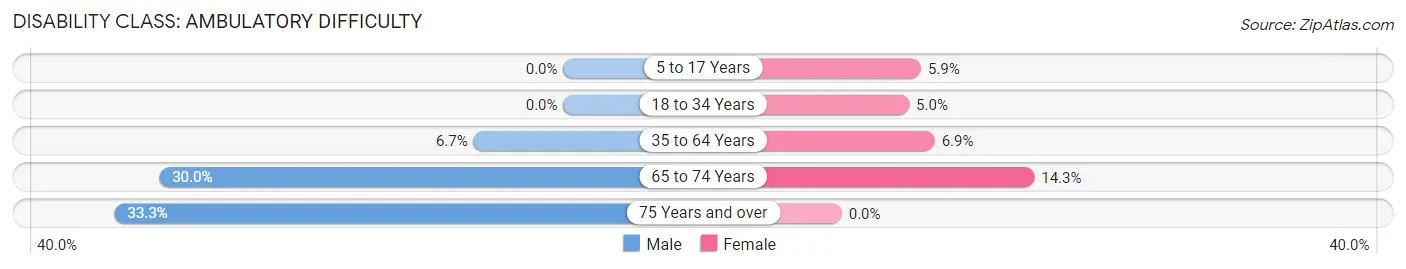
| Age Bracket | Male | Female |
| 5 to 17 Years | 0 (0.0%) | 1 (5.9%) |
| 18 to 34 Years | 0 (0.0%) | 1 (5.0%) |
| 35 to 64 Years | 2 (6.7%) | 2 (6.9%) |
| 65 to 74 Years | 3 (30.0%) | 1 (14.3%) |
| 75 Years and over | 1 (33.3%) | 0 (0.0%) |
Disability Class: Self-Care Difficulty
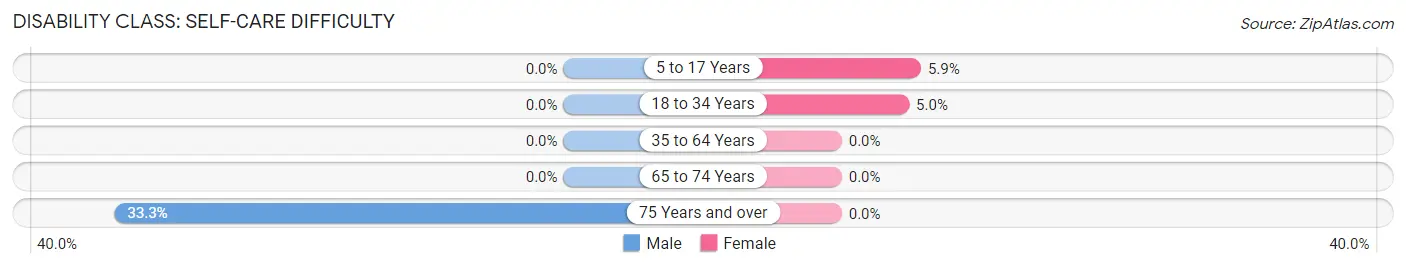
| Age Bracket | Male | Female |
| 5 to 17 Years | 0 (0.0%) | 1 (5.9%) |
| 18 to 34 Years | 0 (0.0%) | 1 (5.0%) |
| 35 to 64 Years | 0 (0.0%) | 0 (0.0%) |
| 65 to 74 Years | 0 (0.0%) | 0 (0.0%) |
| 75 Years and over | 1 (33.3%) | 0 (0.0%) |
Technology Access in Salladasburg borough
Computing Device Access in Salladasburg borough
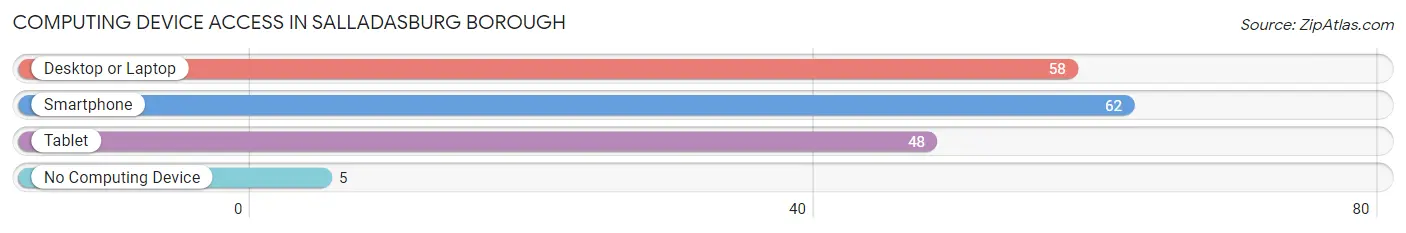
| Device Type | # Households | % Households |
| Desktop or Laptop | 58 | 75.3% |
| Smartphone | 62 | 80.5% |
| Tablet | 48 | 62.3% |
| No Computing Device | 5 | 6.5% |
| Total | 77 | 100.0% |
Internet Access in Salladasburg borough
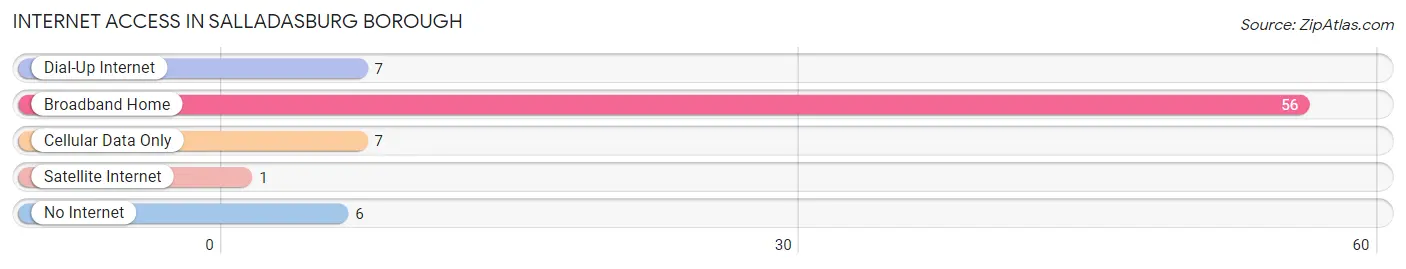
| Internet Type | # Households | % Households |
| Dial-Up Internet | 7 | 9.1% |
| Broadband Home | 56 | 72.7% |
| Cellular Data Only | 7 | 9.1% |
| Satellite Internet | 1 | 1.3% |
| No Internet | 6 | 7.8% |
| Total | 77 | 100.0% |
Salladasburg borough Summary
Salladasburg Borough is a small borough located in Lycoming County, Pennsylvania. It is situated in the eastern part of the county, just south of the city of Williamsport. The borough is bordered by the Susquehanna River to the east, and the West Branch of the Susquehanna River to the west. The population of Salladasburg Borough was 1,093 at the 2010 census.
History
Salladasburg Borough was founded in 1851 by John Sallada, a local farmer. The borough was named after him, and was incorporated in 1854. The first post office in the borough was established in 1855.
In the late 19th century, Salladasburg was a thriving industrial center, with several factories and mills located in the borough. The most prominent of these was the Salladasburg Woolen Mill, which was established in 1876 and operated until the early 20th century. The mill was a major employer in the borough, and provided jobs for many of the local residents.
In the early 20th century, Salladasburg began to decline as the local industries moved away. The borough was hit hard by the Great Depression, and many of the businesses closed. The borough has since recovered, and today is a quiet residential community.
Geography
Salladasburg Borough is located at 40°48'N 76°59'W (40.80, -76.98). It is situated in the eastern part of Lycoming County, just south of the city of Williamsport. The borough is bordered by the Susquehanna River to the east, and the West Branch of the Susquehanna River to the west.
The borough has a total area of 0.7 square miles, all of which is land. The terrain is mostly flat, with some rolling hills in the western part of the borough.
Economy
The economy of Salladasburg Borough is largely based on agriculture and tourism. The borough is home to several farms, which produce a variety of crops, including corn, soybeans, and hay. The borough also has several small businesses, including restaurants, shops, and a few small manufacturing companies.
The borough is also a popular tourist destination, due to its proximity to the Susquehanna River and the nearby state parks. The borough is home to several campgrounds, as well as a few bed and breakfasts.
Demographics
As of the 2010 census, the population of Salladasburg Borough was 1,093. The racial makeup of the borough was 97.3% White, 0.7% African American, 0.2% Native American, 0.2% Asian, 0.2% from other races, and 1.4% from two or more races. Hispanic or Latino of any race were 0.7% of the population.
The median household income in the borough was $41,250, and the median family income was $48,750. The per capita income was $20,945. About 8.3% of families and 10.2% of the population were below the poverty line, including 14.3% of those under age 18 and 5.3% of those age 65 or over.
Common Questions
What is Per Capita Income in Salladasburg borough?
Per Capita income in Salladasburg borough is $30,095.
What is the Median Family Income in Salladasburg borough?
Median Family Income in Salladasburg borough is $73,438.
What is the Median Household income in Salladasburg borough?
Median Household Income in Salladasburg borough is $72,656.
What is Income or Wage Gap in Salladasburg borough?
Income or Wage Gap in Salladasburg borough is 30.5%.
Women in Salladasburg borough earn 69.5 cents for every dollar earned by a man.
What is Inequality or Gini Index in Salladasburg borough?
Inequality or Gini Index in Salladasburg borough is 0.29.
What is the Total Population of Salladasburg borough?
Total Population of Salladasburg borough is 176.
What is the Total Male Population of Salladasburg borough?
Total Male Population of Salladasburg borough is 93.
What is the Total Female Population of Salladasburg borough?
Total Female Population of Salladasburg borough is 83.
What is the Ratio of Males per 100 Females in Salladasburg borough?
There are 112.05 Males per 100 Females in Salladasburg borough.
What is the Ratio of Females per 100 Males in Salladasburg borough?
There are 89.25 Females per 100 Males in Salladasburg borough.
What is the Median Population Age in Salladasburg borough?
Median Population Age in Salladasburg borough is 34.7 Years.
What is the Average Family Size in Salladasburg borough
Average Family Size in Salladasburg borough is 2.7 People.
What is the Average Household Size in Salladasburg borough
Average Household Size in Salladasburg borough is 2.3 People.
How Large is the Labor Force in Salladasburg borough?
There are 106 People in the Labor Forcein in Salladasburg borough.
What is the Percentage of People in the Labor Force in Salladasburg borough?
76.3% of People are in the Labor Force in Salladasburg borough.
What is the Unemployment Rate in Salladasburg borough?
Unemployment Rate in Salladasburg borough is 10.4%.