Cities with the Most Immigrants from South America in South Carolina
RELATED REPORTS & OPTIONS
South America
South Carolina
Compare Cities
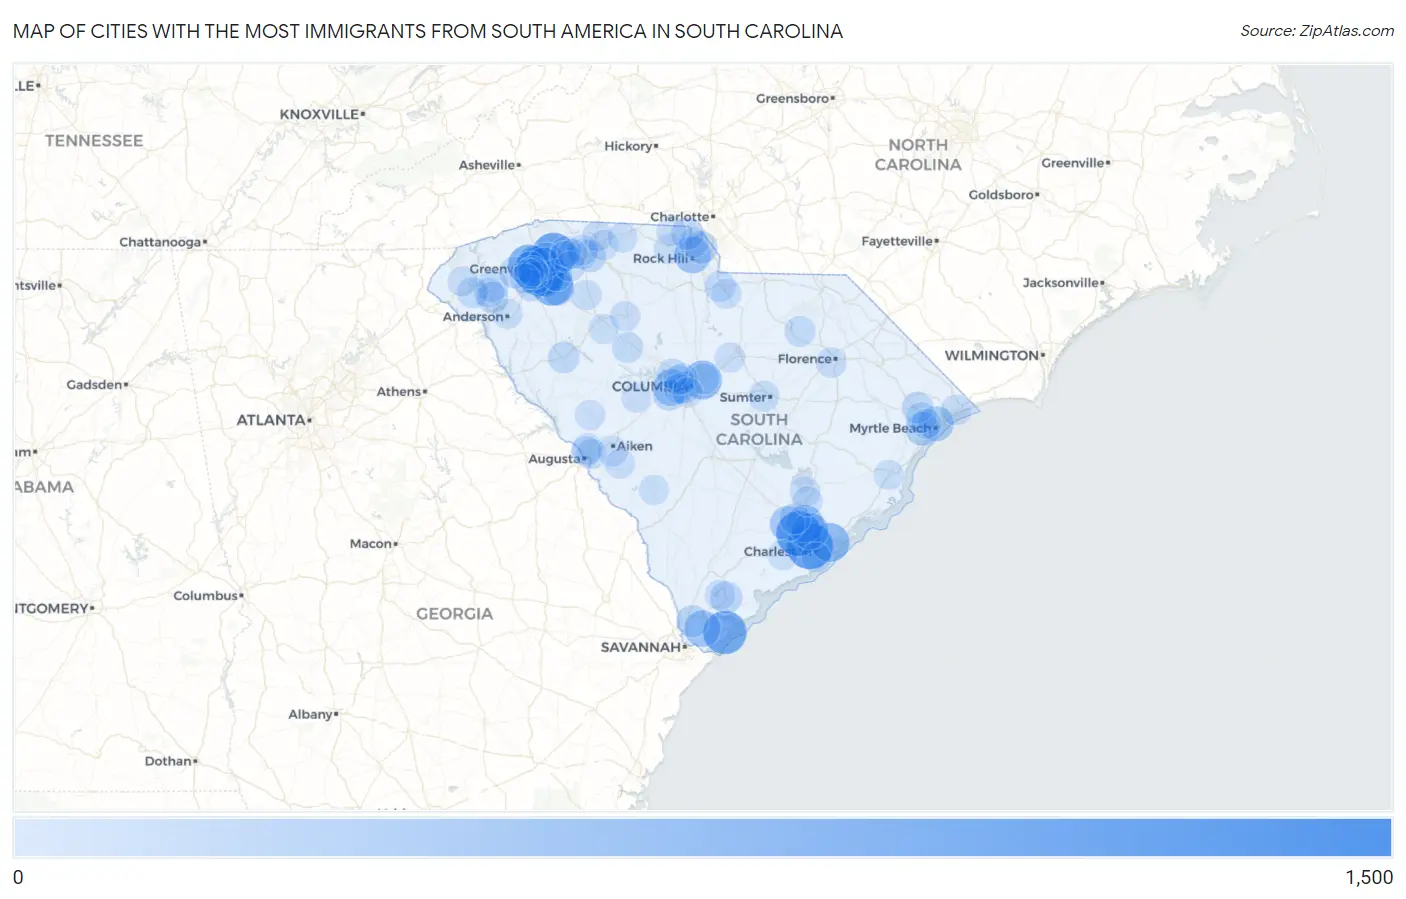
Map of Cities with the Most Immigrants from South America in South Carolina
0
1,500
Cities with the Most Immigrants from South America in South Carolina
| City | South America | vs State | vs National | |
| 1. | Greenville | 1,294 | 28,543(4.53%)#1 | 3,636,375(0.04%)#371 |
| 2. | Charleston | 1,058 | 28,543(3.71%)#2 | 3,636,375(0.03%)#459 |
| 3. | North Charleston | 985 | 28,543(3.45%)#3 | 3,636,375(0.03%)#490 |
| 4. | Greer | 943 | 28,543(3.30%)#4 | 3,636,375(0.03%)#515 |
| 5. | Hilton Head Island | 869 | 28,543(3.04%)#5 | 3,636,375(0.02%)#558 |
| 6. | Simpsonville | 746 | 28,543(2.61%)#6 | 3,636,375(0.02%)#651 |
| 7. | Berea | 729 | 28,543(2.55%)#7 | 3,636,375(0.02%)#665 |
| 8. | Mount Pleasant | 575 | 28,543(2.01%)#8 | 3,636,375(0.02%)#816 |
| 9. | Columbia | 571 | 28,543(2.00%)#9 | 3,636,375(0.02%)#818 |
| 10. | Goose Creek | 473 | 28,543(1.66%)#10 | 3,636,375(0.01%)#945 |
| 11. | Hanahan | 450 | 28,543(1.58%)#11 | 3,636,375(0.01%)#981 |
| 12. | Rock Hill | 431 | 28,543(1.51%)#12 | 3,636,375(0.01%)#1,016 |
| 13. | Lexington | 428 | 28,543(1.50%)#13 | 3,636,375(0.01%)#1,024 |
| 14. | Carolina Forest | 421 | 28,543(1.47%)#14 | 3,636,375(0.01%)#1,037 |
| 15. | Bluffton | 411 | 28,543(1.44%)#15 | 3,636,375(0.01%)#1,062 |
| 16. | Mauldin | 399 | 28,543(1.40%)#16 | 3,636,375(0.01%)#1,082 |
| 17. | Summerville | 342 | 28,543(1.20%)#17 | 3,636,375(0.01%)#1,229 |
| 18. | Taylors | 330 | 28,543(1.16%)#18 | 3,636,375(0.01%)#1,267 |
| 19. | Myrtle Beach | 315 | 28,543(1.10%)#19 | 3,636,375(0.01%)#1,300 |
| 20. | Socastee | 260 | 28,543(0.91%)#20 | 3,636,375(0.01%)#1,481 |
| 21. | Sans Souci | 253 | 28,543(0.89%)#21 | 3,636,375(0.01%)#1,515 |
| 22. | Fountain Inn | 219 | 28,543(0.77%)#22 | 3,636,375(0.01%)#1,674 |
| 23. | Fort Mill | 168 | 28,543(0.59%)#23 | 3,636,375(0.00%)#1,954 |
| 24. | Lake Wylie | 166 | 28,543(0.58%)#24 | 3,636,375(0.00%)#1,972 |
| 25. | Wade Hampton | 163 | 28,543(0.57%)#25 | 3,636,375(0.00%)#1,994 |
| 26. | Hardeeville | 147 | 28,543(0.52%)#26 | 3,636,375(0.00%)#2,101 |
| 27. | Gantt | 145 | 28,543(0.51%)#27 | 3,636,375(0.00%)#2,123 |
| 28. | Five Forks | 138 | 28,543(0.48%)#28 | 3,636,375(0.00%)#2,186 |
| 29. | Beaufort | 138 | 28,543(0.48%)#29 | 3,636,375(0.00%)#2,187 |
| 30. | Golden Grove | 135 | 28,543(0.47%)#30 | 3,636,375(0.00%)#2,224 |
| 31. | West Columbia | 131 | 28,543(0.46%)#31 | 3,636,375(0.00%)#2,261 |
| 32. | Parker | 124 | 28,543(0.43%)#32 | 3,636,375(0.00%)#2,341 |
| 33. | Spartanburg | 120 | 28,543(0.42%)#33 | 3,636,375(0.00%)#2,379 |
| 34. | Central | 117 | 28,543(0.41%)#34 | 3,636,375(0.00%)#2,414 |
| 35. | Easley | 115 | 28,543(0.40%)#35 | 3,636,375(0.00%)#2,425 |
| 36. | Conway | 112 | 28,543(0.39%)#36 | 3,636,375(0.00%)#2,469 |
| 37. | Greenwood | 103 | 28,543(0.36%)#37 | 3,636,375(0.00%)#2,586 |
| 38. | Pendleton | 101 | 28,543(0.35%)#38 | 3,636,375(0.00%)#2,622 |
| 39. | Red Bank | 99 | 28,543(0.35%)#39 | 3,636,375(0.00%)#2,635 |
| 40. | Sangaree | 92 | 28,543(0.32%)#40 | 3,636,375(0.00%)#2,742 |
| 41. | Lancaster | 82 | 28,543(0.29%)#41 | 3,636,375(0.00%)#2,906 |
| 42. | Seneca | 78 | 28,543(0.27%)#42 | 3,636,375(0.00%)#2,957 |
| 43. | Newberry | 77 | 28,543(0.27%)#43 | 3,636,375(0.00%)#2,971 |
| 44. | Belvedere | 71 | 28,543(0.25%)#44 | 3,636,375(0.00%)#3,120 |
| 45. | North Hartsville | 71 | 28,543(0.25%)#45 | 3,636,375(0.00%)#3,125 |
| 46. | Red Hill | 66 | 28,543(0.23%)#46 | 3,636,375(0.00%)#3,235 |
| 47. | Arcadia | 66 | 28,543(0.23%)#47 | 3,636,375(0.00%)#3,251 |
| 48. | Woodfield | 64 | 28,543(0.22%)#48 | 3,636,375(0.00%)#3,287 |
| 49. | Sumter | 57 | 28,543(0.20%)#49 | 3,636,375(0.00%)#3,462 |
| 50. | Southern Shops | 57 | 28,543(0.20%)#50 | 3,636,375(0.00%)#3,475 |
| 51. | St Andrews | 56 | 28,543(0.20%)#51 | 3,636,375(0.00%)#3,486 |
| 52. | Dunean | 55 | 28,543(0.19%)#52 | 3,636,375(0.00%)#3,539 |
| 53. | Irmo | 54 | 28,543(0.19%)#53 | 3,636,375(0.00%)#3,559 |
| 54. | Baxter | 51 | 28,543(0.18%)#54 | 3,636,375(0.00%)#3,672 |
| 55. | Lyman | 50 | 28,543(0.18%)#55 | 3,636,375(0.00%)#3,707 |
| 56. | North Myrtle Beach | 49 | 28,543(0.17%)#56 | 3,636,375(0.00%)#3,729 |
| 57. | Clearwater | 49 | 28,543(0.17%)#57 | 3,636,375(0.00%)#3,747 |
| 58. | Aiken | 43 | 28,543(0.15%)#58 | 3,636,375(0.00%)#3,937 |
| 59. | Hamer | 40 | 28,543(0.14%)#59 | 3,636,375(0.00%)#4,090 |
| 60. | Oak Grove | 39 | 28,543(0.14%)#60 | 3,636,375(0.00%)#4,100 |
| 61. | Florence | 37 | 28,543(0.13%)#61 | 3,636,375(0.00%)#4,177 |
| 62. | Mayo | 34 | 28,543(0.12%)#62 | 3,636,375(0.00%)#4,352 |
| 63. | Duncan | 33 | 28,543(0.12%)#63 | 3,636,375(0.00%)#4,394 |
| 64. | Seven Oaks | 30 | 28,543(0.11%)#64 | 3,636,375(0.00%)#4,540 |
| 65. | Anderson | 29 | 28,543(0.10%)#65 | 3,636,375(0.00%)#4,589 |
| 66. | Joanna | 29 | 28,543(0.10%)#66 | 3,636,375(0.00%)#4,643 |
| 67. | Enoree | 29 | 28,543(0.10%)#67 | 3,636,375(0.00%)#4,648 |
| 68. | Clemson | 28 | 28,543(0.10%)#68 | 3,636,375(0.00%)#4,660 |
| 69. | Judson | 28 | 28,543(0.10%)#69 | 3,636,375(0.00%)#4,705 |
| 70. | Cayce | 27 | 28,543(0.09%)#70 | 3,636,375(0.00%)#4,727 |
| 71. | Lugoff | 27 | 28,543(0.09%)#71 | 3,636,375(0.00%)#4,742 |
| 72. | Laurel Bay | 27 | 28,543(0.09%)#72 | 3,636,375(0.00%)#4,756 |
| 73. | Conestee | 27 | 28,543(0.09%)#73 | 3,636,375(0.00%)#4,783 |
| 74. | York | 26 | 28,543(0.09%)#74 | 3,636,375(0.00%)#4,807 |
| 75. | Clover | 26 | 28,543(0.09%)#75 | 3,636,375(0.00%)#4,813 |
| 76. | White Knoll | 25 | 28,543(0.09%)#76 | 3,636,375(0.00%)#4,867 |
| 77. | Cowpens | 25 | 28,543(0.09%)#77 | 3,636,375(0.00%)#4,899 |
| 78. | North Augusta | 24 | 28,543(0.08%)#78 | 3,636,375(0.00%)#4,917 |
| 79. | Powdersville | 22 | 28,543(0.08%)#79 | 3,636,375(0.00%)#5,086 |
| 80. | Pinopolis | 22 | 28,543(0.08%)#80 | 3,636,375(0.00%)#5,135 |
| 81. | Welcome | 20 | 28,543(0.07%)#81 | 3,636,375(0.00%)#5,225 |
| 82. | Barnwell | 20 | 28,543(0.07%)#82 | 3,636,375(0.00%)#5,240 |
| 83. | Gaffney | 19 | 28,543(0.07%)#83 | 3,636,375(0.00%)#5,298 |
| 84. | Georgetown | 19 | 28,543(0.07%)#84 | 3,636,375(0.00%)#5,307 |
| 85. | Moncks Corner | 18 | 28,543(0.06%)#85 | 3,636,375(0.00%)#5,379 |
| 86. | Edgefield | 18 | 28,543(0.06%)#86 | 3,636,375(0.00%)#5,426 |
| 87. | Reidville | 18 | 28,543(0.06%)#87 | 3,636,375(0.00%)#5,433 |
| 88. | Tega Cay | 17 | 28,543(0.06%)#88 | 3,636,375(0.00%)#5,478 |
| 89. | Elgin | 17 | 28,543(0.06%)#89 | 3,636,375(0.00%)#5,517 |
| 90. | Batesburg Leesville | 16 | 28,543(0.06%)#90 | 3,636,375(0.00%)#5,581 |
| 91. | New Ellenton | 16 | 28,543(0.06%)#91 | 3,636,375(0.00%)#5,606 |
| 92. | Camp Croft | 16 | 28,543(0.06%)#92 | 3,636,375(0.00%)#5,617 |
| 93. | Beech Island | 16 | 28,543(0.06%)#93 | 3,636,375(0.00%)#5,622 |
| 94. | Whitmire | 16 | 28,543(0.06%)#94 | 3,636,375(0.00%)#5,625 |
| 95. | James Island | 15 | 28,543(0.05%)#95 | 3,636,375(0.00%)#5,645 |
| 96. | Hollywood | 15 | 28,543(0.05%)#96 | 3,636,375(0.00%)#5,668 |
| 97. | Arkwright | 15 | 28,543(0.05%)#97 | 3,636,375(0.00%)#5,691 |
| 98. | West Union | 15 | 28,543(0.05%)#98 | 3,636,375(0.00%)#5,732 |
| 99. | Forestbrook | 12 | 28,543(0.04%)#99 | 3,636,375(0.00%)#5,973 |
| 100. | Wellford | 12 | 28,543(0.04%)#100 | 3,636,375(0.00%)#6,012 |
Common Questions
What are the Top 10 Cities with the Most Immigrants from South America in South Carolina?
Top 10 Cities with the Most Immigrants from South America in South Carolina are:
#1
1,294
#2
1,058
#3
985
#4
943
#5
869
#6
746
#7
729
#8
575
#9
571
#10
473
What city has the Most Immigrants from South America in South Carolina?
Greenville has the Most Immigrants from South America in South Carolina with 1,294.
What is the Total Immigrants from South America in the State of South Carolina?
Total Immigrants from South America in South Carolina is 28,543.
What is the Total Immigrants from South America in the United States?
Total Immigrants from South America in the United States is 3,636,375.