Cities with the Most Immigrants from South America in Alabama
RELATED REPORTS & OPTIONS
South America
Alabama
Compare Cities
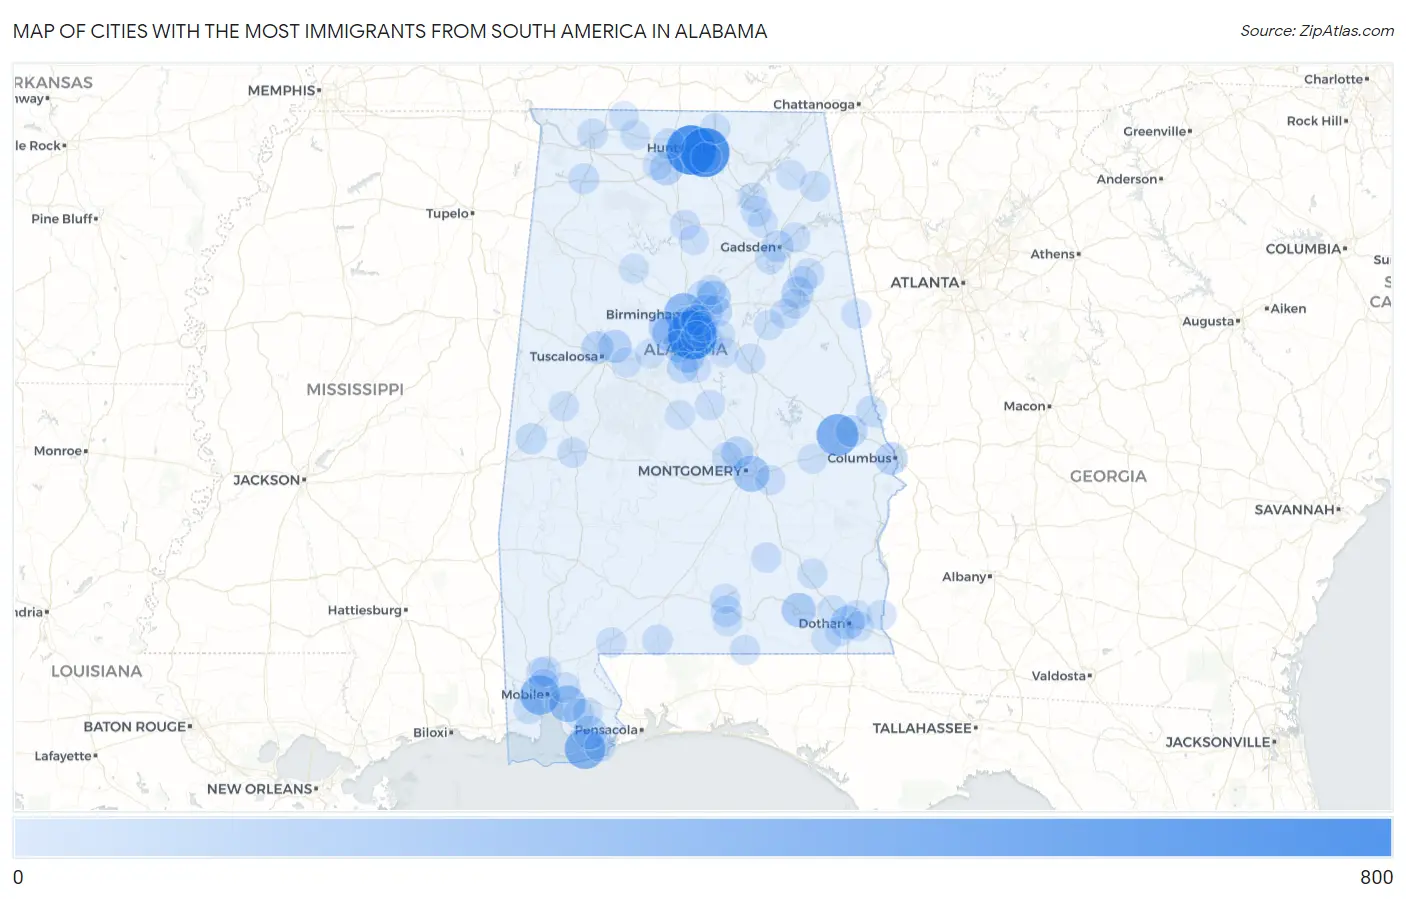
Map of Cities with the Most Immigrants from South America in Alabama
0
800
Cities with the Most Immigrants from South America in Alabama
| City | South America | vs State | vs National | |
| 1. | Madison | 702 | 8,347(8.41%)#1 | 3,636,375(0.02%)#684 |
| 2. | Huntsville | 683 | 8,347(8.18%)#2 | 3,636,375(0.02%)#702 |
| 3. | Hoover | 680 | 8,347(8.15%)#3 | 3,636,375(0.02%)#707 |
| 4. | Auburn | 413 | 8,347(4.95%)#4 | 3,636,375(0.01%)#1,054 |
| 5. | Gulf Shores | 369 | 8,347(4.42%)#5 | 3,636,375(0.01%)#1,148 |
| 6. | Mobile | 331 | 8,347(3.97%)#6 | 3,636,375(0.01%)#1,258 |
| 7. | Birmingham | 305 | 8,347(3.65%)#7 | 3,636,375(0.01%)#1,326 |
| 8. | Daphne | 225 | 8,347(2.70%)#8 | 3,636,375(0.01%)#1,640 |
| 9. | Montgomery | 213 | 8,347(2.55%)#9 | 3,636,375(0.01%)#1,701 |
| 10. | Bessemer | 183 | 8,347(2.19%)#10 | 3,636,375(0.01%)#1,856 |
| 11. | Alabaster | 168 | 8,347(2.01%)#11 | 3,636,375(0.00%)#1,953 |
| 12. | Enterprise | 150 | 8,347(1.80%)#12 | 3,636,375(0.00%)#2,072 |
| 13. | Pelham | 150 | 8,347(1.80%)#13 | 3,636,375(0.00%)#2,073 |
| 14. | Vestavia Hills | 133 | 8,347(1.59%)#14 | 3,636,375(0.00%)#2,235 |
| 15. | Dothan | 129 | 8,347(1.55%)#15 | 3,636,375(0.00%)#2,273 |
| 16. | Trussville | 129 | 8,347(1.55%)#16 | 3,636,375(0.00%)#2,275 |
| 17. | Foley | 120 | 8,347(1.44%)#17 | 3,636,375(0.00%)#2,382 |
| 18. | Irondale | 108 | 8,347(1.29%)#18 | 3,636,375(0.00%)#2,522 |
| 19. | Hueytown | 104 | 8,347(1.25%)#19 | 3,636,375(0.00%)#2,573 |
| 20. | Decatur | 103 | 8,347(1.23%)#20 | 3,636,375(0.00%)#2,581 |
| 21. | Tuscaloosa | 101 | 8,347(1.21%)#21 | 3,636,375(0.00%)#2,612 |
| 22. | Phenix City | 88 | 8,347(1.05%)#22 | 3,636,375(0.00%)#2,797 |
| 23. | Homewood | 86 | 8,347(1.03%)#23 | 3,636,375(0.00%)#2,825 |
| 24. | Northport | 84 | 8,347(1.01%)#24 | 3,636,375(0.00%)#2,862 |
| 25. | Helena | 77 | 8,347(0.92%)#25 | 3,636,375(0.00%)#2,967 |
| 26. | Millbrook | 71 | 8,347(0.85%)#26 | 3,636,375(0.00%)#3,113 |
| 27. | Opelika | 65 | 8,347(0.78%)#27 | 3,636,375(0.00%)#3,257 |
| 28. | Anniston | 65 | 8,347(0.78%)#28 | 3,636,375(0.00%)#3,259 |
| 29. | Gadsden | 57 | 8,347(0.68%)#29 | 3,636,375(0.00%)#3,463 |
| 30. | Leeds | 55 | 8,347(0.66%)#30 | 3,636,375(0.00%)#3,524 |
| 31. | Montevallo | 48 | 8,347(0.58%)#31 | 3,636,375(0.00%)#3,776 |
| 32. | Meadowbrook | 46 | 8,347(0.55%)#32 | 3,636,375(0.00%)#3,842 |
| 33. | Chelsea | 45 | 8,347(0.54%)#33 | 3,636,375(0.00%)#3,865 |
| 34. | Andalusia | 44 | 8,347(0.53%)#34 | 3,636,375(0.00%)#3,913 |
| 35. | Livingston | 43 | 8,347(0.52%)#35 | 3,636,375(0.00%)#3,966 |
| 36. | Athens | 38 | 8,347(0.46%)#36 | 3,636,375(0.00%)#4,136 |
| 37. | Prattville | 37 | 8,347(0.44%)#37 | 3,636,375(0.00%)#4,178 |
| 38. | Center Point | 37 | 8,347(0.44%)#38 | 3,636,375(0.00%)#4,183 |
| 39. | Valley | 37 | 8,347(0.44%)#39 | 3,636,375(0.00%)#4,188 |
| 40. | Orange Beach | 37 | 8,347(0.44%)#40 | 3,636,375(0.00%)#4,193 |
| 41. | Mountain Brook | 36 | 8,347(0.43%)#41 | 3,636,375(0.00%)#4,230 |
| 42. | Russellville | 30 | 8,347(0.36%)#42 | 3,636,375(0.00%)#4,544 |
| 43. | Brook Highland | 29 | 8,347(0.35%)#43 | 3,636,375(0.00%)#4,606 |
| 44. | Tillmans Corner | 27 | 8,347(0.32%)#44 | 3,636,375(0.00%)#4,725 |
| 45. | Brewton | 27 | 8,347(0.32%)#45 | 3,636,375(0.00%)#4,757 |
| 46. | Albertville | 26 | 8,347(0.31%)#46 | 3,636,375(0.00%)#4,793 |
| 47. | Spanish Fort | 26 | 8,347(0.31%)#47 | 3,636,375(0.00%)#4,803 |
| 48. | Fort Payne | 22 | 8,347(0.26%)#48 | 3,636,375(0.00%)#5,075 |
| 49. | Jacksonville | 22 | 8,347(0.26%)#49 | 3,636,375(0.00%)#5,076 |
| 50. | Meridianville | 22 | 8,347(0.26%)#50 | 3,636,375(0.00%)#5,090 |
| 51. | Rainbow City | 21 | 8,347(0.25%)#51 | 3,636,375(0.00%)#5,155 |
| 52. | Florence | 18 | 8,347(0.22%)#52 | 3,636,375(0.00%)#5,360 |
| 53. | Calera | 14 | 8,347(0.17%)#53 | 3,636,375(0.00%)#5,743 |
| 54. | Silverhill | 13 | 8,347(0.16%)#54 | 3,636,375(0.00%)#5,926 |
| 55. | Mignon | 13 | 8,347(0.16%)#55 | 3,636,375(0.00%)#5,927 |
| 56. | Satsuma | 12 | 8,347(0.14%)#56 | 3,636,375(0.00%)#5,978 |
| 57. | Westover | 12 | 8,347(0.14%)#57 | 3,636,375(0.00%)#6,028 |
| 58. | Cullman | 11 | 8,347(0.13%)#58 | 3,636,375(0.00%)#6,087 |
| 59. | Saraland | 11 | 8,347(0.13%)#59 | 3,636,375(0.00%)#6,090 |
| 60. | Indian Springs Village | 11 | 8,347(0.13%)#60 | 3,636,375(0.00%)#6,150 |
| 61. | Atmore | 10 | 8,347(0.12%)#61 | 3,636,375(0.00%)#6,230 |
| 62. | Demopolis | 10 | 8,347(0.12%)#62 | 3,636,375(0.00%)#6,235 |
| 63. | Coats Bend | 10 | 8,347(0.12%)#63 | 3,636,375(0.00%)#6,329 |
| 64. | Pike Road | 9 | 8,347(0.11%)#64 | 3,636,375(0.00%)#6,393 |
| 65. | Goshen | 9 | 8,347(0.11%)#65 | 3,636,375(0.00%)#6,508 |
| 66. | Kinsey | 8 | 8,347(0.10%)#66 | 3,636,375(0.00%)#6,589 |
| 67. | Talladega | 7 | 8,347(0.08%)#67 | 3,636,375(0.00%)#6,667 |
| 68. | Chickasaw | 7 | 8,347(0.08%)#68 | 3,636,375(0.00%)#6,706 |
| 69. | Weaver | 7 | 8,347(0.08%)#69 | 3,636,375(0.00%)#6,727 |
| 70. | Florala | 7 | 8,347(0.08%)#70 | 3,636,375(0.00%)#6,767 |
| 71. | Ariton | 7 | 8,347(0.08%)#71 | 3,636,375(0.00%)#6,804 |
| 72. | Clay | 6 | 8,347(0.07%)#72 | 3,636,375(0.00%)#6,842 |
| 73. | Clanton | 6 | 8,347(0.07%)#73 | 3,636,375(0.00%)#6,850 |
| 74. | Munford | 6 | 8,347(0.07%)#74 | 3,636,375(0.00%)#6,933 |
| 75. | Redstone Arsenal | 6 | 8,347(0.07%)#75 | 3,636,375(0.00%)#6,964 |
| 76. | Columbia | 6 | 8,347(0.07%)#76 | 3,636,375(0.00%)#6,973 |
| 77. | Jasper | 5 | 8,347(0.06%)#77 | 3,636,375(0.00%)#7,010 |
| 78. | Boaz | 5 | 8,347(0.06%)#78 | 3,636,375(0.00%)#7,019 |
| 79. | Gantt | 5 | 8,347(0.06%)#79 | 3,636,375(0.00%)#7,170 |
| 80. | Oxford | 4 | 8,347(0.05%)#80 | 3,636,375(0.00%)#7,182 |
| 81. | Robertsdale | 4 | 8,347(0.05%)#81 | 3,636,375(0.00%)#7,205 |
| 82. | Taylor | 4 | 8,347(0.05%)#82 | 3,636,375(0.00%)#7,233 |
| 83. | Trinity | 4 | 8,347(0.05%)#83 | 3,636,375(0.00%)#7,245 |
| 84. | Coaling | 4 | 8,347(0.05%)#84 | 3,636,375(0.00%)#7,257 |
| 85. | Cowarts | 4 | 8,347(0.05%)#85 | 3,636,375(0.00%)#7,261 |
| 86. | Woodstock | 4 | 8,347(0.05%)#86 | 3,636,375(0.00%)#7,308 |
| 87. | Pinckard | 4 | 8,347(0.05%)#87 | 3,636,375(0.00%)#7,353 |
| 88. | Ranburne | 4 | 8,347(0.05%)#88 | 3,636,375(0.00%)#7,371 |
| 89. | Slocomb | 3 | 8,347(0.04%)#89 | 3,636,375(0.00%)#7,463 |
| 90. | Rogersville | 3 | 8,347(0.04%)#90 | 3,636,375(0.00%)#7,496 |
| 91. | Powell | 3 | 8,347(0.04%)#91 | 3,636,375(0.00%)#7,524 |
| 92. | Tuskegee | 2 | 8,347(0.02%)#92 | 3,636,375(0.00%)#7,623 |
| 93. | Guntersville | 2 | 8,347(0.02%)#93 | 3,636,375(0.00%)#7,625 |
| 94. | Hanceville | 2 | 8,347(0.02%)#94 | 3,636,375(0.00%)#7,643 |
| 95. | Wilsonville | 2 | 8,347(0.02%)#95 | 3,636,375(0.00%)#7,659 |
| 96. | Eutaw | 1 | 8,347(0.01%)#96 | 3,636,375(0.00%)#7,878 |
| 97. | Maplesville | 1 | 8,347(0.01%)#97 | 3,636,375(0.00%)#7,921 |
| 98. | Lexington | 1 | 8,347(0.01%)#98 | 3,636,375(0.00%)#7,923 |
| 99. | Libertyville | 1 | 8,347(0.01%)#99 | 3,636,375(0.00%)#8,012 |
Common Questions
What are the Top 10 Cities with the Most Immigrants from South America in Alabama?
Top 10 Cities with the Most Immigrants from South America in Alabama are:
#1
702
#2
683
#3
680
#4
413
#5
369
#6
331
#7
305
#8
225
#9
213
#10
183
What city has the Most Immigrants from South America in Alabama?
Madison has the Most Immigrants from South America in Alabama with 702.
What is the Total Immigrants from South America in the State of Alabama?
Total Immigrants from South America in Alabama is 8,347.
What is the Total Immigrants from South America in the United States?
Total Immigrants from South America in the United States is 3,636,375.